1
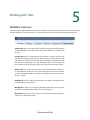
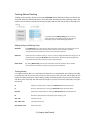
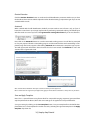
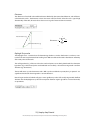
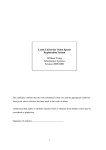
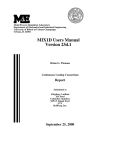
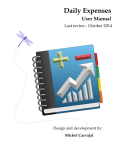
Tracking Tool™ PRO v2.0
User
manual
Introduction
Save hours using the new automated
Tracking Tool™ PRO software!
Tracking Tool™ PRO, the new automated tracking tool software developed by Gradientech, provides users with an
easy-to-use cell tracking and analysis software which can
advantageously be used together with our CellDirector
chemotaxis products.
Manually tracking large number of cells for long time periods can be very labor intense. The new features in Tracking
Tool™ PRO include automated detection and tracking of
cells which drastically reduces the analysis time with maintained high-quality accuracy and user control.
Microscope images collected during a chemotaxis experiment with CellDirector® 2D. The images are analysed using
the Tracking Tool™ PRO software.
User control of the analysis quality!
Tracking Tool™ PRO is an ideal software for automated
tracking of non-labeled cells imaged with e.g. bright-field
or phase contrast microscopy. This is due to initial state-ofthe-art noice reduction scripts, making the extraction of
cells in images with low contrast-to-noise ratio possible.
You will experience excellent automated tracking results of
your cells, even if the cells are clustered, appear or behave
differently. The automated tracking module creates tracks
by statistical means where contours and distances are important factors.
Results can be checked and changed manually after the automated processing to assure best quality possible!
Automated cell tracking of phase-contrast microscopy images. Tracking Tool™ PRO does not require fluorescently
labeled cells.
Easy and affordable automated tracking!
Tracking Tool™ PRO is a ticket-based analysis software,
which offers you an easy and affordable way to perform
automated live cell tracking. The user-friendly interface
help you assign parameters, detect and track cells automatically, get statistics and export final plots - all within a
stand-alone software.
Plot exported from Tracking Tool™ PRO showing cell tracks
from a CellDirector® 2D chemotaxis experiment.
Contents
Chapter 1
.
.
.
.
.
.
.
.
.
.
.
.
.
.
.
.
.
.
.
.
.
.
.
.
.
.
.
.
.
.
.
.
.
4
4
4
4
4
4
4
5
5
5
5
. .
. .
. .
. .
. .
. .
. .
. .
. .
. .
. .
. .
.
.
.
.
.
.
.
.
.
.
.
.
6
6
6
7
7
7
. .
. .
. .
. .
. .
. .
. .
. .
. .
. .
.
.
.
.
.
.
.
.
.
.
8
8
8
8
8
Chapter 5
Working with Tabs. . . . . . . . . . . . . . . . . . . . . . . . .
Workflow Overview. . . . . . . . . . . . . . . . . . . . . . . . .
9
9
Chapter 6
Quick Guide Automated Cell Tracking. . . . . . . . . . . . . . . . 10
Chapter 7
Step-by-Step Tutorial
.. . . . . . . . . . . . . . . . . . . . . . .
Tracking Tab. . . . . . . . . . . . . . . . . . . . . . . . . . . .
Frame Selection: Choose your Image Sequence����������
Image Settings: Adjust Brightness and Contrast����������
Tracking: Manual Tracking
.. . . . . . . . . . . . . . . . . . . .
Autotracking: Automated Tracking. . . . . . . . . . . . . . . . .
Settings Tab. . . . . . . . . . . . . . . . . . . . . . . . . . .
Data Settings: Statistical Input Parameters. . . . . . . . . . . . .
Track Selection: Exclude Tracks
.. . . . . . . . . . . . . . . . . .
Analysis Tab. . . . . . . . . . . . . . . . . . . . . . . . . . . .
Data Explanation
.. . . . . . . . . . . . . . . . . . . . . . . .
Export Statistical Data (Excel Installed). . . . . . . . . . . . . . .
Export Statistical Data (Excel Not Installed). . . . . . . . . . . . .
Plotting Tab. . . . . . . . . . . . . . . . . . . . . . . . . . . .
Axis Settings: Label and Scale Axis. . . . . . . . . . . . . . . . .
Track Colors: Visulise Track Directions
.. . . . . . . . . . . . . . .
Additional Info: Stylise your Plot. . . . . . . . . . . . . . . . . .
Export Plot: Save as A High Resolution Image. . . . . . . . . . . .
Merge Plots Tab
.. . . . . . . . . . . . . . . . . . . . . . . . . .
Merge Project Files: Add Projects to your Plot. . . . . . . . . . . .
Chapter 2
Chapter 3
Chapter 4
Installing Tracking Tool™ PRO. . . . . .
Hardware Requirements. . . . . . . .
Prepare for Installation
.. . . . . . . .
Configure Installation. . . . . . . . .
Uninstalling Gradientech Tracking Tool.
Installing Newer Versions. . . . . . .
For MAC Users. . . . . . . . . . . .
Technical Requirements
.. . . . . . . .
Image Requirements. . . . . . . . .
Internet Connection
.. . . . . . . . .
Graphics Card
.. . . . . . . . . . . .
. .
. .
. .
. .
. .
. .
. .
. .
. .
. .
. .
. .
. .
. .
. .
. .
. .
. .
. .
. .
. .
. .
.
.
.
.
.
.
.
.
.
.
.
.
.
.
.
.
.
.
.
.
.
.
.
.
.
.
.
.
.
. .
.
.
.
.
.
.
.
.
.
.
. . .
. . .
. . .
. . .
. . .
. . .
Managing Tracking Tool™ PRO Projects
..
Manage Projects. . . . . . . . . . .
Start a New Project. . . . . . . . . .
Open a Previous Project. . . . . . . .
Save a Project
.. . . . . . . . . . . .
.
.
.
.
.
.
.
.
.
.
.
.
.
.
.
.
.
.
.
. .
.
.
.
.
.
.
.
.
. . .
. . .
. . .
. . .
. . .
User Account. . . .
Log In. . . . . . .
Create Account. . .
My Account. . . .
Edit Account. . . .
Ticket System
.. . .
. .
. .
. .
. .
. .
. .
. .
. .
. .
. .
. .
. .
.
.
.
.
.
.
.
.
.
.
.
.
.
.
.
.
.
.
.
.
.
.
.
.
. .
. .
. .
. .
. .
. .
. .
. .
. .
. .
. .
.
.
.
.
.
.
.
.
.
.
.
.
.
.
.
.
.
.
.
.
.
.
.
.
.
.
.
.
.
.
.
.
.
.
.
.
.
.
.
.
.
.
.
.
.
.
.
.
.
.
.
.
.
.
.
.
.
.
.
.
.
.
.
.
.
.
11
11
11
12
13
14
17
17
19
20
20
23
23
24
24
25
25
26
27
27
Installing Tracking Tool™ PRO
Hardware Requirements
1
The following computer specifications are the minimum requirements the software is designed for:
Platform: Windows 7 and Windows 8
Minimum RAM: 3 GB
Minimum free space on hard drive: 400 MB
Minimum screen resolution: 1024 × 768 pixels
Prepare for Installation
If not previously installed, Microsoft’s .NET framework is required for the Tracking Tool™ PRO to run on your computer. Download the latest version of .NET at http://www.microsoft.com/net
Configure Installation
Install the Tracking Tool™ PRO software by double clicking the setup.msi file which will start the installation process. The installation requires administrator rights to initialise, and may take some time to display, depending on
the computer system.
Uninstalling Tracking Tool™ PRO
Uninstalling Tracking Tool™ PRO should be done through Windows Control Panel. Go to Control Panel ->
Programs -> Uninstall a program. Select Tracking Tool™ PRO v2.0 in the list, and click Uninstall.
Installing Newer Versions
To be sure of avoiding conflicting software double installations, first uninstall the older version of
Tracking Tool™ PRO as desrcibed above. After this is done, continue with installing the newer version.
For MAC Users
A windows emulator such as VMware Fusion or Parallels Desktop is required to run Tracking Tool™ PRO on Mac.
More info on emulators at www.macwindows.com
4 | Installation Overview
Technical Requirements
Image Requirements
2
Image format: TIF/TIFF, JPEG/JPG
Minimum no of frames per sequence: 5
Maximum no of frames per sequence: Unlimited
Color mode: Greyscale (8/16 bit)
Image sequence notation: The image sequence should contain a text string including a numerical sequence in
ascending order. The length of the numerical component needs to always have the same length, e.g. Image001,
Image002,...Image099, Image100
Internet Connection
Tracking Tool™ PRO requires internet connection when using features connected to your account (perform automated tracking, edit account information, order new tickets).
Graphics Card
The automated tracking process of Tracking Tool™ PRO can be accelerated by the computer’s graphics processing
unit (GPU). Supported GPUs are Nvidia’s graphics card from 2010 and later. Make sure to update your driver at
http://www. geforce.com
5 | Installation Overview
3
User Account
Log In
After successfully installing Tracking Tool™ PRO, start the program by clicking the Tracking Tool™ PRO v2.0 icon.
A pop up window will appear that will ask you to log in to your account with your username and password. If
you do not already have an account you can create one by clicking Create account. If you have forgotten your
password, click on the Recover password option.
Note: Automated tracking will only be available once you
have signed in to your account!
Create Account
To access all the new features in Tracking Tool™ PRO, you will need assign your account with a username and
password. Click on Create account and enter the information that is required. The username should be the same
as your email address.
Note: Only professional emails are allowed as user name.
6 | User Account
My Account
My account is a new tab in Tracking Tool™ PRO. In My account tab you can view and edit your account information,
order tickets to access automated tracking and view your ticket purchase log.
Edit Account Information
By clicking Edit account information you are able to change your personal settings such as User name, Password,
Name, Company and Phone number.
Ticket System
Automated tracking is one of the new great features in Tracking Tool™ PRO that will save you significant amount
of time tracking your cells. To access automated traking you will need tickets. To order tickets, click on Get more
tickets and a pop-up window will appear where you will be able to choose between 10 or 50 tickets. The sales
team of Gradientech will handle your order and assign your account with the requested tickets.
7 | User Account
Managing Tracking Tool™ PRO Projects
Manage Projects
4
Tracking Tool™ PRO was designed to be flexible and to have an easy-to-use workflow. To enable this, Gradientech
created the .gtt file format, containing all the information from previous work.
Start a New Project
When clicking the New project icon, you will be asked to save or reject the ongoing project before starting a new
project.
Open a Previous Project
By clicking the Open project icon, you will first be prompted to save the ongoing project. Thereafter navigate in
the Explorer window and choose which project to open.
Note: If the image sequence has been relocated on your computer you will be
asked to designate the new file path. Navigate to the new folder and doubleclick on one of the frames within the sequence.
Save Projects
Click on the Save project icon to save your current work. Be sure to save your work often to prevent lost work in
case of a crashed computer.
8 | Managing Tracking Tool PRO™ Projects
5
Working with Tabs
Workflow Overview
The Tracking Tool™ PRO workflow is designed to be intuitive, and the tab system should be used in an left-to-right
manner. However, you can always return to a previous tab if you wish to correct or complete previous work.
Tracking tab: This is your startup tab. Here the image sequence will be imported and handled. This is also the section where all the detection and tracking will
be done.
Settings tab: Here you assign the data set parameters so that you get accurate
statistical information and plots in later tabs. Here you get the option to rotate
your images to correct for unintended rotation during the experimental setup.
You will also be prompted to provide information such as frame speed and
µm-to-pixel ratio of your images, which is important for the statistical analysis.
Analysis tab: The analysis tab will present useful statitics from the selected areas of tracked cells. In this tab you also have the option to export your statistics
as external spreadsheet files: to .xls if Excel is installed on your computer, otherwise as a .csv file.
Plotting tab: Here you will be given the option to stylize and export the plot
containing the generated tracks.
Merge Plots: In this tab you are able to add other project files (.gtt) to your plot.
Tracks from all added projects will be seen in one single plot.
My Account: Here you are able to edit your account information, order tickets
and view your ticket purchase log.
9 | Working with Tabs
Quick Guide Automated Cell Tracking
1.
6
Create an account
2.Sign in
3.
In the My account tab; click on Get more tickets
4.
In the Tracking tab; import your image sequence (.tif/.tiff/.jpg/.jpe), select frame range and click on Apply selection
5.Adjust Cell radius, Cut-off threshold, Background threshold and click on Preview detection. Repeat until satisfied
6. Click on Autotrack
7.
In the Settings tab; Specify the μm-to-pixel ratio and the Time be-
tween frames (min). Click on Apply changes
8. Statistical data of the tracks can be seen in the Analysis tab
9. Stylise and export the plot in the Plotting tab
10 | Quick Guide Automated Cell Tracking
Step-by-Step Tutorial
Tracking Tab
7
Tracking Tool™ PRO offers you a fast and easy way to track your cells. Save up to hours using automated tracking
compared to manual tracking, with maintained high-quality accuracy and user control. This section provides instructions and tips of how to get the best tracking result.
Get a closer look at your cells by using the zoom function. Zoom by moving the slider located by the upper-left
corner of the frame. Press the Reset button to un-zoom the image to the default position.
Frame Selection: Choose your Image Sequence
The first panel you will encounter in the Tracking tab is the Frame selection panel. Here you choose your
image sequence and which frame range to analyse. Finalise your frame selection by clicking on the Apply selection button.
11 | Step-by-Step Tutorial
Importing Frames
This is where you choose which image sequence to analyse. Click on Import frames, navigate to your
image sequence folder in the Explorer window. By clicking on a single image file (.tif/.tiff/.jpeg/.jpg) you
will import the entire sequence of images. You do not need to select all the images in the same sequence
to have them imported.
Euclidan Track Definition
Note: Only for manual tracking!
If you are only interested of analysing the start- and end position of the cells, check the Euclidian track
tickbox. After clicking on a cell’s starting point, the slider will jump to the end of the sequence where you
mark the cell’s endpoint. To assure that the end point belong to the correct cell, move the slider manually
to follow the cell until its endpoint.
Figure showing the difference between
Accumulated path (green line) and
Euclidian path (dotted black line)
Selecting Frame Range
By setting the frame range, you can exclude parts of your sequence that you wish not to track.
From: Choose the starting frame. This will become frame number 1 in the frame slider control.
All frames before this number will be ignored.
To: Choose the ending frame. All frames after this number will be ignored.
Step: Choose a value of skipped frames. A step-value of 2 for example, will select every second frame between the first and last selected frame.
Image Settings: Adjust Brightness and Contrast
You can optimise the contrast and brightness of your image sequence by moving the sliders in the Image settings panel. Changing the contrast or brightness will not influence the quality of the automated
tracking.
12 | Step-by-Step Tutorial
Tracking: Manual Tracking
Tracking a cell manually is done by pressing the Add track button, followed by clicking on the cell. For
every click, the frame slider will advance as set by the earlier described step value. Selecting tracks in the
track list can be made by using left mouse button together with the Shift and Ctrl keys on the keyboard.
Screenshot of the Tracking settings panel. In this example, tracks were selected by clicking on Track 4, then
left clicking on Track 7 while holding the Shift key.
Adding, Ending and Deleting Tracks
Add track:
Click Add track to start a manual track. Hover the mouse cursor over the cell you wish to track and left click. After every click, the frame slider advances to the next frame. Continue clicking until you wish to end your track or have reached the last frame.
End track: If you wish not to continue tracking a cell, or if a cell has disappeared from the image, you can
end the track by clicking the End track button.The position data from the prematurely ended track will be included in the statistical analysis and the final plot.
Delete track: By clicking Delete track, you erase the selected track and all its position data. A deleted track will not be included in the statistical analysis and in the final plot.
Tracking Hotkeys
It is highly recommended to use the keyboard hotkeys that are implemented into Tracking Tool™ PRO,
in combination with the mouse. Use one hand on the mouse to point at the cell, and the other for the
hotkeys for adding track points, and for adding, ending and deleting tracks. In this way you can track your
cells faster, more accurately and with much less fatigue to your hand and wrist, compared to using the
mouse only.
A: Add track, same function as clicking the Add track button described above.
E: End track, same function as clicking the End track button described above.
D or Del: Delete track, same function as clicking the Delete track button desribed above.
N: Next frame, same function as left clicking when tracking a cell.
Ctrl + Tab
Switch to next tab.
Ctrl + Shift + Tab
Switch to previous tab.
Ctrl + Mouse scroll
Zoom in on frame.
13 | Step-by-Step Tutorial
Showing Paths and Labels
Show path: By checking the Show path box, you will see a blue path for all the selected tracks in the track list.
Show labels: By checking the Show labels box, a label will be displayed at the start point of all tracks.
Autotracking: Automated Tracking
In the autotracking panel you can perform automated tracking of cells and save you hours of work. Set
the cell diameter, adjust and optimise parameters to assure best quality result. Single tracks created by
the automated tracking feature can be removed manually. You can also add tracks manually to complement your list of automated tracks.
Automated tracking is available when you have tickets on your account. You can re-analyse an image
sequence repeatedly once you have assigned a ticket for its project file (.gtt) .
Cell Diameter
Determining the cell diameter is the first setting you will encounter in the Autotracking panel. Click on
the DIA from image button and select a typical cell in the image by left-clicking with the mouse in the
centre of the cell. A green contour will appear. Drag the mouse to expand/contract the contour. When the
contour encircle the entire cell you have set the cell diameter.
14 | Step-by-Step Tutorial
Advanced Settings
The Advanced option includes settings that are predefined. Adjust these to your data set to get the most
accurate automated tracking result for your particular image sequence.
The Cut-off threshold is a setting that includes various cell recognition criterias. A higher value will induce
more strict criteria, hence, fewer cells will be recognised by the software. The predefined Cut-off threshold
is 58%. Drag the slider, then click the Preview detection button (make sure to have the checkbox Show
contours ticked) and view the contours that appears around the cells. Use the cut-off threshold that identifies as many cells as possible without detecting to much of the “background noise”.
Automated cell tracking of e.g. bright-field and phase-contrast microscopy images is possible using
Tracking Tool™ PRO and the software does not require images containing fluorescently labeled cells.
In some image sequences it might be difficult to distinguish between cells and background. Use the
Background threshold slider to separate cells from background. Click the Preview background removal
button to view the background removal.
15 | Step-by-Step Tutorial
Preview Detection
Click the Preview detection button to evaluate the cell identification parameters. Make sure you have
the checkbox Show contours ticked. Adjust the earlier described settings and preview again if you are not
satisfied with the result.
Autotrack
When satisfied with the cell identification, decide if you want tracks to start in frame 1 only, or if you allow tracks to start later in your image sequence when performing automated tracking. The default input
will allow tracks to start in any frame. Click Ignore tracks starting after frame 1 if you do not allow this.
Now, click on the Autotrack button to start the automated tracking process. You will first be prompted
to save your project. Follow the autotracking progress and the estimated time until autotracking is complete through the bar that appears after clicking Autotrack. Once Autotrack is complete a pop-up window will appear with information about the tracks that has been created. Click Continue to access the
statistical data of generated tracks.
Note: A ticket will be withdrawn from your account first when you have approved.
Once a ticket has been asigned to your project file (.gtt) you will be able to autotrack it as many times as you desire.
Save and Apply Templates
Note: This is a powerful time-saving feature ideal for comparable imaging sequences (generated from
equal experimental conditions) where the same settings can be applied and analysed thereafter.
Save your settings by clicking on the Save template button. Save your template file in the default Template folder. Use a saved template for another data set by selecting the approriate template in the Apply
template: drop-down list.
16 | Step-by-Step Tutorial
Settings Tab
In the Settings tab, values will be set for Tracking Tool™ PRO to calculate precise statistical data and to export accurate plots.
Screenshot of the Settings tab: The rectangle selection tool is seen here, s electing an area of tracked cells to be used in
later data analysis and plotting. In this example, the area in the middle has been selected (track labels are shown in green).
Data Settings: Statistical Input Parameters
Rotating Image Data Set
If your image sequence was unintentionally rotated during the experimental set up, you are able to correct this here. Move the slider until, for example, the middle line or a channel wall in the gradient channel
lines up to the background grid. You can either drag the slider with the mouse, or use the left or right arrow key on the keybord for fine adjustments.
17 | Step-by-Step Tutorial
µm-to-pixel Ratio
Microscopes will output images with different µm-to-pixel ratios depending on the microscope, sensor
and objective used. Determining the µm-to-pixel value of your microscope-objective combination is important to get correct statistical values and plots.
Below, you will find a method for determining this ratio when using CellDirector® 2D. Once determined
you can re-use the µm-to-pixel value when analysing image sequences captured with the same microscope
objective combination.
1.Rotate the image so that it is correctly aligned to the background grid.
2.Click “Get from image”.
3.Click on the start point, drag to the end point of measure and release the mouse button.
4.In the pop-up window, enter the real distance of your object in µm. Finally click “OK”.
Here, the calibration line has been clicked and
dragged from one of the walls in the control
channel to the other.
After the end point has been selected, a pop-up
window shows up asking for the real distance in
µm. A value of 500 µm is assigned, which is the
width of the control channel.
C: 500 µm
A: 1000 µm
B: 500 µm
Useful calibration dimensions in CellDirector ® 2D:
A: The gradient channel is 1000 µm wide
B: The control channels are 500 µm wide
C: The distance between the ruler marks is 500 µm. Also, the roman numbers are 500 µm in height.
18 | Step-by-Step Tutorial
Frame Speed
This is the time between frames within the image sequence. For example, enter a value of 5 if the images
were recorded every fifth minute.
Note: If you have chosen another step value than 1 when importing the image sequence, multiply your
original frame speed value with the step value. If you have chosen Euclidian distance, multiply the original
frame speed value with the number of frames.
Apply and Change Settings
By clicking the Apply settings button you accept the settings and values entered in the Data settings
panel. You need to click this button in order to continue. If you thereafter wish to change the entered settings and values in the Data settings panel, click the Change settings button.
Track Selection: Exclude Tracks
The Track selection panel gives you the option to choose tracks in a specific region of interest. Click the
Rectangle drawing tool button, left click and draw a rectangle over the region you are interested in.
If you wish to exclude tracks of cells that have migrated short distances, enter the value and click the
Exclude button. These tracks will not be included in the statistical analysis or plot.
Screenshot of a selected region
of interest to be used for data
analysis and plots.
19 | Step-by-Step Tutorial
Analysis Tab
The Analysis tab will provide statistical data from the selected area of tracked cells. In this tab you also have the
option to export your statistics as external spreadsheet files: to .xls if Excel is installed on your computer, otherwise as a .csv file.
Data Explanation
Migration Directions
This chart shows the number and percentage of cell migrating either to the left or right (-x and +x) and
down or up (-y and +y).
Migration Distances
Euclidian distance (de,i )
Accumulated distance da,i: The accumulated distance is the total length of the track in µm.
Euclidian distance de,i: The euclidian distance is the distance between the track start- and end point in µm.
20 | Step-by-Step Tutorial
Accumulated distance ( da,i )
Velocity
Velocity [µm/min]: The mean migration velocity of all selected tracks in µm/min.
Centre of Mass and Forward Migration Index
Centre of mass [µm]: The centre of mass is the mean end point value of the tracked cells.
Forward migration index: The forward migration index is the directness (see below) in the x- and
y-axis direction. For example, in an experiment where many cells show
𝑛𝑛𝑛𝑛
strong migration towards or away from a chemoattractant
in the x-di1 -1 or
de,i1.
rection, the FMIx value will converge towards
Directness =
𝑛𝑛𝑛𝑛
x endpoint
𝑛𝑛𝑛𝑛
�
𝑖𝑖𝑖𝑖=1
da,i
yend point ,i
1
FMIy = �
da,i
𝑛𝑛𝑛𝑛
𝑖𝑖𝑖𝑖=1
Accumulated distance (d a)
FMIx =
yendpoint
21 | Step-by-Step Tutorial
𝑛𝑛𝑛𝑛
xend point ,i
1
�
da,i
𝑛𝑛𝑛𝑛
𝑖𝑖𝑖𝑖=1
Euclidian distance (de )
Accumul
Directness
The directness of each cell is the euclidian distance divided by the accumulated distance, and will have a
value between 0 and 1. The directness value is the mean value for all cells. Values close to 1 signals high
directionality of the cells, whereas values close to 0 is a signal of more random movements.
𝑛𝑛𝑛𝑛
Euclidian distance (de )
Accumulated distance (d a)
Rayleight Test p-value
de,i
1
Directness = �
da,i
𝑛𝑛𝑛𝑛
FMIy =
𝑛𝑛𝑛𝑛
𝑖𝑖𝑖𝑖=1
yend point ,i
1
�
da,i
𝑛𝑛𝑛𝑛
𝑖𝑖𝑖𝑖=1
𝑛𝑛𝑛𝑛
The Rayleigh test is a statistical test for determining whether a 1circularxdistribution
is random or nonend point ,i
FMI
=
�
random. The test is implemented into Tracking Tool™ PRO to xcalculate
da,i distribution uniformity
𝑛𝑛𝑛𝑛 the circular
of the end points of the tracks.
𝑖𝑖𝑖𝑖=1
The null hypothesis (H0) of the test is that the track end points are randomly distributed. The alternative
hypothesis (H1) is that the end points are distributed non-randomly – the cells have migrated in a uniform
direction (e.g. chemotaxis)
The test will return a p-value between 0 and 1. With a p-value smaller than p=0.05, the H0 is rejected – it is
significant that the cells have migrated in a certain direction*.
Note: A larger number of tracked cells give a more significant p-value. Cells usually migrate with the flow
direction. Use the Rayleight test p-value for comparison between regions (gradient- or control channels)
or experiment.
22 | Step-by-Step Tutorial
*N.I.Fischer (1993). Statistical analysis if circular data. Cambridge university Press.
Export Statistical Data (Excel Installed)
Click the Export to spreadsheet button to export your analysis data as an .xls file if Excel is installed on
your computer.
Export Statistical Data (Excel not Installed)
If Excel is not installed on the computer, you can still export your data as a spreadsheet file. The data will
be exported as a .csv file.
23 | Step-by-Step Tutorial
Plotting Tab
In the Plotting tab, the style and information of your plot can be set, and high resolution images can be exported as .tiff or .jpeg files.
Screenshot of the Plotting tab: The final plot is shown on the right hand side. The Axis settings, Track colors and Additional
info panels are shown at the left hand side. The Export plot button, unique for the Plotting tab, is shown at the bottom
within the Project management panel.
Axis Settings: Label and Scale Axis
Label Axis
To rename your axis, type in the desired text, and click on another text form or radio button to allow the
changes to take effect.
24 | Step-by-Step Tutorial
Scale Axis
Change the max, min and interval values for each axis to scale them. If you have entered values which are
too great or small and cannot find the tracks, click the Default values button to go back to the original
settings. Your values will remain unchanged when switching tabs. However, if you change the data settings in the Settings tab, the plot axis scaling will now be automatically re-calculated.
Track Colors: Visualise Track Directions
The Track colors panel include settings for you to colorise and differentiate between tracks of cells that
have migrated Left/Right or Up/down.
Additional Info: Stylise your Plot
Centre of mass:
The Centre of mass (COM) checkbox toggles the visibility of the COM
point in the plot.
Endpoint size:
The Endpoint size allows for changing the size, where the size of 1 is as
large as the cell track path lines.
Color of centre of mass:
Color of centre of mass allows for changing the color appearence of it.
As with the Track color panel, you can simply type the first letters of the
name of the color to faster access your color.
Show number of cells:
Clicking the Show number of cells check box toggles the visibility of the
number of cells migration information.
Show % of cells migrating:
Clicking the Show % of cells migrating option buttons toggles the visibility of the percentage of cells migration information.
Font:
The Font drop-down list allows for changing the font to one of six common fonts.
25 | Step-by-Step Tutorial
Export Plot: Save as A High Resolution Image
Click the Export plot button in the project management panel and export your stylised plot, either as
an uncompressed .tiff or as a .jpeg file, both in a format of 5729 × 5729 pixels.
26 | Step-by-Step Tutorial
Merge Plots Tab
In the Merge plot tab it is possible to add tracks from multiple projects and merge them into a single plot. The
tab includes the same settings as the Plotting tab with exception that statistical data cannot be visualised in this
plot.
Merge Project files: Add Projects to your Plot
Create a merged plot by adding other project files (.gtt) to the plot of your current project. Click on Add,
then navigate to the folder where the .gtt file is located. Click OK. You are able to add up to four .gtt files.
In the Merge plots tab you are able to export your merged plot to an image in the same way as desribed
earlier in the Plotting tab section.
27 | Step-by-Step Tutorial
Tracking Tool™ PRO software was developed together with High Performance Consulting (www.hpcsweden.se) based
on specifications by Gradientech AB.
Gradientech AB | Uppsala Science Park, SE-751 83 Uppsala, Sweden | Phone +46-18-418 67 00 | www.gradientech.se | [email protected]
2015-10-23