1
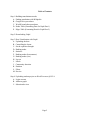
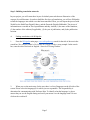
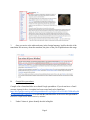
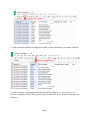
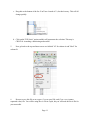
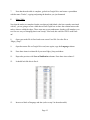
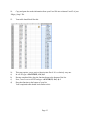
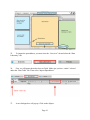
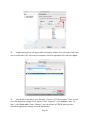
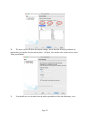
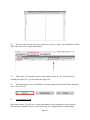
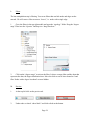
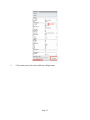
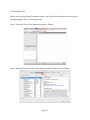
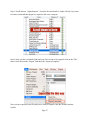
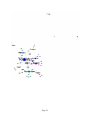
WorldLiterature@UCLA USER MANUAL Prepared in collaboration by Nick de Carlo, David Kim, Wendy Kurtz, and Harry Xie Page 1 Table of Contents Step 1: Building translation networks A. Finding translations with Wikipedia B. Google Drive procedures C. WorldCat and other procedures D. Nodes Table (Formatting Data for Gephi Part 1) E. Edges Table (Formatting Data for Gephi Part 2) Step 2: Downloading Gephi Step 3: Data Visualization with Gephi A. Uploading the data B. Controlling the layout C. Set the repulsion strength D. Ranking nodes E. Statistics F. Ranking nodes (betweenness) G. Ranking nodes (size) H. Layout I. Labels J. Community detection K. Partition L. Filters M. Preview Step 4: Uploading student project on WorldLiterature@UCLA A. Login account B. Add new graph C. Submit and review Page 2 Step 1: Building translation networks In your project, you will create three layers of scholarly networks that are illustrative of the concept of world literature. In order to build the first layer of translations, you will use Wikipedia to find the languages into which a text has been translated. Then, you will repeat the process with WorldCat, the HathiTrust Digital Library, and the Deutsche Digitale Bibliothek. The pieces of information are recorded on Excel spreadsheets and they include (1) the name of the translator, (2) the number of the edition (if applicable), (3) the year of publication, and (4) the publication location. A. Finding translations with Wikipedia 1. From the Wikipedia main page, www.wikipedia.org , search for the title of the text in the search bar. We will use Goethe’s Die Leiden des jungen Werthers as an example. In the search bar, enter the title of the book in English: “Sorrows of Young Werther.” 2. When you see the main entry for the text, there is a list of languages on the left side of the screen. Please select the language(s) for which you are responsible. This responsibility is determined in communication with Professor Kim. To identify what the language is, please ensure that you use the English listing and scroll your mouse over the language name. Do not click on the word itself. Page 3 3. Once you arrive at the redirected entry in the foreign language, look for the title of the translation. Do not worry about the translator, the place or the year of publication at this stage. B. Google Drive procedures Compile a list of translated titles on a shared Google spreadsheet. If you do not have a Gmail account, sign up for free. A template has been created and can be found here: https://docs.google.com/a/g.ucla.edu/spreadsheets/d/1wg6YQQcVrWwVBVdDLTliEKrhffaydM yLX4K9a0QG6Ws/edit#gid=0 . You will add the translated titles of the text to this spreadsheet. Please be careful not to delete entries by mistake! 1. Under Column A, please identify the title in English. Page 4 2. Under Column B, identify the language for which you are responsible. For example, Spanish. 3. Under Column C, copy and paste the title in the foreign language, i.e., La cuitas de joven Werther (in Spanish), I dolori del giovane Werther (in Italian) or Noore Wertheri kannatused (in Estonian). Page 5 4. If there are multiple variations of the translation, enter them separately as subsequent entries on the spreadsheet. Add a row for each variation. Page 6 C. WorldCat and other procedures WorldCat, the HathiTrust Digital Library ( http://www.hathitrust.org/ ), and the Deutsche Digitale Bibliothek ( https://www.deutschedigitalebibliothek.de/ ) will help generate a more detailed picture of the translations. You will search for more information about the translations in each language and include that information in the Google spreadsheet. 1. Locate the WorldCat database through the UCLA library online portal or go directly to http://ucla.worldcat.org/ . Select WorldCat (OCLC First Search) link on the list. In order to connect to the UCLA network in order to access WorldCat, you must be connected to the campus wifi or through a proxy server (or VPN) from offcampus. You can find information about connecting to the library network from off campus here: http://www.library.ucla.edu/use/computerscomputingservices/connectcampus 2. Change drop down menu to “Libraries Worldwide.” Use “Basic Search” for the following steps. 3. From the spreadsheet with the title names, choose the target language. Copy and paste that title into the search bar. 4. When you are on the WorldCat site, for the first entry find the title with “by Wolfgang Goethe” and click on “View all formats and languages.” Please ignore, subsequent entries. Page 7 5. From that click, extract as many of the following detail as you can in the following categories: a. translator’s name b. publication location c. year of publication d. the number of edition (if applicable) If you are unable to find this information, please ask Professor Kim about making use of the HathiTrust Digital Library and the Deutsche Digitale Bibliothek. Page 8 6. For each unique translation, add a new row and enter the appropriate information on the Google Spreadsheet. Before working with Gephi, we need to create two comma separated value files (CSV) in Excel. 1. Nodes : individual, unique data points 2. Edges : relationship between nodes D. Nodes Table You will first create a table of all of the individual unique data values (nodes). How they are related to each other is of no consequence here. What you are looking for are unique values. 1. Take all of the items on the Google Drive sheet under the language and the year of publication columns. 2. Open Excel and copy and paste these values in Column B, not A. Page 9 3. Notice the many duplicates! We need to delete them. Removing duplicates is easy: Highlight column B and, under the "Data" tab, click on "Remove Duplicates" 4. With the duplicates gone, you should have unique values, these are your "nodes." a. Once those are in, enumerate column A. To enumerate quickly on Excel, type "1" in the first cell, click on the bottom right corner (arrow). b. Once you've clicked there, hold it down and you'll see it change shape. It goes from a cross to a square with triangle corners in the upper left and lower right corners. Page 10 c. Drag this to the bottom of the list. You'll see a bunch of 1's, but don't worry. This will all change quickly. d. Click on the "Fill Series" option and this will enumerate the selection. This step is CRUCIAL in making a functioning nodes table! 5. Now go back to the top and insert a new row labeled "id" for column A and "label" for column B. 6. Be sure to save this file as two types: (1) as an excel file, and (2) as a csv (comma separated value) file. You will be using the csv file in Gephi, but you will need the Excel file for your next table. Page 11 7. Now that the node table is complete, go back to Google Drive and create a spreadsheet with the name "Nodes", copying and pasting the data here you just formatted. E. Edges Table Now that the nodes are completed (make sure that each individual value has a number associated with it!), you are going to create a table that will tell Gephi how to show the relation between the nodes, what are called the edges. These steps may seem cumbersome, but they will introduce you to a few new ways of changing data in one swoop. Take heed, this could be VERY useful later on! 8. Open your nodes file in Excel and create a new Excel file. Save the file as “Edges_Setup”. 9. Open the master file on Google Drive and, once again, copy the Language column. 10. Paste these items in column B of your new Edges_Setup worksheet. 11. Repeat the previous with Year of Publication columns. Paste these into column C. 12. It should look like this in Excel. 13. Insert row labels of language and date (refer to step 5 in the nodes table) Page 12 14. Copy and paste the nodes information from your Excel file into columns F and G of your “Edges_Setup” file. 15. Your table should look like this: 16. a) b) c) d) This step requires you to put in a function into Excel. It’s a relatively easy one. In cell A2 type: =MATCH(B2, G:G, 0)1 Having completed this, drag the function down to the bottom of the list. Now, move over to cell D2 and type: =MATCH(C2, G:G, 0)1 Drag that function to the bottom of your list. Your completed table should look similar to this: Page 13 17. This step is crucial in creating a functioning edges tab. Now, copy column A and use special paste (right click and choose the option). When pasting, be sure to click on “Values”. These values go into column I, starting at I2 , not I1 ! Once you’ve pasted, type “source” into I1 18. Now, repeat the process in step 6 for column D. Special paste this data into column J, starting at J2. 19. Once done, label J1 “target.” Page 14 20. Columns I and J should now appear like this: 9. This is your final step: Create a new spreadsheet, leaving Edges_Setup open. Save this new spreadsheet as “Edges”. Make both an Excel file and a CSV. The CSV file is what you will need for Gephi. Copy and paste columns I and J into A and B of your new spreadsheet. Save your file, and you’re done! Congratulations! You have completed your nodes and edges tables. You should now have two files you will need for Gephi: 1. nodes.csv 2. edges.csv The next steps will help you get this data into Gephi for your data visualization. We’re on the home stretch, so keep with it! Page 15 Step 2: Downloading Gephi Gephi is an interactive visualization and exploration platform for all kinds of networks and complex systems, dynamic and hierarchical graphs. It runs on Windows, Linux and Mac OS X. Gephi is opensource and free. PLEASE NOTE: You can always use the laptops in the Rolfe Computing Lab to work on your Gephi projects. They have all the appropriate software installed. Alternately, you can work on your personal machines, but you will have to downgrade your Java version to Java 6, which can cause some security vulnerabilities. Accessing Gephi 1. Download the software directly to your computer by going to the Gephi website ( https://gephi.github.io/ ). You must download version 0.8.1, rather than the most current version (0.8.2). The following link will direct you to the download page for previous versions of Gephi: https://launchpad.net/gephi/+download . 2. You must scroll down to find version “0.8.1 beta release.” Once you have located the correct version, find the package for your operating system (i.e. Windows or Mac). 3. Download the file that corresponds with your operating system (i.e. Windows or Mac) and install it on your computer. 4. You must have Java version 6 installed on your computer in order to run Gephi. More recent versions of Java will not allow the program to open. Page 16 5. To see which version of Java is installed on your machine, follow the steps on this page to pertain to your operating system: https://www.java.com/en/download/help/version_manual.xml . Page 17 Step 3: Data Visualization with Gephi A. Uploading the Data Once each group’s nodes and edges sheets have been combined into master nodes and edges sheets, a master node and a master edge CSV will be uploaded onto the course’s CCLE site. 21. Download the CSV files that have been uploaded to the course site and save them to your computer. 22. Next, open Gephi on your computer. 23. You will be greeted with a “welcome” screen when launching the program. 24. If it is your first time opening Gephi, the program will open to the Overview tab. Below is a view of the Gephi interface from the Overview tab: Page 18 25. To import the spreadsheets, you must leave the “Overview” tab and select the “Data Laboratory” tab. 26. First, we will import the nodes sheet to Gephi. Make sure you have “nodes” selected under the “Data Table” tab. Then select “Import Spreadsheet.” 27. A new dialogue box will pop up. Click on the ellipses. Page 19 28. Another dialogue box will appear after selecting the ellipses. You will need to find where you saved the nodes CSV sheet on your computer. Select the appropriate file, and select Open . 29. You should see the path to your file under “Choose a CSV file to import.” Next, we will select the appropriate settings for the import. Under “Separator,” select Comma . Under “As table,” select Nodes table . Under “Chartset,” leave the default of UTF8 . When you have selected the appropriate settings, select the Next button. Page 20 30. The next screen will show the import settings. Ensure that the following columns are imported by leaving the check marks in place: “id, label, force nodes to be created as new ones.” Then press Finish . 31. You should now see the data from the nodes spreadsheet in the data laboratory view: Page 21 32. Next we will import the edge sheet, make sure you have “edges” selected under the “Data Table” tab. Then select “Import Spreadsheet.” 33. follow steps 710 from this section of the manual (section IV, A), except instead of selecting the nodes CSV, you will import the edges CSV. 34. After importing your two spreadsheets, you must change tabs from the “Data Laboratory” to the “Overview tab.” D. Controlling the layout In the main window, you will see a visual representation of the connections in your network. Node position is random at first, so each of you may see a slightly different representation. Page 22 Layout algorithms set the graph shape and is the most essential action in formatting your graph. The purpose of layout properties is to let you control the algorithm in order to make a readable representation of your data. Force Atlas makes the connected nodes attracted to each other and pushes the unconnected nodes apart to create clusters of connections. 1. Locate the layout module on the left panel and choose “Force Atlas.” Page 23 2. E. You can see the layout properties above. Click on run , then stop . Set the repulsion strength The repulsion strength setting represents how strongly each node rejects others. 1. Set the repulsion strength at 10,000 to expand the graph. 2. Click enter to validate the value. 3. Click stop when it seems as if you have some different clusters. 4. You can play around with higher and lower strengths to see how it affects the node layout. Your graph has now begun to take shape and show appear in a more organized manner: Page 24 F. Ranking Nodes The ranking module lets you configure node’s color and size. 1. Ranking Nodes by Degree: Ranking nodes by degree ranks them according to the number of connections they have within the network. a) Choose the ranking tab in the top left module. b) Ensure that the “nodes” tab is selected. c) d) Choose Degree from the menu. Click on apply . 2. Ranking Nodes by Color: Page 25 a) Hover your mouse over the gradient bar then double click on each triangle. b) Try to use a bright color for the highest degree so it’s easy to see who’s the most connected. c) Click on apply 3. Ranking Results Table You can see rank values by enabling the result table. a) Click the table icon in the bottom left of the ranking tab. b) Click apply G. Statistics We will calculate the average path length for the network. This statistic computes the path length for all possibles pairs of nodes and gives information about how nodes are close from each other. Page 26 1. 2. 3. Click the statistics tab in the top right module. Click run next to average path length . Select Undirected , click the checkbox to “normalize centralities” and click ok . 4. When finished the metric displays its results in a report like this (betweenness, closeness and eccentricity): Page 27 H. Ranking nodes (betweenness) Running statistics generates general reports like the one above, but it also generates new results for each node. Thus, three new values have been created by the “Average Path Length” algorithm we ran: Betweenness Centrality, Closeness Centrality, and Eccentricity. In section D1 above, we ranked nodes by degree, which ranks according to the number of connections. Betweenness centrality takes a node's position within the network into account. 1. Return to ranking in the top left module and choose a rank parameter from the dropdown menu: “betweenness centrality.” Page 28 I. 1. 2. a) Ranking nodes (size) Click on the icon for size. Set min size at 10 and max size at 50. Play around with these numbers depending on the size of your network. Page 29 You now have a graph with the node’s color and size configured! J. Layout To keep large nodes from overlapping smaller ones, go back to the layout panel. 1. Check the “Adjust by sizes” option and run again the algorithm for just a moment. The nodes will spread out accordingly. Page 30 K. 1. Labels Display node labels. 2. Set label size proportional with node size. 3. Use the slider to adjust the overall label size to your liking. You can also change the font by clicking next to the slider. Page 31 J. Community detection The ability to detect and study communities is central in network analysis. We would like to colorize clusters in our example. Gephi implements the Louvain method to detect communities, and it’s available from the Statistics panel. 1. Go back to the statistics panel and click run near the “Modularity.” 2. Check “randomize” and click ok . K. Partition The community detection algorithm created a “Modularity class” for each node, which we’ll use to color the communities. Communities are clusters of nodes that are more connected to each other than with the rest of the network. 4. Locate the partition module on the left panel and click on the refresh button to populate list. Page 32 5. 6. 7. Choose “modularity class” from the menu. You can click “randomize colors” if you don’t like the colors. Click apply to color. Page 33 L. Filters The last manipulation step is filtering. You create filters that can hide nodes and edges on the network. We will create a filter to remove “leaves”, i.e. nodes with a single edge. 1. Go to the filters in the top right module and open the “topology” folder. Drag the “degree range” filter in to the “Queries” and drop it to “drag filter here.” 2. Click on the “degree range” to activate the filter. It shows a range slider and the chart that represents the data, the degree distribution here. Move the slide to sets its lower bound to 2 and filter. Nodes with a degree less than 2 are now hidden. M. Preview 1. At the top left click on the preview tab. 2. Under node set check “show labels” and click refresh at the bottom. Page 34 3. Click on the presets list and try different configurations. Page 35 N. Exporting the file Before you can upload your file into the website, you will need to first make sure that you have the proper plugin. This is a four step process. Step 1: Under the “Tools” drop down menu choose “Plugins” Step 2: Withe the Plugins window open, choose Available Plugins and scroll down. Page 36 Step 3: Scroll down to “SigmaExporter”, check the box and install it. Gephi will ask if you want to restart, restart and then prepare to export the file once it reopens. Step 4: Once you have restarted Gephi and your file is ready to be exported, click on the “File” menu, scroll down to the “Export” and chose the “Sigma.js template...” Now you have exported your file and you are ready to import it into the World Literature website. Page 37 Page 38 Step 4: Uploading student project on WorldLiterature@UCLA A. Login account 1. From the WorldLiterature@UCLA main page ( worldlit.cdh.ucla.edu ), Click “USER ENTRY” under the menu “EDUCATION”. 2. When you see the following login form, please fill out the username and the password foryour account. Click Log In . Page 39 B. 1. Add new graph After login to the system, click Graph from the left side panel. Then select, Add New . 2. A blank graph page for a new graph entry will be displayed . Input the project title where it says “Enter title here” and paste the analysis of your graph in the text box. Page 40 3. In the Description and Contributor panel, input a short description of your project and the names of all contributors. 4. In the Course and Project panel, select the tags to which your submission belongs. Under “Course,” select the course term (i.e. Spring 2015) and course title (i.e. German 170) for your tags. Under “Projects” indicate which text pertains to your project (i.e. The Sorrows of Young Werther vs. Faust ) Page 41 5. Input all the authors of the literatures you work on. Click “Add” every time after you input a new author name. Be sure to capitalize the first letter of authors’ names. 6. In the Files Upload panel, click “Choose File” to select your data.json and config.json files. C. 1. Upload and review After entering all content in last steps, click “Submit for Review.” Page 42 2. Your project has now been submitted for review by your instructors. You can preview your post by clicking Preview post . Page 43