1
PROYECTO FIN DE CARRERA
Tı́tulo:
Diseño e implementación de una herramienta web para el
análisis y simulación con MASON de redes sociales
Tı́tulo (inglés):
Design and implementation of a web framework for the analysis and simulation with MASON of social networks
Autor:
Daniel Lara Diezma
Tutor:
Emilio Serrano Fernández
Ponente:
Carlos A. Iglesias Fernández
Departamento:
Ingenierı́a de Sistemas Telemáticos
MIEMBROS DEL TRIBUNAL CALIFICADOR
Presidente:
Mercedes Garijo Ayestarán
Vocal:
Marifeli Sedano Ruı́z
Secretario:
Carlos Ángel Iglesias Fernández
Suplente:
José Carlos González Cristóbal
FECHA DE LECTURA:
CALIFICACIÓN:
UNIVERSIDAD POLITÉCNICA DE MADRID
ESCUELA TÉCNICA SUPERIOR DE
INGENIEROS DE TELECOMUNICACIÓN
Departamento de Ingenierı́a de Sistemas Telemáticos
Grupo de Sistemas Inteligentes
PROYECTO FIN DE CARRERA
DESIGN AND IMPLEMENTATION OF A WEB
FRAMEWORK FOR THE ANALYSIS AND
SIMULATION WITH MASON OF SOCIAL
NETWORKS
Daniel Lara Diezma
Junio de 2015
Resumen
El objetivo de este proyecto fin de carrera es el desarrollo e implementación de una aplicación
web que permita la simulación de redes sociales para poder analizar la difusión de rumores
de acuerdo a la conexión entre los distintos tipos de usuarios. Con este propósito, se
ha desarrollado un framework web capaz de generar redes a partir de un número inicial de
nodos introducido por el usuario, también se le ofrece la posibilidad de diseñar gráficamente
una red propia o bien cargar una red creada anteriormente. La red generada se puede
guardar para posteriores simulaciones. A los agentes, los usuarios de la red, se les asigna
un comportamiento dependiendo del número de conexiones con el resto de agentes. Cómo
última funcionalidad de la herramienta, se le permite al usuario realizar distintos tipos de
análisis de red ası́ como obtener la topologı́a de la red analizada en lenguaje GEXF (Graph
Exchange XML Format) para exportar la información a otras herramientas de análisis de
redes sociales. Un último añadido al proyecto es la posibilidad de descargarse el código y
ejecutarlo en una máquina propia de modo que pueda adaptar o extender el comportamiento
de los agentes de la red a sus necesidades.
En la memoria se muestran la elaboración de la herramienta parte por parte y la posterior conexión entre todas ellas para conformar la herramienta final. También se incluye
un análisis de las distintas herramientas utilizadas indicando el porqué de su elección o su
desestimación ası́ como un estudio del estado del arte. Finalmente se incluyen unos anexos
con el fin de ampliar algunos aspectos y ası́ facilitar la comprensión de estos y algunos manuales para proveer la información necesaria para el mantenimiento y desarrollo de posibles
mejoras.
Palabras clave: simulación social, red social, usuario, grafo, comportamiento, relación,
análisis de redes sociales, Big Data, Twitter.
V
Abstract
The aim of this project is the development and implementation of a web framework which
allows the creation and simulation of social networks in order to analyse the diffusion of
hearsay in accordance to the relationship between the different types of users. With this
purpose, a web framework has been developed capable of generating networks from an initial
number of nodes inserted by the user, a possibility of creating an own network inserting
each node and its relationship with each other or loading a network created previously. The
generated network, can be saved for future simulations. A behaviour will be assigned to
each agent (users of the network) depending on the number of its relations with the others
agents. As last functionality, the user can download the red in a GEXF (Graph Exchange
XML Format) file in order to process it with a SNA software. A last functionality added
to the project is the possibility of download the code in order to extend the behaviour of
the agents to adapt it to the user’s needs.
This report presents the build-up of the framework piecemeal and subsequent connection
between them in order to shape the final framework. An analysis of the different tools used
and why they are chosen or not is included too. Finally, some appendixes are included to
extend some aspects and facilitate the understanding of these, and some tutorials to provide
the needed information to maintain and develop future improvements.
Keywords: Social simulation, social network, user, graph, behaviour, relationship,
social network analysis, Big Data, Twitter.
VII
Agradecimientos
Me gustarı́a darle las gracias a todas aquellas personas que han estado dı́a a dı́a dándome
ánimos durante los años de carrera y que han estado ahı́ en los momentos difı́ciles.
Y en concreto a mi madre y a mi padre por darme la posibilidad de poder estudiar una
carrera, a mi novia por hacer que cada dı́a me levante con ganas de comerme el mundo, a
los Signoritos por hacer de mi paso por esta escuela una gran experiencia, al club de teatro
NECN por conseguir que recuerde con mucho cariño los últimos años de carrera, al resto
de compañeros de universidad por acompañarme en este camino, a todos los profesores
de la ETSIT porque sin ellos no habrı́a llegado hasta aquı́ y en concreto a Carlos Iglesias
por darme la oportunidad de entrar pronto en el DIT y descubrir que me encantaba la
programación, a mi tutor Emilio por guiarme en este PFC y por último a mis amigos de
toda la vida por apoyarme en los momentos duros.
Finalmente gracias una vez más a todas aquellas personas que me han estado a mi lado
hasta llegar hasta aquı́. Gracias.
IX
Contents
Resumen
V
Abstract
VII
Agradecimientos
IX
Contents
XI
List of Figures
XV
List of Tables
XIX
1 Introduction
1
1.1
Context . . . . . . . . . . . . . . . . . . . . . . . . . . . . . . . . . . . . . .
3
1.2
Master thesis goals . . . . . . . . . . . . . . . . . . . . . . . . . . . . . . . .
3
1.3
Structure of this Master Thesis . . . . . . . . . . . . . . . . . . . . . . . . .
4
1.4
State of art . . . . . . . . . . . . . . . . . . . . . . . . . . . . . . . . . . . .
5
1.4.1
Ohal . . . . . . . . . . . . . . . . . . . . . . . . . . . . . . . . . . . .
5
1.4.2
ThinkVine
6
. . . . . . . . . . . . . . . . . . . . . . . . . . . . . . . .
2 Enabling technologies
9
2.1
MASON . . . . . . . . . . . . . . . . . . . . . . . . . . . . . . . . . . . . . .
11
2.2
Gephi . . . . . . . . . . . . . . . . . . . . . . . . . . . . . . . . . . . . . . .
12
2.3
Neo4J . . . . . . . . . . . . . . . . . . . . . . . . . . . . . . . . . . . . . . .
13
2.4
GraphStream . . . . . . . . . . . . . . . . . . . . . . . . . . . . . . . . . . .
14
XI
2.5
Other technologies . . . . . . . . . . . . . . . . . . . . . . . . . . . . . . . .
16
2.5.1
Apache Tomcat . . . . . . . . . . . . . . . . . . . . . . . . . . . . . .
16
2.5.2
Java . . . . . . . . . . . . . . . . . . . . . . . . . . . . . . . . . . . .
17
2.5.3
HTML5 . . . . . . . . . . . . . . . . . . . . . . . . . . . . . . . . . .
17
2.5.4
CSS3
. . . . . . . . . . . . . . . . . . . . . . . . . . . . . . . . . . .
18
2.5.5
SigmaJS . . . . . . . . . . . . . . . . . . . . . . . . . . . . . . . . . .
18
3 Requirement Analysis
19
3.1
Overview . . . . . . . . . . . . . . . . . . . . . . . . . . . . . . . . . . . . .
21
3.2
Use cases . . . . . . . . . . . . . . . . . . . . . . . . . . . . . . . . . . . . .
21
3.2.1
Actors dictionary . . . . . . . . . . . . . . . . . . . . . . . . . . . . .
21
3.2.2
BigMarket user use cases . . . . . . . . . . . . . . . . . . . . . . . .
23
3.2.2.1
Setup the network . . . . . . . . . . . . . . . . . . . . . . .
25
3.2.2.2
Creating new random network . . . . . . . . . . . . . . . .
26
3.2.2.3
Creating network with Neo4j . . . . . . . . . . . . . . . . .
27
3.2.2.4
Loading network from database . . . . . . . . . . . . . . .
28
3.2.2.5
Running the simulation . . . . . . . . . . . . . . . . . . . .
29
3.2.2.6
Saving the simulation in database . . . . . . . . . . . . . .
30
3.2.2.7
Analysing the network . . . . . . . . . . . . . . . . . . . . .
31
3.2.2.8
Downloading the graph . . . . . . . . . . . . . . . . . . . .
32
3.2.2.9
Network visualization . . . . . . . . . . . . . . . . . . . . .
33
Developer use cases . . . . . . . . . . . . . . . . . . . . . . . . . . .
34
3.2.3.1
New user behaviour . . . . . . . . . . . . . . . . . . . . . .
35
3.2.3.2
New network building algorithm . . . . . . . . . . . . . . .
36
Admin use cases . . . . . . . . . . . . . . . . . . . . . . . . . . . . .
37
3.2.4.1
Manage the database . . . . . . . . . . . . . . . . . . . . .
38
3.2.4.2
Manage the user’s permissions . . . . . . . . . . . . . . . .
39
3.2.3
3.2.4
3.2.5
Conclusions . . . . . . . . . . . . . . . . . . . . . . . . . . . . . . . .
4 Architecture and implementation
39
41
4.1
Introduction . . . . . . . . . . . . . . . . . . . . . . . . . . . . . . . . . . . .
43
4.2
Architecture . . . . . . . . . . . . . . . . . . . . . . . . . . . . . . . . . . . .
43
4.3
MASON engine and its implementation . . . . . . . . . . . . . . . . . . . .
47
4.4
Neo4J database and its implementation . . . . . . . . . . . . . . . . . . . .
49
4.5
SigmaJS graph visualizator and its implementation . . . . . . . . . . . . . .
54
4.6
Gephi and export to GEXF file implementation . . . . . . . . . . . . . . . .
55
4.7
User web interface and Servlet and their implementation . . . . . . . . . . .
56
4.8
Conclusion
63
. . . . . . . . . . . . . . . . . . . . . . . . . . . . . . . . . . . .
5 Prototype and example usage
65
5.1
Introduction . . . . . . . . . . . . . . . . . . . . . . . . . . . . . . . . . . . .
67
5.2
Random network . . . . . . . . . . . . . . . . . . . . . . . . . . . . . . . . .
67
5.3
Creating network with Neo4J . . . . . . . . . . . . . . . . . . . . . . . . . .
68
5.4
Loading network from database . . . . . . . . . . . . . . . . . . . . . . . . .
71
5.5
Running the simulation of the loaded network . . . . . . . . . . . . . . . . .
72
5.6
Results screen and final actions . . . . . . . . . . . . . . . . . . . . . . . . .
73
5.7
Conclusion
75
. . . . . . . . . . . . . . . . . . . . . . . . . . . . . . . . . . . .
6 Conclusions and future lines
77
6.1
Conclusions . . . . . . . . . . . . . . . . . . . . . . . . . . . . . . . . . . . .
79
6.2
Achieved goals . . . . . . . . . . . . . . . . . . . . . . . . . . . . . . . . . .
79
6.3
Future work . . . . . . . . . . . . . . . . . . . . . . . . . . . . . . . . . . . .
80
A Installing and running a BigMarket server
A.1 Installation . . . . . . . . . . . . . . . . . . . . . . . . . . . . . . . . . . . .
81
83
A.1.1 Requirements . . . . . . . . . . . . . . . . . . . . . . . . . . . . . . .
83
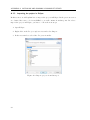
A.1.2 Downloading the source code . . . . . . . . . . . . . . . . . . . . . .
83
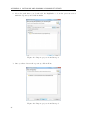
A.1.3 Importing the project in Eclipse . . . . . . . . . . . . . . . . . . . .
84
A.1.4 Converting the project into an Eclipse project . . . . . . . . . . . . .
88
A.1.5 Running the Neo4J database . . . . . . . . . . . . . . . . . . . . . .
91
A.2 Run a BigMarket Server . . . . . . . . . . . . . . . . . . . . . . . . . . . . .
91
A.2.1 Introduction . . . . . . . . . . . . . . . . . . . . . . . . . . . . . . .
91
A.2.2 Building the WAR (Web application ARchive) . . . . . . . . . . . .
91
A.2.3 Running a the application . . . . . . . . . . . . . . . . . . . . . . . .
93
B User manual
97
B.1 Run new random network simulation . . . . . . . . . . . . . . . . . . . . . .
99
B.2 Load network . . . . . . . . . . . . . . . . . . . . . . . . . . . . . . . . . . .
102
B.3 Create a network . . . . . . . . . . . . . . . . . . . . . . . . . . . . . . . . .
103
Bibliography
105
List of Figures
1.1
Ohal Logo. . . . . . . . . . . . . . . . . . . . . . . . . . . . . . . . . . . . .
5
1.2
ThinkVine Logo. . . . . . . . . . . . . . . . . . . . . . . . . . . . . . . . . .
6
2.1
MASON Logo. . . . . . . . . . . . . . . . . . . . . . . . . . . . . . . . . . .
11
2.2
Gephi Logo. . . . . . . . . . . . . . . . . . . . . . . . . . . . . . . . . . . . .
12
2.3
Gephi Framework. . . . . . . . . . . . . . . . . . . . . . . . . . . . . . . . .
13
2.4
Neo4J Logo. . . . . . . . . . . . . . . . . . . . . . . . . . . . . . . . . . . . .
13
2.5
Neo4J Framework. . . . . . . . . . . . . . . . . . . . . . . . . . . . . . . . .
14
2.6
GraphStream Logo. . . . . . . . . . . . . . . . . . . . . . . . . . . . . . . . .
14
2.7
GraphStream Graph Example. . . . . . . . . . . . . . . . . . . . . . . . . .
16
2.8
Apache Tomcat Logo. . . . . . . . . . . . . . . . . . . . . . . . . . . . . . .
16
2.9
Java Logo. . . . . . . . . . . . . . . . . . . . . . . . . . . . . . . . . . . . . .
17
2.10 HTML5 Logo. . . . . . . . . . . . . . . . . . . . . . . . . . . . . . . . . . . .
17
2.11 CSS3 Logo. . . . . . . . . . . . . . . . . . . . . . . . . . . . . . . . . . . . .
18
2.12 SigmaJS Logo. . . . . . . . . . . . . . . . . . . . . . . . . . . . . . . . . . .
18
3.1
User use cases. . . . . . . . . . . . . . . . . . . . . . . . . . . . . . . . . . .
24
3.2
Developer use cases. . . . . . . . . . . . . . . . . . . . . . . . . . . . . . . .
34
3.3
Admin use cases. . . . . . . . . . . . . . . . . . . . . . . . . . . . . . . . . .
37
4.1
UML class diagram. . . . . . . . . . . . . . . . . . . . . . . . . . . . . . . .
44
4.2
UML component diagram. . . . . . . . . . . . . . . . . . . . . . . . . . . . .
45
XV
5.1
100-Node Random network setup.
. . . . . . . . . . . . . . . . . . . . . . .
68
5.2
Neo4J interface. . . . . . . . . . . . . . . . . . . . . . . . . . . . . . . . . . .
69
5.3
Nodes created. . . . . . . . . . . . . . . . . . . . . . . . . . . . . . . . . . .
70
5.4
Final network. . . . . . . . . . . . . . . . . . . . . . . . . . . . . . . . . . .
71
5.5
Load network setup. . . . . . . . . . . . . . . . . . . . . . . . . . . . . . . .
72
5.6
Running the simulation. . . . . . . . . . . . . . . . . . . . . . . . . . . . . .
73
5.7
Results of the simulation. . . . . . . . . . . . . . . . . . . . . . . . . . . . .
74
5.8
Network visualization. . . . . . . . . . . . . . . . . . . . . . . . . . . . . . .
74
A.1 Git Bash console capture. . . . . . . . . . . . . . . . . . . . . . . . . . . . .
83
A.2 Import project from Git step 3. . . . . . . . . . . . . . . . . . . . . . . . . .
84
A.3 Import project from Git step 4. . . . . . . . . . . . . . . . . . . . . . . . . .
85
A.4 Import project from Git step 5. . . . . . . . . . . . . . . . . . . . . . . . . .
85
A.5 Import project from Git step 6. . . . . . . . . . . . . . . . . . . . . . . . . .
86
A.6 Import project from Git step 7. . . . . . . . . . . . . . . . . . . . . . . . . .
86
A.7 Import project from Git step 8. . . . . . . . . . . . . . . . . . . . . . . . . .
87
A.8 Import project from Git step 9. . . . . . . . . . . . . . . . . . . . . . . . . .
87
A.9 Convert the project into Eclipse project step 1. . . . . . . . . . . . . . . . .
88
A.10 Import libraries in an Eclipse project step 1. . . . . . . . . . . . . . . . . . .
89
A.11 Import libraries in an Eclipse project step 2. . . . . . . . . . . . . . . . . . .
89
A.12 Import libraries in an Eclipse project step 3. . . . . . . . . . . . . . . . . . .
90
A.13 Import libraries in an Eclipse project step 4. . . . . . . . . . . . . . . . . . .
90
A.14 Building the WAR step 1. . . . . . . . . . . . . . . . . . . . . . . . . . . . .
92
A.15 Building the WAR step 2. . . . . . . . . . . . . . . . . . . . . . . . . . . . .
92
A.16 Building the WAR step 3. . . . . . . . . . . . . . . . . . . . . . . . . . . . .
93
A.17 Running Big Market in Eclipse step 1. . . . . . . . . . . . . . . . . . . . . .
93
A.18 Running Big Market in Eclipse step 2. . . . . . . . . . . . . . . . . . . . . .
94
A.19 Running Big Market in Eclipse step 3. . . . . . . . . . . . . . . . . . . . . .
94
B.1 New random network simulation step 1. . . . . . . . . . . . . . . . . . . . .
99
B.2 New random network simulation step 2. . . . . . . . . . . . . . . . . . . . .
100
B.3 New random network simulation step 3. . . . . . . . . . . . . . . . . . . . .
101
B.4 New random network simulation step 4. . . . . . . . . . . . . . . . . . . . .
102
B.5 Load network step 1. . . . . . . . . . . . . . . . . . . . . . . . . . . . . . . .
103
List of Tables
3.1
Actors list. . . . . . . . . . . . . . . . . . . . . . . . . . . . . . . . . . . . .
22
3.2
Setup the network use case. . . . . . . . . . . . . . . . . . . . . . . . . . . .
25
3.3
Creating new random network use case. . . . . . . . . . . . . . . . . . . . .
26
3.4
Creating network with Neo4j use case. . . . . . . . . . . . . . . . . . . . . .
27
3.5
Loading network from database use case.
. . . . . . . . . . . . . . . . . . .
28
3.6
Running the simulation use case. . . . . . . . . . . . . . . . . . . . . . . . .
29
3.7
Saving the simulation in database use case. . . . . . . . . . . . . . . . . . .
30
3.8
Analysing the network use case. . . . . . . . . . . . . . . . . . . . . . . . . .
31
3.9
Downloading the graph use case. . . . . . . . . . . . . . . . . . . . . . . . .
32
3.10 Network visualization use case. . . . . . . . . . . . . . . . . . . . . . . . . .
33
3.11 New user behaviour use case. . . . . . . . . . . . . . . . . . . . . . . . . . .
35
3.12 New network building algorithm use case. . . . . . . . . . . . . . . . . . . .
36
3.13 Manage the database use case. . . . . . . . . . . . . . . . . . . . . . . . . .
38
3.14 Manage the user’s permissions use case. . . . . . . . . . . . . . . . . . . . .
39
XIX
CHAPTER
Introduction
This chapter provides an introduction to the problem which will be approached in
this project. It provides the context and the importance of the software SNSA (social
network simulation and analysis). Exposes the goals of the master thesis, structure
of this master thesis and a short representation of the state of art.
1
1
CHAPTER 1. INTRODUCTION
2
1.1. CONTEXT
1.1
Context
Agent-based social simulation (ABSS) computer-assisted simulation technique used to model
artificial societies populated with multiple autonomous entities, called agents, which act
autonomously by employing some knowledge or representation of their beliefs, desires and
intentions. ABSS is an innovative approach to open questions in a wide range of scientific
domains, including economics, biology, chemistry, ecology and sociology [1].
On the other hand, the social network analysis (SNA in advance) has emerged like a key
methodology in fields like social sciences, in which are included sociology, social psychology,
economy. Moreover it has also gained a significant support in other fields like biology or
physics [2].
This project deals with SNSA (social network simulation and analysis) which joins these
two research fields, ABSS and SNA.
Currently, the social networks have reached a great impact in the relationships between
persons and enterprises thanks to applications like Twitter, Facebook or similar. These
have a great importance in order to know the people opinion about various topics and how
the relations among these persons change depends of their opinion.
The analysis of this behavior through traditional methods has a large cost in time and
money. At this point, the SNA software has a great importance because it reduces the cost
of the analysis to a large degree.
Nowadays, there are variety of frameworks that allow making SNSA. The disadvantage
is that these frameworks are closed sourced or a programmer is needed to program and
configure the simulation.
With this project, the possibility of accessing a social network analysis framework
through the web is offered, with a simple front end and open source so the disadvantages
mentioned in the previous paragraph are solved. Apart from the framework, the user can
download the code too in order to code new behaviours that improve the tool.
1.2
Master thesis goals
The principal objectives of the project are the followings:
• Developing a free web framework to facilitate the access to SNSA tools for any user
independently of his computer skills.
3
CHAPTER 1. INTRODUCTION
• Saving time to the users when they want to make a SNSA implementing a framework
that allows an easy configuration of the network and of the simulation.
• Integrating Big Data technologies into the framework. More specifically, with a noSQL
graph database
• Facilitating familiarization of new developers with the SNSA tools because it offers a
base for supply new developments.
1.3
Structure of this Master Thesis
In this section we will provide a brief overview of all the chapters of this Master Thesis. It
has been structured as follows:
Chapter 1 provides an introduction to the problem which will be approached in this
project. It provides an overview of the benefits of SNSA framework. Furthermore, a deeper
description of the project and its environment is also given.
Chapter 2 contains an overview of the existing technologies on which the development
of the project will rely.
Chapter 3 describes one of the most important stages in software development: the
requirement analysis using different scenarios. For this, a detailed analysis of the possible
use cases is made using the Unified Modelling Language (UML). This language allows us to
specify, build and document a system using graphic language. The result of this evaluation
will be a complete specification of the requirements, which will be matched by each module
in the design stage. This helps us also to focus on key aspects and take apart other less
important functionalities that could be implemented in future works.
Chapter 4 describes the architecture of the system, divided in several modules with its
own purpose and functions.
Chapter 5 describes a selected use cases. It is going to be explained the running of all
the tools involved and its purpose. It allows us to test the application and give us some
feedback to improve our system and repair bugs and errors.
Chapter 6 sums up the findings and conclusions found throughout the document and
gives a hint about future development to continue the work done for this master thesis.
Finally, the appendix provides useful related information, especially covering the installation and configuration of the tools used in this thesis.
4
1.4. STATE OF ART
1.4
State of art
In this section we are going to explain how the SNSA software works actually. For this we
have chosen two frameworks that give us a start point to begin our project:
1.4.1
Ohal
Figure 1.1: Ohal Logo.
1. Interesting aspects: it adapts to real models, using networks and social media with
its users and relations between them. Each agent has individual characteristics. The
response of each scenario change according the characteristics of the agents and the
messages. It allows two types of transmission: viral and social pressure. It also allows
“if” scenarios.
2. Simulated market: social networks (in general any social media).
3. Objectives: studying the best way to propagate hearsays in Twitter and Facebook.
4. How it works: it creates the initial network with its characteristics (topology, propagation mode, agents and the seeding). Then it starts the simulation and analyses
how the hearsays are propagated. When the simulation ends, data is extracted and
a anew simulation is started modifying the initial characteristics. Data of the second
simulation is compared with the first one.
5. Agent type:
• Initial agent: it generates the initial message.
• Propagator agent: it has a lot of contacts and a great capacity for influence its
contacts, it propagates the message generated by the initial agent.
• User agent: final user that receives the message, it can propagate the message
too but only to its inner contacts circle.
6. Agent properties: it establishes different types of relationships:
5
CHAPTER 1. INTRODUCTION
• Two-way: both agents can influence each other.
• One-way: one agent influences another but this second agent cannot influence
the first one:
7. Implementation available: contact with them and then they realize the study, but
the software is not available.
8. Comments: its mechanics are interesting but they have not software available.
1.4.2
1
ThinkVine
Figure 1.2: ThinkVine Logo.
• Interesting aspects: it generates future ideas based on marketing strategies. It
allows watching the impact of different marketing strategies on different users groups.
This framework also has the capacity of manage a lot of “if” scenarios. Finally it
allows self-learning.
• Simulated market: marketing in a heterogeneous society.
• Objectives: it allows watching how the social media influence the buying habits in
heterogeneous societies and foresee the impact in these habits according the society
evolution.
• How it works: firstly it creates a mathematical model of consumers agents based
on a demographic census, then it adapts the behaviour of the agents according real
buying habits. Watching the data of previous years, it assigns to each agent a buying
frequency. It introduces the data provided by the enterprise about its marketing
strategies and the consumers and its habits. Finally it recreates the sales using its
own rules
• Agent type:
– Consumers: they establish relationships between them and with the environment
variables.
1
6
http://www.ohal-group.com/
1.4. STATE OF ART
• Agent Properties:
– The agents are based on real demographic statistics.
– The models are created taking samples from the society whose simulation is
wanted.
– Buying habits and social media use behaviours are assigned to the consumers.
– A variation in a single person does not change the behaviour of the whole society.
• Implementation available: like in the previous case, the software is not available.
• Comments: it is a very interesting framework for building the model of each agent.
2
2
http://www.thinkvine.com/
7
CHAPTER 1. INTRODUCTION
8
CHAPTER
Enabling technologies
This chapter introduces which technologies have made possible this project. First of
all, we must introduce MASON, an ABSS tool. After that, we speak about Gephi, a
SNA tool. Then we comment Neo4J a graph database. Finally, we present the other
technologies that have helped us to develop this project
9
2
CHAPTER 2. ENABLING TECHNOLOGIES
10
2.1. MASON
2.1
MASON
Figure 2.1: MASON Logo.
MASON Stands for Multi-Agent Simulator Of Networks1 .
It is a fast discrete-event multiagent simulation library core in Java, designed to be
the foundation for large custom-purpose Java simulations, and also to provide more than
enough functionality for many lightweight simulation needs. MASON contains both a model
library and an optional suite of visualization tools in 2D and 3D.
MASON is a joint effort between George Mason University’s Evolutionary Computation
Laboratory and the GMU Center for Social Complexity.
MASON features:
• 100% Java (1.3 or higher).
• Fast, portable, and fairly small.
• Models are completely independent from visualization, which can be added, removed,
or changed at any time.
• Models may be checkpointed and recovered, and dynamically migrated across platforms.
• Can produce results that are identical across platforms.
• Models are self-contained and can run inside other Java frameworks and applications.
• 2D and 3D visualization.
• Can generate PNG snapshots, Quicktime movies, charts and graphs, and output data
streams.
These features make MASON a good choice for coding the simulation. In our project,
we will need to simulate the behaviour of a complex society so we must code a simulation,
MASON will facilitate us these task because it is coded in Java so it adapts perfectly to
our purpose. For the visualization and build the graph (the nodes and their relationships),
1
http://cs.gmu.edu/ eclab/projects/mason/
11
CHAPTER 2. ENABLING TECHNOLOGIES
we will choose other tool than fill in better way to our needs. In coming chapters, we will
explain with more detail how MASON is used to build the simulation.
2.2
Gephi
Figure 2.2: Gephi Logo.
Gephi is an interactive visualization and exploration platform for all kinds of networks
and complex systems, dynamic and hierarchical graphs2 .
Gephi has been used in a number of research projects in the university, journalism and
elsewhere, for instance in visualizing the global connectivity of New York Times content and
examining Twitter network traffic during social unrest along with more traditional network
analysis topics.
The Gephi Consortium is a French non-profit corporation which supports development
of future releases of Gephi. Members include SciencesPo, Linkfluence, WebAtlas, and Quid.
Gephi inspired the LinkedIn InMaps and was used for the network visualizations for
Truthy.
We will use Gephi in this project in two ways:
• BigMarket allows the user to download an .gexf file. Once he/she has download this
file, it can analyse it by using Gephi Framework so the user must have Gephi installed
in its own computer.
• The other way that we use Gephi in our project is using its Java API for analyse the
graph in the web framework. In this way, the user do not need to have installed Gephi
in his computer, BigMarket do the SNA analyse in combination with the Gephi API.
For more information about the integration between BigMarket and Gephi API please
refer to the chapter 4.
2
12
http://gephi.github.io/
2.3. NEO4J
Figure 2.3: Gephi Framework.
2.3
Neo4J
Figure 2.4: Neo4J Logo.
Neo4J is an open-source graph database, implemented in Java. The developers describe
Neo4j as “embedded, disk-based, fully transactional Java persistence engine that stores data
structured in graphs rather than in table”3 .
Neo4J features:
• Performance: Neo4j’s native graph engine is engineered to let navigate hyper-connectivity
at speed. Built from the bottom up to support property graphs, Neo4j allows you to
connect the nodes easily, and with unparalleled performance and reliability.
• Scalability: Neo4j scales up and out, supporting tens of billions of nodes and their
relationships, and hundreds of thousands of ACID (Atomicity, Consistency, Isolation
and Durability) transactions per second.
In our project, we will need a database in order to store the simulations so that the user
can recover a simulation that he have made in the past. BigMarket uses graphs to represent
a social network (or a society) representing the people like nodes and the relations between
them like edges. Thus if we have a graph to represent the society, we will need a graph
database in order to store it.
3
http://neo4j.com/
13
CHAPTER 2. ENABLING TECHNOLOGIES
Our project is focus in Big Data so we will need store a big amount of nodes and its
relationships. As we see in the second feature of Neo4J, it supports a lot of relationships
and transactions becoming Neo4J the best choice for store ours graphs.
Neo4J also offers a graphic interface in order to see the data store in the database and
allow us to create a new graph using Neo4J commands (in general do any action). So that
this feature will add more functions to our tool.
So in sight of our needs, working with graphs and a lot of nodes and relationships, we
consider Neo4J a good choice for our project.
In chapter 4, we will speak more about the way that BigMarket store the graph in the
database and how the user can recover the information.
Figure 2.5: Neo4J Framework.
2.4
GraphStream
Figure 2.6: GraphStream Logo.
GraphStream is a graph handling Java library that focuses on the dynamics aspects of
graphs. Its main focus is on the modelling of dynamic interaction networks of various sizes4 .
4
14
http://graphstream-project.org/
2.4. GRAPHSTREAM
The goal of the library is to provide a way to represent graphs and work on it. To
this end, GraphStream proposes several graph classes that allow us to model directed and
undirected graphs, 1-graphs or p-graphs (a.k.a. multigraphs, that are graphs that can have
several edges between two nodes).
GraphStream allows us to store any kind of data attribute on the graph elements:
numbers, strings, or any object.
Moreover, in addition, GraphStream provides a way to handle the graph evolution in
time. This means handling the way nodes and edges are added and removed, and the way
data attributes may appear, disappear and evolve.
In order to handle dynamic graphs, the library defines in addition to graph structures
the notion of “stream of graph events”, which as you guessed, is at the origin of the library
name. The number of events is restricted they are:
• node addition,
• node removal,
• edge addition,
• edge removal,
• graph/node/edge attribute addition,
• graph/node/edge attribute change,
• graph/node/edge attribute removal.
• step
Inside the library, a lot of components can generate such streams of events. These
components are called sources. Other components can receive these events and process
them, they are in fact very comparable to listeners, a concept widely used in the Java
world. We call such components sinks.
When a component is able to both receive graph events (sink) and produce them (source)
we call it a pipe. The graph structures in GraphStream are pipes. There are many kinds
of pipes, that can act as filter, removing some events, or adding more events, or allow to
cross the network, or communicate between threads.
At the start of the chapter, we talked about MASON. Although MASON has mechanisms to build graphs, it is hard to build dynamic graph and modify the visualization in
15
CHAPTER 2. ENABLING TECHNOLOGIES
real time. With GraphStream, we do not have these problems. In GraphStream we count
with layouts too that allows us to represent the graphs in a way that is easier to identify
the elements.
So these features makes GraphStream a good graph builder and visualizator for our
purposes, removing the visualization part of MASON.
Figure 2.7: GraphStream Graph Example.
2.5
Other technologies
In this section, we talk about other technologies that help us to build our project but they
are well known or they have contributed in a lesser way to our project so we will extend
less explaining these technologies.
2.5.1
Apache Tomcat
Figure 2.8: Apache Tomcat Logo.
Apache Tomcat is an open-source web server and servlet container developed by the
Apache Software Foundation (ASF). Tomcat implements several Java EE specifications
including Java Servlet, JavaServer Pages (JSP), Java EL, and WebSocket, and provides a
16
2.5. OTHER TECHNOLOGIES
“pure Java” HTTP web server environment for Java code to run in5 .
In our project, we will use Tomcat to publish the service and make it accessible from
Internet.
2.5.2
Java
Figure 2.9: Java Logo.
Java is a general-purpose computer programming language that is concurrent, classbased, object-oriented, and specifically designed to have as few implementation dependencies as possible. It is intended to let application developers “write once, run anywhere”
(WORA), meaning that compiled Java code can run on all platforms that support Java
without the need for recompilation. Java applications are typically compiled to bytecode
that can run on any Java virtual machine (JVM) regardless of computer architecture6 .
2.5.3
HTML5
Figure 2.10: HTML5 Logo.
HTML5 is a core technology markup language of the Internet used for structuring and
presenting content for the World Wide Web. As of October 2014 this is the final and
complete fifth revision of the HTML standard of the World Wide Web Consortium (W3C).
The previous version, HTML 4, was standardised in 1997.
Its core aims have been to improve the language with support for the latest multimedia
while keeping it easily readable by humans and consistently understood by computers and
5
6
http://tomcat.apache.org/
https://www.java.com/en/
17
CHAPTER 2. ENABLING TECHNOLOGIES
devices (web browsers, parsers, etc.). HTML5 is intended to subsume not only HTML 4,
but also XHTML 1 and DOM Level 2 HTML7 .
2.5.4
CSS3
Figure 2.11: CSS3 Logo.
Cascading Style Sheets (CSS) is a style sheet language used for describing the look and
formatting of a document written in a markup language. While most often used to change
the style of web pages and user interfaces written in HTML and XHTML, the language
can be applied to any kind of XML document, including plain XML, SVG and XUL. Along
with HTML and JavaScript, CSS is a cornerstone technology used by most websites to
create visually engaging webpages, user interfaces for web applications, and user interfaces
for many mobile applications8 .
2.5.5
SigmaJS
Figure 2.12: SigmaJS Logo.
Sigma is a JavaScript library dedicated to graph drawing. It makes easy to publish
networks on Web pages, and allows developers to integrate network exploration in rich Web
applications9 .
7
http://www.w3schools.com/html/default.asp
http://www.w3schools.com/css/default.asp
9
http://sigmajs.org/
8
18
CHAPTER
Requirement Analysis
This chapter describes one of the most important stages in software development: the
requirement analysis using different scenarios. For this, a detailed analysis of the
possible use cases is performed using the Unified Modelling Language (UML). This
language allows us to specify, build and document a system using graphic language.
19
3
CHAPTER 3. REQUIREMENT ANALYSIS
20
3.1. OVERVIEW
3.1
Overview
The result of this chapter will be a complete specification of the requirements, which will be
matched by each module in the design stage. This also helps us to focus on key aspects and
take apart other less important functionalities that could be implemented in future works.
3.2
Use cases
These sections identify the use cases of the system. This helps us to obtain a complete
specification of the uses of the system, and therefore define the complete list of requisites
to match. First, we will present a list of the actors in the system and a UML diagram
representing all the actors participating in the different use cases. This representation allows, apart from specifying the actors that interact in the system, showing the relationships
between them.
These use cases will be described the next sections, including each one a table with their
complete specification. Using these tables, we will be able to define the requirements to be
established.
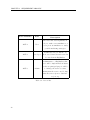
3.2.1
Actors dictionary
The list of primary and secondary actors is presented in table 3.1. These actors participate
in the different use cases, which are presented later.
21
CHAPTER 3. REQUIREMENT ANALYSIS
Actor identifier
Role
Description
End user that uses BigMarket in
ACT-1
User
order to make a new simulation or
load a previous simulation to study
possible marketing strategies.
Technical developer which code
ACT-2
Developer
their own behaviours and networks
for use them in BigMarket.
Administrator of BigMarket, this
actor will be implemented in future
works, its principal purpose will be
ACT-3
Admin
to manage the users accounts,
maintenant the service and lookup
that all services (server, database,
etc) are up.
Table 3.1: Actors list.
22
3.2. USE CASES
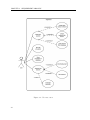
3.2.2
BigMarket user use cases
This use case package collects the user functionalities of BigMarket, as shown in 3.1.
The use cases presented in this section are as shown in the Figure 3.1:
• Setup the network: detailed in sub-section 3.2.2.1.
• Creating new random network: detailed in sub-section 3.2.2.2.
• Creating network with Neo4j: detailed in sub-section 3.2.2.3.
• Loading network from database: detailed in sub-section 3.2.2.4.
• Running the simulation: detailed in sub-section 3.2.2.5.
• Saving the simulation in database: detailed in sub-section 3.2.2.6.
• Analysing the network: detailed in sub-section 3.2.2.7.
• Downloading the graph: detailed in sub-section 3.2.2.8.
• Network visualization: detailed in sub-section 3.2.2.9.
23
CHAPTER 3. REQUIREMENT ANALYSIS
Figure 3.1: User use cases.
24
3.2. USE CASES
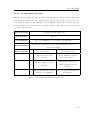
3.2.2.1
Setup the network
This use case represent the action of creating a network. In this case, we will not enter in
details about the way to create the network (loading from database, new random network,
etc). At the begin of this use case, the servlet should be started and the “Setup simulation”
screen must be displayed. At the end of the use case, the network will be created. This
table also represent the flow of events that allows creating the network.
Use Case Name
Setup the network
Use Case ID
UC1.1
Pre-Condition
The “Setup simulation” screen has been displayed.
The network, which will be used in the simulation, has been
Post-Condition
created successfully.
Flow of Events
1
Actor Input
System Response
The user clicks on the “Start”
The “Setup simulation”
button in the index screen.
screen is displayed.
The fields to setup the
2
The user selects how he/she
network in order to the
want to create the network.
selection of the user are
enabled.
3
4
The user fills the mandatory
The “Setup” button becomes
fields.
enabled.
The user clicks on the
“Setup” button.
The network is created.
Table 3.2: Setup the network use case.
25
CHAPTER 3. REQUIREMENT ANALYSIS
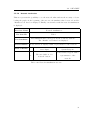
3.2.2.2
Creating new random network
This use case is an extend use case of the previous use case. In this case the action will
be to create a new random network. Like the previous use case, at the begin, we have the
servlet started and the “Setup simulation” screen displayed. At the end of the use case, a
new random network will have been created. The table also represent the flow of the events
of the use case.
Use Case Name
Creating new random network
Use Case ID
UC1.2
Pre-Condition
The “Setup simulation” screen has been displayed.
The network, which will be use in the simulation, has been
Post-Condition
created successfully.
Flow of Events
Actor Input
1
2
3
The user selects “New
random network”.
System Response
The fields for creating new
random network become
enabled.
The user fills the new
The “Setup!” button
random network fields.
becomes enabled.
The user clicks on the
“Setup!” button.
The network is created.
Table 3.3: Creating new random network use case.
26
3.2. USE CASES
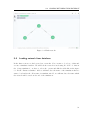
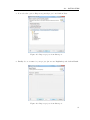
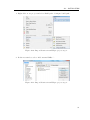
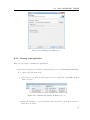
3.2.2.3
Creating network with Neo4j
This use case represents the creation of a network using the Neo4J web interface. It extends
from Setup the network use case. Like the previous use case, at the begin, we have the
servlet started and the “Setup simulation” screen displayed. At the end of the use case, the
network will have been created and stored in the database. The table also represent a flow
of events of the use case.
Use Case Name
Creating network with Neo4j
Use Case ID
UC1.3
Pre-Condition
The “Setup simulation” screen has been displayed.
The network, which will be used in the simulation, has been
Post-Condition
created successfully.
Flow of Events
1
2
3
Actor Input
System Response
The user selects load
Create simulation button
network.
becomes enabled.
The user clicks on “Create
network”.
The system opens a new
window with the Neo4J
interface.
The user creates the network
Neo4j store the new network
using Neo4j commands.
in database.
Table 3.4: Creating network with Neo4j use case.
27
CHAPTER 3. REQUIREMENT ANALYSIS
3.2.2.4
Loading network from database
This use case also extends from Setup network use case. In this case, a network will be
loaded from the database. Like the previous use case, at the begin we have the servlet
started and the “Setup simulation” screen displayed. At the end of the use case, we have a
network loaded from the database. The table also represents the flow of events of the use
case.
Use Case Name
Loading network from database
Use Case ID
UC1.4
Pre-Condition
The “Setup simulation” screen has been displayed.
The network, which will be used in the simulation, has been
Post-Condition
loaded successfully.
Flow of Events
1
2
3
Actor Input
System Response
The user selects “Load
The fields for loading
network from database”.
network become enabled.
The user fills the load
The “Setup!” button
network fields.
becomes enabled.
The user clicks on the
The network is loaded from
“Setup!” button.
database.
Table 3.5: Loading network from database use case.
28
3.2. USE CASES
3.2.2.5
Running the simulation
This use case represents the execution of a simulation using a network created with some
of the previous use cases. So, at the beginning of the use case, we have a network and the
“Running screen” displayed. The table also represents the flow of events of the use case.
Use Case Name
Running the simulation
Use Case ID
Pre-Condition
UC1.5
The network has been created and the running screen has been
displayed.
Post-Condition
The results screen is displayed and the simulation stored in the
database.
Flow of Events
Actor Input
1
2a
2b
3a
3b
The user clicks on the “Run
one step” or “Run” button ).
The user clicks on “Pause”
button.
System Response
The simulation starts.
The simulation is paused.
The user clicks on “Stop”
The simulation is stopped
button.
and it is stored in the .
The user repeats the step 1.
N/A.
The user clicks on “Stop”
The simulation is stopped
button.
and stored in the database.
Table 3.6: Running the simulation use case.
29
CHAPTER 3. REQUIREMENT ANALYSIS
3.2.2.6
Saving the simulation in database
This use case represents the storing of the simulation in database. As pre-condition we have
the simulation must be running. At the end of this use case, the simulation is stored in the
database. The table also represents the flow of events of the use case.
Use Case Name
Running the simulation
Use Case ID
UC1.6
Pre-Condition
The simulation is running.
Post-Condition
The simulation is stored in the database.
Flow of Events
Actor Input
System Response
The simulation is stopped
1
The user clicks on the “Stop”
and stored in the database.
button.
The “Results” screen is
displayed.
Table 3.7: Saving the simulation in database use case.
30
3.2. USE CASES
3.2.2.7
Analysing the network
This use case represents the analysis of the network. At the beginning of the use case, the
simulation has been stored and the “Results screen” has been displayed. The table also
represents the flow of events of the use case.
Use Case Name
Analysing the network.
Use Case ID
UC1.7
The simulation has been stopped and stored in the database.
Pre-Condition
The “Results” screen has been displayed.
Post-Condition
N/A.
Flow of Events
Actor Input
System Response
The user can analyze the
1
results and restart a new
simulation going to the
N/A.
“Setup simulation” screen”.
Table 3.8: Analysing the network use case.
31
CHAPTER 3. REQUIREMENT ANALYSIS
3.2.2.8
Downloading the graph
This use case represents the option to download the graph that contains the information of
the network in order to analyse it with a SNA tool. At the beginning of the use case, the
simulation has been stored and the “Results screen” has been displayed. Finally, the user
will have in his/her computer the GEXF file that represents the network.
Use Case Name
Downloading the graph.
Use Case ID
UC1.8
The simulation has been stopped and stored in the database.
Pre-Condition
The “Results” screen has been displayed.
The user has in his/her computer the .GEXF file with the
Post-Condition
network.
Flow of Events
Actor Input
1
2
The user clicks on
“Download graph” button.
System Response
A new window appear asking
to the user where he/she wat
to save the file.
The user selects the path
The file is downloaded to the
where the file will be saved.
user.
Table 3.9: Downloading the graph use case.
32
3.2. USE CASES
3.2.2.9
Network visualization
This use represents the possibility to see the network online without the necessity of downloading the graph. At the beginning of the use case, the simulation has been stored and the
“Results screen” has been displayed. Finally, a new window with the network visualization
is displayed.
Use Case Name
Network visualization.
Use Case ID
UC1.9
The simulation has been stopped and stored in the database.
Pre-Condition
The “Results” screen has been displayed.
Post-Condition
A new window is displayed with a representation of the network.
Flow of Events
Actor Input
1
The user clicks on “See
network” button.
System Response
A new window appear with a
representation of the
network.
Table 3.10: Network visualization use case.
33
CHAPTER 3. REQUIREMENT ANALYSIS
3.2.3
Developer use cases
This use case package collects the developer functionalities of BigMarket, as shown in 3.2.
The use cases presented in this section are as shown in the Figure 3.2:
• New user behaviour: detailed in sub-section 3.2.3.1.
• New network building algorithm: detailed in sub-section 3.2.3.2.
Figure 3.2: Developer use cases.
34
3.2. USE CASES
3.2.3.1
New user behaviour
This use case represents the possibility that a developer user codes his/her own user behaviour. First of all, the user should have download the code in his/her computer. Finally,
he/she can develop the behaviour.
Use Case Name
New user behaviour
Use Case ID
UC2.1
Pre-Condition
The developer has downloaded the code
Post-Condition
N/A.
Flow of Events
Actor Input
System Response
The developer can code
1
The developer imports the
his/her own class in which
project in Eclipse.
the developer defines the new
behaviour.
Table 3.11: New user behaviour use case.
35
CHAPTER 3. REQUIREMENT ANALYSIS
3.2.3.2
New network building algorithm
This use case represent the possibility to develop a new network algorithm. To do this, the
developer should download the code to his/her computer. Then he/she can develop his/her
own network building algorithm.
Use Case Name
New network building algorithm
Use Case ID
UC2.2
Pre-Condition
The developer has download the code
Post-Condition
N/A.
Flow of Events
Actor Input
System Response
The developer can code
1
The developer imports the
project in Eclipse.
his/her own class in which
the developer defines the new
algorithm in order to build
the network.
Table 3.12: New network building algorithm use case.
36
3.2. USE CASES
3.2.4
Admin use cases
This use case package collects the admin functionalities of BigMarket, as shown in 3.3.
The use cases presented in this section are as shown in the Figure 3.3. The functions of
the admin actor will be implemented in future works:
• Manage the database: detailed in sub-section 3.2.4.1.
• Manage the user‘s permissions: detailed in sub-section 3.2.4.2.
Figure 3.3: Admin use cases.
37
CHAPTER 3. REQUIREMENT ANALYSIS
3.2.4.1
Manage the database
In this use case, the possibility to manage the database by an admin is represented.
Use Case Name
Manage the database
Use Case ID
UC3.1
The database needs to be repair (delete registers, resolve
Pre-Condition
problems, etc).
Post-Condition
N/A
Flow of Events
Actor Input
The admin logs in the
1
database interface as
superuser.
The admin performs an
2
action in order to solve
System Response
The actions for managing the
database become enabled.
The problems of the database
database problems.
Table 3.13: Manage the database use case.
38
are solved.
3.2. USE CASES
3.2.4.2
Manage the user’s permissions
This use case represents the possibility to manage the user’s permissions. In the future, the
users will have different permissions that allow them to use BigMarket in a way or other.
Use Case Name
Manage the user’s permissions
Use Case ID
UC3.2
An user needs to change its permissions, or a user have to be
Pre-Condition
banned for using BigMarket.
Post-Condition
N/A
Flow of Events
1
2
Actor Input
System Response
The admin log in BigMarket
The administration windows
as superuser.
are opened.
The admin selects the user
The user is updated with the
and his/her new permissions.
new permissions.
Table 3.14: Manage the user’s permissions use case.
3.2.5
Conclusions
With the use cases described we have introduced the basic functionalities that have been
implemented in this project. They help us to understand the different actors that can
interact. They can serve as a base for further development and different use cases that can
come to mind.
39
CHAPTER 3. REQUIREMENT ANALYSIS
40
CHAPTER
Architecture and implementation
This chapter describes in depth how the system is structured in different modules and
how the users interact with them. In order to make the chapter more understandable
to the users, we will attach to each module its implementation. We will describe each
one of these modules describing its main purpose, structure and function (including the module implementation). After reading this chapter, the user will know how
the application and each of its modules work and how BigMarket implements these
functions.
41
4
CHAPTER 4. ARCHITECTURE AND IMPLEMENTATION
42
4.1. INTRODUCTION
4.1
Introduction
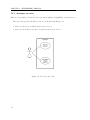
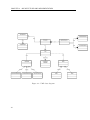
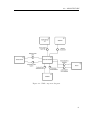
In this chapter, we show two detailed diagrams. First, we can see a class diagram that
represents the class structure of BigMarket, this diagram is represented by figure 4.1. Following this diagram, we can see the diagram [4.2] that represents the complete architecture
of BigMarket. In the first section we introduce both schemes and the behaviour and the
main function of each of the modules and components. After this, in the following subsections we describe each module in depth showing specific diagrams, screenshots and detailing
their particular operation, also, to help the user to understand how each module works, we
attach the implementation of each function.
4.2
Architecture
To define the architecture of BigMarket, we have built two diagrams. The first of them,
is a class diagram built following the specifications of UML Class Diagrams. UML 2 class
diagrams are the mainstay of object-oriented analysis and design. UML 2 class diagrams
show the classes of the system, their interrelationships (including inheritance, aggregation,
and association), and the operations and attributes of the classes. Class diagrams are used
for a wide variety of purposes, including both conceptual/domain modeling and detailed
design modelling1 .
Following this diagram we can find a component diagram that give us a global vision
of the architecture of BigMarket, to make the component diagram we have following the
specifications of UML Component Diagrams 2 .
1
2
http://www.agilemodeling.com/artifacts/classDiagram.htm
http://agilemodeling.com/artifacts/componentDiagram.htm
43
CHAPTER 4. ARCHITECTURE AND IMPLEMENTATION
Figure 4.1: UML class diagram.
44
4.2. ARCHITECTURE
Figure 4.2: UML component diagram.
45
CHAPTER 4. ARCHITECTURE AND IMPLEMENTATION
In the next paragraphs we will do a simply introduction of how BigMarket works, and
in the following sections we will explain each part with more detail.
Since the main purpose of this master thesis is to develop an HTML5 Framework to
build, analyse and represent the evolve of a social network in the time, the whole actions
that the users can do will be done through a web interface that will connect with a servlet
that receives the request of the user and will do the properly action depending the request.
In order to create the initial network, non-technical users can use the automatic BigMarket network builder engine in order to create their own networks, this engine builds a
network with the number of the initial nodes using an algorithm based on the popularity
of each user, it means that a new user is more probably that follows an old user that has
a lot of followers instead of an user that has less followers. The more technical users, can
build their networks using the querys provided by Neo4J, with this method, the user of
BigMarket is who establish how many nodes are in the begin of the simulation and how
they are connected. Once the network is created, BigMarket will use in each step the same
algorithm explained with the non-technical users to introduce and connect the new nodes.
Once the network is created and the user starts the simulation, the MASON step engine
takes the control. In each step, MASON step engine introduce a new number of users
depending on the actual number of users and the time that the simulation is running (we
understand the time like the number of steps since the simulation began), connect the new
users with the oldies using the algorithm explained in the previous paragraph, makes new
relationships between the old users and, finally, modify the behaviour of the users according
to the new network structure.
When the user stops the simulation, Neo4J enter in action. First of all, the network is
parser into JSON format in order to adapt it to Neo4J query format. This query is made
by an http request that store the simulation in the database.
Once the simulation is completely stored in the database, BigMarket represent in the
screen four centrality analysis: betweeness, closeness, in degree and out degree. If the
user wants to analyse the network with more detail, BigMarket enables the possibility to
download the graph that contains the network in a .GEXF file in order to analyse it with
a SNA tool (like Gephi). In the results screen, the user have the possibility to see the
network too. This visualization will be showed in a new window and the nodes and their
relationships will be represented.
46
4.3. MASON ENGINE AND ITS IMPLEMENTATION
4.3
MASON engine and its implementation
As we explained in the past section, BigMarket uses the MASON step engine in order to
make the network evolve in time. MASON also allows a GUI if we execute BigMarket in
our own computer. As we comment in the past section, MASON follows these points in
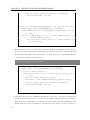
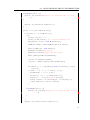
each execution:
• Network growth: first of all, MASON introduce a number of new users in the network.
This number depends of the number of actual users in the network and the steps from
the beginning of the simulation. This growth follows the next expression extracted
0 .239)∗1.67
from [3]: e(t
The implementation of this network growth can see in the following block:
Listing 4.1: Network growth
long t = simulation . schedule . getSteps () ;
d o u b l e exponent = ( 1 1 9 0 . 0 / 5 0 0 0 . 0 ) ;
d o u b l e r = Math . pow ( t , exponent ) ;
double i n t e g r a l R e s u l t = (1565∗ r ) /937;
d o u b l e n = i n i t i a l P o p u l a t i o n ∗Math . exp ( i n t e g r a l R e s u l t ) ;
i n t nt = ( i n t ) Math . round ( n ) ;
• Connecting the new users: once the new users are added, is time to connect them
with the old users of the network. To do this we will use an algorithm that makes
more possible that new users connect with other that has a lot of followers instead
of an user that has less followers. In order to help to the users to understand this
function, we attach the implementation of the connecting new users function:
Listing 4.2: Connecting new users
p u b l i c v o i d lookForNewUsers ( S i m u l a t i o n sim ) {
Graph graph = sim . getGraphManager ( ) . getGraph ( ) ;
f o r ( User u : sim . g e t U s e r s ( ) ) {
i f ( u . g e t F o l l o w e d ( ) . s i z e ( ) == 0 && u . g e t F o l l o w e r s ( ) . s i z e ( )
== 0 ) {
Node n2 = graph . getNode ( u . g e t I d ( ) ) ;
i n t random = ( i n t ) ( Math . random ( ) ∗ p o p u l a r i t y . s i z e ( ) ) ;
47
CHAPTER 4. ARCHITECTURE AND IMPLEMENTATION
Node n1 = graph . getNode ( p o p u l a r i t y . g e t ( random ) ) ;
connectNewUsers ( sim , n1 , n2 ) ;
}
}
}
p u b l i c v o i d connectNewUsers ( S i m u l a t i o n sim , Node n1 , Node n2 ) {
Graph graph = sim . getGraphManager ( ) . getGraph ( ) ;
graph . addEdge ( I n t e g e r . t o S t r i n g ( graph . getEdgeCount ( ) +1) , n2 ,
n1 , true ) ;
Follow f = new Follow ( "Follow " + graph . getEdgeCount ( ) +1, "
TS " + graph . getEdgeCount ( ) +1
, sim . g e t U s e r s ( ) . g e t ( n1 . g e t I n d e x ( ) ) , sim . g e t U s e r s ( ) . g e t
( n2 . g e t I n d e x ( ) ) ) ;
}
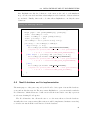
• Establishing new relations: when the new users and their relationships are incorporate
in the network, the next step is establish new relations between the old users. We will
use the same algorithm of the last point to do this. You can see the implementation
of this function in the following block:
Listing 4.3: Establishing new relations
p u b l i c v o i d lookForNewUsers ( S i m u l a t i o n sim ) {
Graph graph = sim . getGraphManager ( ) . getGraph ( ) ;
f o r ( User u : sim . g e t U s e r s ( ) ) {
i f ( u . g e t F o l l o w e d ( ) . s i z e ( ) == 0 && u . g e t F o l l o w e r s ( ) . s i z e ( )
== 0 ) {
Node n2 = graph . getNode ( u . g e t I d ( ) ) ;
i n t random = ( i n t ) ( Math . random ( ) ∗ p o p u l a r i t y . s i z e ( ) ) ;
Node n1 = graph . getNode ( p o p u l a r i t y . g e t ( random ) ) ;
connectNewUsers ( sim , n1 , n2 ) ;
}
}
}
• Modifying the behaviour: BigMarket assign the behaviour to each user according their
followers. If the users have a lot of followers, we assume that the user is a broadcaster,
if he/she has a normal number of followers, he/she is catalogued like acquaintance and
finally if the user has a few number of followers, he/she is and odd user. Because of
48
4.4. NEO4J DATABASE AND ITS IMPLEMENTATION
this, BigMarket modify the behaviour of the users at the end of each simulation
step, once the new users and their relationships are added and the old users relations
are modified. Finally, this is the code that allows BigMarket to modify the users
behaviour:
Listing 4.4: Modifying behaviour
p r i v a t e v o i d setUserType ( S i m u l a t i o n sim , User u s e r ) {
Graph graph = sim . getGraphManager ( ) . getGraph ( ) ;
double enteredEdges = 0 . 0 ;
d o u b l e t o t a l E d g e s = graph . getEdgeCount ( ) ;
double percentage = 0 . 0 ;
enteredEdges = user . getFollowers ( ) . s i z e ( ) ;
percentage = enteredEdges / totalEdges ;
i f ( p e r c e n t a g e >= 0 . 3 ) {
u s e r . setType ( C on s t a n t s .USER TYPE BROADCASTER) ;
//System.out.println("EL usuario " + user.getUserName()
+ " es un " + Constants.USER_TYPE_BROADCASTER);
} e l s e i f ( 0 . 3 > p e r c e n t a g e &&
p e r c e n t a g e >= 0 . 1 ) {
u s e r . setType ( C on s t a n t s .USER TYPE ACQUAINTANCES) ;
//System.out.println("EL usuario " + user.getUserName()
+ " es un " + Constants.USER_TYPE_ACQUAINTANCES);
} else {
u s e r . setType ( C on s t a n t s . USER TYPE ODDUSERS) ;
//System.out.println("EL usuario " + user.getUserName()
+ " es un " + Constants.USER_TYPE_ODDUSERS);
}
}
4.4
Neo4J database and its implementation
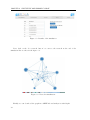
The main purpose of the part composed by the Neo4J tools is, apart of its use like database,
create and modify the network. The user can use BigMarket to open a new window with the
Neo4J interface, which allows us to build a new network from scratch or modify a previous
stored network using Neo4J queries.
The Neo4J interface also allows the user to see the networks stored in the database.
Actually there is not any security (like sessions, it will be implemented in future networks),
so an user can watch all the networks stored in the database.
49
CHAPTER 4. ARCHITECTURE AND IMPLEMENTATION
Once we have created (or modify) a network, we can use BigMarket to load it and run
a simulation using this loaded network. For do this, the user web interface simplify the
method of write queries for Neo4J (we will explain it in user web interface section).
Neo4J implements a REST API that allows us to send JSON objects with the information of the network in order to store it in the database.
Now we have introduce each part of the Neo4J used in BigMarket, we will explain it in
more detail. We show too the implementation of each part in order to make this module
more comprehensible by the users:
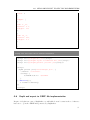
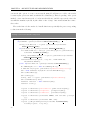
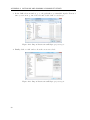
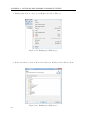
• Create network with Neo4J queries: as we comment at the start of this section, Neo4J
allows us to create (or modify) a network using its queries. Like Neo4J is a graph
database, its queries are oriented to the building of graphs so we can create a network or modify and existing network using few queries (note that if you want to do
more complex networks, maybe you should study with more detail the possibilities of
Neo4J).So the basics queries that allows us to interact with the graphs that store our
networks are the following:
Listing 4.5: Query get data
MATCH ( n ) RETURN n LIMIT 100
Listing 4.6: Create node
CREATE ( n {name : "World" } ) RETURN "hello" , n . name
Listing 4.7: Query relationship
MATCH ( martin { name : ’Martin Sheen’ } )−−>(movie )
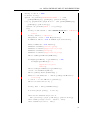
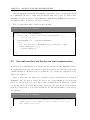
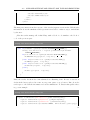
• Save network in database: to do this, we will use the Neo4J REST API, with this, we
can send a request to Neo4J with the information of the network in a JSON object.
The code that allow us to do this is.
Listing 4.8: Save network
private void createNodes ( ) {
50
4.4. NEO4J DATABASE AND ITS IMPLEMENTATION
S t r i n g l o c a t i o n = null ;
nodeUris . c l e a r ( ) ;
System . out . p r i n t l n ( "SIMULATION NODES : " + sim .
getGraphManager ( ) . getGraph ( ) . getNodeCount ( ) ) ;
f o r ( o r g . graphstream . graph . Node n : sim . getGraphManager ( ) .
getGraph ( ) . getNodeSet ( ) ) {
System . out . p r i n t l n ( "NODE " + n . g e t I d ( ) ) ;
try {
S t r i n g n o d e P o i n t U r l = t h i s . SERVER ROOT URI + "/db/data/
node/" ;
S t r i n g d a t a s e t = "dataset" ;
H t t p C l i e n t c l i e n t = new H t t p C l i e n t ( ) ;
PostMethod mPost = new PostMethod ( n o d e P o i n t U r l ) ;
Header mtHeader = new Header ( ) ;
mtHeader . setName ( "content-type" ) ;
mtHeader . s e t V a l u e ( "application/json" ) ;
mtHeader . setName ( "accept" ) ;
mtHeader . s e t V a l u e ( "application/json" ) ;
mPost . addRequestHeader ( mtHeader ) ;
S t r i n g R e q u e s t E n t i t y r e q u e s t E n t i t y = new
S t r i n g R e q u e s t E n t i t y ( "{}" ,
"application/json" ,
"UTF-8" ) ;
mPost . s e t R e q u e s t E n t i t y ( r e q u e s t E n t i t y ) ;
c l i e n t . executeMethod ( mPost ) ;
mPost . getResponseBodyAsString ( ) ;
Header l o c a t i o n H e a d e r =
mPost . getResponseHeader ( "
location" ) ;
l o c a t i o n = locationHeader . getValue ( ) ;
mPost . r e l e a s e C o n n e c t i o n ( ) ;
S t r i n g data = sim . g e t S i m D a t a s e t ( ) ;
n o d e U r i s . put ( n . g e t I d ( ) , l o c a t i o n ) ;
this . saveNodeRelations ( location ,
sim . g e t U s e r s ( ) . g e t ( n . g e t I n d e x ( ) ) . g e t F o l l o w e r s ( ) ) ;
t h i s . addProperty ( l o c a t i o n , d a t a s e t , data ) ;
t h i s . addLabel ( l o c a t i o n , data ) ;
51
CHAPTER 4. ARCHITECTURE AND IMPLEMENTATION
} catch ( E x c e p t i o n e ) {
System . out . p r i n t l n ( "Exception in creating node in neo4j
: " + e) ;
}
}
}
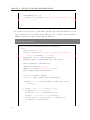
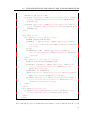
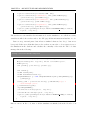
• Load network from database: at the same way like save network in database, we can
load a network stored previously in the database. To do this we follow a method
similar to that used to save a network in the database:
Listing 4.9: Load network
p u b l i c v o i d get N od e sP e r La be l ( S t r i n g labelName ) {
try {
S t r i n g r e s p o n s e = "" ;
S t r i n g n o d e P o i n t U r l = "http://localhost:7474/db/data/
label/" + labelName + "/nodes" ;
H t t p C l i e n t c l i e n t = new H t t p C l i e n t ( ) ;
GetMethod mGet = new GetMethod ( n o d e P o i n t U r l ) ;
Header mtHeader = new Header ( ) ;
mtHeader . setName ( "accept" ) ;
mtHeader . s e t V a l u e ( "application/json" ) ;
mGet . addRequestHeader ( mtHeader ) ;
c l i e n t . executeMethod (mGet) ;
r e s p o n s e = mGet . getResponseBodyAsString ( ) ;
JsonArray r o o t = ( JsonArray )new J s o n P a r s e r ( ) . p a r s e (
response ) ;
f o r ( i n t i = 0 ; i < r o o t . s i z e ( ) ; i ++){
JsonElement e = r o o t . g e t ( i ) ;
JsonObject obj = e . getAsJsonObject ( ) ;
S t r i n g s = o b j . g e t ( "self" ) . t o S t r i n g ( ) ;
S t r i n g f i n a l S = s . s u b s t r i n g ( 1 , s . l e n g t h ( ) −1) ;
n o d e s R e t r i e v e . add ( f i n a l S ) ;
}
52
4.4. NEO4J DATABASE AND ITS IMPLEMENTATION
} catch ( E x c e p t i o n e ) {
System . out . p r i n t l n ( "Exception in creating node in neo4j : "
+ e) ;
}
System . out . p r i n t l n ( n o d e s R e t r i e v e ) ;
}
public void getNodeRelations ( ) {
for ( String s : nodesRetrieve ){
try {
S t r i n g r e s p o n s e = "" ;
S t r i n g n o d e P o i n t U r l = s + "/relationships/out" ;
H t t p C l i e n t c l i e n t = new H t t p C l i e n t ( ) ;
GetMethod mGet = new GetMethod ( n o d e P o i n t U r l ) ;
Header mtHeader = new Header ( ) ;
mtHeader . setName ( "accept" ) ;
mtHeader . s e t V a l u e ( "application/json" ) ;
mGet . addRequestHeader ( mtHeader ) ;
c l i e n t . executeMethod (mGet) ;
r e s p o n s e = mGet . getResponseBodyAsString ( ) ;
JsonArray r o o t = ( JsonArray ) new J s o n P a r s e r ( ) . p a r s e (
response ) ;
f o r ( i n t i = 0 ; i < r o o t . s i z e ( ) ; i ++){
JsonElement e = r o o t . g e t ( i ) ;
JsonObject obj = e . getAsJsonObject ( ) ;
S t r i n g s t = o b j . g e t ( "end" ) . t o S t r i n g ( ) ;
S t r i n g f i n a l S = s t . s u b s t r i n g ( 1 , s t . l e n g t h ( ) −1) ;
r e l a t i o n s R e t r i e v e . put ( s , f i n a l S ) ;
}
} catch ( E x c e p t i o n e ) {
System . out . p r i n t l n ( "Exception in creating node in neo4j
: " + e) ;
}
}
System . out . p r i n t l n ( r e l a t i o n s R e t r i e v e ) ;
53
CHAPTER 4. ARCHITECTURE AND IMPLEMENTATION
}
4.5
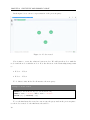
SigmaJS graph visualizator and its implementation
In this section we will explain how the user can see the structure of the network at the end
of the simulation simply with one click. This representation helps the user to see a final
photography of the network.
SigmaJS allows us to represent a graph in an HTML file using JavaScript and JSON.
For a correct visualization of the network, first of all, we have to parse the network to JSON.
Once the JSON is built and save in a file, we can attach it to the HTML that includes the
JavaScript code for SigmaJS. To understand it better we provide here an example of a little
network in JSON format and the lines of JavaScript necessary in our HTML file.
First, we can see the implementation of the function than extract the information of the
network in a JSON file. Then, we show the code necessary to visualise the network in an
HTML file:
Listing 4.10: Network in JSON
{
"nodes" : [
{
"id" : "0" ,
"label" : "0" ,
"x" : 1 ,
"y" : 2 ,
"size" : 6
} ,{
"id" : "1" ,
"label" : "1" ,
"x" : 0 ,
"y" : 2 ,
"size" : 6
} ,{
"id" : "2" ,
"label" : "2" ,
"x" : 1 ,
"y" : 0 ,
54
4.6. GEPHI AND EXPORT TO GEXF FILE IMPLEMENTATION
"size" : 6
}
],
"edges" : [
{
"id" : "0_1" ,
"source" : "0" ,
"target" : "1"
},
{
"id" : "2_0" ,
"source" : "2" ,
"target" : "0"
}
]
}
Listing 4.11: Java script code for network visualization
< s c r i p t s r c="js/sigma.min.js"></ s c r i p t >
< s c r i p t s r c="js/sigma.layout.forceAtlas2.min.js"></ s c r i p t >
< s c r i p t s r c="js/sigma.parsers.json.min.js"></ s c r i p t >
<s c r i p t >
sigma . p a r s e r s . j s o n ( ’networkGraph.json’ , {
c o n t a i n e r : ’container’ ,
settings : {
d e f a u l t N o d e C o l o r : ’#337AB7’
}
} , function ( s ) {
s . startForceAtlas2 ()
}) ;
</ s c r i p t >
4.6
Gephi and export to GEXF file implementation
Despite of Gephi is no part of BigMarket, we will talk about it because is the tool that we
have use to open the .GEXF files generated by BigMarket.
55
CHAPTER 4. ARCHITECTURE AND IMPLEMENTATION
Once the simulation has finished, BigMarket offers us the option to download the graph
in a .GEXF file in order to make network analysis with more detail. To achieve this,
BigMarket converts the graph to Graph Exchange XML Format (GEXF) and saves it in a
file. This file will be download to the user’s computer.
The code that allows this conversion is the following:
Listing 4.12: Save graph in .GEXF file
p r i v a t e v o i d exportGraphGEXF ( ) {
S t r i n g path = g e t S e r v l e t C o n t e x t ( ) . getRealPath ( "/" ) + "
grafoInicial.gexf" ;
FileSinkGEXF f i l e = new FileSinkGEXF ( ) ;
try {
f i l e . w r i t e A l l ( sim . getGraphManager ( ) . getGraph ( ) , path ) ;
} catch ( IOException e ) {
e . printStackTrace () ;
}
}
4.7
User web interface and Servlet and their implementation
In this section we will explain how works the user web interface and the BigMarket servlet.
We explain this at the end of the chapter because these parts are the glue that tie the parts
explained until now. In this section, we explain the code, leaving the explanation of the
GUI for the chapter 5.
First of all we have the index page, in which we find a bit introduction of what is
BigMarket. Once we click on “Start”, we enter to the “Setup simulation” screen. In this
screen, we can choose how we are going to build our initial network. This page contains
a form that allows the servlet knows what options the user has chosen (create random
network, load network or create network with Neo4J). The implementation of the form is
the following:
Listing 4.13: Save graph in .GEXF file
<form a c t i o n="BigMarketServlet" method="POST" name="setup-form">
<i n p u t type="hidden" name="formName" v a l u e="setupForm"/>
<d i v c l a s s="jumbotron">
56
4.7. USER WEB INTERFACE AND SERVLET AND THEIR IMPLEMENTATION
<h4>S e l e c t an o p t i o n :</h4>
<p><i n p u t type="radio" name="networks" i d="random" v a l u e="
random" o n c l i c k="randomNetworkSelected()">New random
network </p>
<p><i n p u t type="radio" name="networks" i d="load" v a l u e="
load" o n c l i c k="loadNetworkSelected()">Load network from
DataBase</p>
</div>
<d i v c l a s s="row">
<d i v c l a s s="col-lg-4" i d="col-left">
<h4>New random network </h4>
<p>Number o f i n i t i a l nodes : <i n p u t type="text" c l a s s="
form-control" i d="numNodes" name="numNodes" d i s a b l e d="
true"></p>
<p></p>
<p>S i m u l a t i o n name : <i n p u t type="text" c l a s s="formcontrol" i d="nameRandom" name="nameRandom" d i s a b l e d="
true"></p>
</div>
<d i v c l a s s="col-lg-4" i d="col-right">
<h4>Load network from DataBase</h4>
<p>D a t a s e t i d e n t i f i e r : <i n p u t type="text" c l a s s="formcontrol" i d="datasetIdentifier" name="dataset"
d i s a b l e d="true"></p>
<p>New name f o r s i m u l a t i o n :
<i n p u t type="text" c l a s s="form-control" i d="newLoadName"
name="newLoadName" d i s a b l e d="true"></p>
<p><i n p u t type="button" c l a s s="btn btn-primary" v a l u e="
Create network" i d="createButton" d i s a b l e d="true"
o n c l i c k="createNetwork()"></p>
</div>
</div>
<d i v c l a s s="setup-button">
<p a l i g n="center"><button type="submit" c l a s s="btn btnprimary" i d="submitButton">Setup !</ button ></p>
</div>
</form>
The form has an option to mark if the user wants to create a random network or load
57
CHAPTER 4. ARCHITECTURE AND IMPLEMENTATION
a network (the option of create a new network using Neo4J has not a call to the servlet
because it just open a new window with the Neo4J interface). Then, depending of the option
marked, create random network or load network fields are enabled respectively. Once the
user fills the mandatory fields, he/she clicks on the “Setup” button and submit the form to
the servlet.
The servlet has a doGet method to handle this form, specifically the part corresponding
to this form is the following:
Listing 4.14: Servlet handle setup form
S t r i n g formName = r e q u e s t . getPa ramet er ( Co ns ta nts .FORM NAME) ;
i f ( formName . e q u a l s ( Cons t a n t s .SETUP FORM NAME) ) {
S t r i n g r a d i o B u t t o n s = r e q u e s t . get Parame ter ( C on s ta nt s .
RADIO BUTTONS NAME) ;
i f ( r a d i o B u t t o n s . e q u a l s ( Co n st an t s .RANDOM SELECTED) ) {
i n t numberOfNodes = I n t e g e r . p a r s e I n t ( r e q u e s t . get Par amete r (
Constants .NUMBER OF NODES) ) ;
S t r i n g randomNetworkName = r e q u e s t . get Parame ter ( C on s ta nt s .
RANDOM NETWORK NAME) ;
l a u n c h S i m u l a t i o n ( r e q u e s t , r e s p o n s e , numberOfNodes ,
randomNetworkName ) ;
} e l s e i f ( r a d i o B u t t o n s . e q u a l s ( Co n st an t s .LOAD SELECTED) ) {
Neo4JManageTool n = new Neo4JManageTool ( ) ;
n . launchLoad ( r e q u e s t . g et Par ameter ( "datasetIdentifier" ) ) ;
sim = new S i m u l a t i o n ( System . c u r r e n t T i m e M i l l i s ( ) ) ;
sim . setDataBase ( n ) ;
sim . s e t F l a g ( 2 ) ;
S t r i n g data = r e q u e s t . getPa ramete r ( "newLoadName" ) ;
sim . setSimDataSet ( data ) ;
Launcher l a u n c h e r = new Launcher ( sim ) ;
launcher . s t a r t () ;
r e q u e s t . s e t A t t r i b u t e ( "broadUsers" , g e t B r o a d U s e r s ( sim ) ) ;
r e q u e s t . s e t A t t r i b u t e ( "acqUsers" , getAqUsers ( sim ) ) ;
r e q u e s t . s e t A t t r i b u t e ( "oddUsers" , getOddUsers ( sim ) ) ;
r e q u e s t . s e t A t t r i b u t e ( C o n s t a n t s . STEPS , sim . s c h e d u l e . g e t S t e p s
() ) ;
r e q u e s t . s e t A t t r i b u t e ( C o n s t a n t s . SIM , sim ) ;
r e q u e s t . g e t R e q u e s t D i s p a t c h e r ( Co ns t a n t s .RUNNING PAGE) .
forward ( request , response ) ;
58
4.7. USER WEB INTERFACE AND SERVLET AND THEIR IMPLEMENTATION
}
First of all, the servlet checks if the form submitted is a Setup simulation form. Then, check
if the user wants to create a random network or load a network. Depending of the user’s
choice, the servlet execute a code block or other.
Once the initial network has been setup, the user can run the simulation. To do this,
BigMarket enables in the Running page a form similar to the Setup form. The code of this
form is the following:
Listing 4.15: Servlet handle setup form
<d i v c l a s s="action-buttons">
<form a c t i o n="BigMarketServlet" method="POST" name="running
">
<i n p u t type="hidden" name="formName" v a l u e="runningForm"
/>
<i n p u t type="submit" c l a s s="btn btn-primary" v a l u e="Run
one step" i d="runOneStepButton" onCLick="clickROS()">
<i n p u t type="submit" c l a s s="btn btn-primary" v a l u e="Run"
i d="runButton" o n C l i c k="clickRun()">
<i n p u t type="submit" c l a s s="btn btn-primary" v a l u e="Pause
" i d="pauseButton" o n C l i c k="clickPause()">
<i n p u t type="submit" c l a s s="btn btn-primary" v a l u e="Stop"
i d="StopButton" o n C l i c k="clickStop()">
<i n p u t name="actionSelected" type="hidden" v a l u e="default
" i d="actionSelected">
</form>
</div>
This form has a hidden field which store the value of the option selected by the user. This
field will be read by the servlet in order to make an action according to the user choice.
The running page also show dynamically the information about the simulation (steps,
number and types of users and number of tweets of each user type). The code that allows
this is the following:
Listing 4.16: Servlet handle setup form
<%
59
CHAPTER 4. ARCHITECTURE AND IMPLEMENTATION
I n t e g e r broadUsers = ( I n t e g e r ) request . g e tA t tr i bu t e ("
broadUsers" ) ;
I n t e g e r a c q U s e r s = ( I n t e g e r ) r e q u e s t . g e t A t t r i b u t e ( "aqUsers" ) ;
I n t e g e r oddUsers = ( I n t e g e r ) r e q u e s t . g e t A t t r i b u t e ( "oddUsers" ) ;
I n t e g e r oddTweets = ( I n t e g e r ) r e q u e s t . g e t A t t r i b u t e ( "oddTweets"
);
I n t e g e r acqTweets = ( I n t e g e r ) r e q u e s t . g e t A t t r i b u t e ( "acqTweets
") ;
I n t e g e r broadTweets = ( I n t e g e r ) r e q u e s t . g e t A t t r i b u t e ( "
broadTweets" ) ;
Long s t e p s = ( Long ) r e q u e s t . g e t A t t r i b u t e ( "steps" ) ;
S i m u l a t i o n sim = ( S i m u l a t i o n ) r e q u e s t . g e t A t t r i b u t e ( "sim" ) ;
%>
<d i v c l a s s="jumbotron">
<t a b l e c l a s s="table table-striped" i d="tableA">
<t r >
<th>Time s t e p </th>
<td><%=s t e p s%></td>
</t r >
</div>
<d i v c l a s s="row">
<t a b l e c l a s s="table table-striped" i d="tableB">
<t r >
<th>User type </th>
<th>Number o f u s e r s </th>
<th>Number o f t w e e t s w r i t e d </th>
</t r >
<t r >
<th>B r o a d c a s t e r </td>
<td><%=b r o a d U s e r s%></td>
<td><%=broadTweets%></td>
</t r >
<t r >
<th>Acquaintances </td>
<td><%=a c q U s e r s%></td>
<td><%=acqTweets%></td>
</t r >
<t r >
<th>Odd u s e r s </td>
60
4.7. USER WEB INTERFACE AND SERVLET AND THEIR IMPLEMENTATION
<td><%=oddUsers%></td>
<td><%=oddTweets%></td>
</t r >
</t a b l e >
</div>
The first part extract from the response of the servlet (request seen from the JSP file) the
information about the simulation and represent it in a table to make it easy to understand
by the user.
¿How the servlet manage all of this? Easy, with a block of code similar to the block of
code of the previous part.
Listing 4.17: Servlet handle setup form
} e l s e i f ( formName . e q u a l s ( C o n s t a n t s .RUNNING FORM NAME) ) {
S t r i n g a c t i o n S e l e c t e d = r e q u e s t . getP aramet er ( C o n s t a n t s .
ACTION SELECTED) ;
i f ( a c t i o n S e l e c t e d . e q u a l s ( C o ns ta n ts . RUN ONE STEP) ) {
clickRunOneStep ( r e q u e s t , r e s p o n s e ) ;
} e l s e i f ( a c t i o n S e l e c t e d . e q u a l s ( C o ns ta n ts .RUN) ) {
clickRun ( request , response ) ;
} e l s e i f ( a c t i o n S e l e c t e d . e q u a l s ( C o ns ta n ts .PAUSE) ) {
clickPause ( request , response ) ;
} else {
clickStop ( request , response ) ;
}
}
First, the servlet checks if the form submitted is a Running form. In case of success, it
checks if the button selected is a run one step, run, pause or stop button. But, ¿how the
servlet give to the JSP the information about the simulation? To answer this question here
it goes an example:
Listing 4.18: Servlet handle setup form
r e q u e s t . s e t A t t r i b u t e ( "broadUsers" , g e t B r o a d U s e r s ( sim ) ) ;
r e q u e s t . s e t A t t r i b u t e ( "aqUsers" , getAqUsers ( sim ) ) ;
r e q u e s t . s e t A t t r i b u t e ( "oddUsers" , getOddUsers ( sim ) ) ;
r e q u e s t . s e t A t t r i b u t e ( C o n s t a n t s . STEPS , sim . s c h e d u l e . g e t S t e p s ( ) ) ;
61
CHAPTER 4. ARCHITECTURE AND IMPLEMENTATION
r e q u e s t . s e t A t t r i b u t e ( Co n s t a n t s . SIM , sim ) ;
r e q u e s t . s e t A t t r i b u t e ( "oddTweets" , sim . getEventManager ( ) .
g e t S t a t i s t i c s ( ) . getOddTweets ( ) ) ;
r e q u e s t . s e t A t t r i b u t e ( "broadTweets" , sim . getEventManager ( ) .
g e t S t a t i s t i c s ( ) . getBroadTweets ( ) ) ;
r e q u e s t . s e t A t t r i b u t e ( "acqTweets" , sim . getEventManager ( ) .
g e t S t a t i s t i c s ( ) . getAcqTweets ( ) ) ;
r e q u e s t . g e t R e q u e s t D i s p a t c h e r ( Co ns t a n t s .RUNNING PAGE) . f o r w a r d (
request , response ) ;
The servlet stores in variables the information about the simulation, once all the necessary
variables are filled, the servlet sends to the JSP page all the information in last line of code.
Run one step, run and pause button have a similar behaviour, but “Stop” button is a
bit special. If the user clicks this button, the servlets executes the code necessary for store
the simulation in the database and calculate the centrality of the network. The code that
manage this is the following:
Listing 4.19: Servlet handle setup form
private void c l i c k S t o p ( HttpServletRequest request ,
H t t p S e r v l e t R e s p o n s e r e s p o n s e ) throws S e r v l e t E x c e p t i o n ,
IOException {
sim . getGui ( ) . g e t C o n s o l e ( ) . p r e s s S t o p ( ) ;
sim . f i n i s h ( ) ;
neoDB . s e t Si m ( sim ) ;
neoDB . launchDatabaseTool ( ) ;
GraphJSONParser g = new GraphJSONParser ( sim . getGraphManager ( ) .
getGraph ( ) ) ;
S t r i n g path = g e t S e r v l e t C o n t e x t ( ) . getRealPath ( "/" ) + "
networkGraph.json" ;
g . l a u n c h P a r s e r ( path ) ;
exportGraphGEXF ( ) ;
calculateCloseness ( request , response ) ;
calculateBetweenness ( request , response ) ;
r e q u e s t . g e t R e q u e s t D i s p a t c h e r ( Co ns t a n t s . ACTIONS PAGE) . f o r w a r d (
request , response ) ;
}
Like we can see in the code, first of all the simulation is finished, then the Neo4J tool is
62
4.8. CONCLUSION
initialized and launched (it stores the network in the database). Then, the JSON file for
the network visualization is generated. Next step is saving the graph in a GEXF file and
finally, the centrality is calculated and the user interface goes to the next screen (Actions
page).
In this last screen of the simulation, called “Actions” we can see four tables with the
information about the centrality and two buttons that allows us to see the network and y
download the graph in a GEXF file.
The way to represent the centrality in the tables is similar to the way showed for the
simulation information so we have no copy here the code. The “See network” visualization
simply opens a new window with the visualization showed at 4.5 and the “Download graph”
saves the GEXF file in the user’s computer as we explained in section 4.6.
4.8
Conclusion
In this chapter, we have seen how each part of BigMarket works and how all interact between
them to build a simply SNSA framework. In the next chapter, we select an use case and
we will use it to explain in detail how the user interface works.
63
CHAPTER 4. ARCHITECTURE AND IMPLEMENTATION
64
CHAPTER
Prototype and example usage
In this chapter, we are going to describe a selected use case by explaining the running
of all the tools involved and its purpose and responses. Thank to these use cases,
we will show the overall performance of the application and all the main functions
available to the user.
65
5
CHAPTER 5. PROTOTYPE AND EXAMPLE USAGE
66
5.1. INTRODUCTION
5.1
Introduction
In this chapter, we will explain in detail a use case. For explain with more detail the use
of BigMarket we will create three networks at the begin (in order to explain the three
ways to create and use a network in the simulation). Then we will choose one of the three
networks created and we will use it for run a simulation. After, we will see the results of
the centrality analysis and the network using the SigmaJS visualizator. Finally, we will
download the graph in a GEXF file and we will analyse it with the Gephi framework.
These three networks will be the next:
• Random network: with this option we will create a new random network with a initial
number of nodes of 100. The BigMarket engine will be the responsible of establishing
the relationships between each node.
• Creating network with Neo4J: we will create a new network using the Neo4J framework. In the past section, we will show a few queries that allows us to create nodes
and relationships between them. Now, we will use them to create a full network.
• Loading network from database: the last network selected will be a network stored in
the database, we will use the network created in the previous point.
5.2
Random network
Once we are in the setup screen, we will select the option of create a new random network.
We will introduce an initial number of nodes of 100 and we will call the network “Random
network”. So when we have completed these steps we will have a “Setup simulation” screen
like the figure 5.1
67
CHAPTER 5. PROTOTYPE AND EXAMPLE USAGE
Figure 5.1: 100-Node Random network setup.
Finally we click on “Setup” button and the network will be created (This action does
not save the network in the database, just create the network to use it in the simulation).
5.3
Creating network with Neo4J
For creating a new network using the queries from Neo4J, first, we have to go to the “Setup
simulation” screen and select the option “Load network from database”. Once we have
selected this option, the button for creating a new network (or modify an existing network)
will be enabled. If we click this button, a new window displaying the Neo4J web interface
will be opened.
In this new window, represented in the figure 5.2, we will use the Neo4J queries to create
the nodes and establish relationships between them. A network with three nodes and two
relationships will be enough.
68
5.3. CREATING NETWORK WITH NEO4J
Figure 5.2: Neo4J interface.
First of all, we will create the three nodes. To do this, we write these queries in the
Neo4J interface.
Listing 5.1: Creating node 1
CREATE ( n : CreateNetwork { name : ’Node1’ } )
Listing 5.2: Creating node 2
CREATE ( n : CreateNetwork { name : ’Node2’ } )
Listing 5.3: Creating node 3
CREATE ( n : CreateNetwork { name : ’Node3’ } )
The label (CreateNetwork) will be used to know to what simulation belongs the node and
the name (Node1, Node2 and Node3) will identify the node inside the simulation.
Once we have created the three nodes we can see them using the next query:
Listing 5.4: Nodes created
MATCH ( n : CreateNetwork ) RETURN n LIMIT 25
69
CHAPTER 5. PROTOTYPE AND EXAMPLE USAGE
In the figure 5.3 we can see a representation of the previous query:
Figure 5.3: Nodes created.
Now is time to create the relations between nodes. We will join the node 1 with the
node 2 and the node 3 with the node 1. Note the direction of the relationship is important
so:
• Node1 — Node2
• Node3 — Node1
To do this we write in the Neo4J interface the next query:
Listing 5.5: Nodes created
MMATCH ( a : CreateNetwork ) , ( b : CreateNetwork )
WHERE a . name = ’Node1’ AND b . name = ’Node2’
CREATE ( a ) −[ r :RELTYPE]−>(b )
To see the final network created we can execute the query used in the previous pint to
see the nodes created. So the final network would be:
70
5.4. LOADING NETWORK FROM DATABASE
Figure 5.4: Final network.
5.4
Loading network from database
In the lasts sections, we had created two networks. Now, is time to load one of this and
execute a simulation with it. We will load the network created using Neo4J. To do this, in
the “Setup simulation”, we have to select the options and fills the fields like in the figure
5.5. In the “Dataset identifier” field we will introduce the name of the simulation that we
want to load and in the “New name for simulation field”, we will introduce the name which
the network will be saved at the end of the simulation.
71
CHAPTER 5. PROTOTYPE AND EXAMPLE USAGE
Figure 5.5: Load network setup.
Finally we click on “Setup” button and the network will be loaded. In the next section
we will run a simulation with this network.
5.5
Running the simulation of the loaded network
Once we have clicked on the “Setup!” button, BigMarket leads us to the “Running” screen.
Meanwhile, the MASON step engine is booted.
In this screen we have the option to run one step of the simulation or simply let it running
indefinitely until we want to pause it. In this screen we can also see the information of the
simulation (number of users and its type, the tweets and the steps) like we can see in the
figure 5.6. Once we want to finish the simulation, we have to click the “Stop” button and
Neo4J will save the simulation for us.
72
5.6. RESULTS SCREEN AND FINAL ACTIONS
Figure 5.6: Running the simulation.
As we can see in the figure 5.6, in the step 21 we have 4 broadcasters that have written
37 tweets and 720 odd users that have written 72 tweets. In this point we can resume the
simulation or finish it.
5.6
Results screen and final actions
The last screen of our simulation shows the results of four centrality measures: betweeness,
closeness, in degree and out degree, like we can see in the figure 5.7. We can reach this
screen by pushing the “Stop” button in the “Running” screen.
In this screen showed in the figure 5.7 we have the option to see the network created
during the simulation and download it for analyze with a SNA tool.
73
CHAPTER 5. PROTOTYPE AND EXAMPLE USAGE
Figure 5.7: Results of the simulation.
If we click on the “See network button” we can see the network at the end of the
simulation like we show in the figure 5.8.
Figure 5.8: Network visualization.
Finally, we can download the graph in a GEXF file and analyse it with Gephi.
74
5.7. CONCLUSION
5.7
Conclusion
In this chapter, we have explained and extended use case for BigMarket, so that the user
can have a global view of the BigMarket framework. In the next chapter, we will resume
the conclusions and the results of this master thesis.
75
CHAPTER 5. PROTOTYPE AND EXAMPLE USAGE
76
CHAPTER
Conclusions and future lines
This chapter summarizes the conclusions extracted from this master thesis and the
objectives achieved are evaluated. After that, we describe thinking about future work.
77
6
CHAPTER 6. CONCLUSIONS AND FUTURE LINES
78
6.1. CONCLUSIONS
6.1
Conclusions
By using different papers that represent a variety of mathematics models [3] [4] that allows
modelling different types of networks, we have created a tool that allows the user to build a
network from zero and make it evolve in time simply selecting the number of initial nodes.
Due to integration with a database, the user is able to store the network that he/she has
been created in order to recover the network for future uses for restarting it or simply change
the conditions and see how the simulation and the network evolves in the new situations.
The tool also provides a functionality for creating an specifv network using the Neo4J
query commands. Thanks to this, the user is able to build a network that satisfies his/her
needs, like a specific start situation, the relationships between the users at the beginning of
the simulation, establish the broadcasters, the acquaintances and the odd users, etc.
Finally, the tool allows the user to see the network that he/she has been created on
the browser, or download it in a file in order to analyse it with and SNA tool. Although
BigMarket gives to the user some SNA data like closeness or betweeness, the user maybe
wants to achieve their own analysis.
6.2
Achieved goals
In this section, we will analyse the goals established at the beginning of this master thesis
and see if them has been achieved:
• Developing a free web framework to facilitate the access to SNSA (social network
simulation and analysis) tools for any user independently of his/her computer skills:
this goal has been achieved successfully. We have developed a tool that allows the
user to build a network from scratch and run a simulation without any programing
knowledge, simply following the steps in the GUI and all of it in his/her browser. Also
he/she can obtain the results of the SNA directly in the browser. BigMarket allows
analyse the following results: betweeness, closeness, in degree and out degree.
• Saving time to the users when they want to make a SNSA implementing a framework
that allows an easy configuration of the network and of the simulation: this goal has
been achieved successfully. BigMarket allows the user to build a network and configure
a simulation with few steps so it saves the user time.
• Integrating Big Data technologies into the framework. More specifically, with a noSQL
79
CHAPTER 6. CONCLUSIONS AND FUTURE LINES
graph database: this goal has been achieved successfully. We have integrating into the
framework Neo4J database, it allows the user to store his/her simulation and the
network in a database.
• Facilitating familiarization of new developers with the SNSA tools because it offers a
base for supply new developments: this goal has been achieved successfully. BigMarket
has been programmed following the rules of modularity. The behaviours of the users
are independent, it means that you can program your own behaviour and assign it to
an user of the network. You can also program how the network evolve in time.
In view of these results we can say that all the goals marked at the beginning of this
master thesis has been achieved succesfully.
6.3
Future work
There are several lines than can be followed to continue and extend features of this work.
In the following points some fields of study or improvement are presented to continue
the development.
• In order to make the framework more accessible, it will be necessary to make it
responsive, so the user can use BigMarket from a tablet or smartphone in order to
make the application more accessible and that it can reach more users.
• Implement user session. The idea is to make a simple login in order to allow the user
to store their networks and simulations with privacy, so only him/her can load these
simulations in the future.
• Modify the behaviours in real time. Now, once the network has been created, the user
have not control over it, the BigMarket engine is the one which controls the behaviour
assignment. So in the future the idea is that the user can stop the simulation and
modify it introducing new agents or modifying whose exist yet.
• List with examples of simulations. Give to the user a group of example networks.
Simply accessible by deploying a list in the tool GUI.
• Implement the role of administrator. Create the role of administrator of BigMarket,
who manages the permissions of the different users, manage the database, solve the
problems of the users, etc.
80
APPENDIX
A
Installing and running a BigMarket server
This tutorial goes through the process of installing and running BigMarket in any computer
with a Windows OS. Project’s code is available at https://github.com/gsi-upm/BigMarket.git.
After the installation, the user will be able to run the application itself or to modify the
source files in order to introduce his own changes.
81
APPENDIX A. INSTALLING AND RUNNING A BIGMARKET SERVER
82
A.1. INSTALLATION
A.1
A.1.1
Installation
Requirements
• JDK 1.7
1
• Apache Tomcat 7.0
• Eclipse
3
• Neo4J
4
• Gephi
5
• Git
A.1.2
2
6
Downloading the source code
For downloading the source code from Git, you have to follow these steps:
1. Create the file system where you are going to clone the git repository.
2. Open Git Bash and go to the path created in the previous step.
3. Once you are in the path, execute the next command:
git clone https://github.com/gsi-upm/BigMarket.git
If all has gone well, you have to see a screen like this:
Figure A.1: Git Bash console capture.
Now you have the source code in your own computer.
1
http://www.oracle.com
http://tomcat.apache.org/
3
https://eclipse.org/
4
http://neo4j.com/
5
http://gephi.github.io/
6
http://git-scm.com/
2
83
APPENDIX A. INSTALLING AND RUNNING A BIGMARKET SERVER
A.1.3
Importing the project in Eclipse
In this section, we will explain how to import the project in Eclipse. In the previous section,
we obtained the source code from GitHub, so we will continue from that point. In order to
import the project in Eclipse, you have to follow the next steps:
1. Open Eclipse
2. Right click on the Project explorer view and select Import.
3. In the new window, select Git - Projects from Git.
Figure A.2: Import project from Git step 3.
84
A.1. INSTALLATION
4. Select “Existing local repository”.
Figure A.3: Import project from Git step 4.
5. Click in “Add” in order to add a new Git repository.
Figure A.4: Import project from Git step 5.
85
APPENDIX A. INSTALLING AND RUNNING A BIGMARKET SERVER
6. Select the path where you downloaded the BigMarket code in the previous section,
mark the repository and click in finish.
Figure A.5: Import project from Git step 6.
7. Once you have chosen the repository, click in Next.
Figure A.6: Import project from Git step 7.
86
A.1. INSTALLATION
8. Now select the option “Import as general project” and click in Next.
Figure A.7: Import project from Git step 8.
9. Finally, choose a name for your project (in our case BigMarket) and click in Finish.
Figure A.8: Import project from Git step 9.
87
APPENDIX A. INSTALLING AND RUNNING A BIGMARKET SERVER
Now you have the project imported in Eclipse. But it is not an Eclipse project yet, so
in the next lines, we will explain you how to convert the project imported into an Eclipse
project.
A.1.4
Converting the project into an Eclipse project
In the last section, we saw how to import the project downloaded from Git in Eclipse.
Now, is time to convert this project into an Eclipse project in order to work with it in our
workspace.
To do this, you have to complete this step:
Select the project and click on Project - Properties - Project Facets. Once you are in
this windows, select the boxes like in the figure A.9. When you have marked the boxes,
click on Apply and Ok.
Figure A.9: Convert the project into Eclipse project step 1.
Now, you have the project converted into a Eclipse project (specifically a Dynamic Web
Project), but there are errors in our project. In order to solve this, you have to import the
library servlet-api. To import a determined library in Eclipse, you have to follow the next
steps:
88
A.1. INSTALLATION
1. Right click on our project and select Build path - Configure build path...
Figure A.10: Import libraries in an Eclipse project step 1.
2. In the new window, select “Add external JARs...”.
Figure A.11: Import libraries in an Eclipse project step 2.
89
APPENDIX A. INSTALLING AND RUNNING A BIGMARKET SERVER
3. In the JAR selection window, go to the path where you installed Apache Tomcat 7.
Once you are in it, go into folder lib and double click on servlet-api.
Figure A.12: Import libraries in an Eclipse project step 3.
4. Finally, click on “Ok” and see how the errors are solved.
Figure A.13: Import libraries in an Eclipse project step 4.
90
A.2. RUN A BIGMARKET SERVER
A.1.5
Running the Neo4J database
In this subsection, we will teach you how to download the database and run it in order to
store your simulations.
1. First of all, you have to download the Neo4J database .exe from this link:
http://neo4j.com/download/
2. Once you have downloaded the .exe, execute it and follow the instructions.
3. When the installer ends the installation, you have to run the database server. To do
this, execute Neo4J Community application.
4. In the new window, click on “Start” and you will have finished this section.
A.2
A.2.1
Run a BigMarket Server
Introduction
In the past section, we saw how to import the project from Github, convert it into an
Eclipse project and finally how to solve the errors that appeared. Now, it is time to run
the server. In order to achieve this, we guide you through the next sections.
A.2.2
Building the WAR (Web application ARchive)
Apache Tomcat requires a WAR file to publishes a web application, so build a WAR file
from the project will be our first step. To achieve this, follow the next steps:
91
APPENDIX A. INSTALLING AND RUNNING A BIGMARKET SERVER
1. Firstly, right click on our project in Eclipse and select “Export”.
Figure A.14: Building the WAR step 1.
2. In the new window, click on Web folder and select WAR file, then click in “Next”.
Figure A.15: Building the WAR step 2.
92
A.2. RUN A BIGMARKET SERVER
Figure A.16: Building the WAR step 3.
A.2.3
Running a the application
There are two ways for running the application:
• Running the application in Eclipse: this way allows you to run Big Market in Eclipse.
To do this, follow the next steps:
1. Select the project and open the run icon. Select “Run As” and finally click on
“Run on server”.
Figure A.17: Running Big Market in Eclipse step 1.
2. In the new window, open the Apache folder and select “Tomcat v7.0 server”,
then click on “Next”.
93
APPENDIX A. INSTALLING AND RUNNING A BIGMARKET SERVER
Figure A.18: Running Big Market in Eclipse step 2.
3. In the last screen, select the path where you installed Apache Tomcat and finally
click on “Finish”.
Figure A.19: Running Big Market in Eclipse step 3.
• Deploying the WAR file in an Apache Tomcat server: by this way, you can deploy the
application in a Tomcat Server and run this server in order to make the application
accessible from the Internet or simply to test it by yourself. To achieve this objective,
follow the next steps:
1. In the previous subsection (Building the WAR), we built the WAR. Now, is time
94
A.2. RUN A BIGMARKET SERVER
to deploy it in our Apache Tomcat Server. To do this, go to the path where you
saved the WAR, copy the WAR generated, and finally, paste it in the following
path:
TOMCATHOME/webapps
2. Now, for running the server, open a shell (in Windows a cmd) and go to TOMCATHOME/bin. Once you are in this path, execute the next command:
startup.bat
If all has gone well, a new window will be opened (do not close this windows)
and few seconds later you should see this line:
Server startup in X ms
3. Finally, in order to check that all is alrigth, open a browser and go to:
http://localhost:8080/BigMarket/ 7
Now, you know how to import the code in your own computer, how to import it in
Eclipse in order to adapt the project to your own purposes and finally, you have learnt how
to run the application in a server in order to test it and probe the changes that you will
make to the code. In the next Appendix, we will teach you how to use the application on
the scenarios exposed in the use cases from the Chapter 3.
7
Change localhost to the IP address of the server machine if the client is in another host.
95
APPENDIX A. INSTALLING AND RUNNING A BIGMARKET SERVER
96
APPENDIX
User manual
This user manual goes through the most important features for users.
Like we men-
tioned in the last appendix, the code of the project is available at https://github.com/gsiupm/BigMarket.
97
B
APPENDIX B. USER MANUAL
98
B.1. RUN NEW RANDOM NETWORK SIMULATION
B.1
Run new random network simulation
In this section, we will explain you how to create a new random network simulation. This
is the simplest way to use BigMarket. In order to create a new random network simulation,
you have to follow the next steps.
1. First of all you have to have deployed the WAR in an Apache Tomcat Server and run
the server like we explained in the Appendix A.
2. Once you have completed the step 1, open a browser and go to http://localhost:8080/BigMarket.
3. Now, you should see the index page of the application. In this screen, click on start
in order to go to the set up screen.
Figure B.1: New random network simulation step 1.
4. Like the objective of this section is to teach you how to run a simulation for a random
network, you have to select “New random network” in the Set up screen like you can
see in the figure B.2. Then, you have to introduce the number of initial nodes of your
network. Finally, choose a name for your simulation (this name is important because
it will be the ID of your simulation when you have to store it in the database). Once
you have configured your simulation, click on “Set up!”.
99
APPENDIX B. USER MANUAL
Figure B.2: New random network simulation step 2.
5. In the running screen, you can start the simulation and establish if it runs without
stopping or just step by step. You have the following options:
• Run: with this option, the simulation will run until you press stop or pause
button.
• Run one step: as its own name means, with this option, you will run the simulation one step.
• Pause: this button allows you to pause the simulation if it is running.
• Stop: this button ends the simulation and leads you to the next screen.
100
B.1. RUN NEW RANDOM NETWORK SIMULATION
Figure B.3: New random network simulation step 3.
Once you press stop button, BigMarket will start to store the data in the database (if
you run BigMarket in your own computer, pay attention that Neo4J server is up like
we explained you in the previous appendix).
6. The next screen is the Actions screen. This screen is divided in two parts:
• SNA results: this part contains a table that represents the results from the
analysis of the simulation of the network that you have been created in the
previous steps.
• Actions: this part have two buttons. The first of them, the “See network” button,
allows you to see the network in a new window. The second button, “Download
graph” button, let you to download the graph in order to analyse it with a SNA
tool (like Gephi).
101
APPENDIX B. USER MANUAL
Figure B.4: New random network simulation step 4.
B.2
Load network
In this section, we will explain you how to load a network from a previous simulation. If
you run BigMarket in your own computer, pay attention to have the Neo4J server up. Now,
to load a network, follow the next steps:
1. In the index screen, press the “Start” button like in the step 1 of the previous section.
2. Now, in the “Set up” screen, you have to select the “Load network from DataBase”.
Then write the identifier of the simulation that you want to load and finally establish
a new name for the simulation in order to store it in the database. Once you have fill
all the fields, press the “Setup!” button.
102
B.3. CREATE A NETWORK
Figure B.5: Load network step 1.
In the following section, we will explain you the use of the “Create network” button.
3. The next screen is the “Running” screen, and its use is the same as we explained in
the step 5 of the previous section.
4. The use of the last screen, “Actions” screen, is the same of the step 6 of the previous
section.
B.3
Create a network
This section explain you how to create a network. The creation of a network is based on
the Neo4J database that allows you create nodes and its relationships using the Neo4J
commands. You can find the API in the Neo4J web page 1 .
To create a network, select “Load a network from database” on “Setup” screen and click
on “Create network”. It will open you a new window with a visualization of Neo4J server
In this new window, you have to use the Cypher query language of Neo4J to create the
network. You can find a complete tutorial in this link:
http://neo4j.com/developer/cypher-query-language/
1
http://neo4j.com/developer/cypher/
103
APPENDIX B. USER MANUAL
104
Bibliography
[1] E. Serrano, G. Poveda, and M. Garijo, “Towards a Holistic Framework for the Evaluation of
Emergency Plans in Indoor Environments,” Sensors, vol. 14, no. 3, pp. 4513–4535, 2014.
[2] E. Otte and R. Rousseau, “Social network analysis: a powerful strategy, also for the information
sciences,” Journal of Information Science, vol. 28, no. 6, pp. 441–453, 2002.
[3] B. L. Said, T. Bouron, and A. Drogoul, “Multi-Agent Based Simulation of Consumer Behaviour:
Towards a New Marketing Approach,” in International Congress On Modelling and Simulation
(MODSIM’2001), (Canberra, Australie), d 2001.
[4] A. Hummel, H. Kern, S. Kühne, and A. Döhler, “An agent-based simulation of viral marketing
effects in social networks,” 26th European Simulation and Modelling Conference - ESM’2012,
p. 212–219, 2012.
105
BIBLIOGRAPHY
106