1
H E W L E T T O C T O B E R
HEWLETT
PACKARD
© Copr. 1949-1998 Hewlett-Packard Co.
1 S 3 O
H E W L E T T - P A C K A R D
October 1990 Volume 41 • Number 5
Articles
O An Overview of the HP Interactive Visual Interface, by Roger K. Lau and Mark E.
Thompson
7 HP I VI Project Management
9 Quality Function Deployment and HP IVI
11
21
The HP IVI Object-Oriented Toolkit, by Mydung Thi Tran and David G. Wathen
HP IVI Application Program Interface Design, by Pamela W. Munsch, Warren I. Otsuka,
and Gary D. Thomsen
29 Object-Oriented Design in HP IVI
32
HP IVIBuild: Interactive User Interface Builder for HP IVI, by Steven P. Witten and
Hai-Wen L. Bienz
39
Creating an Effective User Interface for HP IVIBuild, by Steven R. Anderson and
Jennifer Chaffee
49
59
26.5-to-75-GHz Preselected Mixers Based on Magnetically Tunable Barium Ferrite
Filters, by Dean B. Nicholson, Robert J. Matreci, and Michael J. Levernier
62
HP DIS: Garliepp, Development Tool for Factory-Floor Device Interfaces, by Kent L. Garliepp,
Irene Skupniewicz, John U. Frolich, and Kathleen A. Fulton
Hexagonal Ferrites for Millimeter-Wave Applications, by Dean B. Nicholson
65 Finite State Machine
67 Matching Messages
69 Action Routines
Editor, Richard P. Dolan • Associate Editor, Charles L. Leath • Assistant Editor, Gene M. Sadoff • Art Director, Photographer, Arvid A. Danielson
Support Anne Susan E. Wright • Administrative Services. Diane W, Woodworth • Typography, Anne S. LoPresti • European Production Supervisor, Sonja Wirth
O Hewlett-Packard Company 1990 Printed in U.S.A.
2 HEWLETT-PACKARD JOURNAL OCTOBER 1990
© Copr. 1949-1998 Hewlett-Packard Co.
Research Reports
~7Q Measurement of R, L, and C Parameters in VLSI Packages, by David W. Quint, Asad
I O Aziz, Ravi Kaw, and Frank J. Perezalonso
~7Q Statistical Circuit Simulation of a Wideband Amplifier: A Case Study in Design for
/ O Manufacturability, by Chee K. Chow
82
System Vivek Air Flow Analysis for a Computer System Processing Unit, by Vivek
Mansingh and Kent P. Misegades
Departments
4 In this Issue
5 What's Ahead
45 Authors
The Hewlett-Packard Journal is published bimonthly by the Hewlett-Packard Company to recognize technical contributions made by Hewlett-Packard (HP) personnel. While
the information of in this publication is believed to be accurate, the Hewlett-Packard Company makes no warranties, express or implied, as to the accuracy or reliability of
such information. The Hewlett-Packard Company disclaims all warranties of merchantability and fitness for a particular purpose and all obligations and liabilities for damages,
including but not limited to indirect, special, or consequential damages, attorney's and expert's fees, and court costs, arising out of or in connection with this publication.
Subscriptions: non-HP Hewlett-Packard Journal is distributed free of charge to HP research, design, and manufacturing engineering personnel, as well as to qualified non-HP
individuals, business and educational institutions. Please address subscription or change of address requests on printed letterhead (or include a business card) to the HP address
on the please cover that is closest to you. When submitting a change of address, please include your zip or postal code and a copy of your old label.
Submissions: research articles in the Hewlett-Packard Journal are primarily authored by HP employees, articles from non-HP authors dealing with HP-related research or
solutions contact technical problems made possible by using HP equipment are also considered for publication. Please contact the Editor before submitting such articles. Also, the
Hewlett-Packard should encourages technical discussions of the topics presented in recent articles and may publish letters expected to be of interest to readers. Letters should
be brief, and are subject to editing by HP.
Copyright publication 1 granted copies Company. All rights reserved. Permission to copy without fee all or part of this publication is hereby granted provided that 1 ) the copies
are not Hewlett-Packard used, displayed, or distributed for commercial advantage; 2) the Hewlett-Packard Company copyright notice and the title of the publication and date appear on
the copies; Otherwise, be a notice stating that the copying is by permission of the Hewlett-Packard Company appears on the copies. Otherwise, no portion of this publication may be
produced recording, information in any form or by any means, electronic or mechanical, including photocopying, recording, or by any information storage retrieval system without written
permission of the Hewlett-Packard Company.
Please Journal, inquiries, submissions, and requests to: Editor, Hewlett-Packard Journal, 3200 Hillview Avenue, Palo Alto, CA 94304, U.S.A.
OCTOBER 1990 HEWLETT-PACKARD JOURNAL 3
© Copr. 1949-1998 Hewlett-Packard Co.
In this Issue
Our cover subjects this month can barely be seen in the cover photograph.
They're the two tiny specks in the middle of the flat plate in the foreground.
They are spheres of barium ferrite that serve as the frequency-sensitive
elements of magnetically tunable bandpass filters for the millimeter-wave
KP'^Elljllg frequency range. (The millimeter-wave range is the region of the elecrBlOIM becoming spectrum from about 30 to about 300 gigahertz. It's becoming
more important as radar, communications, and other systems move to higher
frequencies seeking higher performance or less crowding.) These filters are
used mixers, a filters in the HP 11974 Series preselected mixers, a
family from four mixers designed for down-converting millimeter-wave signals from the 26.5-to-75GHz range into the frequency range of compatible HP spectrum analyzers. The preselection filter
removes unwanted image and multiple responses, natural consequences of the mixing process,
that desired the spectrum analyzer display and obscure the desired response. In the microwave
frequency range, below 30 GHz, yttrium iron garnet (YIG) spheres have been used as resonators
in such filters, but at higher frequencies, tuning magnets for YIG spheres begin to pose design
problems, so a new material was needed. A new four-sphere filter design was also found necessary
to achieve the required performance. The design and performance of the HP 11974 Series
preselected mixers are described in the article on page 49. The article on page 59 gives the
reasons tells the choice of scandium-doped, M-phase barium ferrite for this application and tells
how the spheres are made.
Software for computer integrated manufacturing (CIM) is in great demand, and HP development
laboratories are responding with a steady stream of new products. Two are featured in this issue.
The first, HP Interactive Visual Interface, or HP IVI, uses object-oriented design, the industry-stan
dard X software System, and widget technology to help application software developers provide
graphical user interfaces for industrial applications. (Widgets are standard pieces of software that
produce users' scrollbars, and the like on computer screens.) HP IVI improves its users'
productivity in designing user interfaces because it is interactive, facilitates saving and reusing
interfaces, and doesn't demand that users know the details of the X Window System or widgets.
The article on page 6 gives an overview of HP IVI, which consists of two main parts. Users
construct their interfaces using HP IVI's interactive editor, described on page 32, and then activate
the objects created with the editor by writing C-language programs using a toolkit of functions
provided by HP IVI's application program interface. Details of the application program interface's
object-oriented toolkit are in the article on page 1 1 , and the design of the application program
interface is the subject of the article on page 21 . In the article on page 39, we're told how the
HP IVI with own user interface was refined and given a 3D appearance with the help of a
team of industrial designers.
The other CIM software product in this issue is HP Device Interface System, or HP DIS. It
addresses the problem of efficiently developing interfaces between computers and factory-floor
devices because robots, programmable controllers, and machine tools. This is a problem because
these different, typically come from many manufacturers and have different, proprietary interfaces.
HP DIS is a between that helps application software developers create and test interfaces between
HP 9000 provides and factory-floor devices. Its development facility provides a high-level lan
guage provides a communications protocols. Its testing facility provides a test generator, a
test exerciser, and a device simulator that makes it unnecessary to have actual devices to test
interfaces. The HP DIS run-time facility executes protocols in real time. The design and perfor
mance of HP DIS are described in the article on page 62.
4 HEWLETT-PACKARD JOURNAL OCTOBER 1990
© Copr. 1949-1998 Hewlett-Packard Co.
Simulation is an important part of many design processes because it makes it possible to refine
a design simulation actually building anything, provided that the computer model used for simulation
accurately reflects the behavior of the device or system being designed. Engineers at HP's
Colorado a Circuits Division wanted to verify the accuracy of the electrical models of a
408-lead made ceramic package for a large integrated circuit chip. The models were made
up of discrete inductances, capacitances, and resistances. To verify the models, these parameters
had to measurement methods on a real package. When traditional high-frequency measurement methods
proved paper new methods were developed. These methods are the subject of the paper
on page 73.
In integrated circuit design, the objective of simulation is sometimes to predict, in the design
phase, in statistical distributions of a circuit's performance parameters in production. A problem
is that 1C parameter variations aren't all completely random, as they are assumed to be by
commercially available circuit simulators. Those within a chip, such as side-by-side resistor values,
are highly correlated, and failure to take this into account leads to inaccurate simulations. In the
study reported in the paper on page 78, this problem was solved by applying principal component
analysis, a branch of multivariate statistics. Each circuit parameter was expressed in terms of a
set of then random variables. The independent variables were then used as the inputs
to the circuit simulator program, and the results were later converted to circuit parameter data.
Another application of simulation, this time to predict the pressure drop and air flow characteristics
in a computer system processing unit, is described in the paper on page 82. In the past, these
quantities have been determined from measurements on prototype machines, which are available
only after most of the design has been done. If the measured results are unacceptable, major
design finite may be required. The study showed that, using supercomputers and finite element
modeling, it is possible to simulate the air flow accurately enough to allow meaningful decisions
early in the design phase.
P.P. Dolan
Editor
Cover
The flat plate in the foreground is the iris plate from a magnetically tuned preselection filter
used of tiny HP 1 1974 Series preselected mixers. In the middle of the plate are two tiny barium
ferrite the spheres. Also shown are the top and bottom halves of the tuning magnet, the
magnet body, and the two parts of the waveguide assembly.
What's Ahead
In the December issue, we'll have articles on the autochanger and servo design and system
integration of HP's 20-Gbyte rewritable optical disk library system, designed for direct access
secondary storage. Error correction, software protection, and system integration of HP's CD-ROM
drive controller also be featured. The data communications and terminal controller for HP 3000 computers
running the MPE XL operating system now supports X.25 network packet assembler/dis
assemblers; two articles will deal with this capability. We'll also have a research report on anisotropic dimensional changes in cold-drawn copper beryllium alloy as a result of aging.
OCTOBER 1990 HEWLETT-PACKARD JOURNAL 5
© Copr. 1949-1998 Hewlett-Packard Co.
An Overview of the HP Interactive Visual
Interface
The HP Interactive Visual Interface (HP IVI) product uses
object-oriented and window technologies to provide
interactive and programmatic tools for building graphical
user interfaces.
by Roger K. Lau and Mark E. Thompson
IN THIS AGE OF INFORMATION, creating effective user
interfaces for industrial automation applications is a
greater challenge than it has ever been. The right details
from a vast array of information must be shown in the
appropriate form to the intended group of viewers. In ad
dition, the information that is communicated must be con
veyed in such a manner as to enhance the decision making
process. It often takes more time to develop the interface
than it takes to develop any other part of an application.
HP Interactive Visual Interface (HP IVI) is designed to help
developers provide the type of user interface needed for
industrial applications.
HP IVI is a user-interface development tool built on the
X Window System Version 11 and runs in the HP-UX
operating system environment. It consists of two main
parts: an interactive editor (HP IVIBuild) and an application
program interface (API). Users construct their symbols and
displays with HP IVIBuild (the builder) and write a C pro
gram using the API calls to call up and activate the windows
and other objects created with the builder. An application's
user interface can be constructed without the assistance of
HP IVIBuild, but with it productivity is greatly increased
by the ability to create the interface interactively. HP IVI
is also one of the few products to combine at the builder
level the power of a graphical presentation with the flexi
bility and interactivity of widgets (e.g., pushbuttons,
scrollbars, and toggle buttons).1
This article describes some of the market research and
the target customers for HP IVI, and provides an overview
of the two main components of HP IVI, HP IVIBuild and
the application program interface.
tions require graphical user interfaces, and the use of
graphics on the factory floor is growing and being applied
to monitoring production processes and data gathering.
The requirements are performance, reliability, and the in
tegrity of data from a workcell. To satisfy these demands,
the HP IVI product:
• Minimizes the user's expense for the development of
user interfaces
• Provides a distributable user interface for improved cost,
performance, and flexibility
• Offers windowing functions and dynamic data config
uration
• Integrates graphics and widgets intelligently
• Gives software engineers the productivity boost needed
for them to remain competitive
• Ensures top performance and reliability
• Gives the user full control over data from the factory floor
• Builds on standards.
Early in the project, the HP IVI project team used a
technique called quality function deployment (QFD) to
help analyze customer needs in the industrial automation
area. This research helped to define the features for HP
IVI. The box on page 9 provides more information about
QFD and its use by the HP IVI team.
HP IVIBuild
HP IVIBuild is the interactive window and symbol build(continued on page 8)
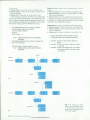
HP IVI Build
Builder Code
API Functions
Market Research
The main customers of HP IVI are software engineers
who build industrial applications. This includes system
integrators, independent software suppliers, and end users
with internal software engineering groups. These users
benefit by being able to customize screens to their custom
ers' applications and by being able to reuse the symbols
they created and saved in previous applications. HP IVI
also buffers its users from having to know the details of
the intrinsics of both the X Window System and widgets.
This is considered to be a benefit and a boost to productiv
ity.
Market research indicates that manufacturing applica
User Interface Objects
(Windows, Symbols, etc.)
Objects Created
by HP IVI
Application
API Functions
API = Application Program Interface
6 HEWLETT-PACKARD JOURNAL OCTOBER 1990
© Copr. 1949-1998 Hewlett-Packard Co.
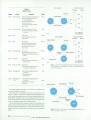
Fig. 1. HP IV! 'Build is used to create user interface objects
that are saved in a file, and a user application uses the API
functions to retrieve and manipulate the objects.
HP IVI Project Management
The HP Interactive Visual Interface project was a relatively
large software project (100 KNCSS) and as such it was faced
with some interesting challenges during product development.
Besides the normal challenges associated with software project
management (e.g., version control, code inspections, project
standards, and schedule deadlines), HP IVI was faced with three
main challenges: determining the exact customer needs before
design and implementation, using existing software, and using
new software development technologies. For determining cus
tomer needs, a process called quality function deployment (QFD)
was used. This process helped us to determine the feature set
for HP IVI (see box on page 9). The existing software was a
combination of software from other HP entities and from outside
vendors. Finally, the new technologies included the use of objects
and windows for design and implementation.
Existing Software
One of the primary goals of HP IVI was to leverage the work
of others. The decision to use existing software resulted from the
desire to decrease the time to market for the product by reducing
the engineering time and effort involved in design, implementa
tion, and support. There was also a need to base HP IVI on
components that conform to standards (explicit or de facto). To
these ends, the basic framework of HP IVI is based on software
that was purchased as well as software that was produced by
other entities in Hewlett-Packard.
The HP IVI project team realized the benefits that could be
obtained by leverage early on. The basic object-oriented
framework, the error handling routines, the X1 1 client library and
server, the X toolkit, and the HP X widget set were all the work
of others. While we certainly achieved our goals of reducing
design, implementation, and support costs, we missed our orig
inal time-to-market goals.
Following are some of the lessons we learned about leveraging
existing software.
• The If and stability of existing code is a critical factor. If
there are many defects in this code, much time will be spent
isolating the problem and negotiating with the software
su pplier to have it repaired .This can wreak havoc with a project
schedule. One way around this is to obtain the source code
for the underlying software and make the repairs locally. This
may provide the most timely solution, but also raises many
supportability questions.
• Negotiating enhancements to the existing software may be
difficult. Priority lists may not mesh well between vendor and
receiver. Important enhancements in the underlying software
may be delayed because of this.
• Performance of a product may be adversely impacted by exist
ing software. If this is the case, lobbying for improvements
may be time-consuming and marginally successful.
• Good documentation of existing software is essential for a
product to be successful. Inadequate or inaccurate documen
tation can also impact schedules.
• It is very important to establish a good line of communication
and a strong working relationship with the existing software
supplier. Changes made to their product may have drastic
effects on the local product. It is important to learn about
changes as early as possible (i.e., at the investigation phase
rather than at the release phase).
Project teams that leverage a large amount of software from
other sources should be very careful not to assume that leverag
ing means that less attention can be paid to producing a very
detailed design. Leveraging software does not mean there is no
cost associated with it. Engineers have to learn and understand
the code, design impacts must be assessed, and the leveraged
code must be supported over the life of the product. Also,
leveraging product components does not automatically ensure
a faster time to market.
New Technologies
HP IVI is an object-oriented system that is based on the widget
technologies and the X Window System. Through the QFD pro
cess we found that building on a standard software platform is
viewed as an important requirement by our target market.
At the start of the HP IVI project no one on the team had any
experience with object-oriented programming and design and
only one person was familiar with window systems. Therefore,
we had to develop a process to disseminate technical information
and promote technical expertise among the project team very
quickly. This was accomplished through training, the exchange
of information during design and code reviews, and the simple
sharing of expertise among the project team.
The following observations come from our experience with
object-oriented programming and design:
• Careful consideration should be given to mapping object
classes to source code files. The consequences can be fre
quent file access conflicts when changes are made to a file.
• The temptation to redo class hierarchies should be controlled.
Developers must be careful to make practical choices on when
the class hierarchies are sufficient.
• First-time users should not expect magic. We believe that there
was a significant learning curve involved in our decision to
use object-oriented programming and design.
• Once the learning curve is overcome, the object paradigm is
a natural and productive one to use for developing software
products.
• Object-oriented programming and design have a technical
jargon that might mystify developers and their managers at
first. Therefore, familiarity with and consistent use of terminol
ogy must be established at the start of the project.
• The object paradigm is not applicable to all software engineer
ing projects. Knowing when to reject this technology in favor
of a procedure-based design is important.
The use of multiple new technologies in a project with few
team members having experience in any of these technologies
does have its problems and can be a significant factor on the
schedule because it is difficult to anticipate problems and avoid
pitfalls. However, using new technologies on a project can be a
significant motivator to the engineering staff. Benefits and risks
of the inclusion of new technology in any product development
effort must be weighed carefully.
Chuck Robinson
Section Manager
Industrial Applications Center
Robin Ching
Project Manager
Industrial Applications Center
OCTOBER 1990 HEWLETT-PACKARD JOURNAL 7
© Copr. 1949-1998 Hewlett-Packard Co.
er of HP IVI. It is an API application because it uses the
HP IVI API library of C functions to handle both the visual
and the nonvisual aspects of creating objects such as man
aging object data structures and performing operations re
quired to manipulate objects. Consequently, the windows
and models created and saved by the builder can be restored
by an API program and vice versa (see Fig. 1). For the most
productive use of HP IVI, the user first creates the windows
needed by an application using HP IVIBuild and then
mobilizes the created windows using a C program contain
ing API functions. Fig. 2 shows an application user inter
face being created with HP IVIBuild. Although an entire
HP IVI application could be written using just the API C
functions, HP IVIBuild provides the following advantages
over this method:
• No initial programming is required.
• The user can look at the user interface and manipulate
it while creating it.
• The interface can be altered very quickly.
• Several graphical conveniences are available such as
snapping to a grid and a simple method of creating ellipses.
• An API program that uses HP IVIBuild-created objects
is much simpler than one that creates the same objects
from scratch.
• Symbols created in an HP IVIBuild session can be saved
and reused.
The articles on pages 32 and 39 provide more information
about HP IVIBuild.
Objects and API
Since HP IVI is an object-oriented system, all operations
are done with objects, resulting in a system that is a hierar
chy of objects. Building this hierarchy starts with creating
window objects (windows on the display) and then placing
graphics and widget objects into the windows. To activate
the objects in the window (i.e., give them dynamic proper
ties) some of the attributes of the objects can be changed
(e.g., foreground or background color, visibility, or fill per
centage for a rectangle). When an application uses objects
to display data values, it can make calls to the API functions
to update the data values in the objects displayed in the
windows.
The objects used in HP IVI are categorized into four
hierarchical layers:
• High-Level Objects. These objects specify global attri
butes for the other levels of objects. This level includes
the window and model objects mentioned earlier.
• Composite Objects. These are organizational groupings
of primitive objects. This includes menus and their com
ponent menu panes, row-columns, and scroll lists.
• Primitive Objects. These are basic widgets and graphics
objects — the basic visual pieces that make up the display.
Graphics primitives include items such as polylines,
splines, arcs, rectangles, and circles. Widget primitives
include pushbuttons, toggle buttons, text widgets, textedit widgets, menu buttons, and scrollbars. Both types
of primitive objects can receive input from the user.
• Low-Level Objects. These are mostly nonvisual objects
that are used to specify certain object attributes. Objects
that handle object data structures and objects that handle
events are examples of low-level objects.
Because an object hierarchy is used, displays can be
created from the top down (parent to child) or the bottom
up (child to parent), giving the designer a lot of flexibility
in implementation. Certain objects can be gathered and
arranged by making them into children of composite ob(continued on page 10)
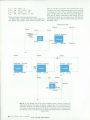
Fig. 2. An application user inter
face being created using the in
teractive tools provided by HP
IVIBuild. The tool box, utility box,
and line width panels are HP
IVIBuild components.
8 HEWLETT-PACKARD JOURNAL OCTOBER 1990
© Copr. 1949-1998 Hewlett-Packard Co.
OCTOBER 1990 HEWLETT-PACKARD JOURNALS
© Copr. 1949-1998 Hewlett-Packard Co.
jects. Composite objects can be used to organize and add
extra control over their descendant objects. For example,
a row-column object can be used to organize different
widget primitives into rows and columns.
All objects in the hierarchy have attributes (e.g., color,
size, shading, etc.). It is through the control of these attri
butes that the displays created with HP IVI get their
dynamic quality. One can easily manipulate several attri
butes on an object with a single API function call, changing
location, color, visibility, or some other attribute. Other
API function calls enable the developer to:
• Create and free objects
• Manipulate object attributes
• Save and restore objects
• Locate objects
• Obtain user input from primitive objects
• Perform visual updates of the display
• Manipulate lists of objects.
As an example, callback objects can be attached to any
visual object and cause a callback function to be called
whenever a predefined event (such as clicking on the
mouse button or depressing a key on the keyboard) occurs.
The callback function can be used to obtain and manipulate
data from the shop floor and modify attributes of objects
on the display (e.g., changing an object's color from green
to red or changing the textual information displayed in an
object). The API functions and the internal design of these
functions are described in the articles on pages 1 1 and 21.
Conclusion
HP IVI facilitates the design and implementation of one
of the most important parts of any manufacturing applica
tion — its interface to the user. The benefits of the window
ing technology of Xll are just beginning to be realized on
the manufacturing floor. HP IVI is one of the first integrated
applications to bring the X Windows technology to the
factory floor. The combination of widgets and graphics
gives the application designer more freedom to present the
needed information in the fashion best suited for its in
tended viewers. This design freedom promotes the kind of
informed decision making needed in today's fast-paced
and highly competitive industrial marketplace.
References
1. D.L. McMinds and B.J. Ellsworth, "Programming with OSF/
Motif Widgets," Hewlett-Packard Journal, Vol. 41 , no. 3, June 1990,
pp. 26-35.
10 HEWLETT-PACKARD JOURNAL OCTOBER 1990
© Copr. 1949-1998 Hewlett-Packard Co.
The HP IVI Object-Oriented Toolkit
Using object-oriented design techniques, a minimum set
of functions is provided with the HP IVI product for
manipulating widgets and graphic objects to create a
graphical user interface.
by Mydung Thi Tran and David G. Wathen
THE HP IVI APPLICATION PROGRAM INTERFACE
[API] is an object-oriented toolkit of C functions that
enable a software developer to create an interactive
and informative graphical user interface programmatically.
The API functions can be used for any application in which
a highly interactive graphical user interface is required.
The collection of API functions provides the ability to build
different models of user interfaces that can be saved and
used again in other user interfaces. High-level objects pro
vide the control and organization necessary to support
lower-level composite and primitive objects. All objects
have configurable attributes or characteristics that make it
possible to customize the look and feel of a particular ob
ject. Color, size, and font are a few examples of these attri
butes. The API functions allow a programmer to do things
like create and free objects, query attributes, save and re
store objects, get input, and find objects by location.
This article describes the the API functions and the arti
cle on page 21 describes the internal design supporting
these functions.
the display. There can only be one system object per appli
cation. All other objects (except low-level objects) are de
scendants of the system object. The direct descendant of a
system object must be a server object.
A server object is the interface to the display system.
Information regarding the display and its physical charac
teristics is stored in this object. The server object establishes
the link between the display device (an XI 1 server) and
the user application (the client). Just like the system object,
there can only be one server object per application. Win
dows are the only children of the server object.
Window objects represent the drawable region of the
display. A window is an area on a display that connects
the world coordinate system (e.g., inches, mm, etc.) defined
for a window to the device coordinates (i.e., pixels) of the
display system. The window can be seen as a viewport
into the world coordinate system. An application can have
any number of windows. They can overlap one another
and they can be manipulated using a window manager or
System
(High-Level)
The API Object Hierarchy
All the components of an API application are separate
objects that are combined together in a hierarchical arrange
ment to form a working user interface. An example of this
hierarchical relationship is shown in Fig. 1. This relation
ship is described in terms of ancestry. For instance, Model
12 in Fig. 1 is the parent of three children: Model 21, a rect
angle, and a row-column object. Another way of saying
this is that Model 12 is the ancestor of three descendants:
Model 21, a rectangle, and a row-column object.
Every API object belongs to one of four groups: high-level
objects, composite objects, primitive objects, or low-level
objects. Fig 2 lists the different API object groups.
High-Level Objects. These objects control and organize
groups of objects and hold global resources that help define
other objects in the hierarchy. The high-level objects must
be created in a specific order: system object, server object,
window objects, and model objects. Before anything can
be displayed, at least one of each of these objects must be
available. Since these objects are required for every appli
cation, the API will create default high-level objects if they
are not explicitly created.
The system object is the highest object in the API object
hierarchy. This object stores global attributes that affect
the input loop, the update pass, and global resources. The
input loop is composed of the code that handles user input
and an update pass is the process of flushing changes to
Server
(High-Level)
Window
(High-Level)
Model 12
(High-Level)
Model 11
(High-Level)
Circle
(Primitive)
Model 21
(High-Level)
Rectangle
(Primitive)
Row-Column • Text
(Composite) • (Primitive)
Toggle Button
(Primitive)
Row-Column
(Composite)
Text
(Primitive)
Pushbutton
(Primitive)
Fig. 1 . The API object hierarchy of a simple application.
OCTOBER 1990 HEWLETT-PACKARD JOURNAL 1 1
© Copr. 1949-1998 Hewlett-Packard Co.
the API functions. The last high-level object, the model
object, is the only valid child of a window object.
The model object allows an application to put composite,
primitive, or other model objects into a single group or
collection. When these objects are grouped together, func
tions can be performed on them as if they were a single
object. At the same time, each part will retain its individu
ality. Models can represent a symbol or template that can
be saved and restored as many times as desired. Models
can have other models, composites, or primitive objects as
children.
Primitive Objects. These are basic visual objects that are
part of one of two categories: graphic primitives or widget
primitives. The graphic primitives are visual objects (e.g.,
circles, rectangles, and arcs) that can receive mouse input.
An application can use these objects for graphically repre
senting user-oriented objects that display crucial informa
tion such as liquid levels and temperature. The widget
primitives (e.g., pushbuttons, scrollbars, and text edits) are
also visual objects. However, unlike the graphics primi
tives, widget primitives can receive keyboard input as well
as mouse input. The widget primitives are used for display,
text editing and input, and selection capabilities. Primitive
objects have no children.
Composite Objects. These objects provide the means to
organize and manage other objects. Specifically, composite
objects make it possible to group primitive widget objects
and other composite objects so that they can be manipu
lated as a single object. A function or attribute specified
for a composite object affects its children without actually
changing them. For example, erasing or redrawing a rowcolumn object will cause all its children to be erased or
redrawn automatically.
Low-Level Objects. These are objects that are not directly
visible like primitive or composite objects. They are stand
alone objects that are used to specify attribute values for
primitive, composite, or high-level objects. Low-level ob
jects are used to set attributes for the other three object
groups, apply API functions to a list of objects, or deal with
user input from the activated objects.
Polymorphism and API
One of the key features of object-based systems is the
concept of polymorphism. Polymorphism allows different
objects to share a common operational interface (operations
with the same name). When an operation is invoked, the
function dynamically determines the object type and exe
cutes the appropriate code. Object-oriented programs are
polymorphic because they can operate on many different
object types with the same functional interface. This com
mon interface provides a great deal of flexibility and ease
of use to the API programmer. Common access reduces the
number of functions and increases the power provided by
the basic set of functions.
The API functions provide the functionality of
polymorphism through an identifier called Zlld. When an
object is created via the ZtCreate function, a Ztld is returned
from the call for use in further operations. The Ztld is a
pointer to the object that was just created. This handle
allows the programmer to reference the object when addi
tional modifications are necessary. The API functions use
this identifier to determine the type of object being manipu
lated.
Attributes and Arglists
Associated with API objects are attributes that describe
properties of these objects. Examples of object attributes
include properties that define appearance characteristics
such as colors and fill patterns for graphic objects, and
font, highlight area, and 3D shadowing for widget objects.
There are also coordinate system attributes that control the
position and sizing of objects, including their point, height,
width, scale, rotation, and translation. Table I lists the
categories of API attributes.
There is a specific list of attributes assigned to each API
object type. Users can set these attributes to desired values
or can query the values contained in them through a data
structure called an Arglist. An Arglist is a variable-length array
of attribute-value pairs. The following is the C structure
declaration for an attribute-value pair.
struct ZtArgListStruct
{
ZtAttributeType ZtAttribute;
ZtValueType ZtValue;
typedef struct ZtArgListStruct ZtArgListltem;
/*where:
*/
/ ZtAttribute is the defined attribute
*/
/ ZtValueType is defined as a pointer to a
/ variable containing the attribute value
Fig. 2. API object groups.
*/
Arglists are used to define attributes of objects or functions.
Some of the advantages of using Arglists include:
• Arglists free users from fixed parameters in a function call.
The number of attributes that the user can pass as param
eters can vary.
• The number of function calls can be minimized by in
cluding multiple attributes in the Arglist as opposed to
having to use one function call per attribute change.
• Attributes can be initialized in the Arglist either statically
or dynamically (at run time).
12 HEWLETT-PACKARD JOURNAL OCTOBER 1990
© Copr. 1949-1998 Hewlett-Packard Co.
Table I
Categories of API Attributes
C a t e g o r y
Trickle-Down
Color, Font, Raster
Attributes that affect or define
the current API object hierarchy
(e.g.,ZtCHILD_LIST,ZtCURRENT_
MODEL).
Keyboard Traversal
Attributes that assign the input
focus to an object (e.g., ZtTRAVERSAL, ZtNEXT_TOP_WINDOW).
Function
Attributes that affect the capa
bilities of functions (e.g., ZtRECURSIVE,ZtMERGE).
D e s c r i p t i o n
General Attributes that are common to most
objects. For example, the object
name (ZtNAME), an object's visibility
status (ZtVISIBLE), and user data
(ZtUSEFLDATA).
Coordinate System
Parenting
These are attributes that define:
• Size and position such as
an object's height and width
(ZtHEIGHTandZtWIDTH)
• Transformation, such as
an object's rotation, scaling, and
translation characteristics
(ZtROTATE, ZtSCALE, ZtTRANSLATE)
• Normalized device coor
dinates for placing windows
(ZtXMIN,ZtXMAX,ZtYMIN,ZtYMAX)
• Aspect ratio of window
device coordinates (ZtADJUST,
ZtXADJUST, ZtYADJUST)
• Aspect ratios of server objects
(ZtXPIXELS, ZtYPIXELS).
Attributes that affect the
descendants of objects
(ZtVISIBLE, ZtSENSITIVE).
Attributes that specify the
object's color, font, or raster.
• Raster lists (ZtRASTEFLLIST)
• An object's color (e.g., ZtBACKGROUND_COLOR, ZtFOREGROUND_COLOR,etc.)
API Functions
Because of polymorphism a minimum number of API
functions are required for manipulating API objects.
Polymorphism allows the same API function to be used to
handle more than one object. Table II shows the API func
tions available for manipulating the object groups shown
in Fig. 2.
Table II
Categories of API Functions
Function Use
Function Names
Create and Free Objects ZtClone, ZtCreate, ZtCreateList,
ZtFree
Manipulate Attributes ZtChange, ZtQuery
Save and Restore Objects ZtSave, ZtRestore
Locate Objects ZtFindByAttribute, ZtFindByLocation
• An object's font (ZtFONT)
• An object's raster (e.g.,ZtFILL_
RASTER, ZtlCONLRASTER).
Pattern and Line
Attributes that control the
appearance of borders, lines, and
fills (e.g., ZtFILLjriLE, ZtBACKGROUND_TILE, ZtLINE_WIDTH).
Widget Appearance
Attributes that define a widget's
appearance (e.g., ZtSHADOW,
ZtBOTTOM_SHADOW_COLOR,
ZtTOP_SHADOW_ COLOR).
Callback
Attributes used to attach userdefined functions to an object.
These functions are used to
respond to user input. For
example, ZtREASON specifies
when a callback function should
be called, and ZtCALLBACK_FUNCTION specifies a function for
processing user input.
Receive Input ZtDo(..,ZtlNPUT,..)
Perform Visual Updates ZtDo(..,ZtDRAW,..)
ZtDo(..,ZtERASE,..)
ZtDo(..,ZtFLASH,..)
ZtDo(..,ZtLOWER,..)
ZtDo(..,ZtRAISE,..)
ZtDo(..,ZtREDRAW,..)
ZtDo(..,ZtUPDATE,..)
Manipulate Lists
ZtCheckListObject, ZtCountLisl,
ZtGetListlndex, ZtGetustObject,
ZtGetustTail, ZtlnsertListlndex,
ZtlnsertListObject, ZtlnsertustTail,
ZtMergeListlndex.ZtMergeListTail,
ZtMergeListObject, ZtRemoveListlndex,
ZtRemoveListObject, ZtRemoveListTail,
ZtReplaceListlndex.ZtReplaceListObject,
ZtReplaceListTail
Manipulate Arglists
ZtFreeArgList
OCTOBER 1990 HEWLETT-PACKARD JOURNAL 13
© Copr. 1949-1998 Hewlett-Packard Co.
Create and Free Objects
Objects are created using the function ZtCreate. Any attri
butes that are required to be different from the defaults can
be passed in the object ArgList when calling ZtCreate. For all
the attributes not included in the object ArgList, the API will
automatically set them to defaults. Once an object exists,
multiple copies of this object can be made by cloning it
with the function ZtClone. ZtClone also allows the users to
alter some of the attributes of the newly cloned objects in
the same call.
The following example shows the creation of two text
objects with one fixed size, different text strings, and differ
ent positions on the display. Fig. 3 shows the data organi
zation resulting from this example.
Text Objects (ZITEXT_OBJ)
Point Objects
(ZtPOINT_OBJ)
text1_ld
text2 Id
intreturn_val;
Ztldtext1_ld,text2_ld, pointld; / object identifiers */
Fig. 3. Data organization for text objects created with the
function ZtCreate or ZtClone.
/ arglistfortextobject(containingattribute-valuepairs) */
static REAL64h,w;
static ZtArgListltem textArglist [] =
intreturn_val;
(ZtValueType)&h, /
text height
Ztld textUd, text2_ld, pointld; / object identifiers*/
ZtWIDTH,
(ZtValueType)&w, /
text width
/ arglistfortextobject(containingattribute-valuepairs */
ZtPOINT,
(ZtValueType)NULL, /
Ztldforpoint
ZtSTRING,
(ZtValueType)NULL, /
textstring
ZtHEIGHT,
The text Arglist and the point
Arglist are the same as in the
NULL, (ZtValueType)NULL
previous example.
arglist for point object
/
static REAL64 x, y;
a r g l i s t
f o r
c l o n e d
t e x t
o b j e c t
* /
static ZtArgListltem cloneArglist [] =
static ZtArgListltem pointArglist [ ] =
{
{
ZtX, (ZtValueType)&x,
ZtPOINT, (ZtValueType)NULL,
ZtY, (ZtValueType)&y,
ZtSTRING, (ZtValueType)NULL,
NULL, (ZtValueType)NULL ;
NULL, (ZtValueType)NULL
}
/ create reference point for objects
x = 10.0 = 10.0;
• The reference points and the first
pointld = ZtCreate(ZtPOINTJDBJ,pointArglist, NULL);
• text object are created the same as
• in the previous example.
/ setup to create first text object with height = 20 and
create the second text object at (1 0,60) using the
/ width = 40
ZtClone function
y = 60.0;
h = 20.0; w = 40.0;
textArglist[2].ZtValue = (ZtValueType) pointld;
return_val = ZtChange (pointld, pointArglist, NULL);
textArglist[3].ZtValue = (ZtValueType) "Firsttext object";
cloneArglist[0].ZtValue = (ZtValue Typejpointld;
cloneArglist[1].ZtValue = (ZtValueType) "Second text object"
/ create the first text object
textUd = ZtCreate (ZtTEXT.OBJ, textArglist, NULL);
/ change point components
/
y = 60.0;
text2_ld = ZtClone (TextUd, cloneArglist,
return_val = ZtChange (pointld, pointArglist, NULL);
NULL);
c r e a t e s e c o n d t e x t o b j e c t a t ( 1 0 .
0 , 6 0 . 0 )
* /
textArglist[3].ZtValue = (ZtValueType) "Second text object";
text2_ld = ZtCreate (ZtTEXT_OBJ, textArglist, NULL);
/ free point object if it is no longer needed */
ZtFree (pointld, NULL);
/ free point object if it is no longer needed */
ZtFree (pointld, NULL);
Instead of calling ZtCreate twice, the function ZtClone can be
used to create the second text string object:
ZtClone is particularly useful for models and composite
objects. With one call, the model or the composite object
and its descendants can be duplicated. A call to ZtClone can
be modified to control the depth of cloning for a list of
objects. In the following example there are two model oh
'l 4 HEWLETT-PACKARD JOURNAL OCTOBER 1990
© Copr. 1949-1998 Hewlett-Packard Co.
jects that have identical properties except for the back
ground and foreground colors. The first model object has
been created with the child list model! Id. Instead of repeating
the same process for the second model mode!2ld, ZtClone is
used with the function Arglisl containing the ZtRECURSIVE
attribute set to TRUE. The call ZtChangeQ changes the colors.
is changed for all objects referenced by the identifier listld.
* arglist for foreground color *
static ZtArgListltem fgcArglist [ ] =
ZtFOREGROUND.COLOR,
(ZtValueType)NULL,
NULL,
(ZtValueType)NULL
intreUval;
Ztldmodellld, model2ld;
int return_val;
/ objectArglistforcolors */
fgcArglist[0].ZtValue = (ZtValueType) steelblue
static ZtArgListltem colorArglist [] =
/ Steelblue is the index into the system object's color list
{
/ (the ZtCOLOR_LIST attribute on the ZtSYSTEMJDBJ).
ZtBACKGROUND_COLOR,(ZtValueType)red,
/ change the color to steelblue
ZtFOREGROUNDCOLOR,(ZtValueType)black,
return_val = ZtChange (listld, fgcArglist, NULL);
NULL,(ZtValueType)NULL
};
/ functionArglistfor recursive attribute */
static ZtArgListltem recursiveArglist [] =
{
ZtRECURSIVE,(ZtValueType)TRUE,
NULL,(ZtValueType)NULL
model2ld = ZtClone(model1ld, NULL, recursiveArglist);
Default values can also be changed with the same call.
To change the value of a default attribute, the object type
and not the objectld must be sent to ZtChange. For instance,
if at some point in the program it is desired to have all the
windows have a red background instead of the default blue,
a call could be made to ZtChange with the object type set
to ZtWINDOWJDBJ instead of the objectld.
Information about the current value of an object's attri
butes or the default values can be obtained by making use
of the ZtQuery call. If required, API will handle the space
allocation for the queried values. The following code frag
ment is requesting information on a pushbutton object.
reUval = ZtChange(model2ld, colorArglist,
recursiveArglist);
int return_val;
char 'querystr;
Cloning nonrecursively (ZtRECURSIVE = FALSE) can be
used in cases where objects need to be referenced but copies
of these objects are not needed. Fig. 4 shows the data struc
ture that would result after nonrecursively cloning the ob
jects referenced by the linked list called Listl. Instead of
copying the objects, a new linked list (List2) of pointers is
created for referencing the objects. The original and newly
cloned list will dereference the same objects. HP IVIBuild,
the builder component of HP I VI, makes use of this option
of ZtClone to duplicate lists of selected objects. The cloned
lists are manipulated through the use of list functions to
provide the undo and backup capabilities of HPIVIBuild (see
page 36).
When an object is no longer needed, the function ZtFree
can be used to free all memory allocated for the object.
Arglists can also be freed using the function ZtFreeArgList. This
function will free all memory associated with the Arglist
including the additional memory allocated for attributes.
Manipulate Attributes
Most attributes of existing objects can be modified. For
example, in an application in which a text object contains
a string that indicates elapsed time, the time needs to be
updated periodically. ZtChange can be called passing the
new value of the elapsed time in the ZtSTRING attribute of
the object Arglist.
ZtChange also provides a way to modify several objects
in one call. The user simply has to put all the desired
objects into a list and issue a ZtChange call on the list object.
The changes will be made to all objects that the list refer
ences. In the following code fragment the foreground color
/ arglist for querying string
static ZtArgListltem qstringArglist [ ] =
ZtLABEL_STRING,
(ZtValueType)NULL,
NULL,
(ZtValueType)NULL
A copy of the pushbuttonld's label string will be returned in querystr */
after the ZtQuery call. A return value of FALSE indicates that
memory could not be allocated or an invalid pointer is
specified in pushbutton Id.
return_val = ZtQuery (pushbuttonld, qstringArglist, NULL);
querystr = (char*)qstringArglist[0].ZtValue;
r
r
the following call frees the memory allocated for ZtLABEL_STRING */
in the ZtQuery call.
ZtFreeArgList(qstringArglist);
Save and Retrieve Objects
The ZtSave function allows users to save objects in a file.
List 1
List 2
G HE H
Fig. 4. Cloning lists of objects nonrecursively.
OCTOBER 1990 HEWLETT-PACKARD JOURNAL 15
© Copr. 1949-1998 Hewlett-Packard Co.
A filename can be specified by the user in the function
Arglist. If the file exists, the user also has the option to
overwrite the existing file. Objects or defaults of one appli
cation can be retrieved easily in another application with
the ZtRestore call. In the following example the window
windowld is saved into a file named windfile.w.
/ redraw all objects whether or not they have been modified
ZtDo(systemld, ZtREDRAW, NULL);
/
d
r
a
w
a
w
i
n
d
o
w
*
/
ZtDo(windowld, ZtUPDATE, NULL);
/
f
l a s h
a n
o b j e c t
o n
t h e
d i s p l a y
* /
a
* /
ZtDo(pushbuttonld,ZtFLASH, NULL);
/
f l a s h
t h e
o b j e c t s
int returruval;
ZtDo(listld,ZtFLASH, NULL);
Ztld windowld
/ erase a rectangle object
/ filename arglist */
ZtDo(rectangleld, ZtERASE, NULL);
static ZtArgListltem saveArglist[ ] =
/
e r a s e
a
l i s t
o n
o f
l i s t
o b j e c t s
* /
ZtDo(listld, ZtERASE, NULL);
ZtFILENAME,
(ZtValueType)"windfile.w",
/ draw a text object whether or not it has been modified */
ZtOVERWRITE,
(ZtValueType)TRUE,
ZtDo(textld, ZtDRAW, NULL);
NULL,
(ZtValueType)NULL
/ draw a list of objects other than low-level objects */
ZtDo(listld, ZtDRAW, NULL);
/
r
a
i
s
e
a
w
i
n
d
o
w
*
/
w
i
n
d
o
w
*
/
ZtDo(windowld, ZtRAISE, NULL);
/
returruval = ZtSave (windowld, saveArglist)
l
o
w
e
r
a
ZtDofwindowld, ZtLOWER, NULL);
Locate Objects
The capability of locating the closest object near a userdefined point in a window is provided by the function
ZtFindByLocation. Users can control the aperture of the search
(i.e., how close or how far from the point) and the depth
of the search (i.e., whether or not the action should be
recursively applied down to primitive objects within any
model or composite object]. For example, a row-column
object contains a pushbutton object, a text object, and a
scrollbar object. A mouse click (i.e., a button event) gener
ated on the pushbutton will cause ZtFindByLocation to return
the Ztld of the pushbutton if the function Arglist contains the
value TRUE for the ZtRECURSIVE attribute. If ZtRECURSIVE is
set to FALSE, the return value of ZtFindByLocation will be the
Ztld of the row-column object instead of the pushbutton
(see Fig. 5).
ZtFindByAttribute also enables the user to match objects that
have certain properties. For example, if an application
creates a large number of objects and some of them are
invisible, to find all the invisible objects, the ZtFindByAttribute
function is used on the window object, passing an object
Arglist with the ZtVISIBLE attribute set to FALSE.
Receive Input Functions
Input events like button and key presses can be collected
using the function ZtDo(Objectld, ZtlNPUT, NULL). Where objectId is the Ztld of a system object and ZtlNPUT is the action for
ZtDo to do. The input-handling ZtDo function retrieves the
events and dispatches them to the appropriate callback
function so that the user-defined action can be executed.
User input can be collected continuously or in a single pass.
Visual Update Functions
In addition to getting input, ZtDo provides several other
actions. It provides the capabilities to update, draw, re
draw, flash, erase, raise, and lower objects on the display.
The following is a list of the different operations possible
with the ZtDo function.
Two modes of updating or drawing objects on the display
are possible: immediate update and deferred update. In
immediate update mode the windows are redrawn anytime
there is a visual change in the objects. In the deferred mode,
the process of redrawing windows can be postponed until
an explicit update is performed through ZtDo(... ZtUPDATE...),
or a change in the update mode. This mode is useful if
changes need to be made to many objects and it is only
necessary to refresh the window once. Both modes are
activated by setting the system object's update attribute to
either immediate or deferred. The following code puts the
system object in the deferred update mode.
/ update mode arglist for system object */
static ZtArgListltem updateModeArglist [ ] =
{
ZtDEFER_UPDATE,(ZtValueType)TRUE,
N U L L ,
( Z t V a l u e T y p e ) N U L L
};
Ztld systemld, windowld;
int return_val;
Mouse Event
(rowcolumnld)
(pushbuttonld)
( t e x t l d )
( s c r o l l b a r l d )
ZtRECURSIVE
Ztld Returned from ZtFindByLocation
FALSE
TRUE
rowcolumnld
pushbuttonld
16 HEWLETT-PACKARD JOURNAL OCTOBER 1990
© Copr. 1949-1998 Hewlett-Packard Co.
Fig. 5. Locating an object with ZtFindByLocation. When a
mouse event happens overthe pushbutton, if the ZtRECURSIVE
attribute is FALSE the identifier for the row-column object
(rowcoiumnid,) is returned. If the ZtRECURSIVE attribute is TRUE,
the function searches for the primitive object in the area and
returns the identifier for the pushbutton (pushbutton idj.
at some point in the application, set update mode to deferred
retum_val = ZtChange (systemld. updateModeArglist, NULL);
* now it is necessary to redraw one of the windows *
retum_val = ZtDo (windowld, ZtUPDATE, NULL);
List Manipulation Functions
The API list manipulation functions allow programmers
to create and manipulate lists of objects.
Creating an Object List. The following example creates a
list of two points using the function ZtCreateList (see Fig. 6).
/ arglist for point object */
static REAL64 x, y;
static ZtArgListltem pointArglist[ ] =
in a list.
Extraction. An object can be extracted from a list of objects
by invoking ZtGetListObject and specifying the index of the
object, or by using the function ZtGetListTail to extract the
last object in a list.
Insertion. Objects can be inserted into a list by using:
• ZtlnsertListlndex to place the object at a specified index
• ZtlnsertListObject to place the object before an object with
a known identifier
• ZtlnsertListTail to place the object at the end of a list.
These functions can be used to add an object to the child
lists of windows, models, or composite objects. The follow
ing code fragments demonstrate using these functions. Figs.
7a and 7b show the results of the ZtlnsertListlndex and the
ZtlnsertListObject examples respectively.
/ insert an object at location two in list pointListld '
Ztld pointListld, pointi Id, newpointListld, insertpointld, refpointld,
pointld;
int ret;
{
ZtX, (ZtValueType)&x;
ZtY, (ZtValueType)&y,
NULL, (ZtValueType)NULL
};
/ Identifiers for pointer objects */
Ztld pointi Id, point2ld, pointjist;
/'Identifiers for pointer objects */
/ create a point at (50.0,50.0) */
x = 50.0, y = 50.0;
point! Id = ZtCreate (ZtPOINTJDBJ, pointArglist, NULL);
/ create another point at (60.0,50.0) */
x = 60.0;
point2ld = ZtCreate (ZtPOINTJDBJ, pointArglist, NULL);
/ create the list for these two points */
pointjist = ZtCreateList (ZtLIST_OBJ, pointi Id, point2ld, NULL);
Freeing a List. When the list of objects is no longer needed,
it can be freed. The application has the option to free the
list along with all the objects it references, or to free the
list but retain the objects.
/
/
/
/
/
/
pointListld : the Ztld of a ZtLISTJDBJ to insert the object into */
pointi Id : the Ztld of the object to insert into the list
newpointListld: the Ztld of the new list. If the function
fails, the original pointListld is returned
in newpointListld. If the function succeeds, */
the new list is returned in newpointListld.
objlndex = 2;
ret = ZtlnsertListlndex(pointListld, objlndex, pointi Id,
¿newpointListld);
/ insert an object (insertpointld) into a list (pointListld) */
/ in front of another object (refpointld)
ret = ZtlnsertListObject(pointListld, refpointld,
insertpointld, & newpointListld);
/ free the point list (pointjist) in the example above '
int return_val;
static ZtArgListltem recursiveArglist [ ] =
ZtRECURSIVE,
NULL,
(ZtValueType)TRUE,
(ZtValueType)NULL
/ add a point object (pointld) to the end of a point list
/ (pointListld)
ret = ZtlnsertListTail(pointListld, pointld, &newpointüstld);
/ free the list and its references, the two point objects */
recursiveArglist[0].ZtValue = (ZtValueType)TRUE;
return_val = ZtFree(point_list, recursiveArglist);
Merging Lists. A list of objects can be merged into another
pointi Id
/* free the list but leave the two point objects alone */
recursiveArglist[0].ZtValue = (ZtValueType)FALSE;
return_val = ZtFree(point_list, recursiveArglist);
Bookeeping. Three API functions are provided for retriev
ing information about list objects. These functions include:
• ZtCheckListObject for verifying the presence or absence of
an object in a list.
• ZtCountList for counting the number of objects in a list.
• ZtGetListlndex for determining the position of an object
point_list
Fig. 6. Data organization illustrating a list of two points
created with the function ZtCreateList.
OCTOBER 1990 HEWLETT-PACKARD JOURNAL 17
© Copr. 1949-1998 Hewlett-Packard Co.
list by using:
• ZtMergeListlndex to place the list at a specified index
• ZtMergeListObject to place the list before an object with a
known identifier
• ZtMergeListTail to place the list at the end of a list.
In the following example three objects of type ZtLISTjDBJ
are used to illustrate merging lists. Listld references three
objects (objecti Id, object2ld, object3ld), Mergeld references two
objects (objected and objectSId), and Newlistld is the list object
obtained by merging Listld and Mergeld (see Fig. 8).
/ Using ZtMergeListlndex to insert all objects of Mergeld */
/ into Listld between objecti Id and object2ld */
Ztld Listld, Mergeld, Newlistld;
int ret_val;
Removing Lists. Objects can be removed from a list by
using:
• ZtRemoveListlndex to remove an object at a specified index
• ZtRemoveListObject to remove an object before an object
with a known identifier
• ZtRemoveListTail to remove an object at the end of a list.
Children of windows, models, or composite objects can
be deleted by invoking these functions on the list object
specified in the ZtCHILDJJST attribute.
Replacement. An object can replace another object using:
• ZtReplaceListlndex to place the object at a specified index
• ZtReplaceListObject to place the object before an object with
a known identifier
• ZtReplaceListTail to place the object at the end of a list.
INT32 lisUindex = 1 ;
/ replace a point object at the index position of a point
/ list (pointListld) with a new point object (newpointID)
ret_val = ZtMergeListlndexfListld, lisUndex, Mergeld,
&Newlistld);
/ Using ZtMergeListObject to insert all objects of Mergeld into */
/ pointListld : the Ztld of a ZtLIST_OBJ to replace the
/
/
L i s t l d
i n
f r o n t
o f
o b j e c t 2 l d
* /
o
b
j
e
c
t
i
n
*
/
/ newpointld : the Ztld of the object to replace the indexed */
object with
Ztld Listld, Mergeld, Newlistld, object2ld; int ret_val;
reLval = ZtMergeListObject(Listld, object2ld, Mergeld,
/ replacedld : the Ztld of the replaced object. This variable
may be given as NULL if this return value is
SNewlistld);
n o t
o f
i n t e r e s t .
* /
pointListld
¡nsertpointld
(b)
18 HEWLETT-PACKARD JOURNAL OCTOBER 1990
© Copr. 1949-1998 Hewlett-Packard Co.
Fig. 7. (a) Inserting the object
pointld in the list pointListld at index
2. (b) Inserting the object ¡nsert
pointld into the list pointListld in front
of the object refpointld.
Creating Composites with ztCHlLDJJST
Ztld pointListld, replacedld, newpomtld:
INT32 objlndex = 2:
int rel:
ret = ZtReplaceListlndexfpointüstld, objlndex. newpointld,
&replacedld):
/ The */ code fragment illustrates using ZtReplaceüstObject */
/ The object identifiers have the following meanings:
' pointListld : same as above
/ pointjndexjd: the Ztld of the object to replace
* newpointld : the Ztld of the object to replace pointjndexjd */
/ replacedld : same as above
ret = ZtReplaceListObject(pointListld, pointjndexjd,
newpointld, replacedld);
/ replace the tail object of a point list (pointListld)
/ with a new point object (newpointld)
ret = ZtReplaceListTail(pointListld, newpointld, Sreplacedld);
Grouping and Reparenting Objects
Using the methods and techniques described so far, ob
jects can be created and grouped together to form an object
hierarchy like the one shown in Fig. 1 . This is accomplished
using model objects or composite objects. Model objects
allow an application to group together composite objects,
primitive objects, and other model objects into one group.
They are invisible container objects and they do not own
any visual attributes. Composite objects have visual attri
butes and they make it possible to group together primitive
widget objects and other composite objects. Examples of
composite objects include menus, menu panes, row-col
umns, and scroll lists. There are two ways of creating model
or composite objects in API: creating objects with the child
list attribute (ZtCHILDJJST), or assigning a group of objects
to another parent.
Using ZtCHILDJJST, model and composite objects and
their descendants can be created either top down or bottom
up.
Top Down. The composite object is created with NULL as
signed to the child list attribute ZtCHILDJJST. It then be
comes the current composite object and all newly created
primitive objects will automatically become the compos
ite's children. For example, to create a menu system from
the top to the bottom, start from the top of the menu hierar
chy and work down creating children. This process is sum
marized in the following steps:
• Create the menu object ZtMENlLOBJ with the ZtCHILDJJST
attribute set to NULL. This will make the menu the current
composite object.
• Create a menu pane object ZtMENUPANEjDBJ. This will
make the menu pane a child of the menu object and also
make it the current composite object.
• Create the menu button objects. This will make the menu
buttons children of the menu pane.
• Change the attribute ZtCURRENT_COMPOSITE on the sys
tem object (ZtSYSTEMJDBJ) to the menu object created in
the first step. This will make the menu the parent of the
next menu pane.
• Repeat the last three steps until all the menu panes and
menu buttons are created.
Bottom Up. To create a composite object from the bottom
up, create all primitive objects, put them in a list, and then
create the composite object setting the ZtCHILDJJST attribute
to the Ztld of the object list. For example, to create a menu
system from the bottom up, start from the bottom of the
menu object hierarchy, making the newly created objects
children of objects higher in the menu hierarchy. This pro
cess is summarized in the following steps.
• Create a group of menu buttons and put them in a list
object ZtLIST_OBJ.
• Create a menu pane with the ZtCHILDJJST attribute set
to the Ztld of the ZtLISTJDBJ created in the first step.
Mergeld
-HE -HE -Il
:•
objecti Id
objected
objectSId
E HE H
Newiistld
>^m *mm
>•• >^·
objecti Id
objected
objectSId
objeettld
objecl3ld
Fig. 8. Merging lists. The objects
on list Mergeld are merged be
tween the first and second objects
of list Listid resulting in a new list
Newiistld.
OCTOBER 1990 HEWLETT-PACKARD JOURNAL 19
© Copr. 1949-1998 Hewlett-Packard Co.
• Repeat the first two steps until all the menu panes and
menu buttons are created.
• Put all the menu panes into a list object.
• Create the menu object with the ZtCHILDJJST attribute
set to the newly created ZtLIST_OBJ from the previous
step.
Reparenting
In API it is not necessary to destroy all the objects created
and start all over when the user wants to change the objects'
relationships. Regrouping objects by changing relation
ships is called reparenting. The ZtChange function makes
the task of regrouping very easy. The new child list is
simply passed to the desired parent object, and the API
takes care of removing the targeted children from the old
parent's child list and assigning them to the new parent.
For example, the following code segment moves the
pushbutton object PushButton 1 from Model 2 to Model 1 , and
inserts PushButton 1 into the child list of Model 1.
Ztldpblld;
Ztld model! Id;
Ztldchildlistlld;
INT32 ret;
/
/
/
/
PushButton 1 Id */
Model 1 1d */
Model 1 childlist */
Return Value */
Freeing Model or Composite Objects
The counterpart of cloning model and composite objects
recursively or nonrecursively is the ability to free these
objects from the intermediate parent. Take the case of an
application in which one of its model objects has a rowcolumn object as one of its children. Suppose the applica
tion requires that the row-column object be freed, but the
children of the row-column object must remain. The API
provides an option in the ZtFree function that allows the
user to accomplish this task. Setting the ZtRECURSIVE attri
bute in the function Arglist to FALSE, and calling ZtFree on
the row-column object, destroys the row-column object,
and its children become the children of the model object.
In contrast, passing a function Arglist to ZtFree with ZtRECUR
SIVE set to TRUE will free the row-column object and its
children.
Symbols and Models
Models can be created as children of other models. A
model within another model is called a submodel. For
example, in Fig. 1, Model 21 is a submodel of Model 12. The
user can create a symbol library out of submodels. Cus
tomized sets of commonly used symbols can be created,
saved, and reused as submodels.
Conclusion
static ZtArgListltem childlistArglist [ ] =
ZtCHILD_LIST, (ZtValueType)NULL,
NULL, (ZtValueType)NULL
/* get the current childlist of Model 1
ret = ZtQuery (modeli Id, childlistArglist, NULL);
if (ret)
{
childlistlld = (Ztld) childlistArglist[0].ZtValue;
Based on an object-oriented framework, the API consists
of a simplified yet powerful set of functions for creating
and activating user interface components. The application
developer can learn to use these routines within a short
time. The developer is also able to combine the dynamic
animation capabilities of graphics and the flexibility and
interactive capabilities of widgets to enhance user inter
faces for process control applications. Models of physical
objects such as machinery and instrumentation can be
created to provide context-specific information that the
end user can react to more quickly than with a standard
terminal-oriented interface.
/ add pushbutton pb1 Id to the end of the childlist of model 1 */
ret = ZtlnsertListTail (childlistlld, pblld,
&childlist1ld);
if (ret)
/ Change modeli Id's childlist to include the pushbutton pblld */
/ The API automatically updates the childlist of model 2 7
ret = ZtChange (model! Id, childlistArglist, NULL);
20 HEWLETT-PACKARD JOURNAL OCTOBER 1990
© Copr. 1949-1998 Hewlett-Packard Co.
HP IVI Application Program Interface
Design
To provide the features available in HP IVI, the internal
design and implementation of the application program
interface leveraged concepts and software from graphics
packages, window technology, widgets, Xt Intrinsics, and
object-oriented design.
by Pamela W. Munsch, Warren I. Otsuka, and Gary D. Thomsen
ONE OF THE MAIN goals of the HP Interactive Vis
ual Interface (HP IVI) project was to leverage fea
tures from current user interface and software de
sign technologies and blend the best of each into the feature
set and design of the application program interface (API)
functions. In doing so, the project team investigated win
dowing, graphics, the X toolkit (Xt Intrinsics), widgets, and
object-oriented design. This article discusses the features
used from each of these technologies, and how these fea
tures are incorporated into the internal design and im
plementation of the API functions (see Fig. 1).
Windowing
To hide the complexities of the X Window System1'2
from HP IVI application developers, the API provides a
layer of simplifying software over X. The only X features
left exposed are those that we thought the application de
veloper must have access to, or that cannot be layered over.
Even with this layer of software, the user still has access
to X functions. For example, X provides an event called
ConfigureNotify that tells the application that a window has
been resized, moved, or changed in some way. The API
handles resizing the window object when this event occurs
but lets the application decide if all the objects in the win
dow should be resized to match the new window's size,
or if the objects should maintain their sizes and only the
coordinate system of the window should be adjusted. The
user still has direct access to the X functions if they are
needed.
The API also ensures that all X events (e.g., a mouse
button press and release) that occur in a window object
are sent to the application. This is done through callback
techniques based on the Xt callback mechanism. There are
also mechanisms and data structures to provide a linkage
between X event data formats and API data formats.
features as offered by Starbase.
Graphics packages provide coordinate systems that:
• Communicate with a particular device (device coordi
nates)
• Provide display resolution independence (normalized
or virtual device coordinates)
• Allow the user to work in a system that reflects their
world (world coordinates)
• Allow users to move, scale, or rotate images easily with
out recalculating the placement and size of the image
(modeling transformations).
Device coordinates (DCs) are the coordinates used to
write to a device. For the X Window System, device coor
dinates are defined in pixels.
Virtual device or normalized device coordinates (NDCs)
provide a means to gain independence from the resolution
of the display. This coordinate system maps the width and
height of a display to the coordinate range from 0.0 to 1.0.
Normalized device coordinates define a viewport. A view
port is a rectangular drawing region on the display surface.
Specifying the viewport in NDCs maintains the ratio be
tween the drawing area and the display size regardless of
the display resolution.
World coordinates provide a user-defined coordinate
system. This system allows users to create pictures using
the most appropriate coordinate system for the task. For
example, if the world coordinates represent the physical
dimensions of a factory, using the dimensions from a blue
print of the factory to create a picture is straightforward.
World coordinates define which area of the unbounded
Graphics
Most graphics packages, such as Hewlett-Packard's Starbase graphics package,3 provide coordinate systems that
allow users to write device independent graphics programs.
Since creating a user interface with the X Window System
is currently done using pixels, the API project team decided
to provide API functions that enable user-interface design
ers the same type of device independent coordinate system
User Application
API Functions
API Internal Technologies
• Graphics
• Windows
• Widgets
• Xt Intrinsics
• Object-Oriented Design
Fig. 1 . The software technologies incorporated into the inter
nal design and implementation of the HP IVI application pro
gram interface (API).
OCTOBER 1990 HEWLETT-PACKARD JOURNAL 21
© Copr. 1949-1998 Hewlett-Packard Co.
world coordinate space is visible in the viewport. This type
of coordinate system also provides viewport-size indepen
dence and display-resolution independence since the
world coordinates remain the same regardless of the phys
ical size or resolution of the display.
Modeling transformations allow the user to define a
slightly different view of the world coordinates for each
piece of the picture. Modeling transformations are geomet
ric transformations such as scaling, rotation, and transla
tion (movement). This feature allows the user to draw an
object and then reuse it in the picture by moving, scaling,
and rotating it to fit the requirements of the picture.
These three coordinate systems and the modeling trans
formations are linked together when an object is drawn.
First, the object is transformed by its modeling transforma
tions to the desired orientation in the world coordinate
system. The world coordinates are scaled and translated
to fit into the viewport and converted to normalized device
coordinates. Finally the normalized device coordinates are
converted to device coordinates to draw the picture in the
viewport. These transformations are shown in Fig. 2.
Widgets and Xt Intrinsics
The widgets (pushbuttons, scrollbars, etc.) and the Xt
Intrinsics provide the basis for the API input model and
for other API features. The API project team took the input
loop from Xt Intrinsics and added processing to handle
API graphics objects. Also leveraged from the Xt Intrinsics
are the methods for getting file descriptor input and time
outs. An extension of the Xt callback technique allows
users to attach functions to window objects to handle X
events and to API graphic objects, which include geometric
figures such as circles, arcs, and rectangles, to handle
mouse button events.
To keep the number of API functions low, API parameter
handling is patterned after Xt Intrinsic Arglists. The API
Arglists are arrays of attribute and value pairs. This feature
frees the application from having fixed parameter lists that
force it to make many calls. The application also doesn't
have to pass unnecessary parameters. Parameters that it
doesn't pass are automatically defaulted. One deviation
from the Xt Intrinsic Arglist is that the API uses a null-termi
nated list instead of a counted list. The API also extends
Modeling
Transformations
• Scaling
• Translation
• Rotation
WC to NDC
Transformation
World
Coordinate (WC)
System
(meters.grams,
inches, etc.)
XtMainLoop
XtNextEvent (& event)
XtDispatchEvent (& event)
Get Next X Event
(e.g., button press)
Call Event
Processing Function
Fig. 3. The Xt Intrinsics XtMainLoop function.
the attribute default concept so that the application can
change the defaults of different classes of objects at run
time. API Arglists are described in the article on page 11.
Object-Oriented Design
HP IVI is an object-oriented system. Object-oriented de
sign and object-oriented programming are being increas
ingly used at HP for software product development.4'5 The
goals of object-oriented methods are very appealing be
cause they encourage such practices as code reuse and
functional cohesion of software components (objects).
Also, once a stable and reliable library of objects is avail
able, software development and maintenance costs should
be reduced. In the API a special utility was used to create
an object-oriented environment from C language programs.
The box on page 29 describes some basic object-oriented
concepts and an overview of the API object-oriented envi
ronment. The special utility used for creating the objectoriented environment is described later in this article.
Input Handling
The input handling model for the API is based on X, Xt
Intrinsics, and widgets. The Xt Intrinsics provide a way to
call application functions when certain events occur. These
functions are called callbacks and are attached to widgets.
The Xt Intrinsics provide input handling capabilities for
X events, time-outs, and file descriptor input through the
XtMainLoop function. This function consists of an infinite
loop calling XtNextEventQ to get the next event and XtDispatchEvent() to send the event to the appropriate processing
function (see Fig. 3). Because the API provides several spe-
NDC to DC
Transformation
Normalized
Device
Coordinate
(NDC) System
0,0
22 HEWLETT-PACKARD JOURNAL OCTOBER 1990
© Copr. 1949-1998 Hewlett-Packard Co.
Device
Coordinate (DC)
System (in Pixels)
1023,767
Fig. 2. The coordinate systems
and the transformations involved
in transforming an object from
world coordinates to device coor
dinates.
cial input features the project team implemented its own
version of XtMainLoop.
The basic API input loop consists of an HP-UX selecto
call to see if input exists on either the user's file descriptors
or the API server object's file descriptors and a test to see
what events came in (see Fig. 4). If input is pending on the
file descriptor for the X server a message is sent to the API
server object to process all X events queued. If input is
pending on a user's file descriptor the user's callback func
tion is invoked.
The server object still does the XtNextEvent() and XtDispatchEvent() looping but it has additional code to handle
conversion of X callback information to API format,
callbacks on graphic objects and window objects, Expose
and ConfigureNotify events on window objects, global
callbacks, and event grabbing (see Fig. 5).
Callback Handling
callbacks eliminates having one attribute per callback for
each object type and eliminates having to add and delete
attributes when reasons change. Time-outs and file de
scriptor callbacks are attached to the API system object,
which stores global attributes and resources. X event
callbacks are registered on the window objects.
The API creates an identifier (Ztld) for each object that
an application creates. However, the data returned to
callbacks from a widget consists of a widget identifier and
widget-specific data, which is unusable to API applica
tions. This problem is solved by minifunctions that are
registered with the widgets. These minifunctions are inter
faces that convert widget-specific data into something that
can be understood and used by the API. When a minifunction is attached to a widget, the object identifier Ztld is also
attached to the widget. This scheme allows widgets to be
treated like other API objects when widget input is re
ceived.
Callbacks are implemented as objects in the API. These
objects contain a pointer to the user-written function to be
called when an X event occurs, a pointer to callback-spe
cific data, and the specific reason that will cause the
callback to invoke the user function (see Fig. 6). The file
descriptor that is checked during input processing is an
example of callback-specific data. The reason for the invo
cation of the callback is an integer value that indicates the
type of input event such as a button press. These callback
objects are put in a list called a callback list and are attached
to the object requiring them. For the Xt Intrinsics, the
callbacks are attached to specific-reason resources instead
of one central callback list. The API method of handling
Get Next X Event
(XtNextEvent)
Scan for Input
File Descriptors
(select ( ))
Dispatch Event
to Xt Intrinsic
XtDispatchlnput ( )
Events
Pending
Input
on User
File
Descriptor
Yes
handle_event
Message to
Server Object
(Fig. 5)
Call User
File Descriptor
Callback
No
Fig. 5. The API server object event handling loop.
Fig. 4. The API input loop.
OCTOBER 1990 HEWLETT-PACKARD JOURNAL 23
© Copr. 1949-1998 Hewlett-Packard Co.
Callbacks on Graphics
Graphic objects include shapes such as arcs, rectangles,
and circles. Because graphic objects can be manipulated
the same as windows and widgets in the HP IVI environ
ment, we decided to have button press and button release
events associated with them. Therefore, graphic objects
need callback functions. For example, an octagon-shaped
graphic object representing a stop sign may require a
callback object with a method for stopping some operation.
Callbacks on graphic objects are handled differently from
widgets. Since the graphic objects are not widgets, the Xt
Intrinsics cannot be relied on to call API functions when
an event occurs on a graphic object. All widget and graphic
objects have a corresponding extent object. The extent ob
ject consists of two point objects that define a rectangular
region. When associated with an object, the extent defines
the smallest rectangle that encloses an object (see Fig. 7).
When the minifunction for window events detects a button
press or button release, it converts the x,y coordinate posi
tion of the sprite to a point object. Since the window
minifunction is called, this indicates that the button event
did not occur over a widget (remember the widget minifunction converts widget data to API usable data). The
button event results in a call to a function to find the object
that is under the point. The function will search the hierar
chy for an object that has the point in its extent. If a graphic
object is found, the object list is searched to see if there is
a corresponding callback function and if so, the event is
dispatched to the function.
Global Callbacks
A requirement of the API was to detect a function key
press regardless of the location of the sprite in the window.
This was a problem if the sprite was over a widget when
a function key was pressed because widgets grab any input
over them. The project team extended the callback process
so that the window object could also receive the event even
if it was over a widget. This type of callback is referred to
as a global callback.
Global callbacks are implemented by providing an addi
tional check during the input processing in the server object
(see Fig. 5). After the event is dispatched to the appropriate
object, a check is made to see if global callbacks are enabled.
Callback
Object
If so, the event is dispatched again to the window object
and any global callbacks attached to the window that match
the event are called. For events that were originally over
widgets, the x,y coordinates of the event are recalculated
to be relative to the API window object before dispatching.
Recalculation of widget points is done because the API
understands points relative to the window object coordi
nate system and not to the widget coordinate system.
Event Grabbing
For customers making their own user-interface builders
and also for HP IVIBuild, a feature was needed to direct
events only to the window. For example, the normal be
havior for a widget pushbutton object is to flash when it
is selected. However, in the builder, selecting the push
button may be the start of a move operation on it. To sup
press normal widget behavior and let the application deter
mine the meaning of the event, a button press event over
a widget has to be directed only to the window object. The
event has to be grabbed. To solve this problem, input han
dling at the server object level was modified so that if event
grabbing is enabled, the event is only sent to the window
object for processing.
Window Expose and Resize
When Expose and ConfigureNotify events occur on API win
dow or graphics objects, special functions are called in the
server object to handle these events. Since graphic objects
are not in individual X windows as the widgets are (see
Fig. 8), the window object has to redraw the graphic objects
when an Expose event occurs and resize its children when
a ConfigureNotify event occurs.
For an Expose event, the window object removes all Expose
events for this window from the queue and keeps two lists
of corresponding extent objects. Remember that an extent
object consists of two point objects that define a rectangular
Graphic Object (a Circle)
Window
(a)
User
Written
Function
Method for Drawing
a Circle
Point
Objects
Reason for
Callback
(Integer Value Representing
Type of Callback)
(b)
Callback-Specific
Data (e.g., File Descriptors)
Fig. 6. A callback object in the API.
Fig. 7. An API graphic object with an extent for defining the
smallest rectangle around a graphic object, (a) The graphic
object (a circle) in a window and the extent represented by
P1 and P2. (b) internal representation of the graphic object.
24 HEWLETT-PACKARD JOURNAL OCTOBER 1990
© Copr. 1949-1998 Hewlett-Packard Co.
region. One list contains the extents of each Expose event
in device coordinates. This list is used in the server object
to create X clip rectangles when graphics objects in the
exposed region are redrawn. The second list contains ex
tents of each expose event in normalized device coordi
nates. After constructing these two lists, the window object
goes through a redraw pass of the objects in the window.
When the graphics objects are told to display themselves,
they check the previous normalized device coordinate clip
list to see if they are in the exposed areas. If they are, they
send a message to the server object to do the X drawing
commands. This scheme ensures that only those objects
that are actually exposed get redrawn by the server object
and it significantly improves performance if exposed ob
jects are only a small portion of the window.
For ConfigureNotity events, the window object sets the new
window placement and size values. Then during the next
redraw of the window, the objects are redrawn to fit within
the new window size.
Coordinate Systems
The coordinate system concepts and techniques found
in various graphics packages are incorporated into the API
functions for drawing graphics objects, windows, and
widgets on the display. The user can define the viewing
area in world coordinates (e.g., inches, feet, etc.) and the
API functions transform these coordinates to a window in
the X coordinate system pixels.
A viewport is a rectangular portion of the display onto
which window objects defined in world coordinates are
mapped. Viewports are typically defined in a device inde
pendent coordinate system called normalized device coor
dinates, or NDCs. In X a viewport is represented by an X
window, which is defined in device coordinates (DCs). The
API allows users to define the position and size of a window
object (viewport) with NDC coordinates. This allows a win
dow to be defined as occupying a certain portion of the
total display area independent of display resolution. Map
ping a window object described in NDCs to the device
coordinates of a display is straightforward. When an appli
cation initiates drawing to a specific X server, the display
resolution of the server is queried. The NDC values describ
ing the viewport are multiplied by this display resolution
to get pixel values. Since NDCs use the lower-left corner
of the display as the origin and X uses the upper-left corner
as the origin, the y values of the viewport must be sub
tracted from the height of the display for compatibility
with the X coordinate system. Since this calculation is
done at run time, the application does not need to know
the type of display the application is using.
Consider a window that occupies the NDC region from
(0.0,0.0) to (0.5,0.5) on a display that is 1024 pixels wide
and 768 pixels high (see Fig. 9a). When converted to DCs
as explained above, the window occupies the region of the
display at pixel locations (0,767) to (511,384) (see Fig 9b).
The transformation equations for converting from NDCs
to DCs are:
PXDC = PXNDC x (width of display in DCs/1 NDC) (1)
PyDC = PyNDC x (height of display in DCs/1 NDC). (2)
To take into consideration the upper-left origin of the X
Window System:
P'yDC = height of display in DCs - PyDc-
Substituting the values from Fig. 9a into equations 1 and
3 and compensating for the starting pixel yields:
1.0,1.0
Display
Resolution
oox~ Origin
Window Object
Graphic
Objects
(3)
Widgets
J = Widget Window
(1023,767)
Fig. 8. Widgets are in their own individual windows and have
their coordinates defined relative to these individual windows.
Graphic objects have their coordinates defined relative to the
window object they are located in.
Fig. 9. (a) Window defined in normalized device coordinates
(NDCs). (b) The same window defined in device coordinates
(DCs) in the X Window System.
OCTOBER 1990 HEWLETT-PACKARD JOURNAL 25
© Copr. 1949-1998 Hewlett-Packard Co.
PIXDC = 0-0 x 1024/1 = O
PJyDC = 768 - (0.5 X 768/1) = 384
P2xoc = (0.5 X 1024/1) - 1 = 511
= 768 - (0.0 X 768/1) -1 = 767.
These coordinate values are shown in Fig. 9b.
To define what is drawn within the window object, the
user defines what portion of the world coordinate (WC)
space is viewable in that area. This viewable area can be
changed at run time to perform operations such as panning
or zooming. To draw to the X window representing the
user's window object, the API must convert all values in
WCs into the device coordinates of the display. WCs are
transformed to pixels in a two-step process. The first step
transforms the WCs to NDCs and the second step transforms
the NDCs to DCs.
Viewable Area in WCs
( 1 0 . 0 , 8 5 . 0 )
Display
(0.5.1.0)
( 1 1 0 . 0 , 8 5 . 0 )
(1.0,1.0)
Viewport for
Window
Defined in
NDCs
(1.0,0.5)
(0.5,0.5)
(10.0,10.0) (60.0,10.0) (110.0,10.0)
(a)
Window
Window
Window
(0.0,0.25) (0.25,0.25)
NDC
Origin
Pushbutton
(0.05,0.067) (0.3,0.067)
(b)
( 0 . 0 , 0 . 0 )
(
c
( 0 . 2 5 , 0 . 0 )
)
D i s p l a y
(
( 0 0 )
( 0 . 0 , 0 . 5 )
d
( 0 . 2 5 , 0 . 5 )
)
W i n d o w
(0,192) (255,192)
384 Pixels
(0,383)
512 Pixels
Fig. defined (a) The viewable area of the world coordinate window is defined to occupy the
upper-right quadrant of the display, (b) Results of applying the x and y scale factors to the
pushbutton coordinates, (c) Results of applying translation factors to the scaled pushbutton
coordinates, (d) Results after applying the flip factor tc compensate for the X window origin in
the upper-left comer of the NDC space, (e) Results after transforming the pushbutton from
NDCs to DCs.
26 HEWLETT-PACKARD JOURNAL OCTOBER 1990
© Copr. 1949-1998 Hewlett-Packard Co.
Every window object contains a viewport-to-window
transformation matrix (VTM). This matrix describes how
to scale and translate the viewable WC region to fit within
the window. A scale factor (SF) is calculated to scale the
WC width and height to the width and height of the view
port. This scale factor for the x coordinate is:
For the pushbutton example the translation factors are:
Tx = - 0.005 x 10 = - 0.05 NDCs
Ty = - 0.0067 x 10 = - 0.067 NDCs.
Adding the translation factor to the NDC points P! and P2
results in:
SFX = width of the window in NDCs^-width of the
viewable WC region in WCs
Plx = 0.05 - 0.05 = 0 NDCs
P2x = 0.3 - 0.05 =0.25 NDCs
and for the y coordinate is
Ply = 0.067 - 0.067 = 0 NDCs
Pzy = 0.318 - 0.067 = 0.25 NDCs.
SFy = height of the window in NDCsn-height of the
viewable WC region in WCs.
For example, in Fig. 10a the viewable
coordinate window is defined to occupy
upper-right quadrant of a display. The
mapping the WC region to NDCs in this
area of the world
a viewport in the
scale factors for
example are:
SFX = (1 - 0.5)/(110 - 10) = 0.005 NDCs/WC
and for the y coordinate
SFy = (1 - 0.5)/(85 - 10) = 0.0067 NDCs/WC
Fig. lOc shows the results of the translation.
Like most graphics packages, the API follows the conven
tion of defining the origin in the lower-left corner of the
drawing area. However, because the X Window System
defines the origin to be the upper-left corner, an additional
translation factor (or flip factor) must be added in the y
direction to move the origin from the lower-left to the
upper-left corner.
The NDC height for the window in which the pushbutton
in Fig. 10 resides is 0.5 NDCs. Compensating for the flip
factor (F) results in:
P ' iy= F - P , v•2y
= 0.5 - 0.25 = 0.25 NDCs
= 0.5 - 0.0 = 0.5 NDCs
â € ” F - P l y
To transform the pushbutton coordinates shown in Fig.
10a from WCs to NDCs:
P ' 2 y
and
Plx = 10 x SFX = 0.05 NDCs
P2x = 60 x SFX = 0.3 NDCs
P'ix = 0.0
P'2x = 0.25.
Ply = 10 x SFy = 0.067 NDCs
P2y = 47.5 x SFy = 0.318 NDCs.
Fig. lOb shows the pushbutton scaled to NDC coordinates.
The NDC system maps the coordinate (0.0,0.0) to the
lower-left corner of a window. Therefore, if the viewable
WC region does not map the coordinate (0.0,0.0) to the
lower-left corner of the window, a translation factor is
added to the NDC coordinates. The translation factors are
computed as:
Fig. lOd shows the result of applying the flip factor.
The scale factors, the translation factors, and the flip
factor are incorporated into the viewport-to-window trans
formation matrix VTM. Combining all the transformation
factors in one matrix and performing the transformation
operations looks like:
Tx = - SFX x (WCX origin)
Tv = - SFV x (WCV origin)
API Functions
(Interface to User
Code)
API Object Layer
Original Widget
Device
Independent
Layer
(Process Attributes and
Update Objects)
Server Object
•Hi
Widget Scaled
Larger
(Interface to X,
Xt Intrinsics, and"
Widgets)
Widget Scaled
Smaller
Widgets
Xt Intrinsics
X Window System
Fig. 1 1 . The effects of scaling widgets larger and smaller
around characters.
Device
Dependent
Layer
Fig. 12. The layers of the API architecture.
OCTOBER 1990 HEWLETT-PACKARD JOURNAL 27
© Copr. 1949-1998 Hewlett-Packard Co.
[P
xNDC yNDC
~
[ ? x W C
P y W C
SFX
O
O - SFV
Tx (-T, + F)
Fig. lOe shows the final transformation of the pushbutton
NDCs to X window device coordinates. The coordinate
points shown in Fig. lOe are derived by substituting the
values from Fig. lOd into transformation equations 1 and
2 and compensating for the starting pixel.
PIXDC = 0.0 x 1024/1 = 0
PlyDC = °-25 X 768/1 = 192
P2xDC = (0.25 X 1024/1) -1 = 255
P2yoc = (0-5 x 768/1) - 1 = 383.
Modeling Coordinates
The API provides modeling transformations that allow
any object within the user interface hierarchy to be trans
formed by scaling (enlarging or shrinking), rotation, and
translation. This lets the user draw a symbol that can be
reused by providing only the data that differentiates its
position and size from another instance of the symbol. The
API concatenates modeling transformations so that an ob
ject is affected by the transformations on its ancestors. This
allows an entire subhierarchy of objects to be transformed
by one operation ona common ancestor instead of requiring
transformations on every object in the subhierarchy. These
transformations are used when an object is being drawn.
The modeling transformation values are converted to WCs
by multiplying the transformation on an object to its WC
attributes. A current transformation matrix (CTM) is main
tained during a drawing pass on the objects. Each object
multiplies its transformation matrix with the CTM contain
ing the transformations of its ancestors. In the API, the
CTM is initialized to be the VTM. Doing this reduces the
number of matrix multiplications and improves the perfor
mance of the drawing operation.
Adjustments and Scaling
Besides allowing the application developer to work in a
display resolution independent manner when creating the
windows for an application, the world coordinate system
allows a user to resize the window interactively and the
objects to be redrawn without the intervention of the appli
cation. Changing the size of the window changes the NDC
definition of the window. This change causes the scaling
factors in the VTM to be recalculated at the next display
pass. The objects are either enlarged or shrunk to fit within
the new window size. When resizing a window, the user
may change its aspect ratio. That is, the physical width-toheight ratio of the object may be different from the WC
width-to-height ratio. When this happens, objects begin to
look distorted. For instance, a circle begins to look like an
oval. This may be an appropriate action for some applica
tions, but for others, especially those where the objects on
the display are meant to represent something in the phys
ical world, the application developer wants the objects to
maintain their width-to-height ratio. In graphics packages,
these two modes of operation are referred to as anisotropic
and isotropic scaling, respectively. The API window object
provides the attribute ZtADJUST which the application can
set to ensure that the aspect ratio is maintained. If this
attribute is set and the window is resized, the WC height
or width mapping to the window is adjusted to maintain
the original aspect ratio. This process results in modifying
the scale factors stored in the VTM. This also results in
more viewable WC space in the window in either the x or
the y direction.
Applying the various coordinate systems to windows
and widgets has worked successfully. Specifying their po
sition and size in NDC or WC units allows the user to
define them in the same manner as graphic objects. It also
allows the application to be independent of the display
and window size even as the user interactively resizes the
window.
Scaling and moving widgets works the same as for
graphics objects. However, as the widgets scale smaller and
larger, the font that they use does not scale because it is a
bit-mapped font. The widget scales larger and leaves more
space between the edge of the text and the edge of the
widget or it scales smaller and closes in on the text, even
tually clipping it (see Fig. 11). A few possible solutions to
this problem exist. One solution is for the X Window Sys
tem to support scalable fonts. This will allow the font to
scale with the widget. Another solution is to switch be
tween a set of fonts with different sizes as the object grows
and shrinks. Widgets also cannot rotate from a horizontal
base. In the API, when a widget is rotated, its defining
point is rotated, and the widget is redrawn in the new
position with a horizontal base. This allows the widgets
to be rotated as part of a symbol and to move along with
any associated graphic objects. Despite these differences
(continued on page 30)
Types of Files:
Class Header File (e.g., circle. h)
Class Definition File (e.g., circle. c)
Library Definition File (e.g., graphic. r)
Run-Time Class Information File (e.g., circle.rtc)
Glue File (e.g., classlibs.c)
1. Run rtc on Library Definition File
~^ circle.rtc
graphic. r
-> graphic.h"
-> graphic.c
2. Compile the Class Definition File
circle.c circle.h
circle.o
circle.rtc
3. Compile C Source File graphic.c Generated from rtc Tool
4. Glue Library Definition Object File
classlibs.c -
->• classlibs.o
graphic.h
Fig. 13. The process of adding a new object to the API object
hierarchy.
28 HEWLETT-PACKARD JOURNAL OCTOBER 1990
© Copr. 1949-1998 Hewlett-Packard Co.
Object-Oriented Design in HP IVI
HP IVI is an object-oriented system. It uses a set of facilities
called the HP IVI object-oriented environment (OOE) to provide
the framework for its implementation. The OOE has two parts: a
messaging interface and a tool for compiling an external descrip
tion of the class hierarchy into C language code. The C code
defines the dispatch tables used by the OOE's interface functions
to perform messaging (object communication). Presented here
are some basic concepts of object-oriented design and an over
view of how the OOE implements some of these concepts.
Object-oriented design and programming are proving to be a
natural and productive paradigm for software development be
cause they enable developers to represent relationships among
system components and the tasks to be performed on these
components in a more natural manner. The main concepts of
this methodology include objects, messaging, polymorphism,
and inheritance.
Objects. An object is the basic unit in object-oriented methodol
ogy. refer is a structure that contains local data structures and refer
ences the local procedures (called methods) that operate on the
data (see Fig. 1). The current values of an object's internal data
define the object's current state. The object's behavior is depen
dent on and current state. The data inside an object is private and
accessible only through one of the methods associated with the
object. An object acts on its data when it receives a request
asking one of its methods to perform some operation. This mech
anism is called messaging.
Objects are created from a template called a class. There can
be many objects of each class. These objects are called in
stances of the class. Each instance is an independent object
with its own data and state. However, an object instance has the
same data structures, shares the same methods, and behaves
the same way as all other instances of the same class. This
means that objects of the same class will respond to the same
messages — differences in object behavior depend on the current
state (the values of the object instance's data). For example, all
object instances of an object class that draws rectangles will
respond in the same way to a request to draw a rectangle. How
ever, because of differences in the state of the internal data
structures, the rectangles may be drawn in different sizes, colors,
and positions.
The OOE tool mentioned above is called the rtc (run-time class
information) tool. The rtc tool compiles a symbolic external rep
resentation of the class hierarchy into the data necessary for
defining classes and methods for those classes. The symbolic
representation of the class hierarchy is compiled by the rtc tool
to produce static tables called dispatch tables which consist of
two pieces: a category table and method tables. These tables
contain information necessary to dispatch messages to objects.
A unique key called the message selector is used tc search the
dispatch tables for a pointer to a function that will service a
request. The rtc tool also generates a file containing definitions
of symbolic names for the constants that represent the message
selectors. Coding using the symbolic names for the message
selectors provides independence from the structure of the under
lying rtc tables and provides more readable code. The rtc
tool and the type of files it compiles and generates are described
in more detail on page 31 .
Messaging. Objects communicate with each other through mes
saging. Sending a message to an object requests that object to
perform some action — usually the manipulation of its internal
data. Messages consist of a minimum of two arguments: the
receiver of the message (i.e., the object) and the message selec
tor. The message selector consists of a category name and a
method name. The object receiving the message looks up the
category selector in the category table and then looks up the
method in the corresponding method table. This selection mech
anism is controlled by a set of central messaging routines. These
routines are contained in the message interface to the OOE.
Every object contributes a dispatch table that the messaging
routines search to determine which object implements a function
for a a selector. Associated with each selector is a pointer
to a method that is called to implement the response to the
message (see Fig. 2).
This connection of a message selector to the appropriate
method is called binding. Binding can take place at compile time
(early or static binding), or at run time (late or dynamic binding).
The OOE currently implements static binding.
In the OOE, the message selector is the key to determining
which function gets called when a message is sent to a particular
object. The message selector is a 32-bit quantity consisting of
ObjecLa
Object
Data Private
to Object
message (Object.a, selector)
t
Receiver
Fig. the An object. The internal data structure is private to the
object and the methods have sole access to the data.
Fig. 2. Connecting a message to a method in an object.
OCTOBER 1990 HEWLETT-PACKARD JOURNAL 29
© Copr. 1949-1998 Hewlett-Packard Co.
message (Object_a, Display_Time)
message (Object_b, Display_Time)
Object_a
Object_b
15:00:25
Fig. 3. regardless allows the same message to be sent to different objects regardless of
their internal data types and methods.
two 16-bit fields. The upper 16 bits of the selector defines the
offset of the category to which that message belongs in the
class's category table. The lower 16 bits defines the offset of the
method function pointer in the method table.
If the value of a particular position in the dispatch table is
NULL, the messaging routines traverse up the class hierarchy
searching for a method function pointer. When a function pointer
is found, it is copied to the position in the dispatch tables where
the upward traversal of the class hierarchy began. This tends to
improve the performance of the messaging system over time
because the amount of upward searching is slowly replaced by
direct function calls and the NULL values in the dispatch tables
gradually disappear. Also, the implementation of categories im
proves memory use by eliminating method tables when a class
does not support that category.
Polymorphism. The concept of polymorphism in object-oriented
programming enables different types of objects to share a com
mon operational interface and to be manipulated by user code
independent of the actual types of objects. This means that the
application program does not have to differentiate the object
type at run time. This differentiation is performed automatically
by the messaging system. For example, a message to a clock
object to display the time would redraw the hands in a particular
position if the clock were drawn as an analog clock, while the
same message would cause the time to be displayed in text
format for a clock drawn as a digital clock (see Fig. 3). The clock
object is polymorphic because the same message can be sent
to different objects. The application does not have to worry about
how the time is drawn. That is determined when the method to
draw the clock interprets the instance data that defines each
clock is internal state. A goal of object-oriented design is
Root Class
Class A
to maximize code generality, flexibility, and reusability by defining
common interfaces that can be supported by many different
kinds of objects.
The mechanism of searching the class hierarchy described
above is how the OOE implements the concept of polymorphism.
Inheritance. Inheritance provides the ability to create incremen
tal definitions of objects (i.e., one kind of object can be defined
incrementally in terms of previously defined objects). The new
definition extends the existing definitions by adding data to the
object representation, by adding new methods, and by extending
the definition of existing methods. Using the update time example
from above, the analog clock object that produces the graphic
representation of the time might only implement the method that
draws the representation of the clock and inherit the more basic
functions (e.g., audible alarms) from the more general digital
clock class. Inheritance allows object definitions to be shared
(rather than copied) and customized by extension (rather than
by modification). A goal of object-oriented design is to organize
object definitions so that common behavior is specified in shared
definitions and object definitions can be extended.
The external representation of the class hierarchy that is pro
cessed by the OOE class compiler (rtc tool) builds tables of
function pointers. Entries that are not NULL in these tables indicate
that a particular class implements a particular method. NULL
entries indicate that a particular class inherits a particular method.
The class compiler also declares a pointer to the class's parent
in the hierarchy (see Fig. 4). The OOE messaging routines use
this information to traverse upward in the class hierarchy when
searching for a method.
In object-oriented systems, classes may have one parent or
many. Single inheritance allows a class to have only one parent.
This is the model implemented by the OOE. Object-oriented lan
guages such as Smalltalk and C++ allow classes to have more
than one parent. This is called multiple inheritance.
Class B
Pam Munsch
Project Manager
Industrial Applications Center
Steve Witten
Development Engineer
Industrial Applications Center
message (classBObj, method_2);
Fig. 4. Inheritance allows methods to be reused.
between the operation of the widgets and the graphic and
window objects, the coordinate system feature of the API
still provides a large productivity gain for the application
developer.
30 HEWLETT-PACKARD JOURNAL OCTOBER 1990
© Copr. 1949-1998 Hewlett-Packard Co.
Object-Oriented Architecture
Without using an object-oriented programming language.
the API encompasses features provided by an objectoriented language through conventional C language fea
tures. The API's architecture is divided into three layers:
the API function layer, the API object layer, and the device
dependent layer (see Fig. 12). The API function layer pro
vides the communication interface between a user applica
tion and the objects created by the application. It is a thin
layer of code that validates the user's parameters and sends
messages to the objects to perform the tasks requested. The
functions provided in this layer are described in the article
on page 11. In the API object layer, an object is created and
destroyed and all manipulation of an object's data occurs.
In the device dependent layer, all the function calls to
underlying subsystems are made to draw an object to the
display.
Messaging in the API
The API consists of a number of function calls that pro
vide the communication path between an application and
the underlying objects manipulated by the application.
Most of the API functions require objects as parameters. It
is through this interface that an object's specific data and
the functions that manipulate the data are accessed. In
essence, the API hides from the user as much as possible
the details of using objects.
To provide the interface between an application and its
objects, a preprocessor tool called rtc (run time class infor
mation) is used to define the API object messaging facility
and class interitance hierarchy based on information from
a group of description files. Every API class consists of a
class header file and a class definition file. The class header
file defines the data storage for each instance of an object
of that class. This file identifies the object as a member of
a class or classes and provides the connection to the set of
methods that manipulate that object's internal data. The
class definition file is a C program module that contains
the methods that are specific to a particular class. The class
header file must be included in the C program module so
that the data structure of this object and the class definition
pointer can be accessed. Once an object's data structure,
class, and specific functions are defined, it needs to be
positioned within the class hierarchy. The positioning of
the class in the class hierarchy is determined by the nature
of the class and the methods to be inherited. The simpler
a class is, the higher up in the class hierarchy it is
positioned. Conversely, a more complex class is positioned
further down in the class hierarchy. The positioning of a
class within the class hierarchy is defined within the library
definition file. This file defines the methods that are avail
able for messaging to a class and the methods that can be
inherited by that class.
Adding an API Object
Adding a new class to the API class hierarchy is a fourstep process. This process is illustrated for the circle class
in Fig. 13. First, the library definition file (graphic.r) is used
as the input to the rtc tool. The rtc tool takes the library
definition file and produces several files as output. One of
these output files (circle.rtc in Fig. 13) is the run-time class
information file, or .rtc file. A .rtc file is created for every
class defined in the library definition file. It contains the
class definition structure and the method dispatch tables
for that specific class. The .rtc file is included at the end
of the class definition file for that class when the class
definition file is compiled (step 2). In the third step the
new library definition files (graphic.h and graphic.c) are com
piled. Finally, the pointer to the new class must be added
to the file that defines the class hierarchy. This file is called
the glue file (classlibs.c). In step four, classlibs.c is compiled
with the class header file (graphic.h) to produce the object
file classlibs.o.) When these object files (circle.o, graphic.o, and
classlibs.o) are linked into an application, the addresses to
the methods supported by the various classes are resolved.
By using object-oriented technologies, the API is able to
create graphic objects. One problem users have with soft
ware systems such as the X library is that graphic primitives
are not objects. The X library provides many graphic func
tions that operate on the individual pixels of a graphic
display but the parameters describing the object are not
kept. For example, if a circle is drawn and the application
simply wants to change its color from blue to red, all the
parameters (location, size, line width, etc.) to draw the
circle must be passed to the X library function again. The
API solves this problem by providing graphic objects using
the rtc tool. This allows the user to describe the parameters
of the object once and then make simple modifications
only to the parameters that are changing. The application
is freed from maintaining all of the data necessary to redraw
all of the graphical objects in the window.
Conclusion
The HP IVI project was successful in blending graphics,
windowing, X toolkit, widget, and object-oriented tech
nologies in the internal design of the API. Because most
of these technologies were developed separately, it was not
always clear how to integrate them. The API solved most
of the problems encountered and as a result of this effort
a high-level user interface toolkit was created that reduces
the complexity of building a sophisticated graphical user
interface for an application.
Acknowledgments
Besides the three authors, the other members of the API
development team were Scott Anderson, Hai-Wen Bienz,
Mark Thompson, and Mydung Tran.
References
1. F. E. Hall and J. B. Byers, "X: A Window System Standard for
Distributed Computing Environments," Hewlett-Packard Journal,
October 1988, Vol. 39, no. 5, pp. 46-50.
2. K. H. Bronstein, D. J. Sweetser, and W. R. Yoder, "System
Design for Compatibility of a High-Performance Graphics Library
and the X Window System," Hewlett-Packard Journal, December
1989, Vol. 40, no. 6, pp. 6-12.
3. Ibid, p. 7.
4. J. A. Dysart, "The NewWave Object Management Facility,"
Hewlett-Packard Journal, Vol. 40, no. 4, August 1989, pp. 17-23.
5. T. F. Kraemer, "Product Development Using Object-Oriented
Software Technology," Hewlett-Packard Journal, Vol. 40, no. 4,
August 1989, pp. 87-100.
OCTOBER 1990 HEWLETT-PACKARD JOURNAL 31
© Copr. 1949-1998 Hewlett-Packard Co.
HP IVIBuild: Interactive User Interface
Builder for HP IVI
Using the facilities provided by HP IVI's application program
interface, HP IVIBuild allows developers to create and
experiment with different types of application user
interfaces, save them in files, and bind them to the
functionality of the application at run time.
by Steven P. Witten and Hai-Wen L. Bienz
THE EDITOR/BUILDER COMPONENT of the HP In
teractive Visual Interface product is HP IVIBuild. As
its name implies, HP IVIBuild is a tool that is used
to build user interfaces interactively. The windows and
objects that make up the user interface can be saved in a
file and reused later by other applications using the API
functions (see Fig. 1). HP IVIBuild is itself an HP IVI appli
cation program because it uses the API functions described
on page 11 as a platform. Fig. 2 shows the architecture of
HPIVIBuild.
Early in the design of HP IVIBuild we realized that al
though the HPIVI application program interface (API) func
tions are several orders of magnitude easier to use than
HP IVIBuildCreated
User
Interfaces
Xlib, the X toolkit, and widgets, they are still very complex
to many users. Therefore, an interactive user interface de
sign tool, HP IVIBuild, was developed to complement the
API functions.
HP IVIBuild helps promote software development pro
ductivity in areas such as rapid prototyping and the design
and modification of user interfaces. For rapid prototyping,
HP IVIBuild allows developers to create complex prototype
user interfaces. The user can interactively place and size
all of the primitive graphics and widget objects in a win
dow. Once the objects are placed and sized, many of their
physical attributes such as colors, shadows, strings, and
fonts can be changed easily within HP IVIBuild. Even some
one who does not have any software background, such as
a human factors expert, can use HP IVIBuild to design a
Processing States
Display
Output
Interstate Transition
State Machine
• API Functions
• HP IVI Object-Oriented
Environment
User
Input
HP IVI Widgets
Graphics
Driver xt Intrinsics
X Window System
Files Containing f
Saved User (
Interfaces L
Applications
Restoring User (
Interfaces and
Adding Functionality
Workstation
To Display
Hardware
Application
Application
Fig. 1. HP IVIBuild allows users to create and experiment
with different user interfaces and save them in files to be
reused by other API applications. (API = application program
interface of HP IVI.)
Fig. 2. The components that make up the HP IVIBuild ar
chitecture.
32 HEWLETT-PACKARD JOURNAL OCTOBER 1990
© Copr. 1949-1998 Hewlett-Packard Co.
complex user interface. This means that an application's
user interface can be prototyped and evaluated separately
from the operations performed in the application.
Besides restoring the user interfaces created with HP
IVIBuild, the API functions in the application also make
the objects in the interface react to user input. Callback
functions, which are invoked in response to user input to
the application, can be attached to those objects that should
respond to user input. If the application requires changes
to the user interface in response to application or customer
needs, the previously saved user interface can be modified
with HP IVIBuild. If the changes involve adding new ob
jects, callbacks can be added to the new objects using the
API functions in the application program. However, if
changes are made to existing objects, no changes need to
be made to the application program.
Fig. 3 shows the interface areas provided by HP IVIBuild.
The functions of these areas are:
• Utility Box. This area displays current object information
and the menus for object manipulation.
• Tool Box. This is the area in which the user selects the
objects to be manipulated.
• Workspace. This area displays the windows being
created.
concepts of objects, polymorphism, and inheritance are
incorporated into the design of HP IVIBuild.
Objects. In HP IVIBuild objects are very simple data struc
tures called states. A state is the context of user input (i.e.,
the operation in progress) at any particular point in time.
All states are static (bound at compile time) and have the
same structure. Only one field in the structure, called a
message selector, is filled in at run time. This field is used
to bind HP IVIBuild's user interface presentation to its
functionality. User interface binding and functionality are
discussed later in this article. The following is the C lan
guage structure of a typical state object.
/• compatibility with the HP I VI
,'* object-oriented environment and */
/ is not used by HP IVIBuild.
extern struct ClassDef_DzRect;
/ Structure containing pointersto */
/ this state's method dispatch
/ tables. This structure is
/ created by the API rtctool.
static INT32groupmembership[] { /'Array containing a state's
=
} ;
Object-Oriented Design in HP IVIBuild
/ This macro is included for
CLASSVARS(ClassVars)
N U L L
/
g r o u p
m e m b e r s h i p
i n f o r m a t i o n .
/ ' T h e p u r p o s e o f t h i s a r r a y i s t o
/ help limit state transitions
HP IVIBuild uses the API functions and the facilities
provided by the HP IVI object-oriented environment to
build its own object-oriented system. The object-oriented
/ at certain times. Currently
/ this feature is not used in
/"HP IVIBuild.
dJ.
File Edit Selec
O Graphics
Prompt: Select s menu ite« or Tool box button.
Current Model:
Utility Box
Tool Box
Workspace Area
Fig. 3. . Interface areas of HP
IVIBuild.
OCTOBER 1990 HEWLETT-PACKARD JOURNAL 33
© Copr. 1949-1998 Hewlett-Packard Co.
static char objectname[ ) = "sject"; / this state's name */
/ All state objects have the following structure. */
static struct DzRect{
struct ClassDePclass;
/ Pointer to the dispatch tables.
char *statename;
/ Pointer to the state's name.
INT32clsindex;
/ A unique id assigned to this state. */
INTSautoterm;
/ This state's autotermination */
/*flag (if TRUEthestate machine */
/ terminates the state and if FALSE */
/ an action by the user must */
/ terminate the state). */
INT32 selector;
/ Message sent to the current state */
ment state transitions in HP IVIBuild.
Polymorphism. HP IVIBuild's central input handling facil
ity, which is called the state machine, depends on the
concept of polymorphism. All states in HP IVIBuild have
the same operational interface (i.e., the state object is
polymorphic). Therefore to the state machine, all states
look the same and are able to respond to the same set of
messages. The state machine does not know or care which
state is currently active. It only knows that the current state
either implements or inherits all the methods that are the
targets of messages being sent to it.
The box on page 29 provides a brief review of objectoriented concepts and the HP IVI object-oriented environ
ment.
/"to cause a transition to this */
/
INT32 'group;
s
t
a
t
e
.
*
/ membership information. */
/ Data values assigned to the fields defined above
jtate_rect = {
/ Initialization.
&_DzRect,
/ Pointer to dispatch tables.
objectname,
/ Pointer to name.
27,
/ State's id number.
FALSE,
/ State is NOT autoterminating.
_s_rect,
/ Message selector that causes
/ transition to this state.
groupmembership
Input Handling
/
/ Pointer to this state's group */
/ Pointer to group membership
/ information.
idState s_rect = (idState)&_state_rect; /'Apointertothisstate
/"that is used by HP IVIBuild */
/* to access and manipulate */
/ data In this structure. */
Inheritance. In HP IVIBuild, as in most object-oriented
systems, state objects are arranged in a hierarchy. At the
root of the hierarchy is a special state known as the root
state (see Fig. 4). The root state in HP IVIBuild manages
interstate transitions. Since the root state is at the top of
the object hierarchy, it implements many more methods
than the other states in HP IVIBuild. Using inheritance,
the lower-level objects inherit all the methods from the
root state. This inheritance mechanism is used to imple
Messages sent by the state machine to a particular state
can result in either an interstate transition or an intrastate
transition depending on the message that is sent. Interstate
transitions are transitions among the various state objects
of HP IVIBuild, and intrastate transitions are transitions
within a particular state object.
A new state becomes current by an interstate transition.
Interstate transitions are handled by the state machine. All
input in HP IVIBuild goes through the state machine. The
state machine is an API callback function that is attached
to all the components of HP IVIBuild's user interface and
all of the workspace windows created by the user. The
objects in the HP IVIBuild user interface are called userinterface objects, and the objects created by the user during
an HP IVIBuild session are called user-workspace objects.
Using this mechanism, HP IVIBuild is able to control the
context of the user's input. This is an important require
ment of any interactive design tool.
The state machine performs the following functions:
• It changes the active workspace windows when the user
requests it.
• It interprets the meanings (context) of the mouse buttons
when they are pressed in the active workspace window
according to a user-definable mouse button map.
• It sends messages to the current state.
• It manages the state stack. The state stack is an array of
message selectors for the state objects.
• It makes new states current and terminates others that
have completed.
The Current State
There is always a state that is active. This state is called
Root State
Fig. 4. A portion of the HP IVIBuild object hierarchy.
Fig. 5. The state stack.
34 HEWLETT-PACKARD JOURNAL OCTOBER 1990
© Copr. 1949-1998 Hewlett-Packard Co.
the current state. The current state is always the state to
which the state machine sends any messages. It is up to
the current state to provide a target method for any mes
sages that the state machine may send it. The target method
is located either by implementation or by inheritance. If
no operation is in progress (i.e., only one state on the stack),
the current state is the root state. If an operation is in
progress, the current state is the state that implements that
operation (e.g., creation of an object such as a polyline or
widget).
No state knows which state was current before it became
current and no state knows which state will become current
after it ceases being current. These rules were strictly en
forced to ensure the black-box nature of each state's
methods during design and testing.
Once current, a state controls the context of the user's
input according to a state transition mechanism of its own.
These state transition mechanisms are called intrastate
transitions and are controlled entirely by the state itself
using a local variable called a subsidie. For example, mov
ing forward or backward in a sequence of actions that are
part of one particular operation, such as creating a polyline,
is controlled entirely by the state itself. The substate mech
anism is described later in this article.
State Stack Management
During the execution of HP IVIBuild the states that are
activated by the user are organized in a LIFO (last-in, firstout) stack (see Fig. 5). The state machine provides a mech
anism to suspend operations in progress to do another op
eration and then resume the suspended operation when
the new operation finishes. The state at the top of the stack
represents the current context of the user's input and is
the current state. Only the current state can receive any
messages. The maximum depth of the state stack is defined
to be ten states. This is an adequate depth because there
are other mechanisms in HP IVIBuild that prevent the state
stack from growing to a depth of more than three or four
states. The root state enters the state stack first and remains
there during the entire execution of HP IVIBuild. Therefore,
the root state is always in the stack regardless of the depth
of the stack.
At each interstate transition, the state machine checks
the autotermination flags of each state in the state stack. If
the autotermination flag is TRUE, that state is terminated
immediately by the state machine and removed from the
state stack. The state stack is then compacted and the state
ending up at the top of the stack is started. If the autotermi
nation flag is FALSE, only an action by the user can terminate
the state.
ZtUSEFLDATA attribute of the object that received the event,
which has a pointer to the message selector that, when sent
to the a state, will cause an interstate transition to a
new state. The state machine sends the message to the
current state. This process works the same way for HP
IVIBuild user-interface objects and user-workspace objects.
except that user-workspace objects always send a hit mes
sage to the current state. A window created by the user is
the only user-workspace object that functions like a user-in
terface object. A hit message results when a user presses a
mouse button in a workspace window.
If the current state can handle the message, the method
that is called will either return a pointer to the current
state or a NULL. This pointer is returned to the state machine
as part of the normal message sending mechanism of the
HP IVI object-oriented environment. States return pointers
to themselves when they want to remain current. This will
cause an intrastate transition. States return NULL when they
receive an exit message and want to cease being the current
state. This will cause an interstate transition. Fig. 6 shows
a portion of the state transition process.
Since the root state is the parent of all other states, the
interstate transition process depends heavily on inheri
tance. Each state inherits all the methods from the root
state. When a state receives a message for which it does
not have a method, the HP IVI object-oriented environment
will search the current state's lineage (object hierarchy)
until it finds the target method for the message. In the case
of an interstate transition, the target method will always
be found in the root state. The target method in the root
state returns a pointer via the object-oriented environ
ment's messaging system to the state object that is to be
made the current state. This is the pointer that the state
machine compares to the value of the pointer for the current
state. When it sees that the two pointers are different, it
Button
Release
Event
DzState Machine (..., msg.selector)
1
Send Message to
Current State
State Transition and Inheritance
As mentioned earlier, an interstate transition is the pro
cess of making a new state (a state not currently on the
state stack) the current state. The new state is placed at the
top of the state stack and started by the state machine. The
state transition process begins when an event occurs such
as a button release over an object on the display. The first
thing to happen is that the state machine function is called
as part of the normal API callback processing (see page 23).
The state machine function is passed a pointer to the
Send start
Message to the
Current State
Make New
State Current
Continue Looking
for Events
Fig. 6. The state transition process.
OCTOBER 1990 HEWLETT-PACKARD JOURNAL 35
© Copr. 1949-1998 Hewlett-Packard Co.
places the new pointer at the top of the state stack (making
the state current) and sends a start message to the new state.
Thus, by inheritance, every state object has the ability to
activate any other state object.
When an intrastate transition occurs, there is no change
to the current state (i.e., the pointers are equal). The current
state handles the incoming message itself.
State Protocol
All states follow a specific protocol that is implemented
in the state machine of HP IVIBuild. Fig. 7 illustrates this
protocol. An interstate transition (Fig. 7a) occurs when the
current state receives an exit message and it returns a NULL
to the state machine indicating that it wants to cease being
the current state. The state machine makes the new state
the current state and sends a start message to the new state.
The new state remains the current state as long as it con
tinues to return a pointer to itself to the state machine (e.g.,
CurrenUState in Fig. 7b). Following this protocol allows a
state to control the meaning of user input within its own
context. Each state implements or inherits five standard
methods that constitute its operational interface: start, hit,
backup, undo, and exit.
Start. As shown in Fig. 7, the start message is the first message
a state receives before any other message is sent to the state
(except exit).
Hit. A state gets a hit message when the user presses a mouse
button in the workspace window that is currently active.
HP IVIBuild allows the user to construct and edit as many
windows as desired but only one can be active at a time.
To activate another window, the user only has to press a
mouse button over the window that is to become active.
Depending on their hit methods, states are classified as
either multiaction or single-action states.
A multiaction state requires the user to select multiple
points in the active window to perform the operation im-
plemented by the state. An example of a multiaction state
is one that allows the user to create polylines or splines.
When the user presses a mouse button in the active window
and a multiaction state is the current state, the action of
the state is said to go forward. Fig. 8 shows the intrastate
transition diagram for a multiaction state that translates
objects.
A single-action state does not require a hit in the active
window to go forward. Single-action states can only do
one thing. An example of this are selections (i.e., states
that select certain kinds of objects for further operations).
Once the class of objects that are to be selected is known,
the objects are selected and no further input from the user
is required. Any single-action state that receives a hit mes
sage is terminated and removed from the state stack. The
hit message is sent to the the new current state. Fig. 9
shows the intrastate transition diagram for all single-action
states.
Backup. All multiaction states implement backup. This is
the reverse operation of a hit message because it allows the
user to cause the action of the state to go backward over a
previously sent hit. No single-action states implement back
up.
Undo. All states implement undo. Undo allows the user to
back a state up to the point right after it received its first
start. This has the effect of undoing any actions that had
been performed by the state. Undo may also be sent im
mediately after a previous undo to effect a redo operation.
Exit. A state is sent an exit immediately before its removal
from the state stack. This allows the state to reinitialize
Interstate
Transition
return (Current_State)
Current State
Interstate
Transition
backup
return (NULL)
start
return (Current_State)
(a)
Intrastate
Transition
( I n p u t
User
Workspace)
o v e r
b a c k u p
return (Current_State)
start
backup
return (Current_State)
(b)
Fig. 7. HP IVIBuild state protocol, (a) An interstate transition,
(b) Intrastate transition.
Fig. 8. Intrastate transition diagram for a multiaction state
that cur objects. These states are substates of the cur
rent state shown in Fig. 7b.
36 HEWLETT-PACKARD JOURNAL OCTOBER 1990
© Copr. 1949-1998 Hewlett-Packard Co.
itself for its next activation.
The Substate
Once current, a state controls its own actions using a
local variable called the substate. During a sequence of
operations, the messages start, backup, hit, and undo may be
sent repeatedly to the current state. These actions do not
cause interstate transitions. Rather, they cause intrastate
transitions. The current state does not change but the mean
ing of the next input event may have to be interpreted
differently depending on the sequence of messages the state
has received since it was made current. The value of the
substate is changed to reflect the context of the next hit,
backup, or undo. Note that start is always sent after every
action whether the action causes an intrastate or interstate
transition. This is part of the protocol established for a
state by the state machine.
Uniformity
Great care was taken to ensure that the same actions have
uniform behavior no matter which state is current. The HP
IVIBuild team developed guidelines for developing states,
and intrastate transition diagrams were developed before
the development of a particular state so that the uniformity
of actions could be assessed by the whole team. The result
is a tool with very modular units of functionality that all
behave in a consistent and intuitive manner.
The HP IVIBuild User Interface
HP IVIBuild's user interface was designed as a collabora
tive effort between the HP IVIBuild team members and the
industrial design department at HP Software Engineering
Systems Division (see the article on page 39). The objective
of the collaboration was to design a user interface for HP
Interstate
return (Current_State)
Transition return (NULL)
IVIBuild that was both attractive and intuitive to the user.
Besides the appearance. HP IVIBuild is structured to han
dle native language support and user customization. One
other interesting feature is that the HP IVIBuild user inter
face presentation is not bound to the functionality until
run time.
Native Language Support and Customization
HP IVIBuild's user interface conforms to HP standards
regarding support for native languages and cultures. All
text that is presented to the user such as labels, prompts,
and error messages is contained in message catalogs and
is retrieved by HP IVIBuild at run time. To localize HP
IVIBuild, the user only needs to change the contents of the
catalogs. In general, these tasks are performed by HP per
sonnel in the country whose native language is the target
language. This way, text can be presented with as much
context sensitivity as possible. Idiomatic nuances of text
presentation are not lost (as they sometimes are with
straight translations).
Another feature of HP IVIBuild's user interface presenta
tion is that colors, tiles, fonts, mouse button bindings and
icons can be customized for individual users by modifying
the X Window System configuration file .Xdefaults. This
mechanism allows individual users to customize the pres
entation of IVIBuild's user interface to suit their own needs
(e.g., left-handedness, black-and-white display).
Presentation and Functionality Binding
The presentation of the components that make up the
user interface of HP IVIBuild (i.e., the buttons, menus, win
dows, with and the functionality (the states) associated with
these components are bound together at run time. The func
tionality of HP IVIBuild, that is, the result of pressing a
certain sequence of buttons, is not dependent on the user
interface presentation. For example, in one user interface
presentation, drawing a rectangle might be accomplished
by selecting buttons labeled P1 and P2 for the lower-left
and upper-right corners of a rectangle and typing the coor
dinates into a pop-up dialog box. In another user interface,
Current State
Message
Selector
Parameter
(ZtUSEH_DATA)
State
Machine
Csllbsck
Function
Fig. 9. Intrastate transition diagram for single-action states.
These states are substates of the current state shown in Fig.
7b.
Ztlnput
Calls...
Fig. 10. Binding HP IVIBuild user interface presentation to
functionality at run time.
OCTOBER 1990 HEWLETT-PACKARD JOURNAL 37
© Copr. 1949-1998 Hewlett-Packard Co.
drawing a rectangle might be a three-button sequence in
which the user presses the Rectangle button and then clicks
on the desired coordinates with the mouse. In either inter
face, the state operations result in a rectangle.
The binding of functionality to user interface presenta
tion is done when HP IVIBuild starts up. At this time the
objects (windows, menus, buttons, etc.) that make up the
HP IVIBuild user interface are restored from a file. Pointers
to objects (Ztlds) that activate states or send messages to the
state machine are looked up using the name of the object
that was assigned when the object was created with the
API functions. This lookup is accomplished using an API
function. When the Ztld for an object is returned, the mes
sage selector for the state to be activated is retrieved. At
this point a callback object (ZtCALLBACK_OBJ), which will
call the state machine whenever an event occurs on the
user interface object, is created for the user interface object.
Also, the message selector from the state object is made an
attribute (ZtUSEFLDATA) of the user interface object. Once
the callback object is attached to the user interface object,
the binding is complete (see Fig. 10). When a specified
event occurs on a particular user interface object, the in
terstate transitions described earlier occur. This scheme
makes the state machine a callback for every IVIBuild user
interface object and for every workspace window the user
creates.
Separating the user interface presentation from function
ality means that the presentation can be developed inde
pendent of functionality and the same functionality can be
easily given a new presentation. New functionality can be
added and tested in a straightforward way without worry
ing about its presentation.
Acknowledgments
There were many challenges presented and many re
wards gained in the development of HP IVIBuild. So many
people added their inputs to HP IVIBuild that it is hard to
mention them all. We would, however, like to thank Ron
MacDonald (now at HP's Graphics Technology Division in
Fort Collins, Colorado) who endured a year away from his
home to work on HP IVIBuild. Every time a user draws a
polyline or spline or makes a widget with HP IVIBuild,
they will be using Ron's work. Thanks also go to Shiz
Kobara of HP's Software Engineering Systems Division
(SESD) who had the original idea that the user interface
was a place where industrial designers could make a con
tribution. Thanks to Steve Anderson and Jennifer Chaffee
of SESD who followed through on Shiz's idea while Shiz
was busy working on HP OSF/Motif. Our users will see
their work every time HP IVIBuild displays its user inter
face. Thanks to everyone who gave us their comments and
encouragement.
Conclusion
HP IVIBuild was conceived with two objectives in mind:
to be a powerful, easy-to-use tool to complement the HP
IVI application program interface functions and to be the
first API application and as such to provide feedback to
the API development team. Both of these objectives have
been accomplished. We believe that HP IVIBuild's func
tionality and designed-in extensibility based on an objectoriented architecture are among the first for tools of this
type.
38 HEWLETT-PACKARD JOURNAL OCTOBER 1990
© Copr. 1949-1998 Hewlett-Packard Co.
Creating an Effective User Interface
for HP IVIBuild
The HP IVIBuild user interface was a collaborative effort
between the software engineers developing the code for
the product and a group of industrial designers who
understand the requirements of an effective graphical user
interface.
by Steven R. Anderson and Jennifer Chaffee
AMONG THE PRESENT and potential customers for
HP's computer systems are companies that are in
creasingly integrating computers into their manu
facturing processes. However, the computer focus of these
companies is more on solutions than on hardware and
software development. To help provide these solutions on
HP computer systems there are efforts within the company
to encourage or enable independent software vendors
(ISVs) to develop these software solutions. HP IVI from
HP's Industrial Applications Center (IAC) is one such effort.
Its purpose is to help ISVs build graphical user interfaces
for their applications used in industrial applications.
Why the need for a graphical user interface? Many of the
operators and users of computer-based systems in an indus
trial environment are not computer literate. They typically
perform tasks like controlling an automated spray paint
line, and the interfaces to the tools they use are typically
knobs, dials, buttons and other physical and visual objects.
A command line interface is a totally foreign approach for
these people, and many of them refuse to deal with it.
Whatever can be done to enable the interfaces to come
closer to the users' current way of doing things is seen as
having value. A graphical user interface is seen as having
the greatest potential in making the interface familiar. Re
cent developments in user interface technologies1 are very
suitable for graphical user interfaces in industrial automa
tion applications.
Background
HP IVIBuild is a tool that enables users to develop graphi
cal user interfaces interactively. Therefore, it seemed
appropriate that it should have a graphical user interface.
For this capability the HP IVIBuild developers decided to
use the graphical user interface components that were
under development at HP's Interface Technology Operation
(ITO) in Corvallis, Oregon. These components are com
monly called widgets.2 They include things like menus,
scrollbars, pushbuttons, text-edit boxes, and radio buttons.
They are the raw materials from which a graphical user
interface is assembled. The HP IVIBuild team had no idea
that using widgets would lead to collaborating with visual
design professionals.
Neither did we, the visual design professionals, know
about the HP IVI team. We are the usability design and
engineering group of HP's Software Engineering Systems
Division (SESD). We are former industrial designers who
switched our design focus from designing hardware enclo
sures to the area of user interfaces, plus one graphic design
er. At the time our division was developing what would
become the HP SoftBench environment,3 and we were also
looking to ITO for the necessary widgets. Rather than pas
sively waiting to see what they might provide, we were
encouraged by our management to lend our professional
expertise to the widget development, and ITO was openminded enough to listen to some of our ideas.
We didn't begin with any proven graphic user interface
expertise. We had done some design analyses of the leading
graphical user interfaces. Also, coming from a background
in which our experience and training forces us to process
information visually gave us some ideas about how an ef
fective graphical interface should look. And because our
experience with software and computers was limited to
being application users, we had some first-hand knowledge
about the user interface requirements for users who are not
software literate.
Basic Principles
Three principles have established the foundation for
graphical user interfaces in recent years, notably in officeoriented applications. The first principle is that it is easier
for most people to have their alternatives presented to them
in a manner that allows them to make choices rather than
having to remember all of the alternatives. Choosing a com
mand from a menu is often easier than remembering it.
The second fundamental principle is that making these
choices by some means of direct manipulation is often
preferred over typing in text commands. Pushing a button
or dragging a file icon into a folder icon or a trash can are
two examples of direct manipulation. Finally, the third
principle is to use metaphors from the real world. For exam
ple, we know what to do with a pushbutton.
In our analyses of the many graphical interfaces existing
today, one of the impressions we formed was how confus
ing they could be because of the flat and bland graphics.
This is especially true in multiwindow environments in
which there is a high degree of overlapping and the simi
larity of the graphic images seems to blend all the images
together into one confusing mass. We thought that creating
OCTOBER 1990 HEWLETT-PACKARD JOURNAL 39
© Copr. 1949-1998 Hewlett-Packard Co.
greater visual distinctiveness between objects would signif
icantly enhance a user's ability to keep things sorted out.
Scrollbars are hybrids, with a recessed groove containing
raised controls. Menu bars look like large buttons with
several labels on them. When the mouse drags over a menu
item, it appears to raise, transforming itself into a button.
When a menu item is selected by releasing the mouse but
ton, the feedback mechanism is the same shadow reversal
the pushbutton uses to appear recessed. Fig. 1 shows the
transition from a total 2D appearance to a full 3D appear
ance.
Most people found this 3D appearance appealing. It be
came a key factor in the subsequent adoption of the HP
widgets by the Open Software Foundation (OSF) for their
OSF/Motif standard user interface.4
3D Appearance of Widgets
Our first attempts to express widgets graphically were
with the traditional black lines on a white background. To
get away from the sameness mentioned above, some of the
widgets were drawn to look three-dimensional and to look
and act like pushbuttons. It soon became apparent that the
displays of the future would not be constrained to simple
black and white, and that larger areas of solid color could
be used. This was a significant breakthrough.
With the capability to use color, we added three colors
to the black and white. By using light, middle, and dark
versions of a color, we could make a button look very
three-dimensional. This was achieved by making the top
and left edges light, the flat surfaces the middle value, and
the bottom and right edges dark. This technique makes it
appear as though a light is shining on the button from the
upper left. Another nice by-product of this technique is
that by momentarily switching the light and dark colors
when a button is selected, it actually appears to be pushed
in. It was so effective that people got a little silly pushing
buttons the first time they saw a working prototype.
People intuitively grasp the notion that if something ap
pears to protrude, it can be pushed or selected to generate
some action. Widgets that accept or display inputs appear
to be recessed. Noninteractive things like labels are flat.
A New Principle
The 3D appearance ends up creating a new fundamental
graphical user interface principle: the visual separation
and distinction of what we call user space and interface
space. User space is where the user's inputs go, or where
the user performs work. Examples are the space provided
in a word processor for entering text, or the space provided
in a paint program for creating images. It also includes
those areas where the user is asked to input data like the
name of a file.
The rest of the screen is the interface space, or the visual
manifestations of the applications and/or the operating sys
tem. Included in this category are items like window
frames, dialog boxes, tool panels, menus, and the metaphor-
Conuert
Conuerted DOS file will be displayed in R1...JIO.
Conuert
From DOS File
To DOS File
File Name:
enter text here
Conuert
Conuerted DOS File will be displayed in HI. ..,11 II.
Type of Conuersion
Conuert
. From DOS File
File Name:
enter text here
1 To DOS File
Type of Conuersion
Conuerted DOS file will be displayed in R1...J10.
Total 2D
Displayed Directory:
Type of Convei"
J
Partial 3D
Full 3D
40 HEWLETT-PACKARD JOURNAL OCTOBER 1990
© Copr. 1949-1998 Hewlett-Packard Co.
Fig. 1 . Transition from total 2D ap
pearance to a full 3D appearance.
ical desktop. The interface space, whether controlled by
the application or the operating system, is where all of the
3D effect is found.
In office-oriented applications, which have been driving
the graphical user interface movement to date, the 2D user
space is usually dominant in terms of screen area. The
main focus of these applications is generally to provide a
tool that allows the user to create different forms of docu
ments such as mail messages, memos, charts, spreadsheets,
overhead slides, and newsletters. Based on these applica
tions, the user space is perceived to be the WYSIWYG
equivalent of some sort of paper document, whether a small
notepad or a large drawing. It is predominantly two-dimen
sional, which is appropriate because the resulting docu
ments are also two-dimensional.
There is an emergence of graphical user interfaces in
which the interface space dominates because the main
function of the applications is not document creation but
some form of process setup and control. Examples include
things like configuring and running a set of test instru
ments, or monitoring and controlling a complex tempera
ture control system or an assembly line. HP IVIBuild is
geared to create interfaces of this latter type. The 3D widgets
(or OSF/Motif widgets) are particularly well-suited to this
type of interface because the physical reality they convey
is much closer to the mental model most people have of
activities that are control-panel oriented. Fig. 2 shows one
window for an office-oriented application and another for
an instrument control panel.
control-panel-like layouts with animated graphics and
numerous controls. These capabilities were not obvious in
the original interface shown in Fig. 3.
HP IVIBuild before Redesign
Collaboration
In the early stages of development, the HP IVI team used
the initial version of the widget code from HP's Information
Technology Operation. The early results of their using this
code produced the 3D appearance shown in Fig 3. Unfor
tunately the 3D effect was largely lost and the user interface
was hard to understand. This early result was not a surprise
because the HP IVIBuild team had not yet had enough
experience with widgets and consequently had little notion
of how to achieve and use the 3D effect. They were also
unfamiliar with many of the standard techniques and prac
tices for creating graphical user interfaces.
Our group had concurrently been using the 3D widgets
with our own HP SoftBench tools. That successful experi
ence plus the acceptance of HP widgets for OSF/Motif gave
us a certain amount of credibility. As a result we soon
found ourselves in contact with the HP IVIBuild team. Like
our experiences with the ITO team in the development of
widgets, the HP IVIBuild people were very open-minded
in letting us get involved with their product.
HP IVIBuild was different for us in that it not only uses
conventional widgets to create a graphical user interface,
but it can also create graphic objects that behave like
widgets. What this means is that buttons and scrollbars
can be supplemented with graphic representations of ob
jects that can change to reflect current status. For example,
a graphic image of a storage tank can change to show the
current level of the liquid it contains, or an assembly line
schematic can be changed to reflect the status of each work
cell. The output of HP IVIBuild can range from simple
windows with menu bars and dialog boxes to very complex
The Structure of HP IVIBuild
The HP IVIBuild user interface is divided into three parts:
a utility box, a tool box, and a workspace.
The Utility Box. This area holds the menu bar, a prompt
window, several status indicators, and some commonly
used commands in the form of pushbuttons.
The Tool Box. This area is like a palette of various graphic
or widget creation tools. It has three modes: graphics,
widgets, and models. The graphics mode functions like a
typical paint program, displaying numerous drawing tool
buttons as well as mechanisms for displaying and selecting
items such as colors, patterns, and line weights. The widget
mode is used for creating and specifying the widgets. The
models mode is used to get access to models, which are
templates or libraries of previously created work. Fig. 4
shows the utility box and tool boxes at an early point in
the design stage of HP IVIBuild.
The Workspace. This is the area in which the user does
the work of building a user interface. In this area graphic
or widget objects are put together on a kind of three-dimen
sional sheet of paper. After assembly, they are stored away
for use as finished products or as models for reuse or mod
ification. For example, a simple dialog box might be used
as a template for other dialog boxes, eliminating the need
to start each one from scratch.
The early efforts by the industrial designers focused on
sorting out the functionality found in each of the HP
IVIBuild areas and then finding reasonable ways of present
ing each area. The utility box and the tool box visual layouts
received the most attention. One of the first steps was de
termining the menu structure in the utility box. Certain
conventions and many examples exist in industry showing
how applications organize and perform activities like edit
ing and filing — for example, the locations of commands
like cut, copy, paste, and quit in a word-processing package.
And certain conventions exist in terms of dialog box layout,
like where the OK, cancel, and help buttons should go. We
followed accepted general practices wherever possible, and
tried to develop acceptable solutions where no previous
models existed.
The tool box with its various modes was probably the
most complex job. The final layout chosen for the tool box
owes many of its approaches to showing status and offering
choices or functions to existing de facto standards for paint
programs. There were instances where we were forced by
technical limitations to deviate from these standards. For
example, a simple draw tool like the one used to draw a
rectangle typically requires a decision about whether the
rectangle is to be filled in or left as an outline. A typical
solution is to have one button with a rectangle on it, with
the left half hollow and the right half filled (what looks
like one button is in fact two buttons). In our case the
widgets wouldn't allow that approach, so we ended up
with a separate button to turn the fill function on or off.
Fig. 5 shows the design recommendation for the utility and
OCTOBER 1990 HEWLETT-PACKARD JOURNAL 41
© Copr. 1949-1998 Hewlett-Packard Co.
This case simple typical Office-oriented application window, in this case a simple woid planning
document. Olher types of applications which would be similar to this are spreadsheets,
chartingand graphing programs, various drawing and paint programs, desktop publishing
applications, as well as CAD programs. All of these share certain characteristics: they want to
be of most WYSYWYG character, and the final product of using them is most often a two
dimensional piece of paper,
It is the entirely appropriate that the User Space in which the user does the document
creation resembles the final product—a sheet of paper. It is large, white, fiat, uses black "ink,"
etc. Unless of course, it is an application that creates colored documents, The main point is
that two dimensional User Space tends to dominate the user interface.
The other window shows a different sort of application. Here the focus is on doing tasks
like is up and running tests or making measurements, It is applications like this that
IVlBuild is designed to create. Because the User Space is so limited, the three dimensional
Interface Space dominates, This ends up being a good feature, as the applications can end up
looking very much like the older hardware products their users are familiar with.
Fig. 2. One window with a typical
2D office-oriented application and
the other window showing a 3D
instrument control panel.
tool boxes at a later stage in the development.
Colors were another area where the designers had some
thing to contribute. We had some color schemes in hand
from our earlier work on widgets as well as from our work
with HP's SoftBench product. This greatly simplified the
tricky decisions required to convey the 3D quality of
widgets. We provided the color names and RGB values that
had to be assigned to each widget component to make the
3D effect work and provide a pleasant overall interface.
Fonts were also important. Graphical user interfaces in
general, and the 3D widgets in particular, are very much
dependent on good fonts to be successful. While the popu
lar notion of a graphical interface centers on icons, most
of the work is still done with words, and good pro
portionally spaced fonts make words work better. The HP
IVlBuild team decided to use some display fonts that had
been created by HP expressly for 3D widgets. These fonts
provided both behavioral benefits (text properly centered
Fig. 3. A very early version of
HP IVlBuild when the design team
first began to use widgets.
42 HEWLETT-PACKARD JOURNAL OCTOBER 1990
© Copr. 1949-1998 Hewlett-Packard Co.
Fig. 4. The visual designers' first
proposal for the HP IVIBuild user
interface.
in widgets, text baselines lined up, etc.) and a consistent,
high-quality look.
The designers also created all of the bit maps and icons
associated with the tool boxes and other aspects of the
product. One challenge with many of the tool box buttons,
especially for those in the widgets mode, was to express
the 3D nature on a small scale and with only two colors.
The illusion of using three colors was achieved by using
a light and a dark color and then introducing a dithered
pattern that the eye blends together to form a third color
(see Fig. 6).
The final area of collaboration was to do something visual
and graphical to help explain and sell HP IVIBuild. Some
sample screens were created that express how HP IVIBuild
can actually be used. With just a little prompting on how
to use the 3D effect, a designer used HP IVIBuild to create
two sample screens for each of seven potential application
areas. These compelling images, achieved through the use
of the actual tool, have done more to explain HP IVIBuild
and its capabilities than a volume of marketing brochures.
One of these sample screens is shown in Fig. 2 on page 8.
Conclusion
We learned a few things as a result of this collaborative
exercise. One is that experts often have problems com
municating their concepts and ideas to nonexperts. In this
case we had two groups of experts. We found that it was
important to have a main conduit or interpreter between
the user interface designer and the rest of the software
team. Without someone to answer all of the questions the
Fig. 5. A later version of the user
interlace after incorporating some
of the implementation limitations.
OCTOBER 1990 HEWLETT-PACKARD JOURNAL 43
© Copr. 1949-1998 Hewlett-Packard Co.
Fig. 6. Achieving the 3D effect
with only two colors.
user interface designer asks, and interpret the various
dialogs with the team members, the communication pro
cess really breaks down. One designer interfacing with a
half-dozen individual team members means a half-dozen
different interfacing styles.
Another lesson we learned is how important it can be
to have an early vision of what you are trying to do. Tools
exist that enable designers to create this vision and user
scenarios quite quickly. The power and usefulness of these
visuals should not be underestimated. They are powerful
catalysts for people's thinking and communication. Once
these are analyzed, discussed, and modified, the product
is better understood by all concerned. Only at this point
should the interface coding begin. The mistake should not
be made of bringing the visual design help in at the very
end to fix up the icons. Chances are the flaws go far beyond
cosmetic graphics, and at this point the investment has
been so great that significant changes are nearly impossible.
Acknowledgments
Acknowledgments are due some of the key people who
are responsible for this successful collaboration. First, to
Steve Joseph and Chuck House of SESD, for letting us work
outside of our own division. Both of them have been amaz
ingly farsighted in encouraging us to work wherever we
can use our expertise to help HP product development. At
HP's Industrial Applications Center (IAC) where HP IVI
was developed, thanks go to section manager Chuck Robin
son, project manager Vicki Mosely, and team members
Steve Witten, Pam Munsch, Scott Anderson, and Ron Macdonald for their patience and openess. And within IAC
mrketing, special thanks to Dushyant Sukhija and Andy
Lerner for their enthusiastic adoption of visual selling tech
niques. Finally, a special acknowledgment to the other
members of the industrial design team, Barry Mathis and
Shiz Kobara.
References
1. A.O. Deininger and C.V. Fernandez, "Making Computer Be
havior Consistent: The HP OSF/Motif Graphical User Interface,"
Hewlett-Packard Journal, Vol. 41, no. 3, June 1990, pp. 6-12.
2. D.L. McMinds and BJ. Ellsworth, "Programming with HP OSF/
Motif Widgets," Ibid, pp. 26-35.
3. M.R. Cagan, "The HP Softbench Environment: An Architecture
for a New Generation of Software Tools." Ibid, pp. 36-47.
4. "OSF/Motif," Ibid, p. 8.
44 HEWLETT-PACKARD JOURNAL OCTOBER 1990
© Copr. 1949-1998 Hewlett-Packard Co.
Authors
General Motors Corp., and the HP Graphics Inter
face System. Roger earned a BA degree in micro
biology in 1 976, an MS degree in microbiology in
1978, and an MS degree in computer science in
1981, all at the University of Hawaii. Born in
Honolulu, he lives in San Jose, California, where he
enjoys volleyball and ballroom dancing.
October 1990
sistant at Lawrence Berkeley Laboratories. A
member of the ACM, her professional interests in
clude computer graphics, parallel processing, and
networking. She received her BS degree in physics
in 1975 from the University of San Francisco and
her MS degree in computer science from San Fran
cisco State University in 1 989. Born in Saigon, Viet
nam, she is married, has a son and a daughter, and
lives in San Francisco.
Mark E. Thompson
! Software engineer Mark
Thompson- joined HP's
Data Systems Division in
1 980, where he worked on
disk diagnostics and util
ities, I/O drivers for HP
1000 computers, and a
t; |Wr ^ quality decision manage
ment program. For the HP
IVI project, he was respon
sible for graphic objects, the error handler, and the
quality function deployment analysis. His profes
sional interests center around 2D and 3D graphics.
Mark received his BS degree in computer en
gineering from Boston University in 1980. Born in
San Francisco, California, he lives in Berkeley. His
interests include automobile restoration, beer mak
ing, photography, bicycling, gardening, hiking,
camping, and audio electronics.
1 = HP IVI Toolkit :
David G. Wat hen
I User interface design,
'graphics, and artificial ¡nl telligence are the profes
sional interests of David
Wathen, a software en' gineer who developed eni hancements for the HP IVI
Droject. He joined HP's In
dustrial Applications
Center in 1989, shortly after
he received a BS degree in computer science and
applied mathematics from the University of Colo
rado at Boulder. Before joining HP, he was a soft
ware designer for the National Center for Atmos
pheric Research (NCAR), where he built an X1 1
window interface to NCAR graphics. David was
also an advanced interface intern at US West,
where he worked on future telephone projects.
Born in Littleton, Colorado, he resides in Sunnyvale,
California, where he enjoys Tae Kwon Do, skiing,
4-wheel driving, backpacking, and traveling.
6 ~ HP IVI !
I Roger Lau, a technical mar
keting engineer at HP's InI dustrial Applications
I Center, provided technical
1 support for HP IVI. Roger
1 joined HP's Data Systems
Division in 1981. He has
| worked as a development
engineer and a technical
"W lead in the development of
the HP Advanced Graphics Package, the
HP Device Independent Graphics Library, the
HP Manufacturing Automation Protocol pilot for
Mydung Thi Iran
BB| Software engineer Mydung
Iran was responsible for
widget development, test
ing, and native language
support for the HP IVI proj
ect. She joined HP's Indus
trial Applications Center
in 1988. Mydung has au
thored or coauthored five
technical articles on distrib
uted processing, particle dosimetry, space radia
tion, and nuclear track detectors. Before joining
HP, she was a research physicist at the University
of California at San Francisco, and a graduate as-
21 =1 HP IVI API Design
Pamela W. Munsch
Pam Munsch, a software
development engineer on
the HP IVI project at HP's
Industrial Applications
Center, worked as a de
velopment engineer on an
1C testing project shortly
after she joined HP's Santa
Clara Division in 1 983. She
is now an R&D project man-
OCTOBER 1990 HEWLETT-PACKARD JOURNAL 45
© Copr. 1949-1998 Hewlett-Packard Co.
ager working on HP IVI . Pam received her BS de
gree in computer science in 1 983 from the Univer
sity of California at Santa Barbara. She is married,
lives in the city of her birth, San Jose, California, and
enjoys playing volleyball.
Warren I. Otsuka
^•CL^^B As an R&D software en•^^ "**-^ gineer at HP's Industrial
Applications Center,
Warren Otsuka was
responsible for input
handling and widget ob
jects for the HP I VI project.
% I After joining HP's Data Sysj+^jf^ *. terns Division in 1978, he
worked on support for the
HP F/1000 forms management tool and HP
F/1000/HP-UX products. Before joining HP, Warren
was a project lead for user interface development
and an engineer on a document project for Docugraphix, Inc., and he provided system support for
the STAR-100 operating system at Control Data
Corporation. He earned a BS degree in computer
science from the California State University at
Chico in 1972. Born in Kona, Hawaii, Warren is mar
ried, has a daughter, and lives in Campbell, Califor
nia. He enjoys family activities, reading
mysteries, and photography.
Gary D. Thomson
¡Software development en
gineer Gary Thomsen, who
joined HP's Data Systems
Division in 1979, helped
design widget classes for
the HP IVI project. Before
that, as an R&D software
engineer, he provided supP°rt f°r the HP 1 000 Series
i I ii·IP f Forms/1000 product, and
as an R&D product design engineer, he designed
the HP 1000 Series A hardware packaging. Gary
earned his BA degree in mathematics from San
Jose State University in 1 977. He is married, lives
in San Jose, California, and enjoys Softball, biking,
and woodworking.
32 ~HP IVIBuild
Data Systems Division in 1 978. Initially, he worked
on Datacap/1000 and supported HP 307x termi
nals, and then developed an energy management
system for HP using the PMC/1 000 system. Before
joining HP, he worked for Environmental Research
and Technology, Inc., where he compiled a data
base of airborne sulfate/particulate measurements
for the Electrical Power Research Institute's study
of acid rain. Steve is a frequent contributor to
INTEREX, the HP users group, writing technical ar
ticles on object-oriented programming. A member
of the Institute of Industrial Engineers, his profes
sional specialty centers around object-oriented
technology. He received a BS degree in computer
science in 1 974 and an ME degree in industrial en
gineering in 1976 from the California Polytechnic
State University in San Luis Obispo. Born in
Bakersfield, California, Steve is married, has two
daughters, and lives in San Jose. His hobbies
include computers and reading detective novels.
Jennifer Chaffee
Hai-Wen L. Bienz
Hai-Wen Bienz was re
sponsible for the develop
ment of the graphic objects
and dynamics in the HP IVI
application program inter
face. She joined HP in 1 985
and served as a publica
tions engineer at HP's
Santa Clara Division, and
\^K^H later as a marketing en
gineer for the Strategic Grants program at HP
Laboratories. Hai-Wen's professional interests in
clude designing user interfaces and software tools
to enhance productivity. Before joining HP, she was
a coop student and engineer at General Motors
Corp. , where she developed real-time digital con
trol systems. Hai-Wen earned a Bachelor's degree
in electrical engineering from the General Motors
Institute in 1 983 and an MS degree in electrical en
gineering from the University of Illinois at UrbanaChampaign in 1984. She is married and lives in
Naperville, Illinois. Her interests include moun
taineering, skiing, photography, cooking, and
hiking.
39 1= HP IVIBuild User Interface :
Steven P. Witten
Steven R. Anderson
The principal architect of
the HP IVIBuild portion of
the HP interactive Visual In
terface, Steve Witten im
plemented the state ma
chine and window and
model handling for the proj
ect. Now an R&D engineer
at HP's Industrial Applica
tions Center, he joined HP's
system furniture products, including the HP 9221 4
CAD worktable. Now a lead designer on the HP
VUE graphical environment for HP-UX worksta
tions, Steve's professional interests include making
computers visually appealing and fun to use. He
is named as an inventor on an industrial design
patent for a Xerox copier, coinventor of a product
design layout patent on a color printer concept
from HP Laboratories, and coinventor on a patent
application for HP 3D widgets and extensions.
Steve received a BS degree in industrial design
from the University of Bridgeport in 1966. Born in
Hibbing, Minnesota, he is married, has two chil
dren, and lives in Mountain View, California. He en
joys playing golf at dawn on Sundays, bicycling to
work, and activities with his children.
Visual interface designer
Steve Anderson helped des'9n the user interface for
the HP IVIBuild product. He
joined HP's Calculator
Products Division in 1976
and was responsible forthe
industrial design package
for the HP 9845 computer/
controller and computer
46 HEWLETT-PACKARD JOURNAL OCTOBER 1990
© Copr. 1949-1998 Hewlett-Packard Co.
Jennifer Chaffee worked on
the user interface for the
HP IVIBuild product at HP's
Industrial Applications
Center. She joined HP in
1988 and worked on HP
OSF/Motif and the HP New
Wave Office. Before com
ing to HP, she worked in the
industrial design and user
interface department of the Xerox Corporation
copier division. A 1 985 graduate of the Rochester
Institute of Technology with a BFA degree in
graphic design and art history, Jennifer's profes
sional interests include the visual design of com
puter user interfaces. Born in Fort Worth, Texas,
she lives in Sunnyvale, California. She enjoys paint
ing, pastels, pottery making, backpacking, travel
ing, and photography.
49 = BaFe Preselected Mixers
Michael J. Levernier
^^f^^ Development engineer
^BH|& Mike Levernier was responf sible for the design of the
W — - I HP 1 1974 filter drive cir
cuitry and for HP 1 1 974 test
development. He joined
HP's Signal Analysis DiviI sion in 1984 as a manufac
turing engineer respon
sible for the HP 8557A and
HP 8559A spectrum analyzers. Following that, he
worked on the microwave and RF front-end mod
ules of the HP 70000 modular spectrum analyzer
family. He also served as an HP regional sales de
velopment engineer. Mike received his BS degree
in 1983 in electronic engineering from California
Polytechnic State University, San Luis Obispo, and
his MS degree in 1986 in electrical engineering
from Stanford University. Born in Sacramento,
California, he lives in Windsor, California. His hob
bies include windsurfing, skiing, and racquetball.
Robert J. Matreci
Bob Matreci served as R&D
project manager during de
velopment of the HP 1 1 974
ected spectrum
analyzer RF sections. He
joined HP s Signal Analysis
Division in 1978 as a pro
duction engineer in micro
wave microelectronics.
After transferring to the
R&D lab. he developed millimeter-wave acces
sories for spectrum analyzers, including the HP
1 1 970 Series waveguide harmonic mixers. Before
joining HP, he developed avionics test equipment
for weather radar. Bob has authored two technical
papers and is named an inventor on a patent re
lated to the preselected RF sections product He
is a member of the IEEE and is the program chair
man of the local subsection. Born in Chicago, Il
linois, Bob is married and resides on Riebli Moun
tain near Santa Rosa, California. His interests in
clude sailing on San Francisco Bay and near the
Northern California coast, and volunteer testing
of emergency beacons for NASA's Search and
Rescue Satellite (SARSAT).
59 — Hexagonal Ferrites ;
Dean B. Nicholson
1 For the past eight years,
| Dean Nicholson has grown
barium ferrite single crys
tals, processed them into
spheres, and designed fil
ters using the spheres.
' Since he joined HP's Micro
wave Technology Division
| ¡n 1980, he has also been
responsible for charac. and sapphire substrates. He re
ceived his BS degree in 1980 with dual majors in
electrical engineering and materials science en
gineering from the University of California at Berke
ley. Dean is an author or coauthor of four technical
papers on barium ferrite-tuned filters and oscil
lators. He is named an inventor on a patent on the
four-sphere filter configuration that is part of the HP
11974 spectrum analyzer RF sections product.
Born in Orange, California, Dean is married, has
three daughters, and lives in Windsor, California.
He enjoys diving, hiking, and camping.
62— HP DIS:
Kent L. Garliepp
Specializing ¡n computeraided manufacturing, Kent
Garliepp worked on de_ sign, development, and
!jlà testing of HP DIS software
• for HP 9000 computers as
I a member of HP's Industrial
| Applications Center in Sun
lit nyvale, California. After
joining HP ¡n 1959, he pro
vided computer support for the solid-state labora
tory of HP Laboratories, and 1C manufacturing soft
ware support at HP's Cupertino Integrated Circuits
Operation. More recently, he helped design soft
ware for truck manufacturing at HP's Advanced
Manufacturing Systems Operation. Born in Palo
Alto, California Kent is married, has four children,
and lives in Capitola. California His interests in
clude bicycling, radio-controlled models, and
water-color painting.
Kathleen A. Fulton
, After joining HP's Engineer
ing Productivity Division ¡n
• 1984. software engineer
I Kathy Fulton helped dei| velop the equipment con• trol portion of HP's
Semiconductor Productiv
ity Network. She also de| signed and coded the conIH^^BH figuration, initialization, and
run-time portions of the HP DIS product, and is now
testing and maintaining HP Sockets software at
HP's Industrial Applications Center. Before joining
HP, Kathy was a semiconductor fabrication en
gineer at Burroughs Corp. and a software develop
ment engineer at Trilogy Corp. and Amdahl Corp.
A member of the IEEE, she received her BA degree
in 1 975 ¡n applied physics and information science
with a specialization in computer science from the
University of California at San Diego. Born in Reno,
Nevada, Kathy is married and lives in Cupertino,
California. Her interests include traveling to
unusual locations, reading science fiction, and
quilting.
John U. Frohlich
As a member of the software development team at
HP s Industrial Applica
tions Center. John Frohlich
helped develop the HP DIS
product. He joined HP in
[ 1976 at the company s Op
toelectronics Division, and
helped develop machine
language programs for cal
culator-based systems to test LED display devices
He also has worked on several versions of the RTE
operating system for HP 1000 computers and on
ATS/1000 software John received his BSEE de
gree in 1 963 at the Lucerne State College of Tech
nology in Switzerland He is a member of the IEEE
Born in Switzerland, he lives ¡n Cupertino, Califor
nia, and enjoys mountain hiking, biking, and listen
ing to old jazz recordings
73
R, L, C Measurements
Asad Aziz
^^^^^ Now a marketing account
J^H ^^^ manager for HP's Circuit
^ 1 T e c h n o l o g y G r o u p , A s a d
Aziz was previously in R&D,
^•nflMl where he worked on the de
sign, layout, modeling, and
Vy electrical model verification
of the PCX CPU package
^^^^^^^^ Before that, he worked on
.^•IHIHHBkk packaging R&D for HP PARISC computers, and on TAB design and electrical
modeling. Asad joined HP's Colorado Integrated
Circuits Division in 1 985, shortly after he graduated
from Brigham Young University with a BSEE degree
in 1 984. He received an MBA degree ¡n 1 990 from
the University of Denver. A member of the IEEF. he
has coauthored two technical papers on packag
ing. Born in Lahore, Pakistan, Asad is married and
lives ¡n Fort Collins, Colorado. He enjoys squash,
bicycling, and windsurfing
Irene Skupniewicz
For the past four years at
HP, Irene Skupniewicz has
worked as an R&D software
. • « ~ engineer in the develop
ment of manufacturing ap
plications Currently, she is
in the Manufacturing Appli
cations Group working on
the Device Interface Sys
tem and Software Integra
tion Sockets, two products that are part of HP's in
dustrial precision tools for HP 9000 computers.
Irene earned a BS degree (1981 ) in industrial en
gineering from the University of Wisconsin, and an
MS degree (1987) in electrical engineering from
Carnegie-Mellon University ¡n Pittsburgh. Before
joining HP, she worked with Unimation/Westinghouse ¡n Pittsburgh to develop robotic systems.
Born in Racine, Wisconsin, Irene lives in Cupertino,
California. For many years, she has been a "die
hard" runner and enjoys meeting other HP people
through her membership in the HP Running Club.
Ravi Kaw
I Ravi Kaw developed a
methodology to measure R,
L, and C parameters in
VLSI packages using coax
ial probes rather than cusI torn-designed boards.
| Since joining HPin 1982, he
I has served as a product
engineer for DRAM and
math chips and as a
semiconductor process engineer, and has worked
on package measurements and modeling re
search. Before joining HP, Ravi was a lecturer at
Kashmir University and an engineer at the Jet Pro
pulsion Laboratories and Fairchild Semiconductor
Corp. He is the author of 14 technical articles on
device physics, device modeling, packages and
OCTOBER 1990 HEWLETT-PACKARD JOURNAL 47
© Copr. 1949-1998 Hewlett-Packard Co.
systems, and measurement methods. His work has
resulted in two pending patents on packaging
structures and systems and measurement methods.
Ravi is a member of the IEEE and the International
Packaging Society. He received his BE degree in
1966 in electronics and telecommunications from
Jabalpur University, his MSEE degree in 1972 in
microwave solid-state devices from Marquette Uni
versity, and his PhD degree in 1 978 in solid-state
electronics, quantum electronics, and microwaves
from the University of California at Los Angeles.
Ravi is a member of the board of directors of a local
Hindu community and cultural center, and a Sun
day school teacher. Born in Srinagar, Kashmir,
India, he is married, has two children, and resides
¡n San Jose, California. He enjoys jogging, garden
ing, hiking, and reading.
David W. Quint
Before Dave Quint joined
HP's Desktop Computer Di
vision in 1979, he helped
design nuclear reactor
control systems for Westinghouse-Bettis Atomic Power
Laboratories. As an HP
R&D design engineer, he
developed tape automated
.'
bonding (TAB) and pin-grid
array (PGA) packaging for VLSI circuits. He is now
an R&D engineer working on integrated circuit
packaging at HP's Colorado Integrated Circuits Di
vision. Dave's work has resulted in two patents, one
describing a method of sampling a 1 00-GHz opti
cal pulse stream, and another for a method of de
positing tungsten for integrated circuit intercon
nects. His professional interests include integrated
circuit process engineering, electromagnetic
fields, circuit analysis, and optical electronics. He
published a paper in the Journal of Applied Physics
while at MIT, and has coauthored three conference
papers on electronic packaging. He received his
BSEE degree in 1972 and MSEE degree ¡n 1976
from the University of Wisconsin at Madison, and
earned a PhD degree ¡n 1979 from the Massa
chusetts Institute of Technology. Dave served as
a weather observer ¡n the U.S. Air Force from 1 963
to 1 967, attaining the rank of sergeant. Born in Barran, Wisconsin, he is married, has two boys and a
girl, and resides ¡n Fort Collins, Colorado. His hob
bies include weight lifting and taking karate lessons
with his children. Dave says they hold advanced
belts ¡n the martial arts, but he's still working on the
basics.
Frank J. Perezalonso
Frank Perezalonso
specializes in hardware design engineering and
analog circuit design and
measurements. He joined
HP Laboratories in 1 984 as
a semiconductor process
technician, and is now a
member of the technical
staff of HP's Circuit Tech
nology Group. He worked on the electrical charac
terization of the high-performance HP 408C PGA
integrated circuit package. In the past, Frank was
involved in E-beam lithography process develop
ment, evaluation and test of HP's membrane probe
card, and test methods for the electrical characteri
zation of 1C packages. Before he joined HP, he
worked on semiconductor processing for Fairchild
Semiconductor Corp. and as an instructor ¡n math,
physics, and semiconductor processing at Foothill
College in Los Altos, California. He studied
semiconductor processing at Foothill College, re
ceived a BSEE degree in 1 985 from the University
of Santa Clara, and expects to receive his MSEE
degree in December. Born in Managua,
Nicaragua, Frank is married, has a daughter, and
lives in San Jose, California. He enjoys sports and
teaching.
78 — Statistical Simulation
Chee K. Chow
Manufacturing develop
ment engineer Chee Chow
specializes ¡n computerintegrated manufacturing,
manufacturing data bases,
and analog and microwave
circuits. He joined HP's
Santa Clara Technology
I Center ¡n 1984 and has
n done research in statistical
circuit simulations for circuit designs. He recently
transferred to HP's Microwave Semiconductor
Division. In the past, Chee worked on bipolar high
speed circuits at HP, and researched coal conver
sions and materials at Washington State University,
where he received his PhD degree in 1 974 ¡n phys
ical chemistry. He also earned an MS degree ¡n
1984 ¡n electrical engineering from Oregon State
University. Chee is the author of 1 5 technical arti
cles on fuel processing, physical chemistry, and
electronics.
48 HEWLETT-PACKARD JOURNAL OCTOBER 1990
© Copr. 1949-1998 Hewlett-Packard Co.
82 _ Air Flow Analysis :
As manager of computer
fluid dynamics applications
at Cray Research, Inc.,
Kent Misegades collabo
rated with HP on airflow
simulation in the HP 9000
Model 850 computer. At
Cray Research, he is re
sponsible for all fluid
I dynamics-related applica
tions in the aerospace, automotive, metals, elec
tronics, and chemical industries. His experience
also includes work as an aerodynamicist for Dornier GmbH ¡n West Germany from 1980 to 1984.
A member of the AIAA, Kent's professional in
terests include aircraft design and fluid mechanics.
He is a graduate of Auburn University with a BSc
degree (1 979) in mechanical engineering, and has
an ME degree (1 980) in fluid dynamics from the von
Karman Institute ¡n West Germany. Born ¡n Los
Angeles, California, Kent is married, has three chil
dren, and resides ¡n Eagan, Minnesota. His hob
bies include aircraft design and radio-controlled
sailplanes.
Vivek Mansingh
¡Since joining HP's Systems
Technology Division in
1987, Vivek Mansingh has
performed research and
I development in thermal
i management of electronic
I equipment in the comI pany's mainline systems
^^^ j lab. Using finite-element
modeling, he analyzed
three-dimensional air flow in the HP 9000 Model
850 computer. Before joining HP, Vivek taught at
Lehigh University from 1 986 to 1 987. A member of
the ASME, the IEPS, and the CHMT, he has au
thored or coauthored 1 2 technical publications on
thermal fluids, and is named an inventor on a pend
ing patent. He earned his MS and PhD degrees in
1 986 from Queen's University in Canada, studying
mechanical engineering and specializing ¡n ther
mal fluids. Born in Fatehpur, India, Vivek is married,
has two children, and lives in Santa Clara, Califor
nia. He enjoys traveling with his family and singing
Indian music with a professional group. His
hobbies include jogging, tennis, and badminton.
26.5-to-75-GHz Preselected Mixers
Based on Magnetically Tunable Barium
Ferrite Filters
A new resonator material — barium ferrite — and a new foursphere design are featured in a series of magnetically
tunable preselection filters for the millimeter-wave
frequency range.
by Dean B. Nicholson, Robert J. Matreci, and Michael J. Levernier
THE NEED FOR HIGHER PERFORMANCE has driven
the frequency ranges of systems and components
from the microwave range (under 30 GHz] into the
millimeter wavelengths (30 to 100 GHz). Moving to higher
frequencies makes it possible, for example, to increase the
antenna gain of small reflectors and to improve the spatial
resolution of imagers. The benefits of the move to milli
meter-wave bands are being felt in many fields, especially
communications, remote sensing, and defense.1
The spectrum analyzer, a calibrated receiver with vari
able resolution, is an important basic tool for testing and
troubleshooting such systems. Microwave spectrum
analyzers use advanced technology to provide accurate,
unambiguous frequency-domain measurements. HewlettPackard has extended these measurements into the mil
limeter-wave bands.
A new series of preselected spectrum analyzer RF sec
tions, the HP11974 Series preselected mixers, makes milli
meter-wave spectrum analyzer measurements faster and
easier by removing image and multiple responses from the
spectrum analyzer display, thereby eliminating the need
for complicated signal identification routines. Each RF sec
tion consists of a mixer to down-convert millimeter-wave
signals into the intermediate frequency range of HP micro
wave spectrum analyzers, and a magnetically tuned pre
selection filter to remove unwanted signals. The preselec
tion filter uses barium ferrite resonator material, doped so
that it starts resonating at the beginning of the waveguide
band (see article, page 59).
Table I lists the four preselected RF sections and their
frequency ranges. Each RF section covers a full waveguide
band (±20% bandwidth), one of the four standard bands
from 26.5 to 75 GHz.
The HP 11974 Series preselected mixers are compatible
with the HP 8566B spectrum analyzer, the HP8563A port
able spectrum analyzer, the HP 70000 modular measure
ment system with the HP 70907B external mixer interface
module, and other HP microwave spectrum analyzers.
They provide a displayed average noise level at 10-Hz
bandwidth that is lower than -106 dBm in the A, Q, and
U bands and lower than -95 dBm in the V band. Image
rejection is better than 55 dB in all four bands.
Table I
HP Millimeter-Wave Preselected
Spectrum Analyzer RF Sections
(HP 11974 Series Preselected Mixers)
Methods of Extending the Frequency Range
There are three principal ways to extend the frequency
range of a microwave spectrum analyzer. The first method,
shown in Fig. la, uses a classic superheterodyne receiver
front end. A tracking preselector and a local oscillator (LO)
both sweep the same frequency span, separated by the in
termediate frequency (IF). The preselector prevents spuri
ous responses, such as images or intermodulation products,
from being displayed. The LO must be phase-locked and
have reasonably low phase noise. To use this method, highQ resonators and active devices maintaining negative resis
tance across the full waveguide bands would have had to
be developed. The design would have been intricate and
expensive. These technological difficulties eliminated this
method from consideration for the HP 11974 Series. Fig.
2 shows where this type of millimeter-wave extender
would interface with the mainframe microwave spectrum
analyzer.
A block down-converter, shown in Fig. Ib, eases the
local-oscillator problem by using one fixed oscillator per
band instead of the swept LO of the superheterodyne re
ceiver. With this down-converter, input RF frequencies are
converted to an identical but lower frequency span (swept
IF). The swept IF can be arranged to be within the range
of the microwave spectrum analyzer. Even though the res
onator and the active devices are operated at a single fre
quency, designing for performance and cost still poses a
formidable problem. Also, this method lacks a tracking
preselector, so the first mixer is subject to distortion caused
OCTOBER 1990 HEWLETT-PACKARD JOURNAL 49
© Copr. 1949-1998 Hewlett-Packard Co.
Tracking
Preselector
Fundamental
Mixer
RF In
50 to 75 GHz
®— (S
Swept LO
50.32 to 75.32 GHz
Sweep
Tune
Ramp In
(a)
(Swept)
D) IF Out
1 to 26 GHz
RF In
50 to 75 GHz
Phase
Detector
Wideband
Preamplifier
Ref
Block Diagram
(b)
Harmonic Mixer
n=14
RFIn
50 to 75 GHz
LO In
3.54 to 5.33 GHz
Tune Ramp
(c)
by multiple signals and even single input signals. The wide
span of the IF can cause another problem. It requires a very
wide-bandwidth IF amplifier to improve the sensitivity of
the microwave analyzer, which is used as a variable IF strip.
The preselected harmonic mixer version of the super
heterodyne front end, shown in Fig. Ic, provides a reason
able compromise. The preselector protects the mixer from
spurious responses. The mixer, a harmonic type, uses a
millimeter-wave harmonic of the existing microwave LO
in the analyzer. The conversion loss of such a harmonic
mixer exceeds that of the fundamental harmonic mixer
shown in Fig. la, but the design effort goes into the preselec
tor, which is a passive component and therefore somewhat
easier to design than a millimeter-wave LO. (Of course,
once the resonators for such a preselector are available, a
wideband oscillator may be possible if the active devices
can be obtained.)
Fig. 1 . Three types of RF sections for extending the frequency
range of a spectrum analyzer. The letters A, B, C, and D refer
to Fig. 2, which shows where these RF sections connect to
the spectrum analyzer, (a) The superheterodyne RF section
uses a swept preselector and a swept local oscillator (LO).
The phase-locked loop is used to set the beginning of the LO
sweep accurately, (b) The block down-converter has a fixed
LO and a swept intermediate frequency (IF), (c) The harmonic
mixer version of the superheterodyne RF section.
The method of Fig. Ic was chosen for the HP 11974
Series preselected mixers. Fig. 3 shows the HP 11974 block
diagram. The RF signal that is to be down-converted to IF
enters the waveguide flange of the tunable preselector
shown in Fig. 3, then goes to the isolator and the HP 11970
Series harmonic mixer. Electromagnets in the preselector
develop a magnetic field, which tunes the preselector. The
scaling electronics transforms the tune ramp voltage of the
spectrum analyzer into magnet current.
The unbiased harmonic mixer was developed previ
ously2 to extend spectrum analysis into the millimeterwave range. If used without a preselector, the mixer con
verts the RF signal to an IF whenever an LO harmonic
sweeps past the RF. However, the horizontal frequency
scale is only calibrated for a single harmonic of the LO,
the 14th for the V-band example shown in Fig. 4a. The
desired response, the 14 + signal in Fig. 4a, appears as a
result, as do several unwanted responses resulting, for
example, from the 12th, 16th, and higher harmonics.
In the spectrum shown in Fig. 4a, the RF input consists
of several signals from the frequency comb of a multiplier
with outputs every 5.1 GHz. The unpreselected harmonic
mixer shows several unwanted responses to each comb
Harmonic
Mixer
n = 1,2,3,4
RF Input
2 to 26 GHz
LO
Sweep
Ramp
Generator
50 HEWLETT-PACKARD JOURNAL OCTOBER 1990
© Copr. 1949-1998 Hewlett-Packard Co.
Fig. 2. Microwave spectrum ana
lyzer block diagram, showing inter
face points (A, B, C, D) with the
millimeter-wave RF sections shown
in Fig. 1 .
IF Output
(310 or 321
RF In
. LO Input
S (3 to 6 GHz)
Fig. 3. HP 11974 Series prese
lected millimeter-wave RF section
block diagram.
REF 0. 0 dB
UNPRESELECTED
HARMONIC 14L
PRESELECTED
HARMONIC 14L
START 50. 0 GHz
RES BW 300 KHz
VBW 30 KH=
STOP 75. 0 GHz
SWP 7. 50 o«s =
(b)
Fig. 4. ("aj X\n unpreselected spec
trum analyzer sweep from 50 to
75 GHz for an input signal consist
ing of comb lines from a multiplier.
There are several unwanted re
sponses to each comb line. The
harmonic responses to the 51GHz comb line are labeled, (b) A
preselected spectrum analyzer
sweep for the same input signal.
The multiple responses are elimi
nated and the multiplier comb
lines every 5. 1 GHz are clearly
displayed.
OCTOBER 1990 HEWLETT-PACKARD JOURNAL 51
© Copr. 1949-1998 Hewlett-Packard Co.
line, thereby producing many responses, most of which
are unwanted and severely hamper measurements.
The HP 11974 preselected mixers add a waveguide track
ing preselector to the harmonic mixer. The resulting V-band
display is shown in Fig. 4b. Here, only one response occurs
for each of the five comb lines.
Magnet Pole
Magnetic
Field Lines
Hexagonal Ferrite Filter Design
Having decided to design the HP 11974 Series by adding
tunable bandpass filters as preselectors to the HP 11970
Series unpreselected harmonic mixers, we looked for the
easiest way of doing things to make the best use of our
resources. At the outset, we had decided to use doped
hexagonal ferrite spheres as filter resonator elements. Their
built-in frequency offset (see article, page 59) allowed
us to employ existing YIG tuning magnet designs to cover
waveguide bandwidths. Because the HP 11970 mixers have
TE10 waveguide inputs, and because it seemed extremely
difficult to reduce typical YIG filter loop coupling struc
tures (Fig. 5) to the small sizes that would be required to
make filters for the highest-frequency band (50 to 75 GHz),
we decided to use TE10 waveguide as the transmission
medium in our filter.
The high-frequency (53 to 80 GHz) barium ferrite filter
work done by Lemke and Hoppe3 served as a starting point
for our filter design. Their two-sphere, iris-coupled filter
used crossed input and output waveguides (Fig. 6) and
produced RF magnetic fields in the two waveguides that
were perpendicular to each other at the iris to reduce out-ofband leakage. A linear taper was used to reduce the height
of the waveguide to allow a smaller gap between the magnet
pole tips.
A two-sphere filter was built in U band (40 to 60 GHz)
to demonstrate the feasibility of the crossed waveguide
filter approach.4 This filter had typical insertion loss of 4.5
dB, a 3-dB bandwidth of 325 MHz, and off-resonance iso
lation greater than 30 dB. The spheres were aligned on
beryllia rods, which were slipped into holders that allowed
±0.1 mm of sphere adjustment from side to side and up
and down in relation to the iris. The sphere rods were
inserted through the reduced-height sidewall of the
waveguide so that it was possible to center the spheres
exactly over the iris and to move them closer together or
farther apart to change the sphere-to-sphere coupling. In
Fig. 7, the response of this filter is shown centered at ap
proximately 48.5 GHz and moved up by 4.5 dB so the
off-resonance isolation can be read easily off the plot.
The low-frequency side of the filter's response cuts off
more quickly than the high-frequency side, and 650 MHz
away from the peak of the passband the rejection is about
RF In
Fig. 6. Two-sphere waveguide bandpass filter.
35 dB. The rejection of a filter 650 MHz away from the
peak is important for preselection applications because the
IFs used in the HP instruments are approximately 310 MHz
and 321 MHz. An unpreselected mixer will display an
image signal at the same amplitude as the true signal at
two times the IF away from the true signal. Therefore, much
of a filter's usefulness depends on its image rejection,
which is a measure of how much this unwanted trace is
suppressed. By adjusting the spheres farther apart or closer
together, and by changing the iris diameter and the sphere
size, the best compromise between filter insertion loss, image
rejection, and off-resonance isolation can be achieved.
Two-sphere filters were built in the other millimeterwave bands using the information obtained from the Uband filter and applying appropriate scaling factors. The
results for insertion loss and off-resonance isolation for the
family of two-sphere waveguide filters5 are shown in Figs.
8 and 9, respectively. The 3-dB bandwidths of these filters
were 200 to 350 MHz. Although the insertion loss results
were acceptable, the image rejection and off-resonance iso
lation of these filters were not sufficient for instrument
applications. The goal was then changed to design a filter
with off-resonance isolation and image rejection greater
than 55 dB.
A literature search showed three-sphere and four-sphere
YIG Sphere
RF Out
50
Frequency (GHz)
Fig. 5. A single stage of a typical YIG filter.
Fig. 7. Two-sphere U-band filter response.
52 HEWLETT-PACKARD JOURNAL OCTOBER 1990
© Copr. 1949-1998 Hewlett-Packard Co.
O -r
10
20
30
40 50 60
% of Band
70
80
90
100
-70
4 0 5 0 6 0
% of Band
Fig. 8. Insertion loss of two-sphere filters.
waveguide filter designs, but none of them would give the
required off-resonance isolation at millimeter-wave fre
quencies. Our next design consisted of two of the above
two-sphere filters under one set of magnet pole tips, con
nected by a very short transverse waveguide (Fig. 10). This
four-sphere filter configuration does not increase the mag
net pole tip separation, but in theory should double (in
dB) the insertion loss, off-resonance isolation, and image
rejection of the two-sphere filters previously built. To
simplify the mechanical design, sphere mounts were
machined from low-dielectric-constant plastic and epoxied
over the irises. Resonator spheres were then placed on the
sphere mounts, aligned and epoxied in place (Fig. 10). This
sphere mounting technique allows accurate measurement
of the sphere separation after mounting to determine
sphere-to-sphere coupling.
The one significant difference that was expected in going
to the four-sphere design was the possibility of the two
irises and the short transverse guide (one wavelength long
at approximately 80% of band) forming a coupled-cavity
bandpass filter that might give a fixed-frequency spurious
90 100
Fig. 9. Off-resonance isolation of two-sphere filters.
response. When the first four-sphere filters were turned
on, they gave the expected double (in dB) off-resonance
isolation, insertion loss, and image rejection, as well as the
cavity-mode response (Fig. 11). By narrowing the width of
the input and output waveguides and moving the spheres
off-center towards the center of the filter, the onewavelength cavity mode can be pushed 5 to 6 GHz above
the top frequency in the band. The one-wavelength cavity
mode can thus be eliminated by shortening the transverse
guide. However, this brings the one-half-wavelength cavity
mode in-band at about 15% of the band. The one-halfwavelength cavity mode is not as strong as the onewavelength mode, and can be suppressed very well (Fig.
12) by introduction of a distributed loss in the transverse
guide to detune the cavity. This loss is effected by a thin
sheet of Kapton (plastic) between the sides of the transverse
guide and the iris plate to allow some energy to leak out.
The Kapton sheet is shown in Fig. 13, which also shows
the four-sphere filter assembly.
Four-sphere filters using scandium-doped barium ferrites as resonators are presently being built in A, Q, U, and
Fig. 1 0. Four-sphere filter design.
OCTOBER 1990 HEWLETT-PACKARD JOURNAL 53
© Copr. 1949-1998 Hewlett-Packard Co.
Frequency (GHz)
Fig. 11. First four-sphere filter response shows cavity mode
resonance.
V bands. They typically have insertion loss of 8 to 12 dB,
3-dB bandwidth of 120 to 200 MHz, image rejection greater
than 55 dB, and off-resonance isolation greater than 70 dB.
These performance figures represent trade-offs that were
made between the different parameters. For instance, by
mounting the spheres closer together (top to bottom) a foursphere V-band filter was made having 4 to 6 dB insertion
loss across the band. Unfortunately, because of the tighter
sphere-to-sphere coupling, the filter skirts were wider and
the image rejection was degraded.
cient to determine the millimeter-wave frequency to which
the spectrum analyzer is tuned. This voltage is then con
verted to a coil current that will tune the filter to the appro
priate frequency.
To provide the correct current to the filter, the frequencyversus-coil current characteristics of the filter must be taken
into account. The frequency of the barium ferrite filters
varies linearly with current, and a straight-line approxima
tion is sufficient. For example, a V-band filter typically
deviates from a straight-line tuning equation by no more
than ±90 MHz over the entire range from 50 to 75 GHz.
Small tuning nonlinearities are compensated by using the
preselector peak function of the spectrum analyzer. This
function provides a small offset to the tune voltage to peak
the filter on the signal being measured.
Because of the internal anisotropic field of the barium
ferrite spheres, very little current is required to tune the
filters to the lowest frequency of the band. For all four
bands, from 26.5 GHz to 75 GHz, the coil current required
at the lowest frequency is approximately 70 milliamperes.
The filters then tune to higher frequencies at a rate of 60
to 70 GHz/ampere. As a result, the widest frequency bands
require the most current. The A band, with a span of 13.5
Magnet
Thermistor
Assembly
Input/Output
Waveguide
Filter Drive Circuitry
For proper system operation, the barium ferrite filter
must track the input frequency of the spectrum analyzer.
The HP 11974 Series preselected mixer receives a tuneramp voltage from the spectrum analyzer that is propor
tional to the frequency of the spectrum analyzer's first local
oscillator. For any given band, assuming a certain harmonic
number, mixing sense, and mixer IF, this voltage is suffi-
Iris Plate
Barium Ferrite
Resonator Spheres
Kapton Sheet
Ref 0.0 dB, 10.0 dB/
Transverse
Waveguide
Magnetic Center
Body
Magnet
Frequency (GHz)
Fig. 12. Four-sphere filter response with cavity mode sup
pression.
Fig. 13. Four-sphere filter assembly.
54 HEWLETT-PACKARD JOURNAL OCTOBER 1990
© Copr. 1949-1998 Hewlett-Packard Co.
GHz, typically requires 270 milliamperes of coil current to
tune to 40 GHz. V band, with a span of 25 GHz. typically
requires 425 milliamperes of coil current to tune to 75 GHz.
Coil current is provided by a 50-volt power supply. The
coil current flows through the filter coil, a transistor that
controls the amount of current flow, and a 3.1O resistor
that is used to monitor the current flow, as shown in Fig.
14. To minimize the temperature dependent tracking er
rors, the 3. 1Ã1 resistor has a low temperature coefficient, 5
ppm/°C, as do resistors in other critical locations. The
power supply was chosen to be 50 volts to accommodate
the voltage drops across all of the above items. The capaci
tor across the coil shunts unwanted high-frequency cur
rents away from the coil. The Zener diode across the coil
provides a discharge path for the coil at the end of a sweep,
when the current through the transistor goes to zero.
The effect of temperature on the filter's frequency is
another consideration in filter tuning. Some filters, such
as the Q-band filter, have very little frequency drift with
temperature, while others, such as the V-band filter, are
very sensitive to temperature. With a constant coil current,
a V-band filter drifts at a rate of +11.4 MHz/°C. For a tem
perature increase of 50°C, the center frequency of the filter
would increase by nearly 600 MHz. Compensation for the
temperature drift had to be considered because the 3-dB
bandwidth of the filter is typically between 120 and 200
MHz, and this would mean that an input signal would no
longer be within the passband of the filter.
Temperature and Delay Compensation
Temperature drift is compensated by monitoring the tem
perature at the filter and modifying the coil current. A
thermistor network is used to monitor the temperature of
the filter. The thermistor network consists of a thermistor
composite composed of two thermistors encapsulated in
epoxy and two linearizing resistors. The thermistor com
posite is located in the waveguide portion of the filter as
sembly (Fig. 13) and tracks the temperature at the barium
ferrite filter. The network has a temperature dependent
resistance that is linear from 0 to 1 00°C. The thermistor net
work is connected as the feedback portion of an amplifier
that generates a voltage equivalent to the amount of filter
frequency correction required. This voltage is then summed
into the voltage that generates the filter coil current.
Although the temperature compensation required varies
from band to band, the filters of each band are very consis
tent from unit to unit and across the frequency band. This
consistency allows the correction to be based on tempera
ture only. In the A and Q bands, the filter drifts lower in
frequency with increasing temperature, while in the U and
V bands, the filter drifts higher in frequency with increasing
temperature.
Fig. 15 shows the frequency tracking errors of a V-band
filter at 0°C, 25°C, and 75°C with no temperature compen
sation applied. The frequency tracking errors of the 25°C
trace represent the deviations from a linear relationship
between the filter coil current and the filter frequency. The
spacing between the three traces represents the temperature
drift of the filter with no temperature compensation ap
plied.
Fig. 16 shows the frequency tracking errors of the same
V-band filter with the temperature compensation circuitry
enabled. The remaining frequency tracking errors fall
within a range approximately equal to the 3-dB bandwidth
of the filter. The preselector peak function of the spectrum
analyzer removes these errors at a particular frequency.
In addition to temperature effects, compensation must be
provided for the effect of filter tuning delay. When the
spectrum analyzer sweeps at a fast rate, the filter, tuned
by the current through a coil with inductance of about 0.8
henry, tends to lag behind. This effect is compensated by
placing a differentiator in the HP 11974 tune voltage path.
Differential
Amplifier
Tune Voltage
Error Indicator
High-Frequency
Reference Voltage
Low-Frequency
Reference Voltage
Spectrum
Analyzer
Dependent
Gain and
Offset
Adjustable
Gain and
Offset
Delay
Compensation
Capacitor
Tune In
3.1ÃÃ
Fig. 1 4. Simplified HP 11 974 filter
drive circuitry.
OCTOBER 1990 HEWLETT-PACKARD JOURNAL 55
© Copr. 1949-1998 Hewlett-Packard Co.
Filter Frequency (GHz)
Filter Frequency (GHz)
Fig. com 5. V-band filter tracking error without temperature com
pensation.
Fig. 1 6. V-band filter tracking error with temperature compen
sation.
At slow sweep rates, this circuit has no effect. At fast sweep
rates, additional coil current is provided to help the filter
keep up with the spectrum analyzer. With this compensa
tion applied, the spectrum analyzer can be swept at a
maximum sweep rate of 40 GHz/second.
of the spectrum analyzer. Each of the three spectrum
analyzer families has a different definition for the tuning
voltage provided. Because of this, the HP 11974 has
switches that are used to identify the spectrum analyzer
with which it is to be used. For each switch setting, a
specific gain and offset are applied to the tune voltage so
that the filter will be properly tuned.
Another requirement for the tune voltage of the spectrum
analyzer is that it have a variable offset summed in. The
correct amount of offset to apply at any given frequency is
determined by the preselector peak function.
Before operating the HP 11974 with the spectrum
analyzer for the first time, two potentiometer adjustments
must be made. These adjustments match the tuning volt
ages provided by the spectrum analyzer to the reference
voltages in the HP 11974. After these adjustments are made,
the preselector filter will track very well the input fre
quency of the spectrum analyzer. The preselector peak
function is used to eliminate the remaining frequency track
ing errors at any given frequency. When executed, this
function causes the spectrum analyzer to vary its tune volt
age to the HP 11974 and monitor the signal level of the
marked response on the screen. At the maximum response
level, the filter has been peaked. The frequency range of
the preselector peak function is proportional to the har
monic number on which the mixer operates. For most of
the analyzers, the preselector peak range is ±260 MHz in
Spectrum Analyzer Compatibility
The HP 11974 Series preselected mixers are designed to
operate with three families of Hewlett-Packard spectrum
analyzers: the HP 70000 modular spectrum analyzer family
with the HP 70907B external mixer interface module, the
rugged, portable spectrum analyzer family including the
HP 8560A, HP 8561B, HP 8562A, and HP 8563A, and the
HP 8566B, a high-performance R&D bench spectrum
analyzer. Fig 17 shows the HP 11974 Series and the spec
trum analyzers. Older models of these spectrum analyzer
families can be made compatible by installing a retrofit kit.
To be compatible with the HP 11974, the spectrum
analyzer must meet certain requirements. First, the spec
trum analyzer must have a first LO frequency range of 3
to 6 GHz at the proper power level. The nominal power
level of the first LO output is +14.5 dBm to +16 dBm.
Second, the first IF of the spectrum analyzer must be com
patible with the HP 11974. Each spectrum analyzer men
tioned above has a first IF of either 310.7 MHz or 321.4
MHz. Finally, the spectrum analyzer must provide a voltage
output that is proportional to the frequency of the first LO
Fig. 17. HP 11974A/Q/U/V pre
selected millimeter-wave RF sec
tions with mainframe microwave
spectrum analyzers (HP 8563A,
HP 85668, HP 70000).
56 HEWLETT-PACKARD JOURNAL OCTOBER 1990
© Copr. 1949-1998 Hewlett-Packard Co.
11974V CALIBRATION
SN: 3001A00104 17 Apr 1990
n= 14+ IF=321.4 MHz LO Power=16dBm
55
6 0
6 5
FREQUENCY (GHz)
70
75
Fig. RF 8. Conversion loss calibration chart is supplied with each RF section. The data is entered
into the mainframe spectrum analyzer.
OCTOBER 1990 HEWLETT-PACKARD JOURNAL 57
© Copr. 1949-1998 Hewlett-Packard Co.
A band and ±450 MHz in V band.
Conversion loss data for each instrument is required to
make accurate amplitude measurements. Each HP 11974
is shipped with a graph and a tabular listing of its conver
sion loss as a function of frequency, as shown in Fig. 18.
The conversion loss measurements are traceable to the
United States National Institute of Standards and Technol
ogy. Data from the conversion loss table can be entered
into the spectrum analyzer so that amplitude readings will
automatically be referenced to the input of the HP 11974.
In addition to the conversion loss table and graph, a conver
sion loss label is permanently attached to the HP 11974
for reference.
Acknowledg ments
R&D team member Dick Beardsley designed all the crit
ical mechanical parts and made them look simple. He also
organized the R&D retreats at the salmon school locations
off the Northern California coast. The product introduction
team completed their work in record time and included
Robert Charlton, George Zimenski, Ron Flatt, Mariko Hoy,
Lonnie White, Jim Lusk, Tom Berto, Joe Wax, Rich Pope,
Bob Fullmer, Dennis DeMaria, Rebbie Toledo, Karen
Bigham, Mike Picha, Bernie Hoven, Joyce Wong, Dennie
Yamaoko, and Kathy Sparks. Mike Dethlefsen, Ernie deMartini, Mike Brown, and Steve Flint designed the retrofit
kits vital to the project. Marketing efforts were by Eric
Brown and Dennis Handlon. Important early development
work on the filter and test routines was performed by Jimmie Yarnel, Dennis Derickson, Matt Fowler, and Hiroshi
Imiazumi. Summer intern Davie Zoneraich built the first
version of the millimeter tracking generator test set. Our
lab section management, Frank Angelo and Toni Coon,
endured endless project reviews and kept us inspired. And
then there is Frank David, who peeled the company's first
layer from the millimeter onion a decade ago.
References
1. R.A. Shaffer, "Promising Uses are Emerging for Millimeter
Radio Signals," The Wail Street Journal, June 26, 1981, pg. 29.
2. R.J. Matreci and F. K. David, "Unbiased Subharmonic Mixers
for Millimeter-Wave Spectrum Analyzers," IEEE MTT-S Interna
tional Microwave Symposium Digest, 1983, pp. 130-132.
3. M. Lemke and W. Hoppe, "Hexaferrite Components — Tunability at mm-Waves," Proceedings of the Conference on Military Mi
crowaves, London, 1980, pp. 95-100.
4. D. Nicholson, "A High Performance Hexagonal Ferrite Tunable
Bandpass Filter for the 40-60 GHz Region," IEEE MTT-S Inter
national Microwave Symposium Digest, 1985, pp. 229-232.
5. D. Fil "Ferrite Tuned Millimeter-Wave Bandpass Fil
ters With High Off Resonance Isolation," IEEE MTT-S Interna
tiona] Microwave Symposium Digest, 1988, pp. 867-870.
58 HEWLETT-PACKARD JOURNAL OCTOBER 1990
© Copr. 1949-1998 Hewlett-Packard Co.
Hexagonal Ferrites for Mi 1 1 ¡meter- Wave
Applications
Scandium-doped, M-phase barium ferrite has the
necessary properties. Crystals are grown and spheres are
processed and tested in-house.
by Dean B. Nicholson
Ferrite spheres are commonly used as resonator ele
ments in magnetically tunable bandpass filters. At
frequencies below approximately 30 GHz, yttrium
iron garnet spheres (abbreviated YIG, chemical formula
Y3Fe5O12) are used extensively in this role. At frequencies
above about 30 GHz (the millimeter-wave region) problems
become apparent with the magnetic components used to
tune the YIG spheres. These problems include electromag
net heating, tuning nonlinearities, and hysteresis.
The tuning equation of a YIG sphere,1 applicable with
Ha parallel to H0, is:
f,r e s o n a n c e = (2.8 MHz/Oe)(H0 + Ha
(1)
where H0 is the applied dc magnetic field and Ha is the
internal anisotropy field (70 Oe for YIG). Using this equa
tion, the maximum usable frequency of a YIG sphere can
be calculated to be about 64 GHz, assuming that the material
used in the tuning magnet pole tip has the highest satura
tion flux density available (approximately 23 kilogauss for
a cobalt-iron alloy).2 The anisotropy field Ha can be thought
of as a built-in magnetic field that acts along a crystal axis,
or in some cases a crystal plane. When the anisotropy field
is parallel to the applied field, it gives a frequency offset
that reduces the applied dc magnetic field needed for reso
nance at a given frequency.
It was obvious that a new resonator material would be
Ha=25.5 kOe
required to make tunable bandpass filters to serve as pre
selectors for the HP 11970 Series harmonic mixers covering
from A band (26.5 to 40 GHz) up to V band (50 to 75 GHz).
Using equation 1, it can be seen that if ferrite materials
similar to YIG but with higher Ha could be found, then it
would be possible to build magnetically tunable bandpass
filters that cover waveguide bands in the millimeter-wave
region using moderate magnetic tuning fields (Fig. 1). A
class of material with this property is the hexagonal ferrites.3
Properties of Hexagonal Ferrites
Hexagonal ferrites are so named because this class of
materials has a hexagonal crystal lattice, which produces
crystals that have distinctly hexagonal shapes (Fig. 2). The
hexagonal ferrites have a large number of phases. Fig. 3
compares the parameters of the most important phases
(there are many more!) to YIG parameters.4'5'6'7'8 The most
useful hexagonal ferrites have a property called uniaxial
anisotropy (Fig. 4), which means that the anisotropy field
lies along only one axis, which is the C axis for the hexag
onal crystal. Hexagonal ferrites are commonly referred to
by their phase and composition. For example, M-phase
barium ferrite is BaFe12O19.
The minimum useful frequencies listed in Fig. 3 come
from three constraints. First, with the anisotropy field
aligned with the applied field, equation 1 shows that the
lowest frequency of resonance is (2.8 MHz/Oe)(HJ with
negligible applied field. Second, the magnetic dipoles in
H, -0.01 kOe
5
1 0
1 5
2 0
Applied DC Magnetic Field H,, (kOe)
Fig. 1 . Ferrite resonance frequency as a function of dc mag
netic field for various values of the anisotropy field.
Fig. 2. Hexagonal ferrite crystals.
OCTOBER 1990 HEWLETT-PACKARD JOURNAL 59
© Copr. 1949-1998 Hewlett-Packard Co.
Notes: 1. Sc and Al dopings can be varied continuously.
2. Y phase has planar anisotropy. fr = (2.8 MHz/Oe)(H0(H0+Ha))1/2
when the anisotropy plane is aligned with both dc and RF fields.
Fig. 3. Summary of hexagonal ferrite and YIG parameters.
a ferrite sphere with the applied magnetic field aligned
with Ha will not all line up or "saturate" until a field of
at least 4-77Ms/3 has been applied. Third, for very high-Qu
(unloaded QJ ferrites at low frequencies, such as YIG, with
fields between one and two times 47rMs/3, the effect known
as coincidence limiting8 limits the amount of power that
a ferrite device can handle to much less than 0 dBm. There
fore, YIG spheres are generally used with applied fields
above two times 4-n-Ms/3. For hexagonal-ferrite-spheretuned devices, this power-limiting effect has not been seen
at power levels up to 20 dBm for our bandpass filter con
figurations and thus should not present a problem for this
application.
As Fig. 5 shows, scandium and aluminum dopings can
be varied arbitrarily in M-phase hexagonal ferrites to give
the desired Ha.4 The scandium-doped M-phase barium fer
rite will satisfy the frequency range requirements at the
lower frequencies while the aluminum-doped M-phase
strontium ferrite will satisfy the requirements at the higher
frequencies. Although it is possible to dope M-phase
barium ferrite with aluminum to raise its resonant fre
quency and dope M-phase strontium ferrite with scandium
to lower its resonant frequency, in general, the higher the
doping level the more the Qu of the resonator is degraded.
Therefore, dopants and materials are chosen so that the
Fig. 4. Uniaxial anisotropy in hexagonal ferrites.
least amount of dopant is used to cover a given frequency
range.
Other desirable properties of M-phase hexagonal ferrites
are that they have high 47rMs/3 for good coupling to the
RF fields, high Curie temperatures for low sensitivity to
temperature change, and fairly high Qu.
Fig. 5. Anisotropy field changes with doping. Adapted with
permission from reference 4.
60 HEWLETT-PACKARD JOURNAL OCTOBER 1990
© Copr. 1949-1998 Hewlett-Packard Co.
test capabilities were developed in-house.
Sphere Production and Test
Once the selection of the M-phase hexagonal f errites was
made and it was found that crystals were unavailable com
mercially, a crystal growth program was begun at the HP
Microwave Technology Division. In the literature, hexag
onal ferrite crystals are typically grown from a BaO/B2O3
flux using slow cooling. We used a slow cooling furnace
with multiple small crucibles per run and free nucleation
(no seed crystals) for quick optimization of charge compo
sition and temperature profiles. Now that growth condi
tions have been optimized, a single larger crucible is used
for each growth run with a larger charge so that larger
crystals can be grown. The total volume of liquid charge
in the crucible at the start of crystal growth is approximately
320 ml. The total weight of crystals obtained from the
growth is about 70 grams.
The processing of hexagonal ferrites to spheres is concep
tually very similar to YIG sphere processing. Because of
the brittle nature of hexagonal ferrites, proprietary grinding
and polishing techniques had to be developed to avoid
chipping the sphere poles. In addition, a separate sphere
testing system was developed to test the Qu of the hexagonal
ferrite spheres, which must be tested at the millimeter wave
frequencies at which they will be used.
Summary
Because of their high magnetic anisotropy fields, spheres
made of suitably doped M-phase hexagonal ferrites were
chosen as resonator elements in magnetically tunable
bandpass filters. These bandpass filters cover waveguide
bands above 26.5 GHz and are used as preselectors in the
HP 11974 Series of millimeter preselected RF sections.
When no outside supplier of hexagonal ferrite spheres
could be found, crystal growth and sphere processing and
Acknowledgments
I would like to acknowledge Frank Gary for developing
the sphere grinding and polishing processes and assisting
with crystal growth. Without his help the project would
have been immeasurably more difficult. In addition, I
would like to thank Jerry Gladstone for management sup
port even when the success of the project seemed uncertain
at best.
References
1. B. Lax and K.J. Button, Microwave Ferrites and Ferrimagnetics,
McGraw-Hill, 1962, pp. 164-165.
2. HipercoR 50 Specifications, Carpenter Technology Corpora
tion.
3. G. Winkler and H. Dotsch, "Hexagonal Ferrites at Millimeter
Wavelengths," Proceedings of the 9th European Microwave Con
ference, 1979, pp. 13-22.
4. P. Roschmann, M. Lemke, W. Tolksdorf, and F. Welz, "Aniso
tropy Fields and FMR Linewidth in Single-Crystal Al, Ga, and Sc
Substituted Hexagonal Ferrites with M Structure," Materials Re
search Buiietin, Vol. 19, February 1984, pp. 385-392.
5. W. Tolksdorf, "On the Preparation of Polycrystalline
Zn2Ba2Fe12O22 Especially With Respect to Added Bi2O3," IEEE
Transactions on Magnetics, Vol. MAG-2, no. 3, September 1966,
pp. 472-473.
6. F.E. Reisch, R.W. Grant, and M.D. Lind, "Magnetically Tuned
Zn2Z Filters for the 18-40 GHz Frequency Range," IEEE Transac
tions on Magnetics, Vol. MAG-11, no. 5, September 1975, pp.
1256-1258.
7. G.P. Rodrigue, "Magnetic Materials for Millimeter Wave Appli
cations," IEEE Transactions on Magnetics, September 1963, pp.
351-356.
8. J. Helszajn, YIG Resonators and Filters, John Wiley and Sons,
1985, pp. 101-102.
OCTOBER 1990 HEWLETT-PACKARD JOURNAL 61
© Copr. 1949-1998 Hewlett-Packard Co.
HP DIS: A Development Tool for
Factory-Floor Device Interfaces
The HP Device Interface System provides a development
facility that includes a high-level Protocol Specification
Language, a testing facility, and a run-time facility for device
interfaces that run in an HP-UX environment on HP 9000
computers.
by Kent Fulton Garliepp, Irene Skupniewicz, John U. Frolich, and Kathleen A. Fulton
EFFICIENT DEVELOPMENT OF INTERFACES be
tween computers and factory-floor devices can be a
serious challenge in factory automation projects.1
These factory-floor devices consist of programmable logic
controllers (PLCs), robots, numerically controlled ma
chines, gauges, scales, and other devices. The problem is
that they may come from many manufacturers and may
have different, proprietary interfaces.
For a few major brands of programmable controllers,
there are off-the-shelf communications packages that can
be purchased. This solution has limited applicability if the
needs vary from what is implemented in the package.
If flexibility is needed, a customized interface can be
written. At present, development of specific device inter
faces is a time-consuming, exacting, and expensive process
requiring a fairly high level of expertise. The process gen
erally consists of characterizing the device's communica
tion protocol and then writing, changing, or enhancing
programs, subroutines, and test suites. This process is wellknown to all interface developers and creates a slow re
sponse to market needs.
In the long run, the use of communications standards,
such as the Manufacturing Automation Protocol2 (MAP),
will eliminate many of the device connectivity problems
and the response to market needs will improve significant
ly. In the meantime, many factory-floor devices exist and
have long useful lives remaining. Many are simple devices,
such as gauges with simple interfaces, that may never con
form to a standard.
To reduce the cost of developing customized interfaces
for devices that need them and to shorten the time required
for such efforts, tools are needed to simplify the develop
ment and testing of the interfaces. This is the objective of
the HP Device Interface System (HP DIS). HP DIS is a toolset
that helps developers create and test interfaces between
computer applications and RS-232-compatible factoryfloor devices in less time than before. The resulting inter
faces run in an HP-UX environment on HP 9000 Series 300
or 800 computers.
HP DIS offers three facilities to make the development
and implementation of device interfaces more efficient. A
development facility provides a high-level Protocol
Specification Language3 for defining the communications
logic. A testing facility provides a test generator, a test
exerciser, and a device simulator. A run-time facility exe
cutes the protocol in real time. Fig. 1 shows a typical pro
tocol development cycle and the use of the HP DIS toolset.
HP DIS: the Tools Approach
A diagram of the HP DIS system is shown in Fig. 2. The
three bubbles correspond to the above-mentioned three
facilities provided by HP DIS. These allow the system de
veloper to develop, test, and run device interfaces.
The development facility is simply a compiler that gen
erates a protocol interface. The protocol interface is an
executable process that forms the central component of an
Standard Process
62 HEWLETT-PACKARD JOURNAL OCTOBER 1990
© Copr. 1949-1998 Hewlett-Packard Co.
Corresponding Steps Using HP DIS
Understand application needs.
Understand device communication
protocol and message formats.
Design protocol interface
architecture, functionality, and
modularity.
Write application calls to protocol
interface. Create protocol interface
using the Protocol Specification
Language.
Create tests using the HP-DIS test
facility.
Execute tests using the HP-DIS test
facility.
Define the configuration and
execute the protocol interface modules.
Fig. 1 . The process of creating a device interface.
Step 1 : Describe
the Interface
Executable Protocol
Interfaces and
State Tables
Represents an HP-UX
Message Queue
Fig. 2. HP DIS facilities
Fig. 4. Steps in protocol interface development using HP DIS.
HP DIS system. The input to the compiler is a description
of the device protocol, written in Protocol Specification
Language (PSL). PSL allows the user to describe a state
graph and its associated state table in a high-level format
(see "Finite State Machine," page 65).
Other inputs to the development facility are subroutines
that can be linked to the protocol interface. In HP DIS these
are called action routines (see "Action Routines," page 69) .
The run-time facility provides the execution environ
ment for the protocol interfaces. When the protocol inter
face runs, it communicates with ports, other protocol inter
faces, and other C programs through HP-UX message
queues. Using a description of the protocol interface's as
sociated I/O ports, the run-time facility manages the ports,
message queues, process startup, and process shutdown.
The development and run-time facilities also provide
the following features:
• A contributed library of example protocol interfaces,
tutorial protocol interfaces, and other helpful tools
• The ability to implement user-defined lookup tables
1 Eight-bit native language support
• Access between multiple devices and multiple interfaces
• The ability to add and delete protocol interfaces dynam
ically in a running system.
A diagram of the HP DIS testing facility is shown in Fig.
3. This facility consists of a test generator and a test exer
ciser.
The test generator takes the state table and creates test
cases. The test cases are fed to the test exerciser, which
executes each test case by sending messages to the protocol
interface under test. The test exerciser attempts to achieve
each state listed in the state table, for up to 100% coverage.
Optional inputs to the test exerciser are user-written test
cases. The test exerciser executes a sequence of test cases
and compares expected results to the results of the protocol
interface under test. Actual devices or I/O ports are not
necessary for testing; factory-floor devices can be simulated
by describing their messages.
The output of the testing facility includes test case
documentation and test results. The testing facility also
provides the following features:
• Full or partial data tracing
• Either menu-driven execution or script execution of test
cases
• Protocol filters to simulate garbled messages, time-outs,
and expression matching
• Notification of percentage covered.
Fig. 3. HP DIS testing facility.
OCTOBER 1990 HEWLETT-PACKARD JOURNAL 63
© Copr. 1949-1998 Hewlett-Packard Co.
An HP DIS Example
There are three steps in developing an interface (see Fig.
4). The first step is to describe the interaction between the
application and the factory-floor device interface. The sec
ond step is to specify the device protocol in a language
that HP DIS can compile. The third step after successful
compilation is to generate the test scripts and test the logic
of the developed interface. These steps are illustrated by
the following example.
Describing the Interface. A block diagram of the system
interfaces for this example is shown in Fig. 5. The interface
between the application and the device interface is an HPUX message queue. Read and write subroutines are avail
able for the application program developer to send buffers
to the device interface and receive buffers from it. These
subroutines allow referencing either the HP-UX message
queue name or the device application name. The links
between the HP-UX message queues and the device inter
face are established by the run-time facility through a con
figuration file (Fig. 6). The configuration file is used by the
run-time facility to establish the queues, start the defined
interfaces, create the links, and configure the ports from
the port definitions. The configuration process eliminates
the need for a detailed understanding of HP-UX inter
process communication and RS-232 serial port initializa
tion.
The buffers passed through the queues must be designed
to carry the information needed by the device interface.
The device interface can require the application to pass
device-specific data directly or can translate generic func
tions into device-specific data. Device interfaces can range
from very device dependent to completely device indepen
dent. In the latter case more logic will be required in the
device interface.
For the sake of simplicity, this example uses the device
dependent approach. The application outbound buffer con
tains a six-byte header and a variable-length data string.
The application inbound buffer contains a status byte and
a variable-length data string.
Specifying the Protocol. One of the methods of specifying
the protocol is a transition diagram translated into a state
diagram. This is particularly convenient for translating the
protocol into a language HP DIS can compile. Figs. 7a and
7b describe a transition diagram and a state diagram for a
nontrivial protocol. This example protocol is based on the
Allen-Bradley Data Highway I protocol, but only exempli
fies the major features. This example assumes synchronous
communication. No new request is sent from the computer
to the factory-floor device until a previous request is satis
fied.
The computer sends a message (MSG) to the device (Fig.
7a) and waits for an acknowledgment from the device (ACK).
The computer then waits for a reply message (Fig. 7b). Each
message consists of block control characters, a header, and
data. In the case of a read request, the data field from the
computer contains the address and the length of the re
quest. The reply data from the device consists of the values
requested. In the case of a write request, the data field from
the computer contains the address and the values for the
request. The reply data from the device consists of an inter
nal status for the request.
In the event of a communication failure, either the com
puter or the device can reply with a failure message (NAK).
The protocol interface must also recognize that no response
(TO) is a failure. Other failure mechanisms are not taken
into account in this example.
PLDEFINITIONS
F I F O Queues Q5
Runtime_Name
Runtime_File_Name
Runtime_Type
- Device_xx;
= /users/test/Device_xx;
Runtime_Priority
= 51;
Port-Name
= AB;
= P;
PORT_DEFINITIONS
Factor-Floor
Device Interface
Idle (Wait)
FIFO
Queues
Read
Process
Write
Process
M I M ^ H B H
QUEUE_DEFINITIONS
7
â € ¢ ^ â € ¢ â € ¢ ^ ^ â € ¢ i
Queue_Name = Q2,Q3,Q4,Q5;
QueueJJnk
Q5> Device_xx;
Device_xx > Q3;
Q4> Device_xx;
Device_xx<Q2;
Factory-Floor
Device
Fig. 5. System interfaces for HP DIS example. The queues
are HP-UX message queues.
Fig. 6. Device interface configuration file.
64 HEWLETT-PACKARD JOURNAL OCTOBER 1990
© Copr. 1949-1998 Hewlett-Packard Co.
Finite State Machine
The finite state machine model has been used in such diverse
disciplines as computer design, neurophysiology, linguistics, au
tomata theory, and communications.1 The finite state machine
model is a natural way to describe systems that process signals.
This model is particularly convenient for specifying how mes
sages are processed in device protocols.
Two standard representations used to describe a particular
finite state machine are the state table and the state diagram.2
A state table uses one row for each state and one column for
each input. In each box are written the next state and the output.
The first row of the state table is usually assigned to the initial
state of the machine.
A state diagram is a directed graph in which each arc is labeled
with is input that causes the transition and the output that is
generated when the transition is triggered.
A classic example is a parity checker. This machine takes an
input stream of bits of ones and zeros. For each input bit the
machine produces an output indicating whether the entire input
sequence so far has even or odd parity. The state table and
diagram are shown in Fig. 1.
The HP DIS state table, written in PSL, is shown below. The
initial, or home, state is have.even. When an event is triggered by
the receipt of a 0 or 1 , the protocol interface prints a message
using the user action routine called U1.
Events
zero_recd : response : 0;
one_recd : response : 1 ;
State Table
zero^recd
have_even
have_odd
State Diagram
zero
zero reed, "print odd"
reed, "print even"
one
reed, "print even"
Fig. 1. Siafe table and state diagram for a parity checker.
States
References
have_even : Home;
1. P. and J. Dennis, and J. Qualitz, Machines, Languages, and Computation,
Prentice-Hall, 1978.
2. A.S. 1988. Computer Networks, Second Edition, Prentice-Hall, 1988.
State.Table
have_even : zerojecd :
U1 ("print even")
: have_even;
have_even : one_recd :
U1 ("print odd")
: have_odd;
have_odd : zero_recd :
U1 ("print odd")
: have_odd;
have_odd : one_recd :
U1 ("print even")
: have_even;
Figs. 7a and 7b show state diagrams derived from the
transition diagrams. The states and events form the logic
of the protocol interface. Actions (or functions) are per
formed at each state-event pair. Fig. 7 a also shows an event
(retry exceeded) that is not supported by the transition
diagram. This event is added to prevent endless looping,
A message from the device to the computer (Fig. 7b) will
cause a reply message event, which would normally return
directly to the IDLE state. This example will check the integ
rity of the byte stream by checking the BCC (block control
character) count and branching to an extra state (CHECK).
If the BCC count was incorrect, the original message will
be sent back to the device. If the BCC count was correct
the message from the device will be returned to the appli
cation. The combination of the IDLE state and the reply
message event is included in case the device sends a mes
sage after time-out processing. If this were not included,
the wrong message would be extracted from the HP-UX
message queue during the next transaction. The message
from the device is simply acknowledged and ignored.
OCTOBER 1990 HEWLETT-PACKARD JOURNAL 65
© Copr. 1949-1998 Hewlett-Packard Co.
State
Event
Transition Diagram
State Diagram
Table I
Actions List
Computer Device
Actions
IDLE Send message Read message from application
Build outgoing buffer from
incoming buffer.
Send message to device.
Clear retry count.
Increment message number.
Start timer.
TO
Time-Out
Next
MSG
WAIT
ACK
AC K
Retry Exceeded
MSG
IDLE Reply message
Read message from device.
Send acknowledgment (ACK)
to device.
IDLE
TO = Time-Out
or No Response
(a)
WAIT ACK
Stop timer.
Read message from device.
Start timer.
WAIT
Stop timer.
Read message from device.
Resend message to device.
Increment retry count.
Start timer.
WAIT
Computer Device
R e p l y
WAIT NAK
WAIT Reply message
Stop timer.
Read message from device.
Check block control character
(BCC)
M e s s a g e
T i m e - O u t
TO
MSG
ACK
CHECK
Reply Message
NAK
MSG
Stop timer.
Send no response message to
application.
WAIT
WAIT Retry exceeded
Stop timer.
Send communications error
message to application.
IDLE
CHECK Message OK
Send acknowledgment (ACK)
to device.
Send reply data to
IDLE
WAIT Time-out
Transition Diagram
State Diagram
TO = Time-Out
or No Response
Fig. 7. Transition and state diagrams for a nontrivial protocol,
(a) Message from computer to device, (b) Message from
device to computer.
application.
CHECK Message not
OK
Send acknowledgment (NAK)
to device.
Increment retry count.
Set timer.
WAIT
The state diagrams of Figs. 7a and 7b are combined into
one state diagram in Fig. 8.
The actions to be performed at each state transition are
listed in Table I. With some additional declarations this
table can be transformed into a Protocol Specification Lan
guage (PSL) program that can be compiled. Previous deci
sions about the form of the messages from the application
can be incorporated into the data structures.
Fig. 9 shows the PSL program ready for compiling and
testing. The compiler not only checks the program syntax,
but also tests the reachability of all states from/to the home
(IDLE) state. This check ensures that there are no incomplete
paths.
Reply Message
Send Message
Time-Out
ACK
)
NAK
Reply Message
Message OK
Fig. 8. Protocol sfafe machine sfafe diagram obtained by
combining F/gs. 7a and 7b.
66 HEWLETT-PACKARD JOURNAL OCTOBER 1990
© Copr. 1949-1998 Hewlett-Packard Co.
Matching Messages
One of the most powerful features of HP DIS is the matching
process. It ¡s used for three purposes: for determining whether
a message matches a request event or a response event, for
parsing a message into a structure, and for delimiting streams
of characters from a port. Each use is slightly different from the
others, but they all have the same matching characteristics.
Through the PSL struct description, the user defines the fields
in a structure that are to be matched. All variables describe a
length of data. When a structure contains a variable, the data
from the message ¡s placed into the structure according to the
length of the variable. Byte and Boolean variables are one byte
long. Integer variables are two bytes long, and real and long
variables are four bytes long. String variables can be NULL or
up to 4K bytes long. Data from the message is parsed into the
structure's fields according to the variable lengths.
Constants and literals are matched exactly. The lengths of
data types are the same as above, but the message data must
contain the bit pattern that matches the constant. Constants or
literals adjacent to string variables are used for delimiting the
strings.
The HP DIS compiler builds a table for each structure describ
ing data in each field. The matching process then walks this
table a each structure. If there are no string variables in a
structure, then each byte is easily assigned to a structure field.
There is no ambiguity. However, if there are any string variables
in the structure, then ambiguity branching begins, because string
variables can be NULL or up to 4K bytes long. The matching
process branches, assigning this byte to both the string variable
Testing. The tests, test scripts, and results files can be gen
erated automatically at compile time with a PSL compiler
option. The tests are executed from a test script and the
results appear in several data files:
• The action command file contains the test actions to be
performed.
• The comparison results file contains a summary of the
test paths.
• The trace data output file contains detailed test flows
and variables.
The test generator walks the state table and generates the
actions command file (Fig. 10). The test generator starts
with the first state-event pair in the PSL program and gen
erates commands to trigger the event. The test terminates
at the state and event in the ECASE statement (last state,
next state, event of last state). The data following the WURA
(write to upper-level read area) statement is the equivalent
of a message from the application. The data following the
WLRA (write to lower-level read area) statement is the equiv
alent of a message from the device. A test case is generated
for each subsequent state-event pair. The test cases (CASE
1 ; and CASE 2 marked Good and commented out in Fig. 10
were already successfully executed. Test cases three and
four were created by a second pass of the test generator
based on the previous tests.
The test generator generates cases to trigger external
events (messages from the application or device) by creat
and to the next field. This ambiguity is resolved either by the
next constant or by the end of the message.
HP DIS makes the first shortest match, unlike the HP-UX editor
vi. which makes a first longest match. For example, if the fields
in a structure are:
variable string str!
constant byte btl = B
variable string str2
and the message received is:
aabbBddBd
HP DIS uses a first shortest match algorithm to parse this as:
strl = aabb
bt1 = B
str2 = ddBd
vi uses a first longest algorithm. The vi command typed in as:
s/\(.*\)B\(A)/str1=\1 str2=2/
would result in strl and str2 matches as:
str1=aabbBdd
str2 =d
ing a message from the values involved. State-event pairs
WAIT-ACK and WAIT-NAK (Fig. 9) were successfully generated
because the test generator was able to use the structures
ReplyAck and ReplyNak as the basis for triggering the events.
The test generator generates cases for internal events
based on the associated values of the constants or variables
involved. If the values will satisfy the event, the case is
generated. If not, the case cannot be generated. Each case
is rechecked on every pass to see if the variables involved
have been changed in previous test runs. For more complete
automatic test coverage, the PSL program variables can be
set to values favorable for test case generation. In some
cases, the contents of the messages in the actions command
file must be altered to affect subsequent cases.
The test exerciser (Fig. 11) starts the interface under con
trol file the run-time facility using the test configuration file
(Fig. 12) and executes the test actions. At the conclusion
of the test, the interface is terminated and the results are
stored for examination.
Fig. 13 shows the comparison results file. The expected
state-event pairs for the expected results and the actual
results are always shown.
If the actual results differ from the expected results, the
trace data output file (Fig. 14) can be examined to determine
the cause. The trace data output file contains a detailed
description of the data flow through the state table for each
case executed by the test exerciser. It shows all incoming
OCTOBER 1990 HEWLETT-PACKARD JOURNAL 67
© Copr. 1949-1998 Hewlett-Packard Co.
Statejable
/
/
/
/
Max number of retries
Time-out return status
Device identifer
Retry exceeded
/• Message sent OK;
TimeOutVal
Variables
byte
/" return status
/' TO value = 1 s;
/ test = 30s
= 30000 /'1000'/;
RetryCount
= 0;
byte
byte
byte
bcc;
status
dst
/• Retry counter
/ Protocol block check character */
= 0;
= 10;
/ P r o t o c o l s t a t u s * /
/ Protocol destination device */
byte
byte
byte
integer
string
src
cmd
sts
tns
data
=
=
=
=
/
/
/
/
/
0;
0;
0;
1;
byte
boolean
long
string
Result;
= TRUE;
BccFlag
TimePeriod
= 0;
Text
/ structures used to match messages */
struct ReplyAck =
(OLE ACK);
Protocol source device */
P r o t o c o l c o m m a n d * t
" P r o t o c o l s t a t u s * /
Protocol message number */
â € ¢ D a t a b l o c k V
r Dummy for DcIO
/ Function for BCC check */
/ "
T i m e r v a l u e
/ â € ¢ B i t b u c k e t
struct ReplyNak =
(OLE NAK);
struct DataPacket =
struct ReqPacket =
struct ReplyPacket =
(OLE STX dst src cmd sts tns data OLE ETX bcc);
(dstcmddata);
(status data);
Events
/" Event: Event Type, Event definition
send_message: request, ReqPacket;
reply_message: response, DataPacket;
ACK: response, ReplyAck;
N A K : r e s p o n s e
timeout: internal,
retry_exceeded: internal,
msg_ok: internal,
msg__nok: internal,
States
I D L E :
H O M E ;
ReplyNak;
TimePeriod >= TimeOutVal;
RetryCount>= MaxRetry;
BccFlag = = TRUE;
BccFlag = = FALSE;
/" Home state */
V
V
IDLE: sendjnessage:
DclO(Read, Applic_read_Q, ReqPacket, , , Result)/
/ START Build outgoing buffer 'I
DcMove(ReqPacket.dst, DataPacket.dst)/
DcMove(HP_id, DataPacket.src)/
DcMove(ReqPacket.cmd, DataPacket.cmd)/
DcMove(StatusOK, DataPacket.sts)/
DcMove(tns, DataPacket.tns)/
DcMove(ReqPacket.data, DataPacket.data)/
DcCksum(Calculate, DataPacket.data, "BCC_AB", DataPacket.bcc)/
/' END Build outgoing buffer V
DclO(Write, Devlce_Write_Q, DataPacket, , , Result)/
DcMove(0, RetryCount)/
DcCntrflncrement, tns, By_one)/
DcClock(StarLtlmer, TimePeriod, TimeOutVal)
:WAIT;
IDLE: reply_message:
DclO(Read, Devicejead_Q, Text, , , Result)/
DclO(Write, Device_Write_Q, ReplyAck, , , Result)
:IDLE;
WAIT: ACK:
DcClock(Stop_timer, TimePeriod)/
DclO(Read, Device_read_Q, Text, , , Result)/
DcClock(StarLtimer, TimePeriod, TimeOutVal)
:WAIT;
WAIT: NAK:
DcClock(StopJlmer, TimePeriod)/
DclO(Read, Devicejead^Q, Text, , , Result)/
DclO(Write, Device_Write_Q, DataPacket, , , Result)/
DcCntr(lncrement, RetryCount, By_one)/
DcClock(Start_tlmer, TimePeriod, TimeOutVal)
:WAIT;
WAIT: replyjnessage:
DcClock(Stop_timer, TimePeriod)/
DclOfRead, Device_read_Q, DataPacket, , , Result)/
DcCksum(Check, DataPacket.dst, "BCC_AB", DataPacket.bcc, BccFlag)
:CHECK;
WAIT: timeout:
DcClock(Stop_timer, TimePeriod)/
DcMove(NoResponse, ReplyPacket.status)/
DclO(Write, Applic_write_Q, ReplyPacket, , , Result)
:IDLE;
WAIT: retry^exceeded:
DcClock(Stop_timer, TimePeriod)/
DcMove(ComError, ReplyPacket.status)/
DclO(Write, Applic_write_Q, ReplyPacket, , , Result)
:IDLE;
CHECK: msg_ok:
DclO(Write, Device_Writeja, ReplyAck, , , Result)/
DcMove(StatusOK, ReplyPacket.status)/
DcMove(DataPacket.data, ReplyPacket.data)/
DclOfWrite, Applic_write_Q, ReplyPacket, , , Result)
:IDLE;
CHECK: msg_nok:
DclO(Write, Device_Write_Q, ReplyNak, , , Result)/
DcCntr(lncrement, RetryCount, By_one)/
DcClock(Start_timer, TimePeriod, TimeOutVal)
:WAIT;
Fig. 9. PSL (Protocol Specification Language) protocol program.
68 HEWLETT-PACKARD JOURNAL OCTOBER 1990
© Copr. 1949-1998 Hewlett-Packard Co.
Action Routines
HP DIS is shipped with a wide variety of routines to ease the
creation of protocol interfaces. If a required action routine cannot
be found in the HP DIS action routine library, the user can write
a user action routine.
A protocol interface consists of two components: a finite state
machine and its corresponding internal tables. The finite state
machine is customized for the HP DIS and user action routines.
The internal tables are: 1) an identifier table consisting of con
stants and variables, 2) an event table consisting of event IDs
and event expressions, and 3) a state table consisting of current
state ID, event ID, action list, and next state ID tuples.
In the state table, the action list specifies HP DIS action routines
or user action routines. Action routines operate on the variables
in the identifier table. HP DIS provides a header file, DcTypes.h,
which can be used by user action routines written in the C pro
gramming language to simplify parameter passing.
The HP DIS-supplied action routines are listed below.
DcBufMod
DcCksum
DcClock
DcCntr
DcConvert
DcDelay
DcEncode
DcExit
DcFlag
DcIO
DcLogAdJVB
DcMove
DcScan
DcTablnit
Buffer modification
Checksumming
Timer
Counter
Data conversion
Delay
Data encoding
Terminating the protocol interface
Flag setting
Input/output
Address builder
Move
Data scanning
Table initialization
messages, state-event pairs, and values of all variables after
every action associated with each state-event pair. The vari
able values are useful for checking the results of actions
even when the correct path is executed.
This example has shown that by using tools and a subsys
tem approach, a factory-floor device protocol can be mod
eled and produced.
Configurations
Fig. 15 shows various configurations for HP DIS-built
interfaces. Interface schemes can use a single protocol in
terface or multiple protocol interfaces. These protocol in
terfaces can be stacked in series or configured in parallel.
When multiple devices are serviced, even more choices
can be made: each device can be serviced by its own dedi
cated protocol interface, or multiple devices can be ser
viced by a generalized protocol interface.
Fig. 15a shows the simplest configuration. Here, one pro
tocol interface handles one port and one device.
Fig. 15b shows three protocol interfaces that work to
gether. Message processing that is common to all ports is
done in the lower-level PIl. The message is passed to the
upper-level PI2 and PI3 for device-specific processing. For
example, PIl can collect all messages from multiple de-
Table scanning
Buffer modification
DcTabScan
DcBufMod
An Example
The HP DIS action routine DcClock activates or deactivates a
time HP facility. Timer counters are caller-supplied HP DIS
variables. The HP-UX system interval timer ITIMEFLREAL is used
to update the time counters in real time. A SIGALRM signal is
delivered when the system interval timer ITIMEFLREAL expires,
and all active timer counters are updated. Updating a time
counter can trigger an event if the timer counter exceeds a
specified time-out value. In the following example the event TimeOut is triggered when time_counter is greater than 60000 (60 sec
onds).
Variables
long time_counter;
Events
TimeOut : internal, time_counter > 60000;
StateJTable
DcClock(1 , time_counter, 1 000)
/ Starttimecounting */
Idle: TimeOut:
DcClock(2, time_counter)
/ Time-out detected */
/ Stop time counting */
/ Time_Stamp: 608506312 */
/ R u n - T i m e N a m e
Runtime.Name Deviceja
/ CASE1; V
/' Good '/
/ S t a t e C o m m a n d
/ '
I D L E
W U R A
State Table File Name */
/users/test/Devicejix.st;
' /
\ 0 1 2 V O O O ' ;
* /
/" End of case '/
/• ECASE IDLE WAIT sendjnessage; */
/• CASE 2; '/
/• Good */
/• state Command 7
-/• IDLE WLRA '020002012000000000000 */
/ â € ¢
0 0 1 0 2 0 0 0 3 0 0 0 ' ;
7
/ End of case 7
/ ECASE IDLE IDLE replyjnessage; 7
CASE 3;
/ " S t a t e C o m m a n d * /
I D L E W U R A ' \ 0 1 2 \ 0 0 0 1 ;
W A I T
W L R A
/ End of case 7
ECASE WAIT WAIT ACK;
CASE 4;
/ S t a t e C o m m a n d 7
I D L E W U R A ' 0 1 2 0 0 0 ' ;
W A I T W L R A \ 0 2 0 \ 0 2 5 ' ;
/" End of case 7
ECASE WAIT WAIT NAK;
Fig. 10. Action command file.
OCTOBER 1990 HEWLETT-PACKARD JOURNAL 69
© Copr. 1949-1998 Hewlett-Packard Co.
Runtime_Name: Device_xx
Test
Exerciser
Execution_Number: 1 Case_Number: 1
Status: Cases identical in file Devicejcx.tr and file
Device j<x. da
Q5
HP-UX Message
Queues
m
Q1
Q4
Factory-Floor
Device Interface
Device
Simulator
MP-UX Message
Queues
Event Path taken and Case Status in file Device_xx.tr:
[ I D L E : s e n d _ m e s s a g e
D
C
M
O
V
E
Case.Status: 0
Event Path taken and Case Status in file Devicejcx.da:
[ I D L E : s e n d _ m e s s a g e
D
C
M
O
V
E
Case.Status: 0
,
D
C
I
O
,
D
C
I
O
Execution_Number: 1 Case_Number: 2
Status: Cases identical in file Devicejcx.tr and file
Device_xx.da
Fig. 1 1 . Testing interfaces.
Event Path taken and Case Status in file Device_xx.tr:
[IDLE:reply_message,DCIO;DCIO;IDLE]
Case_Status: 0
vices, perform checksums, and pass them to the next level.
This ensures that all messages are acknowledged promptly
by a dedicated protocol interface, while less time-critical
functions are handled by separate protocol interfaces.
Fig. 15c shows three protocol interfaces, each dedicated
to a port. Device-specific message processing is done for
each port. The upper-level PI4 directs and organizes mes
sages before passing them up to the application.
A developer can choose where to put common functions.
The performance will be slightly better when the number
of protocol interfaces in serial is smaller, since fewer mes
sages are passed between processes. On the other hand, a
centralized function may be desirable because it simplifies
the system design.
Performance
An HP DIS system is easier to construct than a similar
application in C code, but this is achieved with some loss
of performance compared to C code. In an HP DIS system,
functionality is split across five (or more) separate HP-UX
processes. In C code, all the functionality could reside in
a single process. For example, HP DIS port management is
handled by separate read and write port processes with
PLDEFINITIONS
Runtime^Name = Devicejoc;
Runtime_Type - T;
Runtime_Name = PMDPSS;
Runtime_File_Name = /usr/bin/PMDPSS; /* Device Simulator '/
Runtime.Type = T;
QUEUE_DEFINITIONS
Queue_Name = Q1,Q2,Q3,Q4,Q5;
Queue.Link
Q5 > Device_xx;
Device_xx > Q3;
Q4 < Device_xx;
Device_xx < Q2;
PMDPSS < Q3;
PMDPSS > Q2;
Q1 > PMDPSS;
Event Path taken and Case Status in file Device_xx.da:
[IDLE:reply_message,DCIO;DCIO;IDLE]
Case_Status: 0
Fig. 13. Comparison results file.
Execution_Number: 1
Case_Number: 1
Runtime.Name: Device_xx
Trace_Data_Available
Act¡on_Command: WURA
ProtocoLMessage_Transmission_Elapsed_Time: Thu Apr 13 14:33:30 1989
ProtocoLMessage_Data_Packet: '\000\012\000 '
Status: Triggered
State: IDLE
Event: send.message
Variable_RetrievaLEIapsed_Time: Thu Apr 13 14:33:30 1989
State_Table_ Variables:
ReplyPacket.data = ' '
ReplyPacket.status = 0
ReqPacket.data = ' '
ReqPacket.cmd = 0
ReqPacket.dst = 10
DataPacket.bcc = 0
DataPacket.data = ' '
DataPacket.tns = 1
DataPacket.sts = 0
DataPacket.cmd = 0
DataPacket.src = 0
DataPacket.dst = 10
Text = ' '
TimePeriod = 0
BccFlag - True
Result = 0
data = ' '
tns = 1
sts = 0
cmd = 0
src = 0
dst = 10
status = 0
bcc = 0
SYS_ERR = 0
Status: Triggered
State: IDLE
Event: send.message
Action: DCIO
Variable_Retrieval_Elapsed_Time: Thu Apr 13 14:33:30 1989
State_Table_Variables:
ReplyPacket.data = ' '
ReplyPacket.status = 0
Fig. 12. Test configuration file.
Fig. 14. Trace data output file.
70 HEWLETT-PACKARD JOURNAL OCTOBER 1990
© Copr. 1949-1998 Hewlett-Packard Co.
process will be preempted. HP DIS uses this HP-UX exten
sion. With real-time HP DIS processes, response time vari
ability can be decreased.
(a)
Application^» Application
Performance Test Results
HP DIS performance studies were conducted to answer
these questions:
• What is the performance on HP 9000 Series 300 and
Series 800 computers?
• What is the throughput of an HP DIS interface?
The flexibility of HP DIS allows device interface modules
to be configured and combined in an infinite number of
ways. A simple model was chosen that gives representative
data involving the major items contributing to performance.
Fig. 16 depicts a typical configuration. An application
(PModel) is connected to a device interface module (PIl),
which is connected to an HP-UX RS-232 multiplexer port.
The port has a physical loopback connection and all data
written to the port is immediately read back from the port.
Each port has one PModel. A fixed-length message is sent
to the port by a PModel and returned unchanged. Because
the application program waits for each message to return
before sending another, only one message is in the loop at
a time per PModel. Throughput data is averaged over 20
transmissions for various message lengths using one, then
6-Channel
Multiplexer
Fig. 15. Configurations for HP DIS-built interfaces, (a) One
protocol interface handles one port and one device, (b) Three
protocol interfaces work together, (c) Three protocol inter
faces, each dedicated to a port, with an upper-level interface
(PI4) directing and organizing messages.
3000
connected HP-UX message queues. HP DIS handles the
message buffering. This decreases development time since
port configuration and buffer management code does not
have to be written. However, the performance of this port
interface will fall short of a similar interface with integrated
port management functions.
It is also relevant that HP DIS is an HP-UX application.
An HP-UX cell controller, whether written in HP DIS or
in C, is subject to normal HP-UX timesharing policies, and
will have nondeterministic response times. With HP-UX
on HP 9000 Series 800 computers, processes can be run
under a real-time priority to decrease the chance that a
2 Ports
1 Port
1 0 0 0
3000
2 0 0 0
Message Length (Bytes)
2 Ports
1 Port
Multiplexer
(b)
Loopback Ports -
Fig. 16. HP DIS performance test model for multiple ports.
PModel is a simulated HP DIS application.
1 0 0 0
2 0 0 0
Message Length (Bytes)
3000
Fig. 1 7. Loopback response time for performance tests using
the HP DIS application PModel on (a) HP 9000 Model 375
and (b) HP 9000 Model 832 computers (HP DIS 2.2 on HP-UX
7.0).
OCTOBER 1990 HEWLETT-PACKARD JOURNAL 71
© Copr. 1949-1998 Hewlett-Packard Co.
two PModels.
Fig. 17 shows the data throughput of an HP 9000 Model
375 and an HP 9000 Model 832, both with 16M bytes of
memory, under the HP-UX 7.0 operating system. The
throughput in Fig. 17 reflects the transfer of data one-way.
The curves show the data throughput for one PModel and
the sum of the data throughputs for two PModels.
The throughput decreases with message sizes above 1000
to 1500 bytes because HP DIS is performing message match
ing (see "Matching Messages," page 67). HP DIS matches
raw byte streams to the user's definition of the message.
Summary
The Hewlett-Packard Device Interface System, HP DIS,
is a tool that eases the development of communication
links between computers and factory-floor devices. Inter
faces can be developed more quickly than with conven
tional code. Devices can be simulated, and testing is mostly
automated. Communication links can be scaled, using only
the routines needed for the application at hand. Through
the use of this tool , factory-floor devices from many vendors
can be mixed and matched.
HP DIS can improve productivity, reliability, develop
ment costs, and market response and reduce support costs
for device interfaces.
Acknowledgments
HP DIS was made possible by the teamwork and dedica
tion of many people, especially the R&D team. The authors
would like to acknowledge the other present team mem
bers — Frank Leong and Marve Watkins — and Ron Becker,
the project manager, who pulled it all together. We also
would like to acknowledge previous team members — Cle
men Jue for the development environment, David Brunstein and Tom Hirata for the testing environment, and Wes
Higaki who was one of the initial investigators. Dan Shive
and Ron Short of the technical support group made the
manuals a reality. The authors also acknowledge all the
contractors, technical writers, marketing people, and man
agers without whom HP DIS could not exist.
References
1. F. Litman, "Software Tools for Plant-Floor Connectivity, "Auto
mation, Vol. 35, no. 4, April 1988, p. 28.
2. Hewlett-Packard Journal, August 1990, pp. 6-60.
3. C. Jue, "A System to Develop Factory Floor Device Interfaces,"
Proceedings of the Third International IMS Conference, Vol. 3,
part 1, September 1987, pp. 134-146.
72 HEWLETT-PACKARD JOURNAL OCTOBER 1990
© Copr. 1949-1998 Hewlett-Packard Co.
Measurement of R, L, and C Parameters in
VLSI Packages
Developed to verify the electrical models of a 408-lead
multilayer ceramic package, this measurement technique
can measure the very small inductances, capacitances,
and resistances that are typical of high-performance
packages. It does not require extraction of RLC parameters
from time-domain reflectometer measurements.
by David W. Quint, Asad Aziz, Ravi Kaw, and Frank J. Perezalonso
THE NEED FOR HIGH-PERFORMANCE, high-pincount 1C packaging with a large number of I/O con
nections has brought about a project to design and
characterize a multilayer ceramic PGA {pin-grid array) ca
pable of providing up to 320 I/O lines at an operational
frequency in excess of 60 MHz. Our challenge is to produce
a package that brings the performance advantages of mul
tilayer cofired ceramic technology to high-lead-count, highpower VLSI circuits. The package currently in development
will mount a 14-mm-square CMOS chip.
Fig. 1 is a cross-sectional drawing of the package. The
package contains 12 metallization layers, which are used
for signal, power, and ground routing, and uses three-tier
bonding from the chip to the bonding pads on the package.
The top two bonding tiers on the package are exclusively
for signal or I/O connections. The bottom bonding tier is
reserved for power supply and ground connections. The
signal routing layers provide a stripline environment and
there is a ground plane adjacent to each of the power supply
planes.
The pads on the chip are spaced at an effective pitch of
approximately 110 micrometers (0.00433 inch). We have
been able to match this pitch on the package by using two
signal bonding tiers. Power supply connections are divided
into eight groups for flexibility and noise isolation. The
chip mounts directly on a copper-tungsten heat spreader
that is used for heat dissipation. The heat spreader is also
connected to ground.
Electrical Modeling
The designers of system processing units put considera
ble effort into system simulations. One of their main con
cerns is the amount of noise induced on logic VDD (logic
VDD powers the internal circuitry of the 1C) and logic GND
(ground). Another concern is noise on signal lines. Noise
is caused by power and ground bounce and by coupling
of signals from one line to another. The main source of this
noise is the familiar Ldi/dt term, which arises from logic
and I/O driver currents flowing in the inductance of the
package and circuit board conductors. To produce mean
ingful simulations, it is necessary to include models of all
these components in the circuits. The simulations are par
ticularly sensitive to the 1C package model, since the pack
age lead inductance accounts for most of the inductance L
in the Ldi/dt term for computing power supply bounce.
The values of the power supply inductances that need to
be added in the simulations range from about 70 picohenries to about 0.5 nanohenry. In addition, ground models
""Bounce" in grojnd and power supplies refers to a temporary droop or rise in the supply
voltage caused by large currents drawn by devices using the supplies-
Bottom Bonding Tier
Middle Bonding Tier
Top Bonding Tier
Dielectric Layer 1
Dielectric Layer 2
Dielectric Layer 3
Dielectric Layer 4
Dielectric Layer 5
Dielectric Layer 6
Dielectric Layer 7
Dielectric Layer 8
Dielectric Layer 9
Dielectric Layer 10
Dielectric Layer 11
(TL-1)
(TL-2)
(TL-3)
(TL-4)
(TL-5)
(TL-6)
(TL-7)
(TL-8)
(TL-9)
(TL-10)
(TL-11)
Bypass
Capacitor
Bypass
Capacitor
Fig. 1 . PGA (pin-grid array) con
struction detail (not to scale). All
dielectric layers are 0.008 inch
thick.
OCTOBER 1990 HEWLETT-PACKARD JOURNAL 73
© Copr. 1949-1998 Hewlett-Packard Co.
and signal trace models including cross coupling need to
be included in the system simulations.
Model Verification
Creation of electrical models for the PGA was facilitated
by various software tools and by leveraging previous work
done on the subject. Verifying that these models were cor
rect was much more challenging and is the main topic of
this paper. Models were verified by comparing package
parameters calculated from the models with measurements
on an actual PGA package.
Most high-frequency measurements are done using a net
work analyzer or a time-domain reflectometer (TDK). Both
instruments measure reflections from discontinuities. The
problem with using a TDK lies in the interpretation of the
results when the time delay through a discontinuity is short
compared with the rise time of the propagating pulse. The
PGA package signal leads consist of stripline transmission
lines with a signal propagation time between 100 and 200
picoseconds and a characteristic impedance of approxi
mately 37 ohms. Considering the time delay through the
package, a TDK pulse with a rise time of about 20 pico
seconds is necessary to give good resolution. Using such
a fast rise time, skin effect, dielectric losses, and reflections
from the test fixture and interconnections distort the reflec
tion test signals to such a degree that it is virtually impos
sible to extract an RLC circuit for the package itself. A TDR
measurement also does not give numbers for first-order
and second-order mutual inductances and capacitances be
tween signal lines. TDRs are especially unsuitable for the
power supply planes because of the extremely low charac
teristic impedances of these planes (5Ã1 or less). A TDR
does not have the ability to drive such a low-impedance load.
Since simulations are done with the HP Spice software
package using models made up of discrete R, L, and C
elements, these are the parameters that need to be verified.
Because TDR or direct measurements with an impedance
analyzer cannot give this kind of detail, it was deemed
necessary to develop another measurement technique,
which is described in the following sections.
Capacitance Measurement
A typical PGA signal trace structure, including the signal
wirebond and the PGA pin, is modeled in the passive cir
cuit of Fig. 2. This is a useful model for HP Spice simula
tions. It can also be approximated in the form of transmis
Wirebond
sion lines with Z0 = VE^7c7 and propagation time
t = VLjCj. The transmission line approach is more dif
ficult to apply when the mutual coupling and resistive
losses are important. This is the case in any 1C package
where a number of I/O lines and internal circuits are
switching simultaneously. The RLC equivalent is applica
ble to any circuit where the time delay of the element is
less than about half the shortest rise time of the propagating
signal. In the case of pin-grid array packages, the odd
geometry gives the device non-TEM properties; for exam
ple, the capacitive and inductive coupling coefficients are
not equal.
To overcome the shortcomings of traditional measure
ment techniques, the following method is used. The R, L,
and C values in Fig. 2 are measured using slightly different
electrical circuits. The only source used is a ramp generator
and the only detector used is an oscilloscope with a
matched 50Ã1 input impedance. Fig. 3 illustrates the mea
surement of a capacitance such as the coupling capacitance
between the two traces. The use of a ramped input signal
cancels effects of circuit elements that are not under test
and aids in the interpretation of results. The charging cur
rent i(t) defines the voltage across the oscilloscope's chan
nel 2 inputs and the unknown capacitance Cx can be calcu
lated from
= Vmax/(Rscope2dVin/dt)
(1)
where voltage is measured at the center time of the Vgen
ramp.
The voltage Vou, is small, but its accurate measurement
is important to the determination of the parameter values.
The measurements that must be taken on the oscilloscope
screen are the slope of the Vin ramp (dVin/dt) and Vmax,
the plateau voltage on Vout. Matched coaxial cables be
tween the instruments and the device under test introduce
time delays, but do not introduce any additional factors in
the equation for Cx above. For example, losses in the coaxial
cables from the sample to the oscilloscope will introduce
no error if they are the same length for both channels, since
the measurement depends on the quotient of the measured
voltages. The voltage drops across the series resistance and
inductance in the trace are small, since they are in series
with the capacitive impedance. The capacitive impedance
dominates the current, so the resistive and inductive volt-
PGA Trace
PGA 3.2 nH 50 mil
Pad
Node T1
0.30 pF
Node T4
GND 3
74 HEWLETT-PACKARD JOURNAL OCTOBER 1990
© Copr. 1949-1998 Hewlett-Packard Co.
Fig. 2. Passive circuit model of a
typical PGA signal trace structure,
showing typical trace parameters.
Nodes T3 and T4 are correspond
ing nodes on the adjacent signal
trace for capacitive coupling. In
ductive coupling is not included
in this model.
ages can be ignored. In addition, the capacitive loading on
the Vout side is of little consequence, because the voltage
being measured (the plateau top) is essentially constant.
The capacitance on the Vout side will drop out of the mea
surement equation if the time constant Cou,RSCOpe2 is much
less than the test pulse rise time.
Cx can be measured quite easily at several pulse rise
times, and the calculated values of Cx can be compared for
the different measurements. The longest pulses will give
smaller plateau voltages, increasing the importance of the
signal-to-noise ratio of the equipment, while the shorter
pulses will cause the measurement to depart from its true
value in a systematic way as the parasitics in the test jig
become more dominant. In the PGA and other common
packages, there is usually a wide range of pulse rise times
that give the same answer for the value of the tested ele
ment.
In this and all the other test situations, the test jig param
eters must be measured without the package and subtracted
from the values obtained with the package in place. The
design of the test jig is important and must include
matched-impedance lines with connections as close as pos
sible to the PGA to minimize the parasitics of the test jig.
Good ground integrity is important, since large parasitics
can be introduced quite easily. Poor connections are easily
found using the real-time display of the oscilloscope. Move
ment of a poor connection will produce corresponding
wiggling of the oscilloscope trace and a poor connection
can usually be located quickly and corrected. Once the test
jig and cabling are connected properly, movement of the
cables should produce no noticeable movement of the os
cilloscope traces. This troubleshooting ability is another
benefit of this technique.
The input impedance of the signal trace, represented by
Lx in series with Rx, is low compared with the effective
source impedance of the generator and the oscilloscope in
parallel (RgeJRscope). so the inPut current is determined
solely by the test equipment connected to the circuit. Thus,
current I(t) = Vgen(t)/Rgen, since the package under test is
virtually a short circuit. Virtually all of the current from
the ramp generator flows through the package trace, so the
voltage Vout is determined solely by the trace inductance
and resistance. Again, if the rise time of Vgen is much greater
than the time constant of the generator and package induc
tance, the voltage across the package quickly becomes
Voul = Lxdl/dt + RXI. The output pulse consists of the sum
of two components: (1) a flat-topped pulse like the one in
the capacitance measurement, and (2) a ramp proportional
to the input current. If we separate the two voltages in Fig.
4, call the inductive voltage Vlx, represented by the plateau
voltage, and call the resistive voltage Vrx, the final voltages
after the ramp can be found from:
Inductance Measurement
For each of the parameters that we measured (inductance,
capacitance, mutual inductance, and mutual capacitance)
we had to build a different set of probes. The parasitics of
Inductances are measured by applying ramped currents
instead of ramped voltages to the traces under test. This is
arranged by shorting the wirebonds of the PGA traces to
the PGA ground circuit. This circuit is shown in Fig. 4.
(2)
Lx =
(3)
n/ *
where dVgen/dt is the slope of the ramp voltage and Vgenmax
is the final voltage of the Vgen step (see Fig. 4).
The bounce caused by the partial inductance of the PGA
ground net can be canceled by driving a third (uncoupled)
signal trace, grounded to the shield at the inner lead bond,
with a negative-going ramp of the same magnitude. The
third lead must be uncoupled so that mutual inductance
does not contribute unwanted voltages to the measurement.
Test Fixture and Parasitics
c,
F U n
R , c o p e ,
(Channel 1)
Time (ns)
Fig. 3. Capacitance measurement circuit and voltage wave
forms.
Fig. 4. Inductance measurement circuit and voltage wave
forms.
OCTOBER 1990 HEWLETT-PACKARD JOURNAL 75
© Copr. 1949-1998 Hewlett-Packard Co.
these probes were zeroed out before and after each measure
ment to make sure that the characteristics of the probes
did not change during the measurements. This was espe
cially important in the case of the power supply inductance
measurements because the characteristics of the probes
were comparable in magnitude to those of the package.
Signal Models
Signal trace models were calculated using Stripcal1 to
calculate the lumped elements in the trace model between
the PGA bond pad and the base of the pin. Ind32 was used
to calculate the inductances (both self and mutual) for the
wirebonds. The measurements were done on a 408-pin
PGA that had a test chip mounted and bonded in it. For
the inductance measurements, all the wirebonds were
shorted together on the chip. For the capacitance measure
ments, all the signal wirebonds were isolated.
Resistance measurements are not discussed in detail be
cause they are straightforward and because the measured
values of the tungsten metallization sheet resistance were
between 5 and 7 milliohms/square, well below the maxi
mum specification of 13 milliohms/square. In addition, the
resistance of the ground and power supply routing was
less than 5 milliohms, which was not considered signifi
cant.
The inductance measurement results were as follows:
Parameter
SelfLofVDD
Self L of VDL (group 1}
Self L of VDL (group 2)
SelfCofVDD
Self C of VDL (group 1)
Self C of VDL (group 2)
Measured Calculated Difference
97 pH
79 pH 19%
0.88nH 0 . 7 7 n H 1 4 %
1.18nH 1.06nH
11%
4.96nF
4.92 nF
1%
0.66 nF
0.62nF
6%
0.5 nF
0.47 nF
6%
Note: VDD is the logic power supply voltage and VDL is the
I/O driver supply voltage.
VDD Measurement Errors
In the VDD inductance measurements, the topology forced
us to put all eight ground wirebonds on the same side of
the VDD wirebonds instead of four on each side as the chips
are actually bonded. Moving all the ground wirebonds to
one side of the VDD wirebonds may increase the inductance
of the wirebonds by up to 50%. This effect accounts for
most of the difference between the calculated and measured
values of the VDD inductance. Fig. 5 compares the measure
ment bonding pattern and the pattern the package was
designed to use in actual operation. Another source of error
is the shape (loop height, length, etc.) of the wirebonds.
The wirebond shape may be turn out to be different from
the one that was analyzed.
Parameter Measured Calculated Difference
Self L (upper tier) IS.lnH 15.2nH 1%
Self L (middle tier) 14.9nH 14.6nH 2%
Mutual L (middle tier) 3.64nH 3.21nH 12%
Mutual L (upper tier) 4.7nH 4.5nH 4%
WB coupling (1st order) 2.0nH 2.1nH 5%
WB coupling (2nd order) 1.4nH 1.5nH 7%
n
Chip
4GND8Power4GND
Package
Note: WB = wirebond.
The sources of error for the signal inductance parameters
are: (1) the routing on the chip, (2) variations in the length
and the shape of the wirebonds and traces, and (3) imper
fections in the ground planes.
The capacitance measurement results were as follows:
(a)
4 GND
Parameter
Self C (upper tier)
Self C (middle tier)
Mutual C (upper tier)
Mutual C (middle tier)
Measured Calculated Difference
lO.lpF
9.5pF
6%
6.5pF
6.3pF
3%
0.7 pF
O.SpF
29%
O.GpF
O.SpF
17%
The sources of error in the signal capacitance measure
ments are: (1) the capacitance of the pin braze pads, and
(2) the capacitance of the vias and the associated cover
dots. The capacitance between the wirebonds and between
the pins was found to be less than 0.1 pF and has been
ignored.
Power Supply Models
The measurements were done in the same way as for the
signal traces. The results were as follows:
Chip
D
Package
(b)
Fig. 5. To measure VDD inductance, it was necessary to put
all eight GND wirebonds on the same side of the VDD
wirebonds, as shown in (b). In actual service, the wirebond
pattern is as shown in (a). This accounts for most of the
difference between the measured and calculated values.
76 HEWLETT-PACKARD JOURNAL OCTOBER 1990
© Copr. 1949-1998 Hewlett-Packard Co.
VDL Measurement Errors
Acknowledgments
The wirebonding pattern may vary in the VDL bonds. In
the calculations for the VDL inductance, we also did not
take into account the inductance of the epoxy routing on
the chip.
The power trace capacitance measurements were done
without the bypass capacitors because the 0.1-/xF nominal
value of the bypass capacitor is very large compared to the
capacitance parameter that we were trying to measure. A
very high degree of correlation was obtained between mea
surements and calculations.
References
Conclusions
It is important to be able to verify electrical models of
packages used in high-performance systems. Time-domain
reflectometry cannot give the kind of detail needed for
model verification, and it is very difficult to derive an RLC
circuit from the results.
The measurement technique described in this paper3
overcomes the problems associated with TDR measure
ments. Inductance is measured while capacitance is
shorted out, and capacitance is measured on open-circuit
traces so inductive effects are negligible. Slow rise times
of input voltage pulses make it possible to avoid transmis
sion line effects. A feature of this method is that the mea
surements can be made with readily available digital oscil
loscopes and pulse generators.
Good correlation between the calculated and measured
results for the PGA package was obtained. This measure
ment technique has also been used to measure parameters
of TAB [tape automated bonding) packages, printed circuit
PGAs, and printed circuit board connectors with good re
sults, and could also be useful in other electrical model
verification experiments.
We would like to thank Ken Lee and Ralph Liu. who
assisted with this effort and provided invaluable ideas and
advice. We would also like to thank Bob Crawford and Ron
Bernard for designing the probes and writing the software
for the measurements, and Pauline Prather for her support
and expertise in bonding and assembling the test devices.
Colorado 1C Division assembly, particularly Dave Gilzean,
helped wholeheartedly to make this effort possible.
1. Stripcal is a program developed by Dave Quint, Hewlett-Pack
ard Colorado Integrated Circuits Division. It uses transmission line
analytical equations to calculate R, L, and C values.
2. Ind3 is a program developed by Ken Lee, Hewlett-Packard Cir
cuit Technology Group, It uses the method described in A.E.
Ruehli, "Inductance Calculations in a Complex Integrated Circuit
Environment," IBM Journal of Research and Development, Sep
tember 1972, pp. 470-481.
3. D.W. Quint, G.L. Brown, and R. Kaw, "Measurement of R, L,
and C Parameters in VLSI Packages," Proceedings of the 1988
Design Technology Conference, Hewlett-Packard Company, pp.
324-331.
Additional information can be found in:
4. D.W. Quint and Asad Aziz, "Electrical Design Methodology of
a 407-pin Multilayer Ceramic Package," Proceedings of the 1989
EJectronic Components Conference, Hewlett-Packard Company,
pp. 392-398.
5. F. Perezalonso, B. Crawford, R. Kaw, and R. Bernard, "Investi
gation of R, L, and C Measurement Techniques for VLSI Packages,"
Hewlett-Packard Company, September 1988. Published as "Elec
trical Characteristics of VLSI Packages," Proceedings of the 1989
Design Technology Conference, Hewlett-Packard Company, pp.
110-119.
OCTOBER 1990 HEWLETT-PACKARD JOURNAL 77
© Copr. 1949-1998 Hewlett-Packard Co.
Statistical Circuit Simulation of a
Wideband Amplifier: A Case Study in
Design for Manufacturability
Statistical variations of integrated circuit parameters are
often correlated, not independent. Examples are side-byside resistor values and matched transistor gains.
Accounting for these correlations using principal
component analysis can make statistical simulation an
accurate predictor of manufacturing data.
by Chee K. Chow
IN INTEGRATED CIRCUIT DESIGN, there is a need for
statistical circuit simulation that can accurately project
circuit performance distributions in manufacturing.
There are two reasons for this need. First, being able to
project the performance distributions precisely in the de
sign phase enhances the chance of a first-pass success.
Thus, the cycle time from the design phase to manufactur
ing release can be significantly reduced. Second, simula
tion can serve as a diagnostic tool to identify hidden process
problems. For example, large discrepancies between the
simulated and manufactured distributions frequently indi
cate process anomalies not previously discovered.
A simple approach to statistical circuit simulation is to
perform a large number of Monte Carlo simulations.1 The
inputs to these simulations are computer-generated ran
dom circuit parameters based on the means and standard
deviations of the circuit elements extracted from the man
ufacturing data. A significant drawback of this approach
is that it does not account for the highly correlated nature
of the device parameters within an integrated circuit die
and also among dice. Consequently, it rarely gives accurate
predictions.
In integrated circuits, device parameter variations are
separable into two types. Variations across many dice, waf
ers, or fabrication lots are random in nature, while those
within a die are highly correlated. Examples of the latter
type are the side-by-side layouts of resistors and matched
transistor pairs. At present, commercially available circuit
simulators do not address these intercorrelations, so they
do not provide the information needed.
This article describes a circuit simulator study that ac
counts for both the intradie device correlations and the
lot-to-lot random variations. The technique used is based
on principal component analysis, a branch of multivariate
statistics. Examples are presented showing the application
of this technique to a custom wideband bipolar amplifier
1C used in the HP 54503A digitizing oscilloscope. The tech
nique was used to set an accurate specification early in the
design stage and to identify a process problem affecting
the circuit performance.
Principal Component Analysis
Consider an integrated circuit having n parameters such
as resistor values and transistor gains. These parameters
vary statistically from lot to lot, from wafer to wafer, and
from die to die because of the time and spatial variations
of the fabrication process. The manufacturing distributions
for this 1C can be simulated if an ensemble of n-variable
vectors can be generated having the same statistical vari
ation as the circuit parameters. The accuracy of these simu
lations depends to a large extent on how accurately the
intercorrelations of the n variables are accounted for.
The n-variable vectors can be generated by multivariate
statistical techniques,2'3 starting from the correlation ma
trix of the n variables. Multivariate statistics analyzes the
structure of complex statistical variables to identify latent
factors (factor analysis) or the principal components (prin
cipal component analysis). A comprehensive treatment of
this subject can be found in the literature.2'3 Multivariate
statistics has been used extensively by behavioral scientists
to analyze latent factors responsible for certain behavior
traits. Its applications to manufacturing problems, based
on our literature survey, have been very limited.4'5'6'7
One method of solving for the ensemble of n-variable
vectors is based on principal component analysis tech
niques. Briefly, principal component analysis describes the
variances of the n random variables in terms of a set of
mutually orthogonal or statistically independent (uncorrelated) variables known as principal components. Each prin
cipal component accounts for a portion of the total variance
larger than the succeeding components. Statistical ensem
bles of the n variables can be readily generated from random
numbers after the transformation to the principal compo
nents because of the statistical independence of the princi
pal components.
The ensemble of n-variable vectors is generated in a
closed-form solution starting from the n-variable correla
tion matrix R, provided that the eigenvalues of R are all
positive and the variables are normally distributed. For a
set of n circuit variables, ya, y2, ..., yn having a correlation
matrix R, it can be shown that the ith statistical variable
78 HEWLETT-PACKARD JOURNAL OCTOBER 1990
© Copr. 1949-1998 Hewlett-Packard Co.
High-Frequency
Output
y¡ is given by the expression: 2'3
Output Stage
y¡ =
(D
Variable Gain Cell
•x4
where Xj, x2 xn are normally and independently distrib
uted random variables (the principal components). The
values for the x¡ in equation 1 are chosen randomly and
independently. This is possible because the x¡ are statisti
cally independent.
The \¡ in equation 1 are the eigenvalues of R. The ¿t¡ and
a¡ are the mean and standard deviation of the ith variable.
•Yij is the jth component of the ith eigenvector of R. The
statistical measures for these variables are obtained from
volume manufacturing data.
Control
Register
T T
User Input (Circuit
Element Correlation
Matrix)
Statistical
Package—
Main Program
Transconductance
Stage
Gain
Input
Voltage
Fig. 2. Simulation was used to set the minimum gain specifi
cation for this programmable gain circuit portion of an inte
grated amplifier 1C.
Circuit Simulation Algorithm
A circuit simulator6 was written in C and HP-UX scripts.
It runs on an HP 9000 Series 370 workstation. The algorithm
of this program is shown in Fig. 1. It consists of three
modules:
• A statistical analysis package performs all the computa
tions according to equation 1.
• A parser retrieves these correlated vectors and generates
the HP Spice text files.
• HP Spice performs the simulations.
The user is required to input three pieces of information:
(1) the HP Spice text file, (2) the correlation matrix of the
circuit variables, and (3) the means and standard deviations
of the circuit variables. Data for (2) and (3) has been com
piled from volume production measurements for many HP
fabrication processes.
The confidence limits of the simulated distributions vary
as the square root of the number of simulations.1 Based on
numerous case studies, about 100 simulations are adequate
to project a 95% confidence limit, even for a fairly complex
system. Although these Monte Carlo simulations are com
putationally intensive, with the emergence of widely avail
able high-performance workstation-class computers, they
can be routinely performed. A typical 200-sample simula-
x4 Gilbert Gain
Cell
tion takes 149 seconds on an HP 9000 Model 370 worksta
tion.
Case Study
The merits of this statistical circuit simulator are illus
trated by two applications during the manufacturing re
lease of a custom high-speed integrated circuit.
The circuit is an integrated amplifier fabricated using
the HP5 process, a 5-GHz fT oxide isolation process. The
1C is used in the HP 54503A low-cost, high-performance
digitizing oscilloscope. This custom 1C is the heart of an
amplifier/attenuator assembly that accurately reproduces
signals from dc to 500 MHz and from 40 mV to 40V with
ac or dc coupling and a constant output dynamic range of
500 mV. The 1C consists of nine functional blocks. On-chip
35 -r-
30 --
25 -Principal Component
Analysis Correlated
Vector Generation
20 --
15 -HP Spice Text
File Generation
10 --
•^Hi
HP Spice
Text Files
HP Spice
Simulation
HP Spice
Simulator
T
Parameter
Extraction
1.30
Data Analysis
I Statistical
Package
Fig. 1. Statistical circuit simulation algorithm.
1.35
1 . 4 0 1 . 4 5
Minimum Amplifier Gain
1.50
1.55
Fig. 3. The distribution of the minimum gain from 220 corre
lated simulations has a mean of 1.44 and a standard deviation
of 0.04. It predicts a minimum gain specification of 1.33 to
1.57.
OCTOBER 1990 HEWLETT-PACKARD JOURNAL 79
© Copr. 1949-1998 Hewlett-Packard Co.
registers can program the gain from 1.5 to 12.5 in 3% incre
ments.
Projection of Manufacturing Specifications
In the manufacturing release of this 1C, no reliable data
was available to set the minimum gain specification (1.5
nominal) of the programmable gain circuitry shown in Fig.
2. This gain cell can be programmed to amplify small sig
nals with a nominal gain of 1.5 to 12.5.
An inaccurate specification on the minimum gain would
cause high parametric yield loss. The statistical simulation
techniques described previously were carried out to project
the gain distribution in a real-life manufacturing environ
ment. For these simulations, 36 circuit elements were iden
tified as random variables. The correlation coefficients of
these variables were compiled from production data for
the HP5 process. Specifically, the following intradie device
correlations were accounted for:
• Correlations between resistors
• Correlations between transistor model parameters
• Correlations between resistors and transistor model pa
rameters.
A 200-sample Monte Carlo simulation was carried out.
The simulated minimum gain distribution is shown in Fig.
3. It projects a ±3cr specification of 1.33 to 1.57. Measured
production data for six months shows a distribution with
a mean of 1.43 and a standard deviation of 0.034 (Fig. 4).
The measured data projects a specification of 1.33 to 1.53.
The simulated and manufacturing statistics are compared
in Table I.
Statistical Simulation as a Diagnostic Tool
A second example of the power of this simulation
technique illustrates its role as a diagnostic tool. The por
tion of the 1C under study is the dc restore circuit, which
level shifts the complementary high-frequency outputs to
the ground level. A block diagram is shown in Fig. 5. From
600
High-Frequency
Noninverting
Output
High-Frequency
Inverting
Output
Level-Shifted
Output
Fig. 5. A portion of the integrated amplifier 1C showing the
operational amplifier and resistor bridge of the level shifting
subcircuit. The op amp in this dc restore circuit had a large
low-frequency output offset for which the simulation data
did not match the production data, suggesting a process
anomaly.
Table I
Comparison of Simulated and
Measured Minimum Gain Distributions
Mean
Standard Deviation
Specification
Simulated Measured
1.44
1.43
0.04
0.034
1.33-1.57
1.33-1.53
1400 T
T
1200 --
500
1000 -400 -800 -300 -600 -200 -400 -100 --
200 --
1.30
1.35
1 . 4 0 1 . 4 5 1 . 5 0
Minimum Amplifier Gain
1.55
1.60
Fig. 4. Six-month production data has a distribution with a
mean of 1.43 and a standard deviation of 0.034. The minimum
gain specification is 1 .33 to 1.53.
-100
-80
- 6 0
- 4 0
Output Offset (mV)
-20
Fig. 6. Distribution of the output offset of the op amp from
production data. The mean is -49 mV and the standard de
viation is 11 mV.
80 HEWLETT-PACKARD JOURNAL OCTOBER 1990
© Copr. 1949-1998 Hewlett-Packard Co.
production data, the low-frequency output offset voltage
of the op amp had been observed to be large. The op amp
output offset voltage is defined as the output voltage of the
op amp when the two high-frequency outputs (inverting
and noninverting) are equal. Under balanced conditions,
the output offset should be close to zero. It was not known
what the standard deviation caused by process latitudes
should be. Fig. 6 shows a typical distribution of this param
eter from six months of production data. It has a mean of
-49 mV and a standard deviation of 11 mV.
The op amp circuitry has 22 random variables, of which
12 are highly matched resistors and 10 are the transistor
model parameters. Correlated simulations were carried out
as for the first example. A 200-sample simulation revealed
the distribution of the offset voltage to have a mean of 11
mV and a standard deviation of 3.4 mV. Such a large dis
crepancy between the manufactured and simulated distri
butions suggests some hidden process anomaly that has
not been discovered.
Subsequently, the process defect that caused this wide
distribution of the output was identified. The circuit was
redesigned to desensitize it to the process defect. The dis
tribution from one wafer after redesign is compared to the
simulated distribution in Fig. 7. The redesigned circuit
shows a mean of 6 mV and a standard deviation of 4.8 mV.
The simulated values are close to the initial production
data. The slight discrepancies of the standard deviations
can be accounted for by a variety of second-order effects
that were not included in these simulations, most notably
variations in metal resistivity and metal-to-metal contact
resistance.
20 --
15 -10-5 --
Conclusions
This statistical circuit simulation study has demonstrated
the accuracy of this technique in projecting circuit perfor
mance distributions in manufacturing. The technique also
has a valuable role as a diagnostic tool for troubleshooting
process problems. Despite some assumptions used both in
the underlying principal component analysis theory and
the device modeling, these simulations are accurate enough
to be a practical CAD tool in product development.
It is hoped that this approach to design for manufacturability, through synergism of volume production data with
design simulation tooling as exemplified by this simulation
study, will be a significant contribution to manufacturing
technology.
Acknowledgments
The author would like to acknowledge Tom Resman, the
designer of the integrated amplifier, for his assistance in
this study and in the manuscript preparation.
References
1. J.M. Hammersley and D.C. Handscomb, Monte CarJo Methods,
Fletcher & Son, Ltd., 1964.
2. D.F. Morrison, Multivariate Statistical Methods, McGraw-Hill,
1976.
3. R.J. Harris, A Primer o/MuJtivariate Statistics, Academic Press,
1985.
4. S. Inohira, T. Shinmi, M. Nagata, T. Toyabe, and K. lida, "A
Statistical Model including Parametric Matching for Analog Inte
grated Circuit Simulation," IEEE Transactions on Electron De
vices, Vol. ED-32, 1985, p. 2177.
5. O.P, Van Driel, "Factor Analysis as an Initial Tool to Obtain
Models for Circuit Analysis," IEE CoJJoquium on Model Parame
ters for Circuit Analysis, 1981.
6. C.K. Chow, "Projection of Circuit Performance Distributions
by Multivariate Statistics," IEEE Transactions on Semiconductor
Manufacturing, Vol. 2, no.2, May 1989, pp. 60-65.
7. A. Study W.R. Dutton, and W.J. McCalla, "Experimental Study
of Gummel-Poon Model Parameter Correlations for Bipolar Junc
tion Transistors," IEEE Transactions on Solid-State Circuits, Vol.
SC-12, 1977, p. 552.
0 --
-10
(a)
10
Output Offset (mV)
20
30
10
Output Offset (mV)
20
30
200 -150 -100 -50 --
-10
(b)
Fig. the (a) The distribution of the output offset voltage of the
op amp from 200 correlated simulations has a mean of 11
mV and a standard deviation of 3.4 mV, very different from
the production data shown in Fig. 6. (b) The distribution from
one production wafer after redesign has a mean of 6 mV and
a standard deviation of 4.8 mV, more closely matching the
simulation data.
OCTOBER 1990 HEWLETT-PACKARD JOURNAL 81
© Copr. 1949-1998 Hewlett-Packard Co.
System Level Air Flow Analysis for a
Computer System Processing Unit
Numerical simulation of particle traces using finite element
modeling and supercomputers gives a good qualitative
picture of air f low features. Computed velocity profiles and
p r e s s u r e d r o ps hav e reas onably good a ccu ra cy.
by Vivek Mansingh and Kent P. Misegades
STEADY, VISCOUS, THREE-DIMENSIONAL AIR
FLOW within a computer system processing unit
has been analyzed using finite element modeling.
The objective of the study was to investigate the effective
ness of finite element modeling in predicting the air flow
characteristics within a computer. A full-scale three-dimen
sional finite element model of an HP 9000 Model 850 com
puter was created using FIDAP, the finite element code
from Fluid Dynamics International. This model consisted
of over 60,000 nodes and over 40,000 8-node brick ele
ments. Extensive computations were carried out using
CRAY Y-MP supercomputers. General flow characteristics,
including velocity profiles and pressure drop across the
system, were computed. Numerically calculated particle
traces were recorded using video equipment. It was found
that numerical simulation of particle traces can show good
qualitative features of the flow through the system and the
modeling results of velocity profiles through the boards
and the system pressure drop have reasonably good accu
racy.
Project Objective
For the thermal management of air-cooled computers,
the key air flow parameters to be determined are the air
I/O
Side
O
Fan Location
71
cm
CPU
Side
Top View
- 65 cm -
92 cm
Side View
Fig. 1 . HP 9000 Model 850 computer system processing unit
(right side of computer in photo). There are six fans.
82 HEWLETT-PACKARD JOURNAL OCTOBER 1990
© Copr. 1949-1998 Hewlett-Packard Co.
Front View
velocities in the computer cabinet and the pressure drop
across the system. The air velocity flow characteristics in
the system help in designing the system layout at the board
and component level while the system pressure drop forms
the basis for selecting air movers. Thermal management at
the component level also requires the knowledge of board
and component level air flow characteristics.
Traditionally, pressure drop and flow characteristics
within a computer cabinet have been experimentally mea
sured on prototypes of the machines. Unfortunately, an
accurate prototype can only be available when all the com
ponents of a system have been designed. This typically
happens only towards the end of a design effort. Therefore,
the flow characteristics and the system pressure drop can
be accurately measured only after almost all the compo
nents of the system have already been designed. If for some
reason the pressure drop is found to be excessive or the
air flow characteristics are found to be different than ex
pected, major design changes may have to be made at the
end of the design cycle, resulting in serious product mod
ifications and delays. Furthermore, experimental measure
ments in a prototype are both difficult and expensive in
terms of human effort.
It would be advantageous to have modeling tools that
can predict these air flow characteristics early in the design
process. A model could also easily simulate effects of high
altitude, zero gravity, and other conditions. The objective
of this study was to investigate the effectiveness of finite
element modeling in predicting the air flow and pressure
drop characteristics within a computer.
Model Development
As mentioned earlier, a full-scale model of an air-cooled
HP 9000 Model 850 computer system processing unit (SPU)
was created. A photograph and a drawing of a Model 850
SPU are shown in Fig. 1. A Model 850 SPU is approximately
1 m high, 0.7 m wide, and 0.7 m deep. It has four processor
boards and several other memory and I/O boards. The back
plane essentially divides the cabinet into two halves: the
CPU (central processing unit) side and the I/O side. It has
six tube axial fans for cooling, which operate in the suction
mode. Four of these fans are for the CPU side and two are
for the I/O side. The air inlet is at the top and the outlet is
at the bottom. Detailed mechanical drawings showing loca
tions and dimensions of the structural components, printed
circuit boards, suction fans, flow inlets, and flow outlets
were used to create the full-scale model of the system using
FIDAP's preprocessor FIPREP and mesh generator FIMESH.
The full model was divided into smaller finite elements
using 8-node brick elements. Fig. 2 gives a view of the final
mesh, consisting of 60,507 nodes and 48,600 elements.
From the outset, it was recognized that detailed threedimensional modeling from the system level to the compo
nent level, that is, from the overall dimensions of the
cabinet down to the smallest component on a board, was
impossible, both from a modeling standpoint and because
of computation time requirements. For instance, we esti
mated that simulating the flow through just one of the CPU
boards having a number of RAM chips, PGAs, CPU chips
and multifinned heat sinks would require a mesh of ap
proximately 60,000 to 100,000 elements and a run time of
more than 10 CPU hours. Therefore, it was not possible to
model every single component in the system. Since the
main focus for this project was on system level characteris
tics, a component level simplification in the geometry was
made. To model the components on the boards, it was
Fig. 2. A view of the finite element
mesh for simulation of the air flow
in an HP 9000 Model 850 SPU.
The complete mesh consists of
60,507 nodes and 48,600 8-node
brick elements.
OCTOBER 1990 HEWLETT-PACKARD JOURNAL 83
© Copr. 1949-1998 Hewlett-Packard Co.
COMPUTER AIRFLOW AT ASSEMBLY LEVEL - CRAY SIMULATION
VELOCITY
VECTOR PLOT
SCALE FACTOR
0.1000E+03
MAX. VECTOR
PLOTTED
0.5064E+01
AT NODE 61127
PLANE COEFF.S
A O.OOOE+00
B 0.100E+01
C O.OOOE+00
D -.450E+00
VIEW DIRECTION
VX -.100E+01
VY 0.300E+00
VZ 0.800E+00
ANG -. lOOE+03
FIDAP 4.51
lO-Nov-89
17: 48: 02
assumed that between any two printed circuit boards, a
certain percentage of the flow passage was blocked by com
ponents. Based on good engineering judgment, for the four
CPU printed circuit boards the blockage was assumed to
represent 30% of the volume between two adjacent boards,
whereas for all the other boards the blockage was assumed
to represent 50% of the volume between adjacent boards.
Flow deflection vanes at the air inlet of the cabinet were
Fig. 3. Computed flow velocities
in the X-Z plane at the entrance to
the printed circuit boards.
included in the model as infinitely thin plates at the same
angle as the actual vanes.
Although the computational effort required to generate
this three-dimensional model was moderate, it took ap
proximately IVz engineer-months to create the model be
ginning from mechanical drawings. It is also important to
note that the use of computer graphics was essential to the
successful creation of this mesh, visual analysis of the mesh
COMPUTER AIRFLOW AT ASSEMBLY LEVEL - CRAY SIMULATION
VELOCITY
VECTOR PLOT
SCALE FACTOR
0.1000E+03
MAX. VECTOR
PLOTTED
0.2831E+01
AT NODE 61143
PLANE COEFF.S
A 0.100E+01
B O.OOOE+00
C O.OOOE+00
D -.400E+00
VIEW DIRECTION
VX -.100E+01
VY 0.300E+00
VZ 0.800E+00
ANG -.100E+03
FIDAP 4.51
lO-Nov-89
17: 40: 56
84 HEWLETT-PACKARD JOURNAL OCTOBER •
© Copr. 1949-1998 Hewlett-Packard Co.
Fig. 4. Computed flow velocities
in the Y-Z plane through the
printed circuit boards.
COMPUTER AIRFLOW AT ASSEMBLY LEVEL - CRAY SIMULATION
VELOCITY
VECTOR PLOT
SCALE FACTOR
0.1000E+03
MAX. VECTOR
PLOTTED
0.866aE+01
AT NODE 60548
E+01
¡
Ã-8i
l+oo
CORNER
SURFACE CUT
VIEW DIRECTION
VX -.100E+01
VY 0.300E+00
VZ 0.800E+00
ANG -.100E+03
FIDAP 4.51
lO-Nov-89
17: 37: 07
generator's results being the only good means of checking
progress. For this, both FIDAP's postprocessor FDPOST
and Cray's Multi-Purpose Graphics System MPGS were
used. All computations, including graphics, were per
formed on CRAY Y-MP supercomputer systems.
Fig. 5. Computed flow velocities
through the system.
Boundary Conditions
The physical problem modeled was three-dimensional,
steady, viscous, laminar, isothermal flow. Because the ve
locity through the system was of the order of 2 m/s and
the length scales of the components were small, the flow
was assumed to be laminar. The flow was assumed to be
isothermal because the main focus of the problem was the
Fig. 6. Animation of simulated
particle traces representing the air
flow.
OCTOBER 1990 HEWLETT-PACKARD JOURNAL 85
© Copr. 1949-1998 Hewlett-Packard Co.
fluid flow characteristics.
On all solid surfaces of both physical and blocked re
gions, a no-slip velocity boundary condition was specified.
At the two air flow entrances on the top front and back of
the cabinet, no boundary conditions were set. For the air
outlet at the bottom of the cabinet, a constant-velocity bound
ary condition was defined. However, for the outlet bound
ary condition, not enough information was available ini
tially. The flow rate produced by a fan is dependent on
the pressure drop it experiences. Flow rates are given in
tabular or graphical form as a function of pressure drop.
The data used in this work was for the fans running at 60
Hz at sea level. Since we did not know the pressure drop
of the system at the outset, it was not possible to know the
fan flow rate that would define the air exit boundary con
dition. To get around this problem, the following iterative
procedure was used:
1. An initial fan flow rate was guessed.
2. For this given fan flow rate, the flow field including the
pressure drop was calculated based on the uniform exit
velocity across the exit area that would result in the same
volumetric flow rate as produced by six fans.
3. For this computed pressure drop, the corresponding
flow rate from the fan manufacturer's performance curve
was found.
4. An average of this new flow rate and the previously
guessed flow rate was used to calculate the exit velocities,
which were used as new boundary conditions for the next
computation.
5. This procedure was repeated until the guessed flow rate
produced the corresponding pressure drop according to
the fan curves.
Computations
The three-dimensional Navier-Stokes equations of mo
tion1 were solved in the nondimensional form. The solution
technique used was the segregated method.2 A separate
linear system was solved for each of the four degrees of
freedom — three velocity components and pressure. Relaxa
tion factors2 used for the four degrees of freedom were 0.8,
0.8, 0.8 for the three velocity components and 0.0 for pres
sure. To improve the accuracy and stability of the solution,
an up winding factor2 of 1.0 was used for all degrees of
freedom for all computations because high velocity gra
dients were expected in the coarse mesh regions.
Starting from an initial linear Stokes flow solution, the
problem was run for five iterations using the segregated
solver, resulting in the following solution or convergence
errors for the four degrees of freedom:
• X Velocity: 0.0084
• Y Velocity: 0.0074
• Z Velocity: 0.0038
» Pressure: 0.021.
The FÃDAP User's Manual recommends that these values
be driven to 0.001 when using the segregated solver. How
ever, we were not able to converge to values lower than
these even though several other values of relaxation and
upwinding parameters were tried.
After the initial five-iteration solution, a new fan flow
rate was guessed and a second run was made. The solution
was said to have converged when the pressure error was
less than or equal to that of the first run, 0.021. The results
of this iterative procedure are given below:
Typical FIDAP Run
Run Number of Fancfm Pressure Pressure Drop Fancfm
Iterations Guessed Error Computed Actual
1 5 1 0 0 0 . 0 2 1 0 . 4 6 i n H 2 O
2 7
8 5
0 . 0 1 6
0 . 4 0 i n H 2 O
7 0
9 0
In this typical example, 12 iterations were required to
find a value of fan flow rate within 10% of that actually
supplied by the fan. Given that other simplifications in the
model had been made, it was felt that this level of con
vergence and accuracy was adequate.
On the CRAY Y-MP supercomputer, 10 hours of CPU
time were required to perform the 12 solution iterations
needed. Memory needed was 4.0M words of main memory
and 87M words of secondary memory or scratch memory.
For scratch memory, a CRAY SSD (solid-state storage de
vice) was used. This reduced an otherwise substantial I/O
wait time penalty for disc memory devices to a small frac
tion of the total run time.
Numerical Results
As mentioned earlier, general flow characteristics in
cluding the velocity profile and the pressure drop across
the system were computed. Some typical pictures of the
flow velocities through the system are shown in Figs. 3, 4,
and 5. These illustrate well the qualitative features of the
flow entering the CPU side and the I/O side at the top
section, turning and going through the printed circuit
boards, and exiting the fan outlet region. An interesting
aspect of the results is that a substantial portion of the flow
entering the I/O side or the rear of the cabinet actually
passes over the backplane obstruction in the top section
and flows to the CPU side at the front of the cabinet. It can
also be seen that" the velocities are low at the entrance,
increase between board slots and then decrease again at
the exit of the board slots. The air velocities are higher in
the four CPU board slots than in the memory and I/O board
slots and are in the range of about 1 to 2.75 m/s.
As mentioned earlier, simulated particle paths or traces
were recorded on video. The traces represent the path that
a massless particle would take through the computer cab
inet if released at various locations along the inlet planes.
Such traces are very useful in giving a qualitative represen
tation of the three-dimensional complex flow field. Using
MFCS, the Multi-Purpose Graphics System from Cray Re
search, these traces were animated to show the details of
the flow. The animation very clearly shows the cross flow
of air from the I/O side of the cabinet to the CPU side and
other complex features of the flow. A typical picture of
particle simulation is shown in Fig. 6.
Experimental Results
Experimental measurements of the air velocities were
carried out on an actual system with the help of a hot-wire
anemometer. The cabinet walls and some of the boards
were modified so that the hot wire could be inserted into
the cabinet at the desired locations. Velocity profiles were
86 HEWLETT-PACKARD JOURNAL OCTOBER 1990
© Copr. 1949-1998 Hewlett-Packard Co.
Conclusions
3.0 -r
1.0
2 0 2 5
Slot Depth (cm)
Experimental Computational
Results Results
Fig. 7. Computed and experimental air velocities in CPU
board slot 0 at the middle of the board.
measured in the CPU and I/O board region across the
boards. A typical velocity profile measured in CPU board
slot 0 at the middle of the board is shown in Fig. 7. The
slot depth (X in Fig. 3), is plotted on the x axis while the
respective velocities are shown on the y axis. It can be seen
that the air velocities are in the range of 1.25 m/s to 2.25
m/s. The velocities are about 1.5 m/s at both ends of the
board, with the highest velocities of about 2.25 m/s in the
middle of the board. One of the reasons for the nonuniformity in the velocity profile is the presence of various com
ponents (chips, heat sinks, etc.) on the board.
A comparison of the numerical results with the experi
mental results is also shown in Fig. 7. The numerical results
predict higher velocities in the center and lower velocities
near the ends than were actually measured. However, the
range of velocities is about 1.5 m/s to 2.75 m/s, which is
relatively close to that measured experimentally. It should
be noted that in the numerical simulations, the board com
ponents were modeled as blockage to the flow, whereas in
the experiments, the boards had actual components on
them.
Steady, viscous, three-dimensional air flow within a
computer SPU has been analyzed using finite element model
ing. General flow characteristics including velocity profiles
and pressure drop across the system were computed. Nu
merically simulated particle traces were recorded using
video equipment. It was found that numerical simulation
of particle traces can show good qualitative features of the
flow through the system. The particle traces show some
extremely interesting flow characteristics that could not
have been known easily otherwise. The computed velocity
profiles through the boards and the computed system pres
sure drop have reasonably good accuracy. Modeling pre
dicted the air velocities through the CPU board slots to be
about 1.5 m/s to 2.75 m/s whereas the experimental mea
surements showed about 1.25 m/s to 2.25 m/s. However,
finite element modeling can be relatively expensive in
terms of computation time.
References
1. H. Schlichting, Boundary Layer Theory, McGraw-Hill, 1979.
2. FÃDAP Theoretical Manual, Fluid Dynamics International.
OCTOBER 1990 HEWLETT-PACKARD JOURNAL 87
© Copr. 1949-1998 Hewlett-Packard Co.
33393115
44S
TO:
8000
Hewlett-Packard Company, 3200 Hillview
Avenue, Palo Alto, California 94304
Bulk Rate
U.S. Postage
Paid
Hewlett-Packard
Company
ADDRESS CORRECTION REQUESTED
October 1990 Volume 41 • Number 5
Oct
Technical Information from the Laboratories of
Hewlett-Packard Company
Hewlett-Packard Company, 3200 Hillview Avenue
Palo Alto, California 94304 U.S.A.
Hewlett-Packard Marcom Operations Europe
P.O. Box 529
1180 AM Amstelveen, The Netherlands
Yokogawa-Hewlert-Packard Ltd., Suginami-Ku Tokyo 168 Japan
Hewlett-Packard (Canada) Ltd.
6877 Goreway Drive, Mississauga, Ontario L4V 1M8 Canada
CHANGE OF ADDRESS:
To subscribe, change your address, or delete your name from our mailing list, send your request to Hewlett-Packard
Journal, 3200 Hillview Avenue, Palo Alto, CA 94304 U.S.A. Include your old address label, if any. Allow 60 days.
5953-8583
© Copr. 1949-1998 Hewlett-Packard Co.