1
1st Edition
xMAP Cookbook
®
A collection of methods and protocols for developing multiplex
assays with xMAP Technology.
Authors
Stephen Angeloni, Ph.D.
Robert Cordes, B.A.
Sherry Dunbar, Ph.D.
Carlos Garcia, B.A.
Grant Gibson, Ph.D.
Charles Martin, Ph.D.
Valerie Stone, M.S., C.T. (A.S.C.P.)
Effective Date: 01 July 2013
Certain applications using Luminex® Microspheres, including those illustrated
in this documentation, may be covered by patents owned by parties other than
Luminex. Purchase and use of Luminex Microspheres does not convey a license
to any third party patents unless explicitly stated in writing. You are responsible
for conducting the necessary due diligence and securing rights to any third party
intellectual property required for your specific application(s) of any Luminex
Microspheres. Nothing herein is to be construed as recommending any practice or
any product in violation of any patent or in violation of any law or regulation.
Introduction |
www.luminexcorp.com | Page 2
BR_574.01_0613
Table of Contents
1Introduction. . . . . . . . . . . . . . . . . . . . . . . . . . . . . . . . . . . . . . . . . . . . . . . . . . . . . . . . . . . . . . . . . . . . . . . . . . . . . . . . . . . . . . . . . . . . . . . . . . . . . . . . . . . . . . . . . . . . 4
2
xMAP® Technology. . . . . . . . . . . . . . . . . . . . . . . . . . . . . . . . . . . . . . . . . . . . . . . . . . . . . . . . . . . . . . . . . . . . . . . . . . . . . . . . . . . . . . . . . . . . . . . . . . . . . . . . . . . . . 5
3
Development of an xMAP Assay. . . . . . . . . . . . . . . . . . . . . . . . . . . . . . . . . . . . . . . . . . . . . . . . . . . . . . . . . . . . . . . . . . . . . . . . . . . . . . . . . . . . . . . . . . . . . . . . . 7
3.1 Assay Design. . . . . . . . . . . . . . . . . . . . . . . . . . . . . . . . . . . . . . . . . . . . . . . . . . . . . . . . . . . . . . . . . . . . . . . . . . . . . . . . . . . . . . . . . . . . . . . . . . . . . . . . . . . . . . 8
3.2 Reagents and Equipment. . . . . . . . . . . . . . . . . . . . . . . . . . . . . . . . . . . . . . . . . . . . . . . . . . . . . . . . . . . . . . . . . . . . . . . . . . . . . . . . . . . . . . . . . . . . . . . . . . 10
3.3 Microsphere Coupling. . . . . . . . . . . . . . . . . . . . . . . . . . . . . . . . . . . . . . . . . . . . . . . . . . . . . . . . . . . . . . . . . . . . . . . . . . . . . . . . . . . . . . . . . . . . . . . . . . . . . . 11
3.3.1 Antibody and Protein Coupling . . . . . . . . . . . . . . . . . . . . . . . . . . . . . . . . . . . . . . . . . . . . . . . . . . . . . . . . . . . . . . . . . . . . . . . . . . . . . . . . . . . . . . . 13
3.3.2 Antibody Coupling Confirmation. . . . . . . . . . . . . . . . . . . . . . . . . . . . . . . . . . . . . . . . . . . . . . . . . . . . . . . . . . . . . . . . . . . . . . . . . . . . . . . . . . . . . 16
3.3.3 Nucleic Acid Coupling . . . . . . . . . . . . . . . . . . . . . . . . . . . . . . . . . . . . . . . . . . . . . . . . . . . . . . . . . . . . . . . . . . . . . . . . . . . . . . . . . . . . . . . . . . . . . . 19
3.3.4 Oligonucleotide Coupling Confirmation. . . . . . . . . . . . . . . . . . . . . . . . . . . . . . . . . . . . . . . . . . . . . . . . . . . . . . . . . . . . . . . . . . . . . . . . . . . . . . . 22
3.4 Optimization of Multiplex . . . . . . . . . . . . . . . . . . . . . . . . . . . . . . . . . . . . . . . . . . . . . . . . . . . . . . . . . . . . . . . . . . . . . . . . . . . . . . . . . . . . . . . . . . . . . . . . . 28
3.4.1 Optimization of Immunoassays. . . . . . . . . . . . . . . . . . . . . . . . . . . . . . . . . . . . . . . . . . . . . . . . . . . . . . . . . . . . . . . . . . . . . . . . . . . . . . . . . . . . . . 29
3.5 Assay Validation. . . . . . . . . . . . . . . . . . . . . . . . . . . . . . . . . . . . . . . . . . . . . . . . . . . . . . . . . . . . . . . . . . . . . . . . . . . . . . . . . . . . . . . . . . . . . . . . . . . . . . . . . . 38
3.5.1 Immunoassay Validation. . . . . . . . . . . . . . . . . . . . . . . . . . . . . . . . . . . . . . . . . . . . . . . . . . . . . . . . . . . . . . . . . . . . . . . . . . . . . . . . . . . . . . . . . . . . 39
4
Proteomic Applications . . . . . . . . . . . . . . . . . . . . . . . . . . . . . . . . . . . . . . . . . . . . . . . . . . . . . . . . . . . . . . . . . . . . . . . . . . . . . . . . . . . . . . . . . . . . . . . . . . . . . . . . 41
4.1 Common xMAP Immunoassays. . . . . . . . . . . . . . . . . . . . . . . . . . . . . . . . . . . . . . . . . . . . . . . . . . . . . . . . . . . . . . . . . . . . . . . . . . . . . . . . . . . . . . . . . . . . 42
4.1.1 Capture Sandwich Immunoassay . . . . . . . . . . . . . . . . . . . . . . . . . . . . . . . . . . . . . . . . . . . . . . . . . . . . . . . . . . . . . . . . . . . . . . . . . . . . . . . . . . . . 43
4.1.2 Competitive Immunoassay. . . . . . . . . . . . . . . . . . . . . . . . . . . . . . . . . . . . . . . . . . . . . . . . . . . . . . . . . . . . . . . . . . . . . . . . . . . . . . . . . . . . . . . . . . 47
4.1.3 Indirect (Serological) Immunoassay. . . . . . . . . . . . . . . . . . . . . . . . . . . . . . . . . . . . . . . . . . . . . . . . . . . . . . . . . . . . . . . . . . . . . . . . . . . . . . . . . . . 51
4.1.4 Combined Capture Sandwich and Competitive Immunoassay . . . . . . . . . . . . . . . . . . . . . . . . . . . . . . . . . . . . . . . . . . . . . . . . . . . . . . . . . . 55
4.2 Other Coupling Moieties . . . . . . . . . . . . . . . . . . . . . . . . . . . . . . . . . . . . . . . . . . . . . . . . . . . . . . . . . . . . . . . . . . . . . . . . . . . . . . . . . . . . . . . . . . . . . . . . . . 58
4.2.1 Coupling Biotinylated Peptides with LumAvidin® Microspheres. . . . . . . . . . . . . . . . . . . . . . . . . . . . . . . . . . . . . . . . . . . . . . . . . . . . . . . . . 59
4.2.2 Coupling Peptides with ADH . . . . . . . . . . . . . . . . . . . . . . . . . . . . . . . . . . . . . . . . . . . . . . . . . . . . . . . . . . . . . . . . . . . . . . . . . . . . . . . . . . . . . . . . 61
4.2.3 Peptide Coupling to ADH-Modified Microspheres. . . . . . . . . . . . . . . . . . . . . . . . . . . . . . . . . . . . . . . . . . . . . . . . . . . . . . . . . . . . . . . . . . . . . 63
4.2.4 Coupling Peptides with MPBH. . . . . . . . . . . . . . . . . . . . . . . . . . . . . . . . . . . . . . . . . . . . . . . . . . . . . . . . . . . . . . . . . . . . . . . . . . . . . . . . . . . . . . . 65
4.2.5 Coupling Peptides to Maleimide-Modified Microspheres. . . . . . . . . . . . . . . . . . . . . . . . . . . . . . . . . . . . . . . . . . . . . . . . . . . . . . . . . . . . . . . 67
4.3 Proteomics FAQ’s. . . . . . . . . . . . . . . . . . . . . . . . . . . . . . . . . . . . . . . . . . . . . . . . . . . . . . . . . . . . . . . . . . . . . . . . . . . . . . . . . . . . . . . . . . . . . . . . . . . . . . . . . 69
5
Genomic Applications . . . . . . . . . . . . . . . . . . . . . . . . . . . . . . . . . . . . . . . . . . . . . . . . . . . . . . . . . . . . . . . . . . . . . . . . . . . . . . . . . . . . . . . . . . . . . . . . . . . . . . . . . 75
5.1 Introduction: Development of Nucleic Acid Assays . . . . . . . . . . . . . . . . . . . . . . . . . . . . . . . . . . . . . . . . . . . . . . . . . . . . . . . . . . . . . . . . . . . . . . . . . . 76
5.1.1
Oligo Ligation Assay (OLA) SNP Typing. . . . . . . . . . . . . . . . . . . . . . . . . . . . . . . . . . . . . . . . . . . . . . . . . . . . . . . . . . . . . . . . . . . . . . . . . . . . . . 78
5.1.2 Allele-Specific Primer Extension (ASPE) SNP Typing. . . . . . . . . . . . . . . . . . . . . . . . . . . . . . . . . . . . . . . . . . . . . . . . . . . . . . . . . . . . . . . . . . . 85
5.1.3 Target-Specific PCR Sequence Detection with MagPlex®-TAG™ Microspheres. . . . . . . . . . . . . . . . . . . . . . . . . . . . . . . . . . . . . . . . . . . 93
5.1.4 Direct DNA Hybridization Sequence Detection. . . . . . . . . . . . . . . . . . . . . . . . . . . . . . . . . . . . . . . . . . . . . . . . . . . . . . . . . . . . . . . . . . . . . . . . 98
5.1.5 MicroRNA Analysis. . . . . . . . . . . . . . . . . . . . . . . . . . . . . . . . . . . . . . . . . . . . . . . . . . . . . . . . . . . . . . . . . . . . . . . . . . . . . . . . . . . . . . . . . . . . . . . . 104
Appendix A – Common Buffers Used in xMAP Protocols. . . . . . . . . . . . . . . . . . . . . . . . . . . . . . . . . . . . . . . . . . . . . . . . . . . . . . . . . . . . . . . . . . . . . . . . . . . . . . . 112
Appendix B – Equipment Needed for xMAP Protocols. . . . . . . . . . . . . . . . . . . . . . . . . . . . . . . . . . . . . . . . . . . . . . . . . . . . . . . . . . . . . . . . . . . . . . . . . . . . . . . . . 114
Index | Table of Contents
www.luminexcorp.com | Page 3
BR_574.01_0613
Chapter 1
Introduction
Biological assays have evolved from relatively large volume reactions to smaller
volume, faster, highly automated tests. Whether in a test tube rack, a microwell
plate, or a micro-volume chip, these may all be considered ‘arrays’ of assays, where
different samples are physically separated from one another.
Since biological assays are typically coupled to a colorimetric readout, the notion
of ‘multiplexing’, or reading multiple test results in a single sample volume has
been complicated primarily by spectral overlap. Color from one assay detection
channel interferes with color in other detection channels. This limitation has made
such multi-color assays useful only to a few analytes per sample.
While microarrays (2-dimensional solid arrays) allow small-volume assaying
of physically separated features, limitations such as slow, solid-phase kinetics;
instability of immobilized protein or nucleic acid capture molecules; and poor
reproducibility may limit its broader application in the clinical or research
laboratory.
What is multiplexing?
Multiplexing describes assaying
multiple analytes simultaneously
within a single sample volume
and within a single cycle or run.
While solid-phase microarrays
technically meet this definition,
multiplexing typically describes
solution-phase assays such
as xMAP® Technology or
quantitative PCR.
Solution-phase multiplex assays remain highly desirable to laboratories due to the
following benefits:
• reduced sample volume and other redundant consumables
• more data from the same amount of labor
• faster results due to solution-phase kinetics
Chapter 1 | Introduction
www.luminexcorp.com | Page 4
BR_574.01_0613
Chapter 2
xMAP® Technology
In the late 1990’s scientists at Luminex® invented xMAP Technology, a major
advance in multiplexed biological assays. xMAP Technology draws from the
strengths of solid-phase separation technology but without the typical limitations
of solid-phase reaction kinetics. By combining advanced fluidics, optics, and
digital signal processing with proprietary microsphere (“bead”) technology, xMAP
Technology enables a high degree of multiplexing within a single sample volume.
Featuring a flexible open-architecture design, xMAP Technology can be configured
to perform a wide variety of assays quickly, cost-effectively, and accurately.
xMAP Technology Name Origin
x= biomarker or disease panel
to be tested
MAP= Multi-Analyte Profiling
xMAP= multiplex biological testing of
up to 500 analytes in a single
sample volume
How does xMAP Technology work?
xMAP Technology uses colored beads to carry biological assays similar to ELISA
or nucleic acid hybridization assays. By color-coding microscopic beads into
many spectrally distinct sets, each bead set can be coated with a nucleic acid
or protein capture molecule specific to a particular biological target, allowing
the simultaneous capture of multiple analytes from a single sample. Because
of the microscopic size and low density of these beads, assay reactions exhibit
virtually solution-phase kinetics. However, once an assay is complete the solidphase characteristics allow each bead to be analyzed discretely. By incorporating
magnetic properties into xMAP Microspheres, assay washing is simplified while
maintaining desirable solution-phase properties.
Figure 1.
5’-PO4
A
B
Excite at One Excitation
Wavelength
Observe Two Emission
Wavelengths
C
Figure 1 – xMAP Microspheres include
two-dye products where (A) one
excitation wavelength allows observation
of two separate fluorescence emission
wavelengths, yielding (B) 100 unique
microsphere sets (10x10 dye matrix);
and three-dye products where (C)
one excitation wavelength allows
observation of three separate fluorescence
wavelengths, yielding (D) 500 unique
microsphere sets. (10x10x5 dye matrix)
D
Excite at One Excitation
Wavelength
Chapter 2 | xMAP® Technology
Observe Three Emission
Wavelengths
www.luminexcorp.com | Page 5
BR_574.01_0613
Figure 2.
Figure 2 – In addition to detection of
internal bead dyes (shown in Figure 1),
5’-PO4
A
B
(A) a second excitation wavelength allows
observation of a separate fluorescent
reporter molecule, {B) that allows
detection of a biological assay on the
Excite at One Excitation
Wavelength
Observe One Emission
Wavelength
surface of the microsphere.
Multiple light sources inside the Luminex analyzer excite (1) the internal bead dyes
that identify each microsphere particle and (2) any fluorescent reporter molecules
captured during the assay. The instrument records dozens of readings for each
bead set and produces a distinct result for each analyte in the sample. Using this
process, xMAP Technology allows multiplexing of up to 500 unique bioassays
within a single sample, both rapidly and precisely.
This revolution in multiplex biological assays has been licensed by Luminex
to a number of kit developers in the clinical diagnostics, pharmaceutical and
life science research markets. Commercially available kits include molecular
diagnostics, immunodiagnostics, kinase profiling, cytokine/chemokine, genotyping,
gene expression, and others.
In addition to commercial kits, Luminex supports custom assay development.
This document is a summary of methods and protocols for developing multiplex
biological assays with xMAP Technology.
Chapter 2 | xMAP® Technology
www.luminexcorp.com | Page 6
BR_574.01_0613
Chapter 3
Development of an xMAP® Assay
The development process for xMAP multiplex assays is relatively simple, but does
require a few unique considerations compared to monoplex assays. The following
describes the general workflow of xMAP assay development.
Identify Appropriate Assay
Design
Identify Necessary
Reagents and Equipment
• Protein/Nucleic Acid
• Assay Format (i.e Capture
Sandwich, Oligo Ligation,
etc.)
• Antibodies/Probes
• Microspheres
• Buffers
• Thermocycler
• Shaker
Optimize
Validate
• Volumes
• Concentrations
• Times
• Cross Reactivity
• Signal
• Sensitivity
• Specificity
• Known samples
• Standards
• Controls
Chapter 3 | Development of an xMAP® Assay
Couple Beads
• Antibody Coupling
(AbC) Kit
• Custom Coupling
• LumAvidin® (non-magnetic)
• MagPlex®-TAG™
(pre-coupled by Luminex®)
www.luminexcorp.com | Page 7
BR_574.01_0613
Chapter 3.1
Assay Design
xMAP® Technology is adaptable to a number of biological assays, including
immunoassays, nucleic acid assays and enzyme activity assays. Common
immunoassay formats are capture sandwich, competitive and indirect antibody
assays. Nucleic acid assays are hybridization-based where a probe sequence
captures a labeled complementary target from your sample reaction. Enzyme
activity assays typically involve labeling or cleaving a peptide substrate to
introduce or release a fluorescent molecule.
Immunoassay
Nucleic acid
Enzyme activity
Capture sandwich
TAG incorporation
Kinase/Phosphatase selectivity
Competitive
PCR based
Indirect assay
Primer extension
Probe ligation
Immunoassays
Immunoassays are used for the detection of biological substances and have
become established as one of the most popular analytical techniques applied
in clinical and veterinary medicine, drug discovery and rapidly emerging areas
such as biothreat and food safety. Due to the ease of use, accuracy, specificity
and speed, immunoassays are commonly used to measure a large number of
hormones, blood products, enzymes, drugs, disease markers and other biological
molecules. Many immunoassays can be performed directly on untreated samples,
such as plasma, serum, urine, saliva, and cerebrospinal fluid. Single-analyte ELISA
has been an industry standard for decades and has led to more novel techniques
such as highly multiplexed immunoassays for measuring potentially hundreds of
analytes simultaneously. Such multiplex assays can be used to generate profiles
of clinical samples that can facilitate accurate disease diagnoses or prediction of
drug responses.
For multiplex immunoassays, the effective biological range of each analyte must
be considered to ensure that reporter fluorescence will fall into the dynamic range
of your assay. Monoplex assays address this by serial dilution of the sample, but
a multiplex assay must take a different approach. Some analytes may exist in
such a low range of concentrations that a more sensitive assay is needed for that
analyte, while another analyte in the same multiplex assay may be abundant and
therefore require a lower-sensitivity assay. Sensitivity of each antibody assay may
be affected by the affinity of the capture antibody, the abundance of the capture
antibody and the amount of capture beads used for that analyte.
Chapter 3.1 | Assay Design
www.luminexcorp.com | Page 8
BR_574.01_0613
Figure 3.
A
B
Capture Sandwich
Figure 3 - Common assay formats for
immunoassays include (A) capture
sandwich assay, requiring capture and
detection antibodies to your analyte
target (polyclonal capture antibodies
should be purified and mono-specific);
(B) competitive (antibody) assay, requiring
a single antibody and a labeled positive
target; and (C) indirect assay (or serology
assay), requiring both a target protein and
an anti-antibody.
C
Competitive Assay
Indirect Serological Assay
A second consideration for polystyrene microsphere-based immunoassays is
the biological matrix and non-specific binding. Serum samples typically have
extraneous proteins that may non-specifically bind to polystyrene and other
materials. xMAP Microspheres (“beads”) are polystyrene beads that appear
relatively smooth under a microscope, but on a molecular level have irregular,
porous surfaces. Microsphere pores range in size from 100 to 2000 angstroms,
allowing them to trap proteins, which typically range from 50 to 100 angstroms
in diameter. Microsphere assays can employ blocking agents optimized for each
biological matrix to reduce non-specific binding of non-target molecules.
Nucleic acid assays
Multiplex nucleic acid assays require mostly different optimization steps from
immunoassays, although some similarities exist. Similar to immunoassays,
sensitivity of nucleic acid assays may be affected by the amount of capture
oligonucleotide and the amount of beads used. In order to distinguish similar
nucleic acid sequences, standards and controls must be run to confirm that there
is minimal cross hybridization and non-specific hybridization between sequences.
Depending on whether the purpose of your assay is gene expression, genotyping
or simply sequence detection, there are different requirements for the type of
starting nucleic acid used in the assay and the chemistry required to generate
reporter molecules. No matter which chemistry is used to generate the reporter
molecules, the capture and detection of the reporter molecules is performed as
diagrammed in Figure 4.
Figure 4.
Figure 4 - Schematic of nucleic acid
Homozygous AA
A
bead has a unique capture sequence
Signal
specific for a marker sequence. If reporter
molecules are generated and captured
(bead A) a fluorescence signal is detected.
a
If no reporter molecules are generated
A
Chapter 3.1 | Assay Design
assay analysis on Luminex® beads. Each
a
and captured (bead a) minimal or
background signal is detected.
www.luminexcorp.com | Page 9
BR_574.01_0613
Chapter 3.2
Reagents and Equipment
The newest generation of xMAP® beads are MagPlex® Microspheres*(“beads”)
which are superparamagnetic microspheres, 6.5 microns in diameter. These beads
are impregnated with different ratios of two or three dyes allowing the generation
of 500 different bead regions for the development of assays up to 500 plex.
The surface of these beads are also impregnated with iron containing magnetite
particles. This feature allows the use of magnets to rapidly remove the beads
from reaction suspensions to speed up processing during different protocols and
minimize bead loss resulting in more reproducible data generation.
Note: Bead colors are referred to as
“regions” because beads are plotted
in different regions of the bead map
in the instrument software, based on
their dye ratios.
MagPlex Microspheres should be purchased from Luminex®. They should be
stored at 4°C and be kept in the dark. They can be used directly from their vials
as described in the coupling protocol. MagPlex Microspheres are available at
concentrations of 2.5 million and 12.5 million beads/mL and can be ordered in 1mL
and 4mL vial sizes.
MagPlex®-TAG™ Microspheres are MagPlex beads covalently coupled with unique
24 base oligonucleotide ‘anti-TAG’ sequences. These beads enable the user to
quickly and easily design custom bead arrays, simply by adding a complementary
‘TAG’ sequence to primers or probes used in assay reactions and then using the
TAG/anti-TAG hybridization to capture each assay product to a unique MagPlex
bead. For a complete list of the TAG and anti-TAG sequences for each of the
150 available microspheres, visit www.luminexcorp.com.
MagPlex and MagPlex®-TAG™ Microspheres are compatible with all Luminex
instruments, including MAGPIX® (up to 50-plex), Luminex® 100/200™ (up to 80plex) and FLEXMAP 3D® (up to 500-plex for MagPlex; up to 150-plex for MagPlexTAG). Basic Luminex equipment reagents include Calibration and Verification kits
and Sheath or Drive Fluid. They are also offered in a variety of custom volumes. For
additional information on all xMAP reagents contact your sales manager or visit
http://www.luminexcorp.com/Products/ReagentsMicrospheres/
Depending on the type of multiplex assay you are developing, certain additional
reagents and equipment must be provided by you. For a list of materials needed
for typical assays, see each specific protocol. For a list of common buffers and
equipment used in xMAP assays, please see Appendices A and B.
*Assays and protocols are described for MagPlex or MagPlex-TAG Microspheres
unless otherwise noted.
Chapter 3.2 | Reagents and Equipment
www.luminexcorp.com | Page 10
BR_574.01_0613
Chapter 3.3
Microsphere Coupling
xMAP® Microspheres (“beads”) require chemical coupling of a capture agent (e.g.,
antibody or oligonucleotide) or enzyme substrate (e.g., peptide or protein) in order
to perform an assay. There are approximately 100 million carboxyl groups on each
xMAP microsphere. The chemistry of the coupling process involves formation of
a carbodiimide bond between primary amines on an antibody, protein, peptide or
oligonucleotide and carboxyl groups on the surface of xMAP Microspheres:
Coupling Chemistry
Two-step (for proteins)
Cl+NH
O
O
O
OH
O
O
Carboxylated
microsphere
N
N
O
N
O
Cl+NH
C
S
O
O
O
NH
S
O-
EDC
Unstable reactive
o-acylisourea ester
N
HO
H3N
Protein-Coupled
Microsphere
O
O
CH3
HN CH3
X
+
Amino-Modified
Oligonucleotide
O
protein—NH2
Sulfo-NHS
One-step (for oligonucleotides)
+
protein
N
H
Semi-stable
amine-reactive
NHS-ester
O
N
O
O-
O
OH
Carboxylated
microsphere
CH3
N
C
N
EDC
N
O C
Cl
N+
H CH3
N+
-
O
HN X
N
o-Acylisourea Active
Intermediate
Oligonucleotide-Coupled
Microsphere
Antibody coupling for proteins is a simple two-step carbodiimide procedure during
which microsphere carboxyl groups are first activated with EDC (1-Ethyl-3-[3dimethylaminopropyl]carbodiimide hydrochloride) reagent in the presence of
Sulfo-NHS (N-hydroxysulfosuccinimide) to form a sulfo-NHS-ester intermediate.
The reactive intermediate is then replaced by reaction with the primary amine
of the target molecule (antibody, or peptide) to form a covalent amide bond.
Oligonucleotide coupling is a one-step process where microsphere carboxyl
groups activated by EDC form a covalent amide bond with primary amines on
amine-modified oligonucleotides.
Chapter 3.3 | Microsphere Coupling
www.luminexcorp.com | Page 11
BR_574.01_0613
Luminex® provides several products to support coupling and assay
development with xMAP Microspheres:
• xMAP Antibody Coupling (AbC) Kit – contains all of the reagents
necessary to covalently couple antibodies to Luminex MagPlex
Microspheres (beads) in approximately three hours. Does not include
microspheres or labeling reagent. [Catalog Number 40-50016]
• MagPlex®-TAG™ Microspheres – magnetic microspheres pre-coupled
with unique 24-base DNA sequences (‘anti-TAGs’) to allow incorporation
of complementary ‘TAG’ sequences into custom oligonucleotide targets
for hybridization capture. [Catalog Number MTAG-XXXX]
• LumAvidin® Microspheres – xMAP Microspheres pre-coupled with
avidin to allow simple non-covalent binding of biotinylated targets such
as peptides. Non-magnetic [Catalog Number L100-LXXX]
A number of factors affect the coupling chemistry. Some common additives to proteins
and buffers can interfere with the coupling reaction, including amine-containing
compounds such as Tris, BSA, or azide. In addition, glycerol, urea, imidazole and some
detergents may also interfere with coupling chemistry. Any of these compounds should
always be removed from the protein, peptide or oligonucleotide as purified materials
are most commonly used.
Common antibody purification methods include Protein A-, Protein G-, ion
exchange-, size exclusion- and analyte-specific affinity chromatography. Affinity
purification is the method of choice as it reduces nonspecific immunoglobulins
and other interfering molecules. In some cases where interfering substances
cannot be removed, such as detergents or urea, a sufficient dilution of the agent
to be coupled can be performed to improve coupling efficiency. Oligonucleotide
purification methods are typically desalting or HPLC purifications.
The carbodiimide coupling reaction is most efficient at low pH level (i.e., pH 5–6);
however, for proteins sensitive to lower pH conditions, coupling reactions may be
carried out at higher pH to ensure stability and functional conformation of the protein.
Oligonucleotide coupling performs best at pH 4.5.
Monoclonal antibodies should be used for capturing the analyte to the
microsphere surface to achieve best sensitivity and specificity. If a polyclonal
antibody is used for capture, it should be monospecific and affinity-purified. The
optimal amount of capture reagent may vary depending on the reagent used and
should be titrated. For antibodies, 5 μg of antibody per 1 million microspheres
performs well. For antigens, the amount will vary depending on the size and
composition of the antigen being coupled.
Chapter 3.3 | Microsphere Coupling
www.luminexcorp.com | Page 12
BR_574.01_0613
Chapter 3.3.1
Antibody and Protein Coupling
General guidelines for antibody coupling to xMAP® Microspheres
Luminex® has made coupling of antibodies or other proteins easy with the
xMAP Antibody Coupling (AbC) Kit, containing all of the reagents necessary
to covalently couple antibodies (or other proteins) to Luminex MagPlex®
Microspheres (“beads”) in approximately three hours. Alternatively, LumAvidin®
Microspheres are xMAP Microspheres pre-coupled with avidin to allow simple
(non-covalent) binding of biotinylated targets such as peptides without having to
chemically couple the reagents.
For users wishing to couple xMAP Microspheres with antibodies or other proteins
without the xMAP Antibody Coupling (AbC) Kit, below is a standard coupling
protocol for 5 million MagPlex Microspheres. Coupled microsphere stability
depends on the stability of the coupled protein but when properly stored, coupled
microspheres are usually stable for more than 1 year.
Summary of Protocol
Add microspheres
to reaction tube
Wash microspheres
with water
Add monobasic
sodium phophate,
sulfo-NHS and
EDC solutions
Incubate for 20
minutes
Wash microspheres
with MES
Add antibody or
protein
Incubate for 2 hr
Wash and resuspend microspheres
with PBS-TBN
Chapter 3.3.1 | Antibody and Protein Coupling
www.luminexcorp.com | Page 13
BR_574.01_0613
Materials Needed:
Reagents and Consumables
Vendor
MagPlex® Microspheres
Luminex
Antibody/Protein to be coupled
Any suitable source
1-Ethyl-3-[3-dimethylaminopropyl]carbodiimide hydrochloride (EDC)
Pierce 77149
Sulfo-NHS
Pierce 24510 (500 mg)
or 24520 (8 x 2 mg,
No-Weigh Format)
Activation Buffer 1 (0.1 M NaH2PO4, pH 6.2)
Sigma S3139
Coupling Buffer 2 (50 mM MES, pH 5.0)
Sigma M2933
Assay/Wash Buffer (PBS, 1% BSA)
Sigma P3688
Phosphate buffered saline (PBS), pH 7.4
Sigma P3813
Sigma P3563
PBS-BN buffer4
Sigma P3688
PBS–TBN buffer4,5
Sigma P3813
Sigma A7888
Sigma P9416
1.5 mL microcentrifuge tubes
USA Scientific 1415-2500
or Eppendorf Lo Bind
022431081
Disposable pipettes tips
Any suitable brand
Distilled deionized water (ddH2O)
Any suitable source
3
For complete equipment and
materials list see Appendix B
1. Activation can be performed in 50 mM MES, pH 6.0–6.2, with similar results.
2.Coupling can be performed in 100 mM MES, pH 6.0, with similar results. For some proteins, better
solubility and better coupling may be achieved at a higher coupling pH.
3.Alternative coupling buffer for proteins that do not couple well at pH 5–6.
4.Also used as assay buffer.
5.Also used as wash buffer.
Protocol 3.3.1 (antibody coupling)
1. Resuspend the stock uncoupled microsphere suspension according to the
instructions described in the Product Information Sheet provided with your
microspheres.
2. Transfer 5.0 x 10⁶ of the stock microspheres to a recommended
microcentrifuge tube.
3. Place the tube into a magnetic separator and allow separation to occur for
30 to 60 seconds.
4. With the tube still positioned in the magnetic separator, remove the
supernatant. Take care not to disturb the microspheres.
5. Remove the tube from the magnetic separator and resuspend the
microspheres in 100 μL dH2O by vortex and sonication for approximately
20 seconds.
6. Place the tube into a magnetic separator and allow separation to occur for
30 to 60 seconds.
7. With the tube still positioned in the magnetic separator, remove the
supernatant. Take care not to disturb the microspheres.
Chapter 3.3.1 | Antibody and Protein Coupling
Note: Microspheres should be
protected from prolonged exposure to
light throughout this procedure.
www.luminexcorp.com | Page 14
BR_574.01_0613
8. Remove the tube from the magnetic separator and resuspend the washed
microspheres in 80 μL 100 mM Monobasic Sodium Phosphate, pH 6.2 by
vortex and sonication for approximately 20 seconds.
9. Add 10 μL of 50 mg/mL Sulfo-NHS (diluted in dH20) to the microspheres and
mix gently by vortex.
10. Add 10 μL of 50 mg/mL EDC (diluted in dH20) to the microspheres and mix
gently by vortex.
11. Incubate for 20 minutes at room temperature with gentle mixing by vortex at
10 minute intervals.
12. Place the tube into a magnetic separator and allow separation to occur for
30 to 60 seconds.
13. With the tube still positioned in the magnetic separator, remove the
supernatant. Take care not to disturb the microspheres.
14. Remove the tube from the magnetic separator and resuspend the
microspheres in 250 μL of 50 mM MES, pH 5.0 by vortex and sonication for
approximately 20 seconds. See Technical Note 2.
15. Repeat steps 13 and 14 for a total of two washes with 50 mM MES, pH 5.0.
16. Remove the tube from the magnetic separator and resuspend the activated
and washed microspheres in 100 μL of 50 mM MES, pH 5.0 by vortex and
sonication for approximately 20 seconds.
17. Add 125, 25, 5 or 1 μg protein to the resuspended microspheres. (Note: We
recommend titration in the 1 to 125 μg range to determine the optimal amount of
protein per specific coupling reaction.)
18. Bring total volume to 500 μL with 50 mM MES, pH 5.0.
19. Mix coupling reaction by vortex.
20.Incubate for 2 hours with mixing (by rotation) at room temperature.
21. Place the tube into a magnetic separator and allow separation to occur for
30 to 60 seconds.
22.With the tube still positioned in the magnetic separator, remove the
supernatant. Take care not to disturb the microspheres.
23.Remove the tube from the magnetic separator and resuspend the
coupled microspheres in 500 μL of PBS-TBN by vortex and sonication for
approximately 20 seconds.
24.Optional – Incubate for 30 minutes with mixing (by rotation) at room
temperature. (Note: Perform this step when using the microspheres the same
day.)
25.Place the tube into a magnetic separator and allow separation to occur for
30 to 60 seconds.
26.With the tube still positioned in the magnetic separator, remove the
supernatant. Take care not to disturb the microspheres.
27. Remove the tube from the magnetic separator and resuspend the
microspheres in 1 mL of PBS-TBN by vortex and sonication for approximately
20 seconds.
28.Repeat steps 25. and 26. This is a total of two washes with 1 mL PBS-TBN.
29.Remove the tube from the magnetic separator and resuspend the coupled and
washed microspheres in 250-1000 μL of PBS-TBN.
30.Count the number of microspheres recovered after the coupling reaction using
a cell counter or hemacytometer.
31. Store coupled microspheres refrigerated at 2-8°C in the dark.
Follow this coupling procedure with Coupling Confirmation (section 3.3.2).
Chapter 3.3.1 | Antibody and Protein Coupling
Simplify your Reagent
Ordering
xMAP Antibody Coupling
(AbC) Kit – The xMAP
Antibody Coupling Kit
contains all of the necessary
reagents and consumables
needed to couple antibodies
to MagPlex Microspheres;
and an easy to use protocol.
[Catalog Number 4050016]
Luminex Magnetic Tube
Separator – If coupling
only a few bead sets at
a time, try the Luminex
Magnetic Tube Separator. A
convenient tool for washing
beads one 1.5mL vial at a
time. [Catalog Number CN0288-01]
Note: When counting on a
hemacytometer use the following
calculation: Total microspheres =
count (1 corner of 4 x 4 section) x (1 x
104) x (dilution factor) x (resuspension
volume in mL)
www.luminexcorp.com | Page 15
BR_574.01_0613
Chapter 3.3.2
Antibody Coupling Confirmation
Once antibodies have been coupled to xMAP® Microspheres (“beads”), it is
strongly recommended to assess coupling efficiency before proceeding to assay
development. The coupled microspheres can be reacted with phycoerythrin (PE)labeled anti-species antibody and analyzed on a Luminex® instrument. Alternatively,
target antigen may be biotinylated and subsequently labeled with streptavidin-Rphycoerythrin (SAPE). Proteins are typically coupled in random orientation as they
have many lysine groups available for coupling. Functional testing is also critical
during assay development. Examples of coupling confirmation can be found in de
Jager et al. 2003. (see reference on page 19).
Summary of Protocol
Add microspheres to
reaction tube
Add detection antibody
Wash and resuspend
microspheres with
Assay Buffer (2x)
Read 50-75 μL on
Luminex analyzer
Incubate for
30 minutes
Materials Needed:
Reagents and Consumables
Vendor
MagPlex® Microspheres (antibody-coupled)
Assay/Wash Buffer (PBS, 1% BSA)
Sigma P3688
PBS-BN buffer
Sigma P3813
Sigma A7888
Sigma P9416
1
PBS–TBN buffer1,2
Sigma P3813
96 well plate
See Appendix B
PE or Biotin labeled anti-species detection Antibody
Any suitable source
streptavidin-R-phycoerythrin (SAPE)
Moss SAPE-001G75,
Life Technologies S-866 or
equivalent
1.5 mL microcentrifuge tubes
USA Scientific 1415-2500
or Eppendorf Lo Bind
022431081
Disposable pipettes tips
Any suitable brand
Distilled deionized water (ddH2O)
Any suitable source
For complete equipment and
materials list see Appendix B
1. Also used as assay buffer.
2.Also used as wash buffer.
Chapter 3.3.2 | Antibody Coupling Confirmation
www.luminexcorp.com | Page 16
BR_574.01_0613
A protocol for verifying antibody coupling is provided below. A dose response
increase in MFI should be observed as concentration of labeled detection antibody
increases. In general, an antibody coupling should yield at least 10,000 MFI (at
standard PMT setting or on MAGPIX® instrument) at saturation for optimal use
in immunoassays.
Protocol 3.3.2 (antibody coupling confirmation)
1. Select the appropriate antibody-coupled microsphere set or sets.
2. Resuspend the microspheres by vortex and sonication for approximately
20 seconds.
3. Prepare a working microsphere solution by diluting the coupled microsphere
stocks to a final concentration of 50 beads/μL in Assay Buffer.
4. Prepare a solution of phycoerythrin-labeled anti-species IgG detection
antibody at 4 μg/mL in Assay Buffer. Prepare a 1:2 dilution series of that
detection antibody solution to a concentration of 0.0625 μg/mL as shown in
the following table.
Dilution
Tube
Volume of PBS-1%
BSA
Volume of Detection
Antibody
Concentration
1:1
-
-
4 μg/mL
1:2
500 μL
500 μL from Tube 1:1
2 μg/mL
1:4
500 μL
500 μL from Tube 1:2
1 μg/mL
1:8
500 μL
500 μL from Tube 1:4
0.5 μg/mL
1:16
500 μL
500 μL from Tube 1:8
0.25 μg/mL
1:32
500 μL
500 μL from Tube 1:16
0.125 μg/mL
1:64
500 μL
500 μL from Tube 1:32
0.0625 μg/mL
Note: Microspheres should be
protected from prolonged exposure to
light throughout this procedure.
Note: 50 μL per well of the
microsphere solution is required for
each reaction (16 wells = 800 μL)
5. Aliquot 50 μL of the microsphere solution prepared in Step 3 into each well in
two columns of the 96-well plate (16 wells total).
6. Add 50 μL of Assay Buffer, as a blank sample, into the wells in A1 and A2
containing the microsphere solution.
7. Add 50 μL of each of the diluted detection antibody solutions prepared in Step
4 into the appropriate wells (as shown in the plate layout below).
1
2
A
Blank
Blank
B
1:64
1:64
C
1:32
1:32
D
1:16
1:16
E
1:8
1:8
F
1:4
1:4
G
1:2
1:2
H
1:1
1:1
3
4
5
6
7
8
9
10
11
12
(Example of plate layout using columns 1 & 2)
8. Mix the reactions gently by pipetting up and down several times with a
pipettor.
9. Cover the plate and incubate for 30 minutes at room temperature on a plate
shaker.
Chapter 3.3.2 | Antibody Coupling Confirmation
www.luminexcorp.com | Page 17
BR_574.01_0613
10. Clip the plate in place on the Luminex Magnetic Plate Separator and rapidly
and forcefully invert over a biohazard receptacle to evacuate the liquid from
the wells.
NOTE: For information on the MagPlex Manual Wash Method, please visit:
http://www.luminexcorp.com/Products/ReagentsMicrospheres/
MagneticSeparators/.
11. Wash each well with 100 μL of Assay Buffer by gently pipetting up and down
several times with a pipettor, and remove the liquid by using the procedure
described in the previous step.
12. Repeat step 11 for a total of 2 washes.
13. Resuspend the microspheres in 100 μL of Assay Buffer by gently pipetting up
and down several times with a pipettor.
14. Analyze 50-75 μL on the Luminex analyzer according to the system manual.
An example of typical results is shown below.
Figure 5.
Figure 5 – Plot of typical results for
anti-species IgG-PE conjugate titration
Antibody Coupling Confirmation
of antibody-coupled microspheres, as
14000
measured by a Luminex analyzer.
Median Fluorescence
12000
10000
8000
6000
4000
2000
0
0
1
2
3
4
5
Anti-Species IgG - PE conjugate (ug/ml)
Antibody coupling references
• de Jager, W., te Velthuis, H., Prakken, B. J., Kuis, W., and Rijkers, G. T.
“Simultaneous detection of 15 human cytokines in a single sample of stimulated
peripheral blood mononuclear cells.” Clin Diagn Lab Immunol 2003; 10:133-9.
• Giavedoni, L. D. “Simultaneous detection of multiple cytokines and chemokines
from nonhuman primates using Luminex technology.” J Immunol Methods 2005;
301:89-101.
• Lawson, S., Lunney, J., Zuckermann, F., Osorio, F., Nelson, E., Welbon, C.,
Clement, T., Fang, Y., Wong, S., Kulas, K., and Christopher-Hennings, J.
“Development of an 8-plex Luminex assay to detect swine cytokines for
vaccine development: Assessment of immunity after porcine reproductive and
respiratory syndrome virus (PRRSV) vaccination.” Vaccine 2010; 28:5356-64.
Chapter 3.3.2 | Antibody Coupling Confirmation
www.luminexcorp.com | Page 18
BR_574.01_0613
Chapter 3.3.3
Nucleic Acid Coupling
General guidelines for nucleic acid coupling to xMAP®
Microspheres
Coupling of oligonucleotides (oligos) to xMAP Microspheres (“beads”) is a
straightforward process but does require a number of optimization steps to ensure
best results in a multiplex assay. Luminex® supports custom oligo coupling, but
has also innovated a pre-coupled, pre-optimized, universal microsphere set that
circumvents the need for assay developers to couple oligos to beads. MagPlex®TAG™ Microspheres are magnetic microspheres pre-coupled with unique 24-base
DNA sequences (‘anti-TAGs’) to allow incorporation of complementary ‘TAG’
sequences into custom oligonucleotide targets for hybridization capture.
Figure 6.
Figure 7– MagPlex-TAG Microspheres are
pre-coupled with anti-TAG sequences,
1
(anti-TAG 1)
(anti-TAG 3)
1
allowing the user to incorporate TAG tails
into assay reactions to facilitate bead
capture without the need to chemically
couple oligos.
G
(TA
2
3)
2)
3
1)
AG
(T
2
(anti-TAG 2)
(TA
G
3
For users wishing to couple custom oligonucleotide sequences to xMAP
Microspheres themselves, below is a standard protocol. It is recommended to
use oligonucleotides synthesized with a 12-carbon amine containing group on the
5’ end. Having this spacer insures that the coupled oligo is raised off of the bead
surface to facilitate interaction with the target and reporter molecules it needs to
capture in an assay.
Below is a standard coupling protocol for 5 million MagPlex® Microspheres.
Coupled microsphere stability depends on the stability of the coupled nucleic acid
but when properly stored, coupled microspheres are usually stable for more than
1 year. The protocol for coupling amine-modified oligos to beads only takes a few
hours and can be scaled up when the optimum ratio of beads to oligo preparation
has been determined.
Chapter 3.3.3 | Nucleic Acid Coupling
www.luminexcorp.com | Page 19
BR_574.01_0613
Summary of Protocol
Add microspheres
to reaction tube
Wash microspheres
with MES buffer
Add
oligonucleotide
Add EDC solution
Incubate for
30 minutes
Add 2nd EDC
solution
Incubate for
30 minutes
Add Tween-20
buffer
Wash microspheres with SDS buffer and
resuspend microspheres w/ TE buffer
Materials Needed:
Reagents and Consumables
Vendor
MagPlex® Microspheres
Luminex
5’ amine C-12 spacer Oligonucleotides (Special order)
IDT or other vendor
0.1 M MES Buffer pH 4.5
Sigma M2933
0.02% Tween-20
Sigma P9416
1-Ethyl-3-[3-dimethylaminopropyl]carbodiimide hydrochloride (EDC)
Pierce 77149
TE Buffer pH 8.0
Sigma T9285
0.1% SDS
Sigma L4522
RNase/DNase-Free Microcentrifuge Tubes 1.5 mL
USA Scientific 1415-2500
or Eppendorf Lo Bind
022431081
Disposable pipette tips; multi- and single-channel (2-1000 mL)
Any suitable brand
Barrier pipettes tips
Any suitable brand
Distilled deionized H2O (ddH2O) - molecular grade
Any suitable source
Chapter 3.3.3 | Nucleic Acid Coupling
For complete equipment and
materials list see Appendix B
www.luminexcorp.com | Page 20
BR_574.01_0613
Protocol 3.3.3 (nucleic acid coupling)
1. Bring a fresh aliquot of -20°C, desiccated Pierce EDC powder to room
temperature.
2. Resuspend the amine-substituted oligonucleotide (“probe” or “capture” oligo)
to 1 mM (1 nanomole/μL) in dH2O.
3. Resuspend the stock uncoupled microspheres by vortexing and sonication
according to the instructions described in the Product Information Sheet
provided with your microspheres.
4. Transfer 5.0 x 10⁶ of the stock microspheres to a USA Scientific
microcentrifuge tube.
5. Pellet the stock microspheres with a tube magnet or by microcentrifugation at
≥ 8000 x g for 1-2 minutes.
6. Remove the supernatant and resuspend the pelleted microspheres in 50 μL of
0.1 M MES, pH 4.5 by vortexing and sonication for approximately 20 seconds.
7. Prepare a 1:10 dilution of the 1 mM capture oligo in dH2O (0.1 nanomole/μL).
8. Add 2 μL (0.2 nanomole) of the 1:10 diluted capture oligo to the resuspended
microspheres and mix by vortex.
9. Prepare a fresh solution of 10 mg/mL EDC in dH2O.
10. One by one for each coupling reaction, add 2.5 μL of fresh 10 mg/mL EDC to
the microspheres (25 μg or ≅ [0.5 μg/μL]final) and mix by vortex.
11. Incubate for 30 minutes at room temperature in the dark.
12. Prepare a second fresh solution of 10 mg/mL EDC in dH2O.
13. One by one for each coupling reaction, add 2.5 μL of fresh 10 mg/mL EDC to
the microspheres and mix by vortex.
14. Incubate for 30 minutes at room temperature in the dark.
15. Add 1.0 mL of 0.02% Tween-20 to the coupled microspheres.
16. Pellet the coupled microspheres with a tube magnet or by microcentrifugation
at ≥ 8000 x g for 1-2 minutes.
17. Remove the supernatant and resuspend the coupled microspheres in 1.0 mL of
0.1% SDS by vortex.
18. Pellet the coupled microspheres with a tube magnet or by microcentrifugation
at ≥ 8000 x g for 1-2 minutes.
19. Remove the supernatant and resuspend the coupled microspheres in 100 μL of
TE, pH 8.0 by vortex and sonication for approximately 20 seconds.
20.Enumerate the coupled microspheres by hemacytometer or other particle/cell
counter.
21. Store coupled microspheres refrigerated at 2-8°C in the dark.
Chapter 3.3.3 | Nucleic Acid Coupling
Note: Microspheres should be
protected from prolonged exposure to
light throughout this procedure.
Note: See Recommendations for
Scaling Oligonucleotide-Microsphere
Coupling in next section.
Note: We recommend using a fresh
aliquot of EDC powder for each EDC
addition.
Note: If using a hemacytometer
proceed as follows:
a. Dilute the resuspended, coupled
microspheres 1:100 in dH20.
b. Mix thoroughly by vortexing.
c. Transfer 10 μL to the
hemacytometer.
d. Count the microspheres within
the 4 large corners of the
hemacytometer grid.
e. Microspheres/μL = (Sum of
microspheres in 4 large corners) x
2.5 x 100 (dilution factor).
f. Note: maximum is 50,000
microspheres/μL.
www.luminexcorp.com | Page 21
BR_574.01_0613
Chapter 3.3.4
Oligonucleotide Coupling Confirmation
Once oligonucleotides have been coupled to xMAP® Microspheres (“beads”), it is
strongly recommended to assess coupling efficiency before proceeding to assay
development. The coupled microspheres can be reacted with biotinylated target
oligonucleotide, labeled with streptavidin-R-phycoerythrin (SAPE) and analyzed on
a Luminex® instrument (followed by SAPE labeling).
To determine the optimum amount of oligo that provides the highest signal
several coupling reactions at different oligo concentrations should be carried out.
Beads from each coupling reaction can then be hybridized with a complementary
biotin labeled oligonucleotide (5 to 200 fmols) to analyze coupling efficiency and
signal optimization. We recommend purchasing sequence-specific 5’ biotinylated
complementary oligos for each capture sequence as the most reliable method,
since precise amounts of probe with a single biotin group can be used in the
hybridization reaction.
The following protocol may be used for confirmation of oligonucleotide coupling
reactions.
Summary of Protocol
Add microspheres to
reaction tube
Add biotinylated oligo
probe
Move to thermal cycler:
96°C for 90 s, 37-60°C
for 15 minutes
Add SAPE
Incubate 37-60°C for
5 min
Read 50 μL on Luminex
analyzer
Chapter 3.3.4 | Oligonucleotide Coupling Confirmation
www.luminexcorp.com | Page 22
BR_574.01_0613
Materials Needed:
Reagents and Consumables
Vendor
MagPlex® Microspheres (oligonucleotide-coupled)
1.5X TMAC Hybridization Solution
See Appendix A
1X TMAC Hybridization Solution
See Appendix A
TE Buffer pH 8.0
Sigma T9285
96 well bead hybridization plate
Corning Costar 6509
Biotin labeled complementary oligonucleotide targets
Any suitable source
streptavidin-R-phycoerythrin (SAPE)
Moss SAPE-001G75, Life
Technologies S-866 or
equivalent
RNase/DNase-Free Microcentrifuge Tubes 1.5 mL
USA Scientific 1415-2500
or Eppendorf Lo Bind
022431081
MicroSeal A
BioRad MSA5001
Brayer roller, soft rubber or silicon
USA Scientific 9127-2940
Disposable pipette tips; multi- and single-channel (2-1000 mL)
Any suitable brand
Distilled deionized H2O (ddH2O) - molecular grade
Any suitable source
For complete equipment and
materials list see Appendix B
Note: Luminex Tm Buffers are
specific for MagPlex®-TAG™ (low
G-C) hybridization reactions. TMAC
buffers are best suited for custom
coupling (typically used for direct
hybridization assays).
A protocol for verifying oligonucleotide coupling is provided below. A dose
response increase in MFI should be observed as concentration of labeled target
oligonucleotide increases. In general, an oligonucleotide coupling should yield
at least 10,000 MFI (standard PMT or MAGPIX) at saturation for optimal use in
hybridization assays.
Protocol 3.3.4 (oligonucleotide coupling confirmation)
1. Select the appropriate individual MagPlex coupled bead sets and resuspend by
vortexing and sonication for 20 seconds each.
2. Dilute/concentrate an aliquot of each to 75 microspheres/μL in 1.5X TMAC
Hybridization Solution. Vortex and sonicate for approximately 20 seconds.
(Note: 33 μL are required for each reaction to give 2,500 beads/reaction.)
3. Add 33 μL of the 75 microspheres/μL aliquot to each well of a bead
hybridization plate as needed for each reaction.
4. Add 17 μL of dH2O to each background well.
5. Add 5 to 20 μL of complementary biotin-oligonucleotide (5 to 200
femtomoles) to appropriate sample wells.
6. Adjust the total volume to 50 μL by adding the appropriate volume of dH2O or
TE to each sample well.
7. Cover the plate with MicroSeal A film to prevent evaporation. Process in a
thermal cycler with the following program.
96°C for 90 seconds
37-60°C for 15 minutes
8. Dilute SAPE to 10 μg/mL in 1X TMAC Hybridization solution. (Note: 25 μL are
required for each reaction.)
9. Add 25 μL of 10 μg/mL SAPE to each well and mix by gently pipetting up and
down several times. (Note: Final concentration of SAPE should be 2-4 μg/mL).
10. Incubate at hybridization temperature for 5 minutes.
11. Analyze 50 μL at hybridization temperature on the Luminex analyzer
according to the system manual.
Chapter 3.3.4 | Oligonucleotide Coupling Confirmation
Note: Microspheres should be
protected from prolonged exposure to
light throughout this procedure.
Note: Coupling confirmation should
be performed at the anticipated assay
hybridization temperature.
www.luminexcorp.com | Page 23
BR_574.01_0613
Figure 7. Typical results of an oligonucleotide coupling reaction
Oligonucleotide Hybridization
20000
Net Median Fluorescence
17500
15000
12500
10000
7500
5000
2000
0
0
25
50
75
100
125
150
175
200
225
fmol Complementary Oligo
Recommendations for Optimization and Troubleshooting
Probe Design Strategy
1. All probes should be exactly the same length per target sequence (using
TMAC hybridization buffer).
2. For detection of point mutations, use probes between 18 and 24 nucleotides in
length. 20 nucleotides is a good starting point.
3. If point mutations (or SNPs) are expected in a sequence they should be
positioned at the center of the probe sequence (i.e., position 10 or 11 for a
20 nucleotide probe). Multiple polymorphisms should be equally spaced
throughout the probe sequence.
Point mutations may be positioned off-center if necessary to prevent
secondary structure in probe sequence. Usually, adequate specificity can
be achieved if a point mutation is at nucleotide position 8-14 in a 19 or 20
nucleotide probe.
4. Probes should be synthesized for all sequence variants (all mutant and
wild type sequences) and should be from the same DNA strand (per target
sequence).
5. For unrelated sequences, probes may be lengthened. Better sensitivity may be
achieved with longer probes (50 or 70 nucleotides).
6. Probes must have a primary amino group for coupling to the carboxyl group on
the microsphere. We suggest synthesizing the oligonucleotide with a 5’ aminespacer (See 7.).
7. Probes must have a spacer between the reacting amine and the hybridizing
sequence. We recommend synthesizing capture probes with 5’ Amino
Modifier C12 or 5’ Uni-Link Amino Modifier.
Chapter 3.3.4 | Oligonucleotide Coupling Confirmation
www.luminexcorp.com | Page 24
BR_574.01_0613
Tips, Important Points & Critical Factors
1. Amine-substituted oligonucleotide probes should be resuspended and diluted
in dH20. Tris, azide or other amine-containing buffers must not be present
during the coupling procedure. If oligonucleotides were previously solubilized
in an amine-containing buffer, desalting by column or precipitation and
resuspension into dH2O is required.
2. We recommend using EDC from Pierce for best results. EDC is labile in the
presence of water. The active species is hydrolyzed in aqueous solutions at
a rate constant of just a few seconds, so care should be taken to minimize
exposure to air and moisture. EDC should be stored desiccated at -20°C in
dry, single-use aliquots with secure closures. A fresh aliquot of EDC powder
should be used for each coupling episode. Allow the dry aliquot to warm to
room temperature before opening. Prepare a fresh 10 mg/mL EDC solution
immediately before each of the two additions, and close the dry aliquot tightly
and return to desiccant between preparations. The dry aliquot should be
discarded after the second addition.
3. Uncoupled microspheres tend to be somewhat sticky and will adhere to
the walls of most microcentrifuge tubes, resulting in poor post-coupling
microsphere recovery. We have found that copolymer microcentrifuge tubes
from USA Scientific (#1415-2500) perform best for coupling and yield the
highest microsphere recoveries post-coupling.
4. 100 mM MES, pH 4.5 should be filter-sterilized and either prepared fresh or
stored at 4°C between uses. Do not store at room temperature. The pH must
be in the 4.5-4.7 range for optimal coupling efficiency.
5. The optimal amount of a particular oligonucleotide capture probe for coupling
to carboxylated microspheres is determined by coupling various amounts in
the range of 0.04-1 nmol per 5 x 10⁶ microspheres. Usually, 0.2 to 1 nmol per
5 x 10⁶ microspheres in a 50 μL reaction is optimal. The coupling procedure
can be scaled up or down. Above 5 x 10⁶ microspheres, use the minimum
volume required to resuspend the microspheres. Below 5 x 10⁶ microspheres,
maintain the microsphere concentration and scale down the volume
accordingly.
6. We use 5 M TMAC (Tetramethylammonium chloride) solution from Sigma
(T-3411) for preparation of 1.5X and 1X TMAC hybridization solutions. We find
that this TMAC formulation does not have a strong “ammonia” odor. TMAC
hybridization solutions should be stored at room temperature to prevent
precipitation of the Sarkosyl. TMAC hybridization solutions can be warmed to
hybridization temperature to re-solubilize precipitated Sarkosyl.
7. Denaturation and hybridization can be performed in a thermal cycler. Use
a heated lid and a spacer (if necessary) to prevent evaporation. Maintain
hybridization temperature throughout the labeling and analysis steps.
8. The hybridization kinetics and thermodynamic affinities of matched and
mismatched sequences can be driven in a concentration-dependent manner.
At concentrations beyond the saturation level, the hybridization efficiency
can decrease presumably due to competition of the complementary strand
and renaturation of the PCR product. Therefore, it is important to determine
the range of target concentrations that yield efficient hybridization without
sacrificing discrimination.
9. Whether it is necessary to remove the hybridization supernatant before
the labeling step is depend on the amount of biotinylated PCR primers and
unhybridized biotinylated PCR products that are present and available to compete
with the hybridized biotinylated PCR product for binding to the SAPE reporter.
Chapter 3.3.4 | Oligonucleotide Coupling Confirmation
www.luminexcorp.com | Page 25
BR_574.01_0613
Oligonucleotide coupling optimization
It is recommended that you check the efficiency of each coupling with a range of
biotinylated complementary oligonucleotide concentrations. For example, if you
coupled xMAP Microsphere #1 to 4 different amounts of oligo #1 (ranging from
0.04 nmol to 5.0 nmol), each of these couplings should be hybridized with several
amounts of biotinylated complementary oligonucleotide target as shown below:
5 fmols labeled
complementary target
25 fmols labeled
complementary target
50 fmols labeled
complementary target
100 fmols labeled
complementary target
Bead 1- no oligo #1
Bead 1- no oligo #1
Bead 1- no oligo #1
Bead 1- no oligo #1
Bead 1- 0.04nmol oligo #1
Bead 1- 0.04nmol oligo #1
Bead 1- 0.04nmol oligo #1
Bead 1- 0.04nmol oligo #1
Bead 1- 0.20 nmol oligo #1
Bead 1- 0.20 nmol oligo #1
Bead 1- 0.20 nmol oligo #1
Bead 1- 0.20 nmol oligo #1
Bead 1- 1.00 nmol oligo #1
Bead 1- 1.00 nmol oligo #1
Bead 1- 1.00 nmol oligo #1
Bead 1- 1.00 nmol oligo #1
Bead 1- 5.00 nmol oligo #1
Bead 1- 5.00 nmol oligo #1
Bead 1- 5.00 nmol oligo #1
Bead 1- 5.00 nmol oligo #1
H2O background (no beads)
H2O background (no beads)
H2O background (no beads)
H2O background (no beads)
Figure 8.
Figure 8 – Plot of experimental results for
oligo coupling, as measured by a Luminex
10 fmol Oligo Target
analyzer. Results show that 0.2 nmol for
2000
a 5 million microsphere coupling yielded
Net MFI
1500
highest MFI values. Optimal amount
1000
for typical coupling is usually 0.2 to 1
500
nanomole per 5 million microspheres.
0
0.01
0.1
nmol Probe
1
10
1
10
PCR Target
2000
Net MFI
1500
1000
500
0
0.01
0.1
nmol Probe
Chapter 3.3.4 | Oligonucleotide Coupling Confirmation
www.luminexcorp.com | Page 26
BR_574.01_0613
To determine the optimum ratio for scaled up or for smaller coupling reactions,
use the following table as a guide for adjusting the amount of reagents used in the
coupling reactions:
Recommendations for Scaling Oligonucleotide-Microsphere Coupling
Number of
Microspheres
Reaction
Volume
Probe Inputa EDC
Concentrationb
Tween-20
Wash Volume
SDS Wash
Volume
Final Volumec
1 x 10⁶
10 μL
0.04-0.1 nmol
0.5-2.5 mg/mL
0.5 mL
0.5 mL
20 μL
25 μL
0.1-0.2 nmol
0.5-1 mg/mL
0.5 mL
0.5 mL
50 μL
50 μL
0.2-1 nmol
0.5-1 mg/mL
1.0 mL
1.0 mL
100 μL
2.5 x 10
5 x 10
6
6
50 μL
0.5-1 nmol
0.5-1 mg/mL
1.0 mL
1.0 mL
200 μL
50 x 106
50-100 μL
1-4 nmol
0.5-1 mg/mL
1.0 mL
1.0 mL
1000 μL
100 x 106
100 μL
1-4 nmol
0.5-1 mg/mL
1.0 mL
1.0 mL
2000 μL
10 x 10
6
a We recommend titrating the probe input to optimize coupling for the particular application.
b EDC input was not adjusted for reactions containing less than 5x10⁶ microspheres.
c Resuspension volume of TE, pH 8.0 for 50,000 microspheres/μL assuming 100% recovery.
Oligonucleotide coupling references
• Deshpande, A., J. Nolan, P. White, Y. Valdez, W. Hunt, C. Peyton and C.
Wheeler (2005). “TNF-α promoter polymorphisms and susceptibility to
humanpapillomavirus 16-associated cervical cancer.” Journal Of Infectious
Diseases 191(6): 969-976.
• Ros-Garcia, A., R. A. Juste and A. Hurtado (2012). “A highly sensitive DNA beadbased suspension array for the detection and species identification of bovine
piroplasms.” International Journal For Parasitology 42(2): 207 - 214.
• Sun, K., X. F. Chen, X. B. Zhu, H. L. Hu, W. Zhang, F. M. Shao, P. Li, Q. L. Miao, Y.
R. Huang and Z. Li (2012). “A New Molecular Diagnostic Approach to Assess Y
Chromosome Microdeletions in Infertile Men.” Journal of International Medical
Research 40(1): 237 - 248.
• Taniuchi, M., C. C. Walters, J. Gratz, A. Maro, H. Kumburu, O. Serichantalergs, O.
Sethabutr, L. Bodhidatta, G. Kibiki, D. M. Toney, L. Berkeley, J. P. Nataro and E. R.
Houpt (2012). “Development of a multiplex polymerase chain reaction assay for
diarrheagenic Escherichia coli and Shigella spp. and its evaluation on colonies,
culture broths, and stool.” Diagnostic Microbiology and Infectious Disease 73(2 ):
121 - 128.
Chapter 3.3.4 | Oligonucleotide Coupling Confirmation
www.luminexcorp.com | Page 27
BR_574.01_0613
Chapter 3.4
Optimization of Multiplex
Once the best antibody pairs or nucleic acid reagent ratios are determined for
each analyte, assays should be combined into a multiplex and checked for crossreactivity at each step. The multiplexed coupled microsphere (“bead”) set should
be tested with each individual analyte and detection antibody or oligonucleotide
target to evaluate performance and determine specificity. Factors such as specific
cross-reactivity among individual assays, non-specific binding of other reagent
components, or interference of sensitivity due to excess non-bound reagents may
affect your multiplex assay.
Chapter 3.4 | Optimization of Multiplex
www.luminexcorp.com | Page 28
BR_574.01_0613
Chapter 3.4.1
Optimization of Immunoassays
The first steps in optimizing an assay are to ensure that the optimum amount of
capture molecule is bound to the microsphere (“bead”) and that capture reagent
pairs allow maximum binding and detection capacity. For capture sandwich
immunoassays, it is important to confirm that the pair of antibodies used bind to
different epitopes.
One advantage of multiplexing is that it can facilitate the screening of candidate
capture and detection reagents. For example, several different potential capture
antibodies for a particular analyte can each be coupled to a different microsphere
set and then tested in multiplex with the individual candidate detection antibodies
and analytes. This allows rapid identification of the best-performing capture and
detection antibody pair for a particular analyte.
Figure 9.
TIP
High-quality reagents are
particularly important in
multiplex assays, where
contamination by a single
component may affect
results of many assays. When
possible, consider additional
purification or filtration steps
for oligonucleotides, antibodies,
peptides and buffers.
Figure 9 - Determining the best capture
antibody and detection antibody by
pairwise analysis. Using a small test
quantity of antibody and microspheres,
each candidate capture antibody is
coupled to a separate microsphere and
tested with target antigen and multiple
candidate detection antibodies. Because
of xMAP® multiplexing capabilities, the
above 16 reactions can be performed in 4
wells. The best-matched pair can easily be
determined, allowing the greatest assay
sensitivity.
Both polyclonal and monoclonal antibodies can be used for detection, but
monoclonal antibodies should be specific for a different epitope than the capture
antibody or can be used if they are directed to a repeating epitope on the analyte.
Detection antibodies are typically biotinylated to use with streptavidin-Rphycoerythrin (SAPE) as the reporter but detection antibodies may also be directly
conjugated to PE, which eliminates the need for a separate reporter labeling step in
the assay protocol.
Chapter 3.4.1 | Optimization of Immunoassays
www.luminexcorp.com | Page 29
BR_574.01_0613
General Immunoassay Tips
• Run at least 2 background samples.
• Run all samples at least in duplicate if possible whenever sample allows.
• Minimize the presence of detergents in samples. Some antibodies may be
sensitive to detergents, even at low concentrations (e.g., 0.1% SDS).
• Dilute concentrated biological samples 1:5 to overcome matrix (serum) effects
that can interfere with analysis of the microspheres. If samples cannot be
diluted at least 1:5, try using a small initial reaction volume and diluting the
final reaction prior to analysis.
• For Capture Sandwich and Indirect (Serological) immunoassays, 2-4 μg/mL
detection antibody is usually sufficient.
• Up to five-fold more detection antibody may be required for a no-wash assay
format.
• The optimal detection antibody concentration will depend on specific reagents
and level of multiplexing. Concentrations often need to be increased when
increasing the number of multiplexed assays and when converting to a nowash assay format.
• For Competitive Immunoassay format, we recommend testing a range of
competing analyte (0.2 to 5 μg) with increasing concentrations of antibody.
The antibody concentration that yields 70-80% of the maximum signal should
provide the largest linear dynamic range for the assay.
• The reporter concentration should be approximately one and one-half times
the concentration of the detection antibody.
• Use SAPE as your reporter molecule (gives highest signal of all the dyes we
have compared).
• Use either PBS-1%BSA or PBS-TBN as the Assay Buffer.
• When using SAPE at > 8 μg/mL final concentration in a no wash assay, a
dilution or post-labeling wash step may be required to minimize background
fluorescence prior to analysis on the Luminex® instrument.
• Coupling should be allowed to proceed for 2 hours with end-over-end mixing
on a rotator.
• For scaling up to 50-200 million microspheres per coupling reaction, couple in
2 mL using a 15 mL polypropylene centrifuge tube or a 4 mL microcentrifuge
tube. Place tube at a 33-45 degree angle in a tube rack and mix on a plate
rotator for the 2 hour coupling incubation.
• After washing, allow microspheres to block over night in Blocking/Storage
Buffer at 4°C in the dark if possible.
• Too high of an antibody concentration may lead to passive adsorption and can
manifest itself as a very high signal initially, with continued decline over time
as the antibody becomes detached. Additionally cross-reactivity can occur if
beads are stored as a multiplex.
Chapter 3.4.1 | Optimization of Immunoassays
www.luminexcorp.com | Page 30
BR_574.01_0613
Factors affecting multiplex assays
Assay dynamic range, cross-reactivity and biological matrix are factors that need
to be uniquely and specifically addressed in multiplex assays in order to ensure
optimal results. Understanding the biological range of each analyte, the binding
specificity of assay reagents and the unique makeup of your sample (plasma,
culture media, urine, etc.) allows you to develop the most effective multiplex assay.
Assay conditions, such as buffer system, blocking agents, sample volume and
dilution, total reaction volume, number of microspheres per reaction (2000–5000
per region per well), concentration of capture reagent for coupling, detection
antibody and reporter concentration, assay format (washed vs. unwashed), and
incubation times should be optimized to provide best results according to the
specific assay requirements. The final assays performance should be evaluated and
validated with known samples. Concentrated biological samples and samples of a
highly complex nature, such as serum, plasma, or tissue lysates, should be diluted
at least 1:5 to prevent interference or microsphere agglutination from matrix
effects. Any reagents that show interference, cross-reactivity, or poor performance
should be replaced.
Optimization of assay performance and meeting requirements for sensitivity,
dynamic range, ease of use, and time to result should be kept in mind when
developing the multiplexed assay. These factors and others are described in more
detail below.
Amount of detection antibody
Multiplexed microspheres should be analyzed with individual analytes and
multiplexed detection antibodies to determine sensitivity and detect interference
between the various detection antibodies. The optimal detection antibody
concentration will vary with the specific reagent and should be determined by
titration (e.g., two-fold serial dilution from 4 to 1 μg/mL), but generally, 2–4 μg/mL is
adequate. Detection antibody concentration may need to be increased in multiplex
as compared to the concentration used in monoplex due to interactions between
various detection antibodies.
In general, as the level of multiplexing increases, the amount needed for each detection
antibody may also increase. In unwashed assay formats, detection antibody concentrations
may need to be increased by up to as much as five-fold to compensate for excess unbound
analyte in the supernatant. Typically, reporter fluorophore (SAPE) concentration should be
one and one-half to two times the concentration of detection antibody.
Final concentrations above 8 μg/mL of SAPE may interfere with the background
subtraction performed by the analyzer and thus may require a post-labeling wash
step.
Chapter 3.4.1 | Optimization of Immunoassays
www.luminexcorp.com | Page 31
BR_574.01_0613
Cross-reactivity
If cross-reactivity between antibodies for different targets is observed, it may be
necessary to replace with other reagents. Selecting other antibodies pre-screened
during coupling optimization steps may be required. Multiplexed assays should be
tested for specificity and cross-reactivity with (see illustration below):
1.individual analytes and corresponding reporter antibodies (to determine if
analytes cross-react with non-target beads)
2.individual analytes and multiplexed detection antibodies (to determine if
reporter antibodies cross-react with non-target analytes)
3.multiplexed analytes and multiplex detection antibodies (to determine
sensitivity and to confirm there is no cross-reactivity or interference in the
complete assay).
Sample cross-reactivity protocol
Figure 10 - 3-plex cytokine assay
Test 1
Figure 10 - Immunoassay cross-reactivity
Test 2
protocol. (Test 1) Test multiplex capture
Test 3
Multiplexed Beads
Multiplexed Beads
34
34
34
73
73
73
77
77
77
beads with 3 separate titrations of IL-4,
Multiplexed Beads
IL-6 and IL-8 using appropriate monoplex
reporter antibody for each titration. (Test
2) Test multiplex capture beads with 3
separate titrations of IL-4, IL-6 and IL-8
using multiplexed reporter antibodies.
(Test 3) Test multiplex capture beads with
IL-4
IL-6
IL-8
IL-4
IL-6
IL-8
IL-4
IL-6
IL-8
Multiplexed Analytes
Detection
IL-4
Detection
IL-6
Detection
IL-8
IL-4
Multiplexed Detection
IL-6
IL-8
IL-4
Multiplexed Detection
IL-6
IL-8
multiplex titration of IL-4, IL-6 and IL-8
with multiplex reporter antibodies (i.e.,
the full multiplex reaction)
Test 1 is for individual analytes and corresponding reporter antibodies to determine
if analytes cross-react with non-target beads. Test 2 is for individual analytes and
multiplexed detection antibodies to determine if reporter antibodies cross-react
with non-target analytes. Test 3 is for multiplexed analytes and multiplex detection
antibodies to determine sensitivity and to confirm there is no cross-reactivity in
the complete assay. Each test should be run as a standard curve with a blank and
7 concentrations of analyte as shown in the dilution table below:
Chapter 3.4.1 | Optimization of Immunoassays
www.luminexcorp.com | Page 32
BR_574.01_0613
Three-Fold Serial Dilution of Individual and Multiplexed Cytokines
Tube
IL-4 (pg/ml)
IL-6 (pg/ml)
IL-8 (pg/ml)
IL-4, IL-6, IL-8 (pg/ml)
1
10,000
10,000
10,000
10,000
2
3333.3
3333.3
3333.3
3333.3
3
1111.1
1111.1
1111.1
1111.1
4
370.4
370.4
370.4
370.4
5
123.5
123.5
123.5
123.5
6
41.2
41.2
41.2
41.2
7
13.7
13.7
13.7
13.7
Replace any reagents that show interference, cross-reactivity, or poor performance
and determine the optimal sample and reaction volumes, microspheres per
reaction (within the range of 2000 - 5000 microspheres per region), incubation
times, detection antibody and reporter concentrations, coupling amount for
capture reagents, and assay format (washed vs. homogeneous), and evaluate the
performance of the optimized assay with test samples.
The assay results below are specific with <1% cross-reactivity among the cytokine
targets. Cross-reactivity was calculated using the median fluorescence intensity
(MFI) of individual and multiplexed detection antibodies and capture antibodycoupled beads in the presence of single antigen at the third highest concentration
in the standard curve.
Target
IL-4
IL-6
IL-8
IL-4, IL-6, IL-8
IL-4
90
-0.3
-0.2
90
IL-6
0
93
-0.4
93
IL-8
0.1
-0.4
98
98
Sensitivity, Limit of Detection, Precision and Linearity
The working assay range will also need to be determined during assay
development. Limit of Blank (LoB), Limit of Detection (LoD), and Limit of
Quantitation (LoQ) are used to determine the smallest concentration of a
measurand that can be reliably measured by an analytical procedure.
• LoD is the lowest analyte concentration likely to be reliably distinguished from
the LoB and at which detection is feasible. LoD is determined by utilizing both
the measured LoB and test replicates of a sample known to contain a low
concentration of analyte.
• LoB is the highest apparent analyte concentration expected to be found when
replicates of a blank sample containing no analyte are tested.
• LoQ is the lowest concentration at which the analyte can not only be reliably
detected but at which some predefined goals for bias and imprecision are
met. The LoQ may be equivalent to the LoD or it could be at a much higher
concentration.
Chapter 3.4.1 | Optimization of Immunoassays
www.luminexcorp.com | Page 33
BR_574.01_0613
Targets
LLoQ
ULoQ
LOD
Intra-assay inter-assay
%CV
%CV
IL-4
3.1
7,394
0.8
5
4
IL-6
3.4
1,958
0.8
6
11
IL-8
24.1
3,066
7
6
4
3-Plex Assay
The assay results (above) are sensitive, accurate and precise. The LLoQ, and
ULoQ values define the working assay range - accuracy (80-120% recovery)
and precision (<10% intra-assay CV). The LoD is defined here as the lowest
measurable concentration obtained at the MFI of 3 replicate wells for 8 standard
points. The inter-assay %CV is measured from the CV of observed concentrations
of 8 standard points for 3 independent assays.
Precision
Intra-assay and inter-assay reproducibility should be determined in sample diluent.
NOTE: Intra/Inter assay CV may vary between site (user) and assay. The following
can be used as guidelines:
Within assay working range:
Intra assay CV < 10% is usually acceptable.
A minimum of 3 separate runs should be performed to determine the
intra-assay precision. The intra-assay precision should be calculated from
a minimum of 2 replicates at each of 2 spiked concentrations.
Inter assay CV < 20% is usually acceptable
A minimum of 5 separate runs should be performed to determine interassay precision.
NOTE: LLoQ may vary between site (user) and target (analyte).
For additional examples, calculations, and information, refer to the following
documents:
• EP17-A: Protocols for Determination of Limits of Detection and Limits of
Quantitation
• MM06-A2: Quantitative Molecular Methods for Infectious Diseases
• Ligand–Binding Assays (Development, Validation, and Implementation in the
Drug Development Arena ) Edited by Masood N. Khan and John W. A. Findlay
(Wiley)
Linearity
A linear relationship should also be evaluated across the assay. The linearity of
dilution provides confidence that the analytes present are within the assay range
can be diluted and accurately for relative quantitation.
Linearity of Sample Dilutions (R2)
Matrix
IL-4
IL-6
IL-8
Plasma
0.9999
0.9999
0.9962
Serum
0.9958
0.9995
0.9986
Cell Cuture
0.9998
0.9996
0.9955
Chapter 3.4.1 | Optimization of Immunoassays
www.luminexcorp.com | Page 34
BR_574.01_0613
The R2 was determined by linear regression analysis of analytes measured in a
3-fold serial dilution of standard ‘spiked’ samples within assay range in 3 matrices.
Binding kinetics and assay sensitivity
Reducing the volume of the initial incubation with microspheres and sample and/
or increasing the initial incubation time may improve the kinetics for analyte
binding, thus improving sensitivity. Though seemingly paradoxical, improved
sensitivity can be sometimes accomplished by decreasing the amount of capture
reagent coupled to the microspheres. While this may result in saturation at lower
analyte concentrations and lower the maximum achievable signal, it may improve
linearity at low concentrations, thus improving the limit of detection (Fig. 11A).
Figure 11 – Dynamic range and assay
Figure 11.
sensitivity may be affected by (A) reducing
the amount of capture antibody on
A
Higher amount of capture antibody
Lower amount of capture antibody
Median Fluorescence
14000
the bead to make lower concentration
14000
range more linear, and (B) by using
different amounts of capture antibody
Linear curve at lower
analyte concentation
0
0
B
1
2
3
[conc]
4
5
0
0
1
2
[conc]
3
4
5
(or antibodies with different affinities) on
multiple bead sets to form a multiplexed
standard curve.
Extended dynamic range with a muliplexed standard curve
Median Fluorescence
14000
Bead 3
Bead 2
Bead 1
0
0
1
2
[conc]
3
4
5
Antibody affinity and sensitivity
Antibodies with higher affinity can also improve sensitivity, both as capture and
detection reagents. Higher signals and extended dynamic range at high analyte
concentrations can be achieved by increasing the amount of capture reagent
coupled to the microspheres. Both high sensitivity and broad dynamic range can
sometimes be achieved through coupling capture antibodies of different affinities
to different microsphere color sets and combining them to create a multiplexed
standard curve (Fig. 11B). The same effect can be accomplished by coupling
different concentrations of the same capture reagent to different microsphere
color sets.
Chapter 3.4.1 | Optimization of Immunoassays
www.luminexcorp.com | Page 35
BR_574.01_0613
Matrix effects
Highly concentrated serum or plasma can lead to ‘matrix effects’ presenting as
poor bead recovery, instrumentation clogging, low signals and variable results.
Matrix effects can play a major role in assay performance and the type of sample
tested may therefore have effects on assay performance. Labs developing
immunoassays should include replicates of samples as well as negative and
positive (low, medium and high) controls with known concentrations of the
analytes of interest to aid in interpretation of results. Dilutions of controls should
be included that reflect the diluents used to reconstitute the standards and the
sample matrix tested, in order to account for possible matrix effects. This will
allow the assessment of linearity and recovery and aid in the choice of best
standard curve regression and optimal calibration. Luminex recommends that
plasma and serum be diluted at least 1:5. If samples cannot be diluted at least
1:5, try using a small initial reaction volume and diluting the final reaction prior to
analysis on the Luminex instrument. In addition, if non-specificity remains after
diluting the serum samples, try adding additional blockers to the assay buffers. If
BSA is not helping or might interfere with the assay, you may opt for other species
albumin (porcine), milk casein, ChemiBLOCKER, etc. or switch to a washed assay
format if using a no-wash.
Washed versus unwashed assays
Conversion of a washed assay to an unwashed assay format can reduce handson time as well as decrease total assay time. To convert to an unwashed
format, sample volume may be decreased and/or detection antibody and SAPE
concentrations are increased to compensate for higher concentrations of unbound
analyte and detection antibody present in the reaction. Increasing the volume of
the detection antibody used as compared to the washed format assay introduces
more detection antibody and dilutes the sample prior to analysis, which may
overcome matrix effects or issues caused by interfering substances. In some cases,
a final post-labeling wash step may be included to reduce background signals and
improve overall assay performance and sensitivity.
Instrument settings and reporter fluorescence
Optimization of assay performance and meeting requirements for sensitivity,
dynamic range, ease of use, and time to result should be kept in mind when
developing the multiplexed assay. To improve sensitivity or increase signal many
factors may be considered, including adjustment of the PMT setting on Luminex®
100/200™ and FLEXMAP 3D® instruments; selection of different vendors or types
of SAPE reporter; and incorporation of dendrimers, rolling circle amplification, or
additional reporter labeling steps.
Chapter 3.4.1 | Optimization of Immunoassays
www.luminexcorp.com | Page 36
BR_574.01_0613
Other reagent optimization
Finally, the fully multiplexed assay is performed to determine sensitivity
and interference when all analytes and reagents are present in the reaction.
Multiplexed assay development can be an iterative process, requiring further
optimization as complex interactions between assay components are observed.
Assay conditions, such as buffer system, blocking agents, sample volume and
dilution, total reaction volume, number of microspheres per reaction (2000–5000
per region per well), concentration of capture reagent for coupling, detection
antibody and reporter concentration, assay format (washed vs. unwashed), and
incubation times, are optimized to provide best results according to the specific
assay requirements, and the performance is evaluated and validated with known
samples. Concentrated biological samples and samples of a highly complex nature,
such as serum, plasma, or tissue lysates, should be diluted at least 1:5 to prevent
interference or microsphere agglutination from matrix effects. Any reagents that
show interference, cross-reactivity, or poor performance should be replaced.
Chapter 3.4.1 | Optimization of Immunoassays
www.luminexcorp.com | Page 37
BR_574.01_0613
Chapter 3.5
Assay Validation
After confirmation of successful coupling and sufficient signal from a multiplex
assay, microspheres (“beads”) should be further tested with standard or control
materials. These are often recombinant proteins as known positive and negative
samples. Protein samples should be prepared in the appropriate sample matrix to
match the composition of the test samples as closely as possible.
Chapter 3.5 | Assay Validation
www.luminexcorp.com | Page 38
BR_574.01_0613
Chapter 3.5.1
Immunoassay Validation
Spike and recovery immunoassay sample validation protocol
Preparing sample/control spike serial dilutions (testing sample linearity)
To test samples for linearity, make serial dilutions of the sample spike and control
spike. If the neat sample has a value greater than 60% of the high standard, test
the sample for natural linearity using the same dilution series described below.
Vortex briefly between each dilution.
1:2 dilution
Add 0.5 mL of sample spike, control spike, or neat sample to 0.5 mL standard
curve diluent.
1:4 dilution
Add 0.5 mL of 1:2 dilution to 0.5 mL standard curve diluent.
1:8 dilution
Add 0.5 mL of 1:4 dilution to 0.5 mL standard curve diluent.
These dilutions will be read off the standard curve to determine if dilutions of
unvalidated samples are parallel to the standard curve and if the values of the
sample dilutions are accurate.
Calculations
1. Spike/Recovery
•
•
•
•
•
•
•
% Recovery = Observed - Neat x 100
Observed = Spiked sample value
Neat = Unspiked sample value
Expected = Amount spiked into sample
Note: The neat sample may read 0 pg/mL.
Recovery should be in the range of 80-120%.
Control spike should have a recovery value within 80-120%. If not, this
indicates there was a problem in preparing the control spike.
2. Linearity
• Use the spiked sample value as the expected value if testing linearity of
the spiked sample.
• Use the neat sample value as the expected value if testing linearity of the
unspiked sample.
• % Recovery (1:2) = Observed value (pg/mL) of 1:2 dilution x 100
• Expected value (pg/mL) divided by 2
• % Recovery (1:4) = Observed value (pg/mL) of 1:4 dilution x 100
• Expected value (pg/mL) divided by 4
• % Recovery (1:8) = Observed value (pg/mL) of 1:8 dilution x 100
• Expected value (pg/mL) divided by 8
Note: Recovery of spiked/
neat samples should be in
the range of 80-120%.
• Diluting the control spike is a good control for serial dilutions. Recovery
for the control spike should be in the range of 80-120%. If not, this
indicates there was a problem in preparing the control spike.
Chapter 3.5.1 | Immunoassay Validation
www.luminexcorp.com | Page 39
BR_574.01_0613
Design of Assay Validation
Typical performance parameters
Limit of Detection
≤1 pg/mL
Precision
Intra-assay CV
Inter-assay CV
< 10%
≤15%
Accuracy (% recovery)
80-120%
Cross-reactivity
< 1%
Working Assay Range
Varies from target-to-target
Matrices
Plasma, serum, culture supernatant, lysates,
other biological fluids
Sample Plate Layout
1
2
3
4
5
6
7
8
9
10
11
12
A
1
1
1
B
B
B
B
B
B
1
1
1
B
2
2
2
B
B
B
B
B
B
2
2
2
C
3
3
3
1
1
1
1
1
1
3
3
3
D
4
4
4
2
2
2
2
2
2
4
4
4
E
5
5
5
3
3
3
3
3
3
5
5
5
F
6
6
6
4
4
4
4
4
4
6
6
6
G
7
7
7
5
5
5
5
5
5
7
7
7
H
8
8
8
6
6
6
6
6
6
8
8
8
R&D Systems. 2006. Spike and
Recovery Immunoassay Sample
Validation Protocol. http://www.
woongbee.com/0NewHome/
RnD/ELISA/RnD_%20
SPIKEandREC2006.pdf.
Above is a general plate layout for assay validation. Columns 1-3 and 10-12 are
standards, ideally a 7- or 8-point standard curve in standard diluent. The data
from these six standard curves will be used to determine standard curve recovery,
intra-assay CV, LLOQ and ULOQ. The wells marked with a B are blank wells, i.e.
assays run only with sample diluent. The average of these ten should be used to
determine background levels. In columns 4-6, samples 1-6 are standard dilution
series run in standard diluent to determine spike control recovery and linearity
of dilution. In columns 7-9, samples 1-6 are standard diluted in sample matrix to
determine sample spike recovery and inter-assay CV, although a minimum of three
plates needs to be run for inter-assay CV. Sample matrix should be depleted of
target proteins, e.g. use depleted serum or plasma.
Chapter 3.5.1 | Immunoassay Validation
www.luminexcorp.com | Page 40
BR_574.01_0613
Chapter 4
Chapter 4
Proteomic Applications
Proteomic Applications
Chapter 4 | Proteomic Applications
www.luminexcorp.com | Page 41
BR_574.01_0613
Chapter 4.1
Common xMAP® Immunoassays
The following immunoassay protocols presume that the user is familiar with
general assay development and optimization (including microsphere (“bead”)
coupling). This introduction is intended to review the immunoassay development
process only at a high level.
First, the assay format should be selected, such as capture sandwich, competitive
or indirect assay. Next is the acquisition of necessary reagents, including antibodies,
analytes, standards/controls, and buffers. The capture reagent (e.g., antibody
or protein, etc.) should then be purified of extraneous primary amines prior to
chemical coupling to the microspheres, which are then washed and resuspended in
buffer. Coupled beads should be enumerated with a hemocytometer or other device
to estimate the resulting bead count in the stock solution.
Figure 12.
Figure 12 - Common assay formats for
immunoassays include (A) capture
A
B
C
sandwich assay, requiring two
monoclonal antibodies to your analyte
target; (B) competitive (antibody) assay,
requiring a single antibody and a labeled
positive target; and (C) indirect antibody
Capture Sandwich
Competitive Assay
Indirect Serological Assay
assay (or, serology assay), requiring both a
target protein and an anti-IgG antibody.
Microsphere coupling reactions are then confirmed in the assay buffer system
using an appropriate detection reagent. The background fluorescence should be
assessed in the target matrix to evaluate nonspecific binding and cross-reactivity,
and positive control reagents similar to the sample should be used to assess
positive binding reactions, sensitivity, and specificity. Monoplex microspheres can
then be combined into a multiplex assay, testing for new non-specific binding,
cross-reactivity or loss of signal in multiplex conditions.
Chapter 4.1 | Common xMAP® Immunoassays
www.luminexcorp.com | Page 42
BR_574.01_0613
Chapter 4.1.1
Capture Sandwich Immunoassay
The following immunoassay protocol presumes that the user is familiar with
general assay development and optimization (including microsphere (“bead”)
coupling).
Capture Sandwich
Assay Principle and Overview
A capture sandwich immunoassay is used to detect an antigen (target) with the
use of a capture antibody attached to the surface of a microsphere and a detection
antibody that incorporates a fluorescent label, forming a “sandwich.” This assay
is commonly used to measure a large number of hormones, blood products,
enzymes, drugs, disease markers and other biological molecules. The general steps
to performing a sandwich immunoassay with xMAP® Technology are as follows:
Summary of Protocol
Add capture antibody-coupled microspheres
Add antigen-containing
sample
Wash microspheres w/
Assay Buffer
Add labeled detection
antibody
Wash microspheres w/
Assay Buffer
Read 50 μL on
Luminex® analyzer
Chapter 4.1.1 | Capture Sandwich Immunoassay
www.luminexcorp.com | Page 43
BR_574.01_0613
Technical Notes:
• For Capture Sandwich immunoassays, 2-4 μg/mL detection antibody is usually
sufficient; however, up to five-fold more detection antibody may be required
for a no-wash assay format. To optimize detection antibody concentration for
washed assays, we recommend starting with 4 μg/mL and titrating down to
1 μg/mL by two-fold dilutions.
• The optimal detection antibody concentration will depend on specific reagents
and level of multiplexing. Concentrations often need to be increased when
increasing the number of multiplexed assays and when converting to a nowash assay format.
• The reporter concentration should be approximately one and one-half times
the concentration of the detection antibody. When using streptavidin-Rphycoerythrin (SAPE) at concentrations > 8 μg/mL final concentration in a no
wash format, a dilution or wash step may be required to minimize background
fluorescence prior to analysis on the Luminex® instrument.
Materials Needed:
Reagents and Consumables
Vendor
MagPlex® Microspheres (antibody coupled)
Assay/Wash Buffer (PBS, 1% BSA)
Sigma P3688
PBS-BN buffer1
Sigma P3688
PBS–TBN buffer1,2
Sigma P3813
Sigma A7888
Sigma P9416
96 well plate
See Appendix B
PE or Biotin labeled Detection Antibody
Any suitable source
streptavidin-R-phycoerythrin (SAPE)
Moss SAPE-001G75,
Life Technologies S-866 or
equivalent
1.5 mL microcentrifuge tubes
USA Scientific 1415-2500
or Eppendorf Lo Bind
022431081
Disposable pipettes tips
Any suitable brand
Distilled deionized water (ddH2O)
Any suitable source
For complete equipment and
materials list see Appendix B
1. Also used as assay buffer.
2.Also used as wash buffer.
Protocol 4.1.1 - Capture Sandwich Immunoassay
1. Select the appropriate antibody-coupled microsphere sets.
2. Resuspend the microspheres by vortex and sonication for approximately 20
seconds.
3. Prepare a Working Microsphere Mixture by diluting the coupled microsphere
stocks to a final concentration of 50 microspheres of each set/μL in Assay
Buffer. NOTE: 50 μL of Working Microsphere Mixture is required for each
reaction.
Chapter 4.1.1 | Capture Sandwich Immunoassay
Note: Microspheres should be
protected from prolonged exposure to
light throughout this procedure.
www.luminexcorp.com | Page 44
BR_574.01_0613
4. Aliquot 50 μL of the Working Microsphere Mixture into the appropriate wells
of a round-bottom well plate.
5. Add 50 μL of Assay Buffer to each background well.
6. Add 50 μL of standard or sample to the appropriate wells.
7. Mix the reactions gently by pipetting up and down several times with a multichannel pipettor.
8. Cover the plate and incubate for 30 minutes at room temperature on a plate
shaker set to approximately 800 rpm.
9. Place the plate into the magnetic separator and allow separation to occur for
30-60 seconds.
10. Use a multi-channel pipette to carefully aspirate the supernatant from each
well. Take care not to disturb the microspheres.
11. Leave the plate in the magnetic separator for the following wash steps:
a. Add 100 μL Assay Buffer to each well.
b. Use a multi-channel pipette to carefully aspirate the supernatant from each
well or use the manual inversion wash method. Take care not to disturb the
microspheres.
c. Repeat steps a and b above.
12. Remove the plate from the magnetic separator and resuspend the
microspheres in 50 μL of Assay Buffer by gently pipetting up and down several
times using a multi-channel pipettor.
13. Dilute the biotinylated detection antibody to 4 μg/mL in Assay Buffer.
14. Add 50 μL of the diluted detection antibody to each well.
15. Mix the reactions gently by pipetting up and down several times with a multichannel pipettor.
16. Cover the plate and incubate for 30 minutes at room temperature on a plate
shaker set to approximately 800 rpm.
17. Place the plate into the magnetic separator and allow separation to occur for
30-60 seconds.
18. Use a multi-channel pipette to carefully aspirate the supernatant from each
well. Take care not to disturb the microspheres.
19. Leave the plate in the magnetic separator for the following wash steps:
a. Add 100 μL Assay Buffer to each well.
b. Use a multi-channel pipette to carefully aspirate the supernatant from each
well or use the manual inversion wash method. Take care not to disturb
the microspheres.
c. Repeat steps a and b above.
20. Remove the plate from the magnetic separator and resuspend the
microspheres in 50 μL of Assay Buffer by gently pipetting up and down several
times with a multi-channel pipettor.
21. Dilute SAPE reporter to 4 μg/mL in Assay Buffer.
22. Add 50 μL of the diluted SAPE to each well.
23. Mix the reactions gently by pipetting up and down several times with a multichannel pipettor.
24. Cover the plate and incubate for 30 minutes at room temperature on a plate
shaker set to approximately 800 rpm.
25. Place the plate into the magnetic separator and allow separation to occur for
30-60 seconds.
26. Use a multi-channel pipette to carefully aspirate the supernatant from each
well. Take care not to disturb the microspheres.
Chapter 4.1.1 | Capture Sandwich Immunoassay
Note: 50 μL of diluted detection
antibody is required for each reaction.
Note: 50 μL of diluted SAPE is
required for each reaction.
www.luminexcorp.com | Page 45
BR_574.01_0613
27. Leave the plate in the magnetic separator for the following wash steps:
a. Add 100 μL Assay Buffer to each well.
b. Use a multi-channel pipette to carefully aspirate the supernatant from
each well or use the manual inversion wash method. Take care not to
disturb the microspheres.
c. Repeat steps a and b above.
28. Remove the plate from the magnetic separator and resuspend the
microspheres in 100 μL of Assay Buffer by gently pipetting up and down
several times with a multi-channel pipettor.
29. Analyze 50–75 μL on the Luminex analyzer according to the system manual.
Capture Sandwich Immunoassay References:
• Bjerre M, Hansen TK, Flyvbjerg A, Tønnesen E. “Simultaneous detection of
porcine cytokines by multiplex analysis: development of magnetic bioplex
assay.” Vet Immunol Immunopathol. 2009;130:53-58.
Chapter 4.1.1 | Capture Sandwich Immunoassay
www.luminexcorp.com | Page 46
BR_574.01_0613
Chapter 4.1.2
Competitive Immunoassay
The following immunoassay protocol presumes that the user is familiar with
general assay development and optimization (including microsphere (“bead”)
coupling).
Competitive Assay
Format 1
Format 2
Assay Principle and Overview
A competitive immunoassay enables detection of an antigen (target) with the
use of a single capture antibody attached to the surface of a microsphere and a
competitive, labeled antigen reversibly bound to the antibody (Format 1). Analyte
in the sample is detected by competing away the bound, labeled antigen and
causing a decrease in signal. The assay format may also be reversed with the
antigen attached to the microsphere and the antibody labeled (Format 2). In this
case, the analyte in the sample competes away the labeled antibody in solution
rather than on the surface of the microsphere. This assay is useful for smaller
protein analytes (<3-4 kD) with only a single (or very few) epitopes or when only
a single antibody is available. The general steps to performing this type of assay on
xMAP® Technology are as follows:
Summary of Protocol (Format 1)
Add capture antibody-coupled
microspheres
Add antigen-containing
sample
Wash microspheres w/
Assay Buffer
Read 50 μL on
Luminex® analyzer
Chapter 4.1.2 | Competitive Immunoassay
Add labeld antigen
www.luminexcorp.com | Page 47
BR_574.01_0613
For competitive immunoassays, the higher the sample target concentration, the
weaker the eventual signal. The major advantage of a competitive immunoassay is
the ability to use crude or impure samples and still selectively bind any target that
may be present.
Technical Notes:
• For Competitive Immunoassay format, we recommend testing a range
of competing analyte (0.2 to 5 μg) with increasing concentrations of
antibody. The antibody concentration that yields 70-80% of the maximum
signal should provide the largest linear dynamic range for the assay. The
reporter concentration should be approximately one and one-half times
the concentration of the detection antibody. When using streptavidin-Rphycoerythrin (SAPE) at concentrations > 8 μg/mL, in a no wash format, a
dilution or wash step may be required to minimize background fluorescence
prior to analysis on the Luminex® instrument.
Materials Needed:
Reagents and Consumables
Vendor
MagPlex® Microspheres (antibody- or antigen-coupled)
Assay/Wash Buffer (PBS, 1% BSA)
Sigma P3688
PBS-BN buffer1
Sigma P3688
PBS–TBN buffer1,2
Sigma P3813
Sigma A7888
Sigma P9416
96 well plate
See Appendix B
PE or Biotin labeled Detection Antibody or Analyte
Any suitable source
streptavidin-R-phycoerythrin (SAPE)
Moss SAPE-001G75, Life
Technologies S-866 or
equivalent
1.5 mL microcentrifuge tubes
USA Scientific 1415-2500
or Eppendorf Lo Bind
022431081
Disposable pipettes tips
Any suitable brand
Distilled deionized water (ddH2O)
Any suitable source
For complete equipment and
materials list see Appendix B
1. Also used as assay buffer.
2.Also used as wash buffer.
Chapter 4.1.2 | Competitive Immunoassay
www.luminexcorp.com | Page 48
BR_574.01_0613
Protocol 4.1.2.1 – Competitive Immunoassay (Format 1)
1. Select the appropriate antibody-coupled microsphere sets.
2. Resuspend the microspheres by vortex and sonication for approximately
20 seconds.
3. Prepare a Working Microsphere Mixture by diluting the coupled microsphere
stocks to a final concentration of 100 microspheres of each set/μL in PBS1% BSA. Note: 25 μL of Working Microsphere Mixture is required for each
reaction.
4. Dilute the biotinylated competitor to the [IC70] or [IC80] in PBS-1% BSA.
5. Add 25 μL of PBS-1%BSA to each background well.
6. Add 25 μL of standard or sample to the appropriate wells.
7. Add 25 μL of the diluted, biotinylated competitor to each well.
8. Mix the reactions gently by pipetting up and down several times with a multichannel pipettor.
9. Add 25 μL of the Working Microsphere Mixture to the appropriate wells
10. Mix the reactions gently by pipetting up and down several times with a multichannel pipettor.
11. Cover the plate and incubate for 60 minutes at room temperature on a plate
shaker at 800 rpm.
12. Dilute the SAPE reporter to 4 μg/mL in PBS-1% BSA. Note: 25 μL of diluted
SAPE is required for each reaction.
13. Add 25 μL of the diluted SAPE to each well.
14. Mix the reactions gently by pipetting up and down several times with a multichannel pipettor.
15. Cover the plate and incubate for 30 minutes at room temperature on a plate
shaker at 800 rpm.
16. OPTIONAL Include the following steps if high backgrounds occur:
*Carefully remove the supernatant from each well by magnetic plate separator
using either manual inversion, manual pipetting or magnetic plate washer.
Take care not to disturb the microspheres. Add 100 μL of Wash Buffer (PBSTBN) to each reaction well. Take care not to disturb the microspheres.
17. Repeat step 16 once more for a total of two washes.
18. Bring final volume of each reaction to 100 μL with Assay Buffer.
19. Analyze 50-75 μL on the Luminex analyzer according to the system manual.
Chapter 4.1.2 | Competitive Immunoassay
Note: Microspheres should be
protected from prolonged exposure to
light throughout this procedure.
Note: 25 μL of diluted competitor is
required for each reaction.
Technical Note
• The [IC70] and [IC80] are the
concentrations of biotinylated
competitor that yield 70% and
80% of the maximum obtainable
signal, respectively. The [IC70] or
[IC80] should be determined by
titration in PBS-1% BSA (or PBSBN).
www.luminexcorp.com | Page 49
BR_574.01_0613
Summary of Protocol (Format 2)
Add capture antibody-coupled
microspheres
Add labeled antigen
Wash microspheres w/
Assay Buffer
Read 50 μL on Luminex
analyzer
Protocol 4.1.2.2 – Competitive Immunoassay (Format 2)
1. Select the appropriate antigen-coupled microsphere sets.
2. Resuspend the microspheres by vortex and sonication for approximately
20 seconds.
3. Prepare a Working Microsphere Mixture by diluting the coupled microsphere
stocks to a final concentration of 100 microspheres of each set/μL in Assay
Buffer. 25 μL of Working Microsphere Mixture is required for each reaction.
4. Dilute the biotinylated detection antibody to the [IC70] or [IC80] in Assay
Buffer. 25 μL of biotinylated detection antibody is required for each reaction.
5. Add 25 μL of Assay Buffer to each background well
6. Add 25 μL of standard or sample to the appropriate wells.
7. Add 25 μL of the Working Microsphere Mixture to each well.
8. Mix the reactions gently by pipetting up and down several times with a multichannel pipettor.
9. Add 25 μL of the diluted biotinylated detection antibody to each well.
10. Mix the reactions gently by pipetting up and down several times with a multichannel pipettor.
11. Cover the plate and incubate for 60 minutes at room temperature on a plate
shaker (800 rpm for MagPlex Microspheres).
12. Dilute the SAPE reporter to the appropriate concentration (typically ≥4 μg/
mL) in Assay Buffer. 25 μL of diluted SAPE is required for each reaction.
13. Add 25 μL of the diluted SAPE to each well.
14. Mix the reactions gently by pipetting up and down several times with a multichannel pipettor.
15. Cover the plate and incubate for 30 minutes at room temperature on a plate
shaker (400 rpm for non-magnetic microspheres or 800 rpm for MagPlex
Microspheres).
16. OPTIONAL – Include the following steps if high backgrounds occur:
*Carefully remove the supernatant from each well using either manual
inversion, manual pipetting or magnetic plate washer. Take care not to disturb
the microspheres. Add 100 μL of Wash Buffer (PBS-TBN) to each reaction
well. method. Take care not to disturb the microspheres.
17. Repeat step 16 once more for a total of two washes
18. Bring final volume of each reaction to 100 μL with Assay Buffer.
19. Analyze 50–75 μL on the Luminex analyzer according to the system manual.
Chapter 4.1.2 | Competitive Immunoassay
Add reporter antibody
Note: Microspheres should be
protected from prolonged exposure to
light throughout this procedure.
Technical Notes
• The [IC70] and [IC80] are the
concentrations of detection
antibody that yield 70%
and 80% of the maximum
obtainable signal, respectively.
The [IC70] or [IC80] should be
determined by titration in Assay
Buffer.
• Concentrations of the detection
antibodies and SAPE should
be optimized. The optimal
concentrations tend to be higher
than in a washed assay.
www.luminexcorp.com | Page 50
BR_574.01_0613
Chapter 4.1.3
Indirect (Serological) Immunoassay
The following immunoassay protocol presumes that the user is familiar with
general assay development and optimization (including microsphere (“bead”)
coupling).
Indirect Serological Assay
Assay Principle and Overview
An indirect immunoassay enables the detection of an antibody (target) with the
use of a capture protein antigen and a detection antibody. This assay is useful for
serology assays where serum antibodies are measured to determine infection,
allergy or autoimmune activity. The general steps to performing a serology
immunoassay with xMAP® Technology are as follows:
Summary of Protocol
Add capture
antigen-coupled
microspheres
Add antibodycontaining sample
Wash microspheres w/
Assay Buffer
Add labeled detection
antibody
Wash microspheres w/
Assay Buffer
Read 50 μL on Luminex
analyzer
Chapter 4.1.3 | Indirect (Serological) Immunoassay
www.luminexcorp.com | Page 51
BR_574.01_0613
Technical Notes:
• For Indirect (Serological) immunoassays, 2-4 μg/mL detection antibody
is usually sufficient, however up to five-fold more detection antibody may
be required for a no-wash assay format. To optimize detection antibody
concentration for washed assays, we recommend starting with 4 μg/mL and
titrating down to 1 μg/mL by two-fold dilutions. The optimal detection antibody
concentration will depend on specific reagents and level of multiplexing.
Concentrations often need to be increased when increasing the number of
multiplexed assays and when converting to a no-wash assay format.
• The reporter concentration should be approximately one and one-half times
the concentration of the detection antibody. When using streptavidin-Rphycoerythrin (SAPE) at concentrations > 8 μg/mL final concentration, in a no
wash format, a dilution or wash step may be required to minimize background
fluorescence prior to analysis on the Luminex instrument.
Materials Needed:
Reagents and Consumables
Vendor
MagPlex® Microspheres (antigen-coupled)
Assay/Wash Buffer (PBS, 1% BSA)
Sigma P3688
PBS-BN buffer1
Sigma P3688
PBS–TBN buffer
1,2
For complete equipment and
materials list see Appendix B
Sigma P3813
Sigma A7888
Sigma P9416
96 well plate
See Appendix B
PE or Biotin labeled Detection Antibody
Any suitable source
streptavidin-R-phycoerythrin (SAPE)
Moss SAPE-001G75, Life
Technologies S-866 or
equivalent
1.5 mL microcentrifuge tubes
USA Scientific 1415-2500
or Eppendorf Lo Bind
022431081
Disposable pipettes tips
Any suitable brand
Distilled deionized water (ddH2O)
Any suitable source
1. Also used as assay buffer.
2.Also used as wash buffer.
Chapter 4.1.3 | Indirect (Serological) Immunoassay
www.luminexcorp.com | Page 52
BR_574.01_0613
Protocol 4.1.3 – Indirect (Serological) Immunoassay
1. Dilute samples and controls using diluent (for example, dilute 1 to 500).
2. Select the appropriate antigen-coupled microsphere mixture. Prepare a
Working Microsphere Mixture by diluting the coupled microsphere stocks to a
final concentration of 50 microspheres of each set/μL in PBS-1% BSA.
3. Resuspend the microspheres by vortex and sonication for approximately 20
seconds.
4. Aliquot 50 μL of the working microsphere mixture into the appropriate wells.
5. Add 50 μL of diluted controls and diluted samples to the appropriate wells.
6. If available, add 50 μL of standard to the appropriate wells.
7. Cover the plate to protect it from light and incubate for 60 minutes at room
temperature on a plate shaker set to approximately 800 rpm.
8. Place the plate into the magnetic separator and allow separation to occur for
30-60 seconds.
*Carefully remove the supernatant from each well by magnetic plate separator
using either manual inversion, manual pippetting or magnetic plate washer.
Take care not to disturb the microspheres. Add 100 μL of Wash Buffer (PBSTBN) to each reaction well.
9. Repeat step 8 once more for a total of two washes
10. Remove the plate from the magnetic separator and add 100 μL of detection
antibody to each well of the plate.
11. Cover the plate to protect it from light and incubate for 30 minutes at room
temperature on a plate shaker set to approximately 800 rpm.
12. Place the plate into the magnetic separator and allow separation to occur for
30-60 seconds.
*Carefully remove the supernatant from each well by magnetic plate separator
using either manual inversion, manual pipetting or magnetic plate washer.
Take care not to disturb the microspheres. Add 100 μL of Wash Buffer (PBSTBN) to each reaction well.
13. Repeat step 14 once more for a total of two washes.
14. Remove the plate from the magnetic separator and add 100 μL of reporter conjugate (e.g SA-PE) to each well of the plate.
15. Cover the plate to protect it from light and incubate for 30 minutes at room
temperature on a plate shaker set to approximately 800 rpm.
16. Place the plate into the magnetic separator and allow separation to occur for
60 seconds.
*Carefully remove the supernatant from each well by magnetic plate separator
using either manual inversion, manual pipetting or magnetic plate washer.
Take care not to disturb the microspheres. Add 100 μL of Wash Buffer (PBSTBN) to each reaction well.
17. Repeat step 16 once more for a total of two washes.
18. Remove the plate from the magnetic separator and add 100 μL of wash buffer
to each well of the plate.
19. Resuspend the microspheres by pipetting up and down several times
with a multichannel pipettor or placing the plate onto a plate shaker for
approximately 15 seconds.
20. Analyze 75 μL on the Luminex analyzer according to the system manual.
Chapter 4.1.3 | Indirect (Serological) Immunoassay
Note: Microspheres should be
protected from prolonged exposure to
light throughout this procedure.
Note: 50 μL of Working Microsphere
Mixture is required for each reaction.
Note: Many standards are supplied
prediluted at working concentration
and do not require further dilution.
www.luminexcorp.com | Page 53
BR_574.01_0613
Indirect Immunoassay References:
• Biagini, R.E., Schlottmann, S.A., Sammons, D.L., Smith, J.P., Snawder, J.C.,
Striley, C.A., MacKenzie, B.A. and Weissman, D.N. “Method for simultaneous
measurement of antibodies to 23 pneumococcal capsular polysaccharides.” Clin.
Diagn. Lab. Immunol. 10, 744–750 (2003).
• Pickering, J.W., Martins, T.B., Greer, R.W., Schroder, M.C., Astill, M.E., Litwin,
C.M., Hildreth, S.W. and Hill, H.R. “A multiplexed fluorescent microsphere
immunoassay for antibodies to pneumococcal capsular polysaccharides.” Am. J.
Clin. Pathol. 117, 589–596 (2002).
• Shichijo, S., Keicho, N., Long, H.T., Quy, T., Phi, N.C., Ha, L.D., Ban, V.V., Itoyama,
S., Hu, C.J., Komatsu, N., Kirikae, T., Kirikae, F., Shirasawa, S., Kaji, M., Fukuda, T.,
Sata, M., Kuratsuji, T., Itoh, K. and Sasazuki, T. “Assessment of synthetic peptides
of severe acute respiratory syndrome coronavirus recognized by long-lasting
immunity.” Tissue Antigens 64, 600–607 (2004).
Chapter 4.1.3 | Indirect (Serological) Immunoassay
www.luminexcorp.com | Page 54
BR_574.01_0613
Chapter 4.1.4
Combined Capture Sandwich and Competitive
Immunoassay
The following immunoassay protocol presumes that the user is familiar with
general assay development and optimization (including microsphere (“bead”)
coupling).
Combined Capture Sandwich and Competitive Antibody Assay
Capture Sandwich
Competitive Antibody Assay
Assay Principle and Overview
Competitive Immunoassays can be multiplexed with Capture Sandwich
Immunoassays, adding versatility to your multiplex assays. The general steps to
performing a combined capture sandwich and competitive immunoassay with
xMAP® Technology are as follows:
Summary of Protocol
Add antigen- and
antibody-containing
sample and diluted
competitor
Add capture antibodyand/or antigen-coupled
microspheres
Wash microspheres w/
Assay Buffer
Read 50 μL on
Luminex® analyzer
Chapter 4.1.4 | Combined Capture Sandwich and Competitive Immunoassay
Add labeled detection
antibody
www.luminexcorp.com | Page 55
BR_574.01_0613
Materials Needed:
Reagents and Consumables
Vendor
MagPlex® Microspheres (antibody- or antigen-coupled)
Assay/Wash Buffer (PBS, 1% BSA)
Sigma P3688
PBS-BN buffer1
Sigma P3688
PBS–TBN buffer
1,2
For complete equipment and
materials list see Appendix B
Sigma P3813
Sigma A7888
Sigma P9416
96 well plate
See Appendix B
PE or Biotin labeled Detection Antibody
Any suitable source
streptavidin-R-phycoerythrin (SAPE)
Moss SAPE-001G75, Life
Technologies S-866 or
equivalent
1.5 mL microcentrifuge tubes
USA Scientific 1415-2500
or Eppendorf Lo Bind
022431081
Disposable pipettes tips
Any suitable brand
Distilled deionized water (ddH2O)
Any suitable source
1. Also used as assay buffer.
2.Also used as wash buffer.
Protocol 4.1.4 – Combined Capture Sandwich and Competitive
Immunoassay
1. Select the appropriate antibody- and/or antigen-coupled microsphere sets.
2. Resuspend the microspheres by vortex and sonication for approximately
20 seconds.
3. Prepare a Working Microsphere Mixture by diluting the coupled microsphere
stocks to a final concentration of 500 microspheres of each set/μL in Assay
Buffer. 5 μL of Working Microsphere Mixture is required for each reaction.
4. Dilute the biotinylated competitor to the [IC70] or [IC80] in Assay Buffer. 5 μL
of diluted competitor is required for each reaction.
5. Add 10 μL of Assay Buffer to each background
6. Add 10 μL of standard or sample to the appropriate wells.
7. Add 5 μL of the diluted competitor to each well.
8. Mix the reactions gently by pipetting up and down several times with a multichannel pipettor.
9. Aliquot 5 μL of the Working Microsphere Mixture to each well.
10. Mix the reactions gently by pipetting up and down several times with a multichannel pipettor.
11. Cover the filter plate and incubate for 60 minutes at room temperature on a
plate shaker (800 rpm for MagPlex Microspheres).
12. Dilute the biotinylated detection antibody to the appropriate concentration in
Assay Buffer. 10 μL of diluted detection antibody is required for each reaction.
13. Add 10 μL of the diluted detection antibody to each well.
14. Mix the reactions gently by pipetting up and down several times with a multichannel pipettor.
15. Cover the plate and incubate for 60 minutes at room temperature on a plate
shaker (800 rpm for MagPlex Microspheres).
Chapter 4.1.4 | Combined Capture Sandwich and Competitive Immunoassay
Note: Microspheres should be
protected from prolonged exposure to
light throughout this procedure.
Technical Notes
• The [IC70] and [IC80] are the
concentrations of detection
antibody that yield 70%
and 80% of the maximum
obtainable signal, respectively.
The [IC70] or [IC80] should be
determined by titration in Assay
Buffer.
• Concentrations of biotinylated
competitors, detection
antibodies, and SAPE should
be optimized. The optimal
concentrations tend to be higher
than in a washed assay.
• If high backgrounds are
observed, a final post-labeling
wash step may be performed just
prior to analysis.
www.luminexcorp.com | Page 56
BR_574.01_0613
16. Dilute the SAPE reporter to the appropriate concentration (typically ≥10–12
μg/mL) in Assay Buffer. 10 μL of diluted SAPE is required for each reaction.
17. Add 10 μL of the diluted SAPE to each well.
18. Mix the reactions gently by pipetting up and down several times with a multichannel pipettor.
19. Cover the plate and incubate for 30 minutes at room temperature on a plate
shaker (800 rpm for MagPlex Microspheres).
20.Bring final volume of each reaction to 100 uL with assay buffer.
21. OPTIONAL – Include the following steps if high backgrounds occur: – Carefully
remove the supernatant from each well using either manual inversion, manual
pipetting or magnetic plate washer. Take care not to disturb the microspheres.
Add 100 μL of Wash Buffer (PBS-TBN) to each reaction well. Take care not to
disturb the microspheres.
22 Repeat step 21 once more for a total of two washes
23. Bring final volume of each reaction to 100 μL with Assay Buffer.
24. Analyze 50–75 μL on the Luminex analyzer according to the system manual.
Chapter 4.1.4 | Combined Capture Sandwich and Competitive Immunoassay
www.luminexcorp.com | Page 57
BR_574.01_0613
Chapter 4.2
Other Coupling Moieties
Peptides, phospholipids, and other small molecules can be directly coupled to the
microsphere (“bead”) surface (Komatsu et al., 2004; Shichijo et al., 2004) but
may be more efficiently accomplished through modification of the small molecule
or the microsphere to provide adequate spacing from the microsphere surface.
This can be accomplished through the use of a linker or carrier protein attached to
the small molecule, which can then be coupled to the microsphere surface using
the standard one-step carbodiimide chemistry. If the small molecule is available in
a biotinylated form, it can be bound to LumAvidin® Microspheres where the avidin
provides spacing from the microsphere surface (Iannone et al., 2001; Drummond
et al., 2008; Gu et al., 2008).
Luminex® recommends, in the following order:
1.
Coupling the peptide to a carrier protein – Conjugating your small molecule
to a carrier protein such as bovine serum albumn (BSA), keyhole limpet
hemocyanin (KLH), or thyroglobulin (TG) may be done using commercially
available crosslinking reagents followed by coupling the modified capture
moiety to the beads using our standard protein coupling protocol.
2. Biotinylate the peptide and bind it to LumAvidin beads (non-magnetic) –
Your capture peptide may be available in biotinylated form, or may be easily
modified using commercially available reagents. In this case the detection
reagent must be directly conjugated with PE.
3. Modify the microsphere surface with adipic acid dihydrazide (ADH) or
4-(4-N-Maleimidophenyl)butyric acid hydrazide hydrochloride (MPBH) and
couple the peptide via carboxyl or sulfhydryl groups using EDC.
Common chemical spacers
used to couple peptides to
xMAP® Microspheres:
BSA – Bovine Serum Albumin
KLH – Keyhole Limpet
Hemocyanin
TG – Thyroglobulin
ADH – Adipic Acid Dihydrazide
MPBH – (4-N-Maleimidophenyl)
butyric acid hydrazide
hydrochloride
Maleimide
Biotin
Other Coupling Moiety References:
• Iannone, M.A., Consler, T.G., Pearce, K.H., Stimmel, J.B., Parks, D.J. and Gray,
J.G. “Multiplexed molecular interactions of nuclear receptors using fluorescent
microspheres.” Cytometry 44, 326–337 (2001).
• Drummond, J.E., Shaw, E.E., Antonello, J.M., Green, T., Page, G.J., Motley,
C.O., Wilson, K.A., Finnefrock, A.C., Liang, X. and Casimiro, D.R. “Design and
optimization of a multiplex anti-influenza peptide immunoassay.” J. Immunol.
Methods 334, 11–20 (2008).
• Komatsu, N., Shichijo, S., Nakagawa, M. and Itoh, K. “New multiplexed flow
cytometric assay to measure anti-peptide antibody: a novel tool for monitoring
immune responses to peptides used for immunization.” Scand. J. Clin. Lab. Invest.
64, 535–545 (2004).
• Schlottmann, S.A., Jain, N., Chirmule, N. and Esser, M.T. “A novel chemistry
for conjugating pneumococcal polysaccharides to Luminex microspheres.” J.
Immunol. Methods 309, 75–85 (2006).
Chapter 4.2 | Other Coupling Moieties
www.luminexcorp.com | Page 58
BR_574.01_0613
Chapter 4.2.1
Coupling Biotinylated Peptides with
LumAvidin® Microspheres
A sample protocol for binding of biotinylated molecules to LumAvidin
Microspheres (“beads”) is described below. However, with this approach a
biotin–streptavidin system cannot be used for reporter labeling and an alternative
reporter labeling method, such as a direct conjugation of PE to the detection
reagent, would be necessary.
Summary of Protocol
Add LumAvidin
Microspheres
Wash microspheres w/
buffer
Add PBS-BSA blocking
buffer
Add biotinylated
peptide
Incubate 30 minutes
Wash and resuspend
microspheres w/ buffer
Materials Needed:
Reagents and Consumables
Vendor
LumAvidin® Microspheres
Luminex®
Assay/Wash Buffer (PBS, 1% BSA)
Sigma P3688
Biotin conjugated molecule
Any suitable brand
PBS-BN buffer1
Sigma P3688
PBS–TBN buffer
1,2
For complete equipment and
materials list see Appendix B
Sigma P3813
Sigma A7888
Sigma P9416
1.5 mL microcentrifuge tubes
USA Scientific 1415-2500
Eppendorf Lo Bind
022431081
Disposable pipettes tips
Any suitable brand
Distilled deionized water (ddH2O)
Any suitable source
1. Also used as assay buffer.
2.Also used as wash buffer.
Chapter 4.2.1 | Coupling Biotinylated Peptides with LumAvidin® Microspheres
www.luminexcorp.com | Page 59
BR_574.01_0613
Protocol 4.2.1 Coupling biotinylated peptides with LumAvidin
Microspheres
1. Resuspend the stock LumAvidin microsphere suspension according to the
instructions described in the Product Information Sheet provided with your
microspheres.
2. Transfer 1.0×10⁵ of the stock microspheres to a recommended microcentrifuge
tube.
3. Pellet the stock microspheres by microcentrifugation at ≥8000 g for
1–2 miniutes (or by using a magnetic separator) and remove supernatant.
4. Remove the supernatant and resuspend the pelleted microspheres in 250 μL
of PBS–BSA by vortex and sonication for approximately 20 seconds.
5. Dilute the biotin-conjugated molecule in PBS–BSA. The optimal concentration
should be determined by titration in the 4–4000 nM range.
6. Add 250 μL of the biotin-conjugated molecule solution to the microsphere
suspension and mix immediately by vortex.
7. Incubate for 30 minutes with mixing (by rotation) at room temperature.
8. Pellet the bound microspheres by microcentrifugation at ≥8000 g for
1–2 minutes (or by using a magnetic separator) and remove supernatant.
9. Resuspend the pelleted microspheres in 500 μL of Blocking/Storage Buffer
(PBS-BN or PBS–TBN) by vortex.
10. Repeat steps 8 and 9 for a total of two washes with Blocking/Storage Buffer.
11. Remove the supernatant and resuspend the microspheres in 250–1000 μL
Blocking/Storage Buffer by vortex and sonication for approximately
20 seconds.
12. Store the bound LumAvidin microspheres refrigerated at 2–8 °C in the dark.
Chapter 4.2.1 | Coupling Biotinylated Peptides with LumAvidin® Microspheres
Note: Microspheres should be protected
from prolonged exposure to light
throughout this procedure.
www.luminexcorp.com | Page 60
BR_574.01_0613
Chapter 4.2.2
Coupling Peptides with ADH
Adipic acid dihydrazide (ADH) is a suitable chemical spacer for extending the
peptide away from the surface of xMAP® Microspheres (“beads”) for optimum
reactivity with sample and reagents. ADH provides a 10-atom spacer with an
active amine group for coupling to peptide carboxyls. A sample protocol for
modifiying xMAP Microspheres with ADH is described below.
Summary of Protocol
Add uncoupled
microspheres
Wash microspheres w/
buffer
Add ADH
Add EDC
Incubate 1 hour
Wash and resuspend
microspheres w/ buffer
Materials Needed:
Reagents and Consumables
Vendor
MagPlex® Microspheres
Luminex
Adipic acid dihydrazide (ADH)
Sigma A0368
Coupling Buffer (0.1 M MES, pH 6.0)
Sigma M2933
1-Ethyl-3-[3-dimethylaminopropyl]carbodiimide hydrochloride
(EDC)
Pierce 77149
PBS pH7.4
See Appendix A
Storage Buffer PBS–TBN buffer
Sigma P3813
Sigma A7888
Sigma P9416
1.5 mL microcentrifuge tubes
USA Scientific 1415-2500
or Eppendorf Lo Bind
022431081
Disposable pipettes tips
Any suitable brand
Distilled deionized water (ddH2O)
Any suitable source
Chapter 4.2.2 | Coupling Peptides with ADH
For complete equipment and
materials list see Appendix B
www.luminexcorp.com | Page 61
BR_574.01_0613
Protocol 4.2.2 Modification of microspheres with adipic acid
dihydrazide (ADH)
1. Resuspend the stock microsphere suspension according to the instructions
described in the Product Information Sheet provided with your microspheres.
2. Remove an aliquot of 25 × 106 of microspheres and pellet by centrifugation
at ≥4000 g for 2 min (or by using a magnetic separator) and remove
supernatant.
3 Resuspend the pelleted microspheres in 1 mL of 0.1 M MES, pH 6.0, by vortex
and sonication for approximately 20 seconds.
4. Transfer the resuspended microspheres to a recommended microcentrifuge
tube and pellet the microspheres by microcentrifugation at ≥8000 g for
1–2 minutes (or by using a magnetic separator) and remove supernatant.
5. Resuspend the microspheres in 1 mL of 35 mg/mL ADH (diluted in 0.1 M MES,
pH 6.0) by vortex.
6. Add 200 μL of 200 mg/mL EDC (prepared immediately before use in 0.1 M
MES, pH 6.0) and mix by vortex.
7. Incubate for 1 hour with mixing (by rotation) at room temperature.
8. Pellet the microspheres by microcentrifugation at ≥8000 g for 1–2 minutes (or
by using a magnetic separator) and remove supernatant.
9. Resuspend the pelleted microspheres in 1 mL of 0.1 M MES, pH 4.5, by vortex.
10. Pellet the microspheres by microcentrifugation at 8000 g for 1–2 minutes (or
by using a magnetic separator) and remove supernatant. Repeat for a total of
3 washes with 1 mL of 0.1 M MES, pH 4.5.
12. Resuspend the ADH-modified microspheres in 1 mL of 0.1 M MES, pH 4.5, and
store refrigerated at 2–8 °C in the dark.
Chapter 4.2.2 | Coupling Peptides with ADH
Note: Microspheres should be protected
from prolonged exposure to light
throughout this procedure.
www.luminexcorp.com | Page 62
BR_574.01_0613
Chapter 4.2.3
Peptide Coupling to ADH-Modified
Microspheres
Adipic acid dihydrazide (ADH) is a suitable chemical spacer for extending the
peptide away from the surface of xMAP® Microspheres (“beads”) for optimum
reactivity with sample and reagents. A sample protocol for coupling peptides to
ADH-modified microspheres is described below.
Summary of Protocol
Add ADH-coupled
microspheres
Wash microspheres w/
buffer
Add peptide
Add EDC
Incubate 2 hours
Wash and resuspend
microspheres w/ buffer
Materials Needed:
Reagents and Consumables
Vendor
MagPlex® Microspheres (ADH-coupled)
Protein to couple
Any suitable source
Wash Buffer (0.1 M MES, pH 6.0)
Sigma M2933
1-Ethyl-3-[3-dimethylaminopropyl]carbodiimide hydrochloride
(EDC)
Pierce 77149
Wash Buffer PBS-TBN Buffer
Sigma P3813
Sigma A7888
Sigma P9416
PBS pH7.4
See Appendix A
1.5 mL microcentrifuge tubes
USA Scientific 1415-2500
or Eppendorf Lo Bind
022431081
Disposable pipettes tips
Any suitable brand
Distilled deionized water (ddH2O)
Any suitable source
Chapter 4.2.3 | Peptide Coupling to ADH-Modified Microspheres
For complete equipment and
materials list see Appendix B
www.luminexcorp.com | Page 63
BR_574.01_0613
Protocol 4.2.3 Coupling peptides to ADH-Modified
Microspheres
1. Resuspend stock ADH-modified microsphere suspension by vortex and
sonication (15-30 seconds)
2. Remove an aliquot of 25 x 106 ADH microspheres and pellet by centrifugation
at ≥ 8000 x g, 1-2 minutes (or by using a magnetic separator) and remove
supernatant.
3. Wash once with 1 mL 0.1 M MES, pH 6.0 and pellet by centrifugation at
≥ 8000 x g, 1-2 minutes (or by using a magnetic separator) and remove
supernatant, and resuspend ADH microspheres in 100 μL 0.1 M MES, pH 6.0,
vortex.
4. Add 250 μg protein to ADH microspheres and adjust volume to 500 μL with
0.1 M MES, pH 6.0
5. Add 50 μL 200 mg/mL EDC (prepared immediately before use in 0.1 M MES,
pH 6.0), vortex
6. Incubate 2 hours at room temperature with rotation (protect from light)
7. Pellet by centrifugation at ≥ 8000 x g, 1-2 minutes or by using a magnetic
separator and remove supernatant, Resuspend coupled microspheres in 1 mL
PBS, pH and vortex.
8. Pellet by centrifugation at ≥ 8000 x g, 1-2 minutes, or by using a magnetic
separator and remove supernatant, wash twice with 1 mL PBS-TBN
9. Resuspend coupled microspheres in 1 mL PBS-TBN
10. Count microsphere suspension by hemacytometer
*Calculation: Total microspheres = count (1 corner 4x4 section) x (1 x 10⁴) x
(dilution factor) x (resuspension volume in mL)
Chapter 4.2.3 | Peptide Coupling to ADH-Modified Microspheres
Note: Microspheres should be protected
from prolonged exposure to light
throughout this procedure.
www.luminexcorp.com | Page 64
BR_574.01_0613
Chapter 4.2.4
Coupling Peptides with MPBH
4-(4-N-Maleimidophenyl)butyric acid hydrazide hydrochloride (MPBH) is a
suitable chemical spacer for extending the peptide away from the surface of
xMAP® Microspheres (“beads”) for optimum reactivity with sample and reagents.
MPBH provides an 8-atom spacer with a reactive maleimide group for coupling to
cysteine sulfhydryls. A sample protocol for modifiying xMAP Microspheres with
MPBH is described below.
Summary of Protocol
Add uncoupled
microspheres
Wash microspheres w/
buffer
Add MPBH
Add EDC
Incubate 1 hour
Wash and resuspend
microspheres w/ buffer
Materials Needed:
Reagents and Consumables
Vendor
MagPlex® Microspheres
Luminex
4-(4-N-Maleimidophenyl)butyric acid hydrazide hydrochloride
(MPBH)
Pierce 22305
0.1 M MES, pH 6.0
Sigma M2933
DMSO
Any suitable source
1-Ethyl-3-[3-dimethylaminopropyl]carboiimide hydrochloride (EDC)
Pierce 77149
0.1 M MES, pH 4.5
Sigma M2933
1.5 mL microcentrifuge tubes
USA Scientific 1415-2500
or Eppendorf Lo Bind
022431081
Disposable pipettes tips
Any suitable brand
Distilled deionized water (ddH2O)
Any suitable source
Chapter 4.2.4 | Coupling Peptides with MPBH
For complete equipment and
materials list see Appendix B
www.luminexcorp.com | Page 65
BR_574.01_0613
Protocol 4.2.4 Modification of microspheres with MPBH
(maleimide)
1. Resuspend the stock microsphere suspension according to the instructions
described in the Product Information Sheet provided with your microspheres.
2. Remove an aliquot of 25 × 106 of microspheres and pellet by centrifugation
at ≥4000 g for 2 min (or by using a magnetic separator) and remove
supernatant.
3. Resuspend the pelleted microspheres in 1 mL of 0.1 M MES, pH 6.0, by vortex
and sonication for approximately 20 seconds.
4. Transfer the resuspended microspheres to a recommended microcentrifuge
tube and pellet the microspheres by microcentrifugation at ≥8000 g for 1–2
minutes (or by using a magnetic separator) and remove supernatant.
5. Dissolve MPBH at 80 mM (28.3 mg/mL) with DMSO.
6. Dilute dissolved MPBH to 16 mM (5.7 mg/mL) with 0.1 M MES, pH 6.0.
7. Resuspend the microspheres in 250 μL of diluted MPBH by vortex.
8. Add 100 μL of 20 mg/mL EDC (prepared immediately before use in 0.1 M
MES, pH 6.0) and mix by vortex.
9. Incubate for 1 hour with mixing (by rotation) at room temperature.
10. Add 1 mL of 0.1 M MES, pH 4.5, and mix by vortex.
11. Pellet the microspheres by microcentrifugation at ≥8000 g for 1–2 minutes (or
by using a magnetic separator) and remove supernatant.
12. Resuspend the pelleted microspheres in 1 mL of 0.1 M MES, pH 4.5 by vortex
and pellet by microcentrifugation at ≥8000 g for 1–2 minutes (or by using a
magnetic separator) and remove supernatant.
13. Repeat step 14 for a total of 2 washes with 1 mL of 0.1 M MES, pH 4.5.
14. Resuspend the MPBH-modified microspheres in 1 mL of 0.1 M MES, pH 4.5,
and store refrigerated at 2–8 °C in the dark.
Chapter 4.2.4 | Coupling Peptides with MPBH
Note: Microspheres should be protected
from prolonged exposure to light
throughout this procedure.
www.luminexcorp.com | Page 66
BR_574.01_0613
Chapter 4.2.5
Coupling Peptides with Maleimide
Maleimide (MPBH) is a suitable chemical spacer for extending the free terminal
cysteine-containing peptide away from the surface of xMAP® Microspheres
(“beads”) for optimum reactivity with sample and reagents. A sample protocol for
coupling peptides to MPBH-modified xMAP Microspheres is described below.
Summary of Protocol
Add MPBH-coupled
microspheres
Wash microspheres w/
buffer
Incubate 1 hour
Wash and resuspend
microspheres w/ buffer
Add peptide
Materials Needed:
Reagents and Consumables
Vendor
MagPlex® Microspheres (MBPH-modified)
Peptide to couple
Any suitable source
100 mM Tris, pH 7.4
See Appendix A
Assay/Wash Buffer (PBS, 1% BSA)
See Appendix A
Storage Buffer (PBS-TBN)
Sigma P3813
Sigma A7888
Sigma P9416
0.1M Sodium Phosphate, 50mM NaCl pH 7.0
See Appendix A
1.5 mL microcentrifuge tubes
USA Scientific 1415-2500
or Eppendorf Lo Bind
022431081
Disposable pipettes tips
Any suitable brand
Distilled deionized water (ddH2O)
Any suitable source
Chapter 4.2.5 | Coupling Peptides with Maleimide
For complete equipment and
materials list see Appendix B
www.luminexcorp.com | Page 67
BR_574.01_0613
Protocol 4.2.5 Coupling peptides to maleimide-modified
microspheres
1. Resuspend stock maleimide-modified microsphere suspension by vortex and
sonication (15-30 seconds)
2. Remove an aliquot of 1 x 10⁵ maleimide microspheres and pellet by
centrifugation at ≥ 8000 x g, 1-2 minutes (or by using a magnetic separator)
and remove supernatant.
3. Resuspend maleimide microspheres at 1 x 10⁵/mL in 0.1 M Sodium Phosphate,
50 mM NaCl, pH 7.0 by vortex
4. Aliquot 1 x 10⁴ microspheres to each coupling reaction (100 μL)
5. Add peptide (100 μL, in 100 mM Tris, pH 7.4) to each 1 x 10⁴ microsphere
reaction
6. Incubate 1 hour at room temperature with shaking (protect from light)
7. Pellet by centrifugation at ≥ 8000 x g, 1-2 minutes (or by using a magnetic
separator) and remove supernatant.
8. Wash twice with PBS-1% BSA, (200-500 μL).
9. Resuspend coupled microspheres in PBS-TBN.
Note: Microspheres should be protected
from prolonged exposure to light
throughout this procedure.
Reaction Peptide titration
1 16.5 nmol
2 1.65 nmol
3 0.165 nmol
4 0.0165 nmol
5 0.00165 nmol
6 0.000165 nmol
7 0.0000165 nmol
Chapter 4.2.5 | Coupling Peptides with Maleimide
www.luminexcorp.com | Page 68
BR_574.01_0613
Chapter 4.3
Proteomics FAQ’s
For immunoassays, should you couple a polyclonal or
monoclonal antibody to the microspheres (“beads”)?
• Monoclonal antibodies are recommended because of their specificity.
• Polyclonal antibodies can be used after an affinity purification step.
• If options are limited, use what is available and check for possible crossreactivity with other analytes in the sample.
• As always, the success of the assay achieving the desired sensitivity and
specificity will depend on the quality of the reagents.
Do protein-protein interactions work on Luminex® Microspheres?
• Yes. An example of protein-protein interactions is a transcription complex where
proteins interact to influence gene expression.
• The difficulty with protein-protein interactions is the low affinity that proteins
have for each other.
• Multiplex IP-FCM (immunoprecipitation-flow cytometry): Principles and
guidelines for assessing physiologic protein-protein interactions in multiprotein
complexes. Bida AT, Gil D, Schrum AG. Methods. 2012 Feb;56(2):154-60. doi:
10.1016/j.ymeth.2011.09.005. Epub 2011 Sep 16. PMID: 21945581
• IP-FCM measures physiologic protein-protein interactions modulated by signal
transduction and small-molecule drug inhibition. Smith SE, Bida AT, Davis TR,
Sicotte H, Patterson SE, Gil D, Schrum AG. PLoS One. 2012;7(9):e45722. doi:
10.1371/journal.pone.0045722. Epub 2012 Sep 21. PMID: 23029201
Does Luminex recommend sources for antibody pairs?
• Luminex has used several sources including R&D Systems, Pharmingen,
Rockland, OEM, and Fitzgerald but recommends that customers consult their
preferred vendor. Quality and purity are of utmost importance.
• Manufacturers of ELISA kits often sell matched pairs that are easily transferable
to microspheres. Examples include but are not limited to, DuoSets® from
R&D Systems (Wood et al. 2011) and eBioscience (Rizzi et al. 2010). Many
publications list the source, catalog number and clone number for their
antibodies used (Bjerre et al. 2009; Carslon & Vignali 1999; de Jager et al. 2003;
de Jager et al. 2005; de Jager et al. 2009; Dernfalk, et al. 2004; Dernfalk et al.
2007; Lawson et al. 2010; Ray et al. 2005; Skogstrand et al. 2005). Many of the
assays built in these publications are common and Luminex suggests you use
these as a starting point to save time. The Antibody Resource website (http://
www.antibodyresource.com) is a good starting point to search for antibody
suppliers.
• When choosing raw materials (antibodies and recombinant proteins), select
vendors that have rigorous quality control procedures and provide as much
information as possible about the antibodies or proteins. Request that the
vendor provide purity information from SDS- and non-denaturing-PAGE. Also,
Chapter 4.3 | Proteomics FAQ’s
www.luminexcorp.com | Page 69
request profiles of the antibody from capillary isoelectric focusing to compare
lots from the same vendor. Luminex recommends that you devise your own
incoming materials quality control procedure to compare lots from antibody
suppliers.
• See other references for sources for antibody pairs:
• Bjerre, M., Hansen, T. K., Flyvbjerg, A., and Tonnesen, E. “Simultaneous
detection of porcine cytokines by multiplex analysis: Development of
magnetic bioplex assay.” Vet Immunol Immunopathol 2009; 130:53-8.
• Carson,R. T. and Vignali, D. A. A. “Simultaneous quantitation of 15 cytokines
using a multiplexed flow cytometric assay.” J Immunol Methods 1999; 227:4152.
• de Jager, W., te Velthuis, H., Prakken, B. J., Kuis, W., and Rijkers, G. T.
“Simultaneous detection of 15 human cytokines in a single sample of
stimulated peripheral blood mononuclear cells.” Clin Diagn Lab Immunol
2003; 10:133-9.
• de Jager, W., Prakken, B. J., Bijlsma, J. W. J., Kuis, W., and Rijkers, G. T.
“Improved multiplex immunoassay performance in human plasma and
synovial fluid following removal of interfering heterophilic antibodies.” J
Immunol Methods 2005; 300:124-35.
• de Jager, W., Bourcier, K., Rijkers, G. T., Prakken, B. J., and Seyfert-Margolis,
V. “Prerequisites for cytokine measurements in clinical trials with multiplex
immunoassays.” BMC Immunology 2009;10:U1-U11.
• Dernfalk, J., Waller, K. P., and Johannisson, A. “Commercially available
antibodies to human tumour necrosis factor-? tested for cross-reactivity with
ovine and bovine tumour necrosis factor-? using flow cytometric assays.”
Acta Vet Scand 2004; 45:99-107.
• Dernfalk, J., Waller, K. P., and Johannisson, A. “The xMAP technique can be
used for detection of the inflammatory cytokines IL-1?, IL-6 and TNF-? bovine
samples.” Vet Immunol Immunopathol 2007; 118:40-9.
• Faucher, S., Crawley, A. M., Decker, W., Sherring, A., Bogdanovic, D., Ding, T.,
Bergeron, M., Angel, J. B., and Sandstrom, P. “Development of a quantitative
microsphere capture assay for soluble IL-7 receptor alpha in human plasma.”
PLoS One 2009; 4:U66-U71.
• Lawson, S., Lunney, J., Zuckermann, F., Osorio, F., Nelson, E., Welbon, C.,
Clement, T., Fang, Y., Wong, S., Kulas, K., and Christopher-Hennings, J.
“Development of an 8-plex Luminex assay to detect swine cytokines for
vaccine development: Assessment of immunity after porcine reproductive
and respiratory syndrome virus (PRRSV) vaccination.” Vaccine 2010;
28:5356-64.
• Ray, C. A., Bowsher, R. R., Smith, W. C., Devanarayan, V., Willey, M. B., Brandt,
J. T., and Dean, R. A. “Development, validation, and implementation of a
multiplex immunoassay for the simultaneous determination of five cytokines
in human serum.” J Pharm Biomed Anal 2005; 36:1037-44.
• Rizzi, G., Zhang, Y. J., Latek, R., Weiner, R., and Rhyne, P. W. “Characterization
and development of a Luminex®-based assay for the detection of human IL23.” Bioanalysis 2010; 2:1561-72.
• Skogstrand, K., Thorsen, P., Norgaard-Pedersen, B., Schendel, D. E., Sorensen,
L. C., and Hougaard, D. M. “Simultaneous measurement of 25 inflammatory
markers and neurotrophinsin neonatal dried blood spots by immunoassay
with xMAP technology.” Clin Chem 2005; 51:1854-66.
• Wood, B., O’Halloran, K. and VandeWoude, S. “Development and validation
of a multiplex microsphere-based assay for detection of domestic cat (Felis
catus) cytokines.” Clin Vaccine Immunol 2011, doi:10.1128/CVI.00289-10
Chapter 4.3 | Proteomics FAQ’s
www.luminexcorp.com | Page 70
Should peptides be synthesized with a linker?
• Putting the linker on the beads makes peptide synthesis easier and cheaper.
• Adding a linker with a terminal amine on the peptide for coupling to
carboxylated microspheres is a suitable alternative.
Does an assay involving peptides require alternate assay buffers?
• It depends upon the assay format.
• If assaying for peptide specific antibodies then a normal immunoassay buffer
should suffice (like PBS-BSA).
• When using peptides to measure enzymatic reactions, a buffer optimal for that
assay would be required.
Do you have any recommendations for labeling proteins?
• Reagents may be ordered with reporter fluorophores directly labeled.
• We have had success labeling proteins with phycoerythrin using “PhycoLink” kits
from Prozyme (http://www.prozyme.com).
Coupling Polysaccharides
• For information regarding the coupling of polysaccharides to microspheres,
please refer to the following publication:
• Pickering, J.W., T.B. Martins, R.W. Greer, M.C. Schroder, M.E. Astill, C.M.
Litwin, S.W. Hildreth, and H.R. Hill. 2002. “A multiplexed fluorescent
microsphere immunoassay for antibodies to Pneumococcal capsular
polysaccharides.” American Journal of Clinical Pathology 117: 589-596.
• Biagini RE, Schlottmann SA, Sammons DL, Smith JP, Snawder JC,
Striley CA, MacKenzie BA, Weissman DN. “Method for simultaneous
measurement of antibodies to 23 pneumococcal capsular
polysaccharides.“ Clin Diagn Lab Immunol. 2003;10:744-750.
• Schlottmann, S., Jain, N., Chirmule, N.,Esser, M., (2006) “A Novel
Chemistry for Conjugating Pneumococcal Polysaccharides to Luminex
Microspheres.” Journal Of Immunological Methods 309:75-85.
Alternatives to BSA for blocking.
• Any non-specific protein can be used for blocking including many of the
commercially available blocking buffers.
• Do not use unpurified blockers such as non-fat milk.
Chapter 4.3 | Proteomics FAQ’s
www.luminexcorp.com | Page 71
Can streptavidin-R-phycoerythrin (SAPE) be used in assays
when the samples are in tissue culture media?
• Tissue culture generally contains a large amount of biotin.
• The SAPE will bind to the biotin in the media and not onto the detection
antibody.
• Here are some suggestions for a no-wash format with tissue culture samples:
• Use directly coupled detection antibody.
• Pre-combine the detection antibody and the SAPE (30-60 minutes) before
addition to the sample. By doing this the detection antibody and SAPE can
bind first before the free biotin can interfere.
How many PE molecules per MFI?
• Based on experiments using PE standards, the approximate molecules of PE per
MFI is:
• For Luminex 200, 23 PE/MFI at standard (low) PMT; 5 PE/MFI at high PMT.
• For FLEXMAP 3D, 15 PE/MFI at standard (low) PMT; 3 PE/MFI at high PMT.
• For MAGPIX, 23 PE/MFI.
What third-party data processing tools does Luminex
recommend?
• Millipore - MILLIPLEX Analyst
http://www.millipore.com/bmia/flx4/multiplex-assay-analysis-software
• Bio-Rad - BioPlex Manager
http://www.bio-rad.com/evportal/en/US/LSR/Category/45938d9d-c2ec-4ae49ed3-e7358a98d30b/Bio-Plex-Software
• MiraiBio - MasterPlex QT
http://www.miraibio.com/masterplex-qt-qt-luminex-quantitative-data-analysissoftware/
• Excel
• Sigma Plot
How do samples containing biological fluids perform on the
Luminex Instruments?
• As long as the reagents function in the biological matrix, the assay should work
on the Luminex platform with the proper optimization.
• A 1:5 dilution is a recommended starting point for samples containing serum
or plasma. Urine, CSF and synovial fluid may be run without dilution following
centrifugation or filtration.
• Assays can be performed in undiluted biological fluids and then diluted before
running on the Luminex platform.
• Often, routine assay processing includes a sufficient dilution with the addition of
the microspheres, detection antibody and fluorescent reporter.
• Assays may not be as sensitive in biological fluids as they are in buffer because
the fluids are less purified and may contain interferents. When running biological
fluids, remember to sanitize with 10-20% bleach and wash and soak with
distilled water at the end of the day to prevent clogging.
Chapter 4.3 | Proteomics FAQ’s
www.luminexcorp.com | Page 72
BR_574.01_0613
What signal is considered a ‘positive’ signal?
• Base this on the positive control. A general recommendation is that a positive
signal should be at least 2 standard deviations above background (or the
negative control).
Which buffers/solvents are compatible with the Luminex system?
• During the coupling procedure, avoid buffers that contain free amines that might
interfere with the coupling to the COOH sites on the beads.
• As the salt concentration of the buffer increases, the classification of the beads
in the flow analyzers may be effected causing the beads to spread out of the
region (i.e., SSC buffer).
• Avoid organic solvents as they will cause the internal classification dyes of the
beads to leach out causing misclassification.
Can formaldehyde be used to stop reactions on the Luminex
Microspheres?
• Formaldehyde or Para-formaldehyde can usually be used to stop reactions in
microsphere assays.
• The final concentration should be less than 1%.
• We recommend testing it with a small sample of beads coupled to reagents
before incorporating it fully into the procedure.
How much should you increase the amount of PE when
converting from monoplex to multiplex?
• Use cumulative concentration of simplex assay.
• There is no prescribed ratio of biotin to SA-RPE concentration because the
extent of biotinylation of detection antibodies is usually not known.
• Titration is recommended.
• More PE must be added for no-wash than wash.
What does it mean when there is a high RP1 peak in the zero bin
of the histogram?
• This may occur in no-wash assays where the RP1 signal on the bead is less than
the background signal.
• The Background Subtract algorithm of the software takes a background reading
before and after each bead.
• If the amount of fluorescence present in solution is greater than the fluorescence
on the beads themselves, zero values will be reported.
• This can be corrected by reducing the amount of reporter fluorescence or
washing samples before running them.
Chapter 4.3 | Proteomics FAQ’s
www.luminexcorp.com | Page 73
Can the Luminex platform analyze whole cell assays?
• The Luminex platform is not designed to analyze whole cells.
• Cell lysates can be analyzed as long as the viscosity of the sample is sufficiently
reduced before aspirating into the analyzer.
• This will have to be an empirical determination on the part of the user.
• The user needs to be aware of potential shifting of the beads due to composition
differences between sample core and sheath fluid.
How many events should be collected per analyte?
• 50-100 events is sufficient to obtain accurate results.
• Refer to Carson and Vignali (Carson, R.T. and D.A.A. Vignali, 1999,
“Simultaneous quantitation of 15 cytokines using a multiplexed flow cytometric
assay.” Journal of Immunological Methods). From the comparison, they concluded;
“The data derived from as few as 100 beads per cytokine assay was sufficient
to obtain accurate results. While all subsequent data presented here represent
the collection of approximately 100 events per cytokine per sample, comparable
results from fewer events may be possible.”
• Several studies (not published) have concluded that a minimum of 35 events is
required to obtain a statistically valid median result.
• Customer may want to carry out a similar study to determine the optimal
number of events to collect. In determining how many microsphere events
to collect in your sample, keep in mind that the output of the assay is median
fluorescence determined from the sample microspheres.
Chapter 4.3 | Proteomics FAQ’s
www.luminexcorp.com | Page 74
Chapter 5
Chapter 5
Genomic Applications
Genomic Applications
Chapter 5 | Genomic Applications
www.luminexcorp.com | Page 75
BR_574.01_0613
Chapter 5.1
Introduction: Development of Nucleic Acid
Assays
The following nucleic acid assay protocols presume that the user is familiar with
general assay development and optimization (including microsphere (“bead”)
coupling). This introduction is intended to review the genomic assay development
process only at a high level.
xMAP Technology is capable of a number of genomic assay formats such as
gene expression analysis, microRNA analysis, single nucleotide polymorphism
(SNP) analysis, specific sequence detection and other applications. Assays may
be developed by coupling sequence-specific capture oligos to MagPlex® beads,
or TAG sequences may be incorporated into assay reactions to capture onto
MagPlex®-TAG™ beads without the need to couple oligos.
Figure 13.
Figure 13 - Schematic of nucleic acid
Homozygous AA
A
assay analysis on Luminex® beads. Each
bead has a unique capture sequence
Signal
specific for a marker sequence. If reporter
molecules are generated and captured
(bead A) a fluorescence signal is detected.
a
f no reporter molecules are generated
A
a
and captured (bead a) minimal or
background signal is detected.
While there are a large number of scientific publications describing a variety of
Luminex genomic assays (www.luminexcorp.com/bibliography), the protocols
outlined in this guide describe a number of applications developed and tested in
the Luminex laboratory. These protocols focus on several genomic chemistries
captured to MagPlex-TAG Microspheres, but some may be applied, with suitable
modifications, to beads coupled with other sequences by the user.
Development of an effective xMAP-based nucleic acid assay is dependent on a
number of factors. One of the first things to consider is the purpose of the assay.
Depending on the application chosen, different types of starting nucleic acid and
other chemistry will be required to generate reporter molecules for data collection
with the Luminex platform.
Chapter 5.1 | Introduction: Development of Nucleic Acid Assays
www.luminexcorp.com | Page 76
BR_574.01_0613
In general, the steps involved in designing a xMAP-based nucleic acid assay are
described in the following workflow:
Identify assay application
• Gene expression
• SNP typing
• Sequence detection (CNV,
pathogen detection, etc.)
• miRNA analysis
Bead types needed
• Need to couple capture
molecules to beads?
• Can MagPlex-TAG beads be
used?
• What bead regions are
compatible with your
instrument?
Identify sample type and
type of nucleic acid starting
material required
Determine best chemistry
to generate reporter
molecules
• Tissue, cell culture, swabs,
etc.
• DNA or RNA input material
• Need to convert RNA to
DNA?
• Starting with DNA
preparation?
• Is PCR amplification of
target needed?
• Type of chemistry, PCR,
primer extension or
ligation-based application
Design probes for
specific chemistry and
optimization
Optimize and validate with
more probes to generate
complete multiplex mix
• Use bioinformation tools to
design suitable probes for
application
• Test low plex mixes to
optimize with assay
chemistry
• Is background low across all
probes and samples?
• Is specific signal for each
analyte maintained and
are expected patterns
observed?
• Is signal range acceptable
for accurate analysis?
Chapter 5.1 | Introduction: Development of Nucleic Acid Assays
www.luminexcorp.com | Page 77
BR_574.01_0613
Chapter 5.1.1
Oligo Ligation Assay (OLA) SNP Typing
The oligonucleotide ligation assay (OLA) is flexible, inexpensive and simple
approach for detecting SNPs and other sequence variations. The flexibility of
the assay has allowed its use for genotyping a number of different genes and
organisms (Bruse, Moreau et al. 2008, Schwartz, Pike-Buchanan et al. 2009,
Henry-Halldin, Nadesakumaran et al. 2012).
In OLA chemistry, one or more forward probes containing TAG sequences bind
adjacent to a common biotinylated downstream probe (Figure 14). The close
proximity of a bound OLA-TAG probe 3’ end with the OLA reporter probe 5’ end
enables enzymatic ligation to join them into a complete biotinylated reporter
molecule. If the OLA-TAG probe 3’ base is not complementary to the SNP variant
base, little or no ligation occurs and no significant signal is generated for analysis.
Note that OLA probes do not have primer binding sites for PCR amplification
as with other ligation chemistries. With this chemistry, signal amplification is
achieved by prior amplification of genomic target regions and multiple cycles of
the ligation reaction.
Figure 14. OLA Probe Design
Figure 14 - Oligo Ligation Assay (OLA)
involves two target-specific probes
Amplified genomic target region
that align adjacent to one another
A
T
allowing enzymatic ligation if an exact
Incorporation of TAG sequences enables
G
capture of each possible allele to a unique
TA
G
2
TA
G
1
match occurs at the target SNP site.
OLA-TAG Probes
Chapter 5.1.1 | Oligo Ligation Assay (OLA) SNP Typing
MagPlex-TAG microsphere (“beads”).
OLA Reporter Probe
www.luminexcorp.com | Page 78
BR_574.01_0613
Materials Needed:
Reagents and Consumables
Vendor
MagPlex®-TAG™ Microspheres
Luminex®
Primers for PCR amplification of gDNA target regions.
IDT or other vendor
OLA-TAG primers with 5’ TAG sequence and biotinylated OLA
reporter primers
IDT or other vendor
Qiagen HotStarTaq 2X Master Mix
Qiagen 203443 or
equivalent
Taq DNA Ligase and 10X Ligase Buffer
New England Biolabs
M0208S or equivalent
dNTPs stocks
Life Technologies™ 10297018 or equivalent
2X Tm Hybridization Buffer
See Buffer and Reagent
Recipes section
1X Tm Hybridization Buffer
See Buffer and Reagent
Recipes section
streptavidin-R-phycoerythrin (SAPE)
Moss SAPE-001G75, Life
Technologies S-866 or
equivalent
96-well PCR Plate
BioRad MSP9601
MicroSeal A
BioRad MSA5001
Magnetic separation plate (special order)
V&P Scientific VP771LD-4CS
or equivalent
Disposable pipette tips; multi- and single-channel (2-1000 mL)
Any suitable brand
RNase/DNase-Free Microcentrifuge Tubes 1.5 ml
USA Scientific or Equivalent
Barrier Pipette Tips
Any suitable brand
Vortex Mixer
Any suitable brand
Microcentrifuge
Any suitable brand
Bath Sonicator (40 - 55 kHz, frequency waves)
Any suitable brand
Centrifuge with Microplate Swinging Bucket Rotor
Eppendorf 5704 or
equivalent
Brayer roller, soft rubber or silicon
USA Scientific 9127-2940
Thermocycler with 96-well Head and Heated Lid
Any suitable brand
Luminex Instrument with xPONENT 3.1 or higher software
Luminex
For complete equipment and
materials list see Appendix B
Note: Molecular grade ddH2O should
be used for all nucleic acid protocols.
OLA Buffer and Reagent Recipes
Step
Notes
MagPlex®-TAG™
Microspheres from
Luminex
Required Microspheres regions should be purchased from Luminex.
They should be stored at 4°C in the dark. For multiplex assays,
combine different bead regions as directed in the protocol. To assist
with making multiplex a Microsphere Stock Mix from individual bead
stocks, an Excel based bead calculator is available for determining the
method and volumes needed for making the bead mix contact your
Luminex representative or visit www.luminexcorp.com.
Enzymes and Enzyme
Reaction Buffers
All enzymes and their reaction buffers can be used as directed in the
protocol.
Chapter 5.1.1 | Oligo Ligation Assay (OLA) SNP Typing
www.luminexcorp.com | Page 79
BR_574.01_0613
PCR amplification primers
for gDNA targets
Proper design of these primers for amplification of target regions
is required for optimum assay performance. Recommendations for
primer designs include
1. PCR primers should be designed to amplify gDNA target regions
containing the SNP(s) of interest.
2. PCR primers should not be labeled.
3. Amplicon size is not restricted.
These primers can be purchased from multiple vendors. Upon
receipt, the primers should be dissolved or diluted with molecular
grade distilled-deionized H2O (ddH2O) to a concentration of 1 mM
(1 nanomole/μL). They can be stored as individual stocks at -20°C.
Pooled mixes can be made to deliver 0.2 μM of each primer/ PCR
reaction or as your gDNA protocol requires.
OLA-TAG and biotinylated
OLA reporter primers
OLA primers can be ordered from several oligo manufacturers. Upon
receipt, they should be resuspended in molecular grade ddH2O to
1 mM (1 nanomole/μL). Make a 100 nM OLA-TAG probe mix by
combining and diluting each 1 mM stock 1:10,000 into one tube with
molecular grade ddH2O. Make a 5 μM OLA reporter probe mix by
combining and diluting each 1 mM stock 1:200 into one tube with
molecular grade ddH2O. Individual stocks and probe mixes should be
stored at -20°C.
OLA primer design factors
1. OLA probes should be synthesized for all sequence variants and all
OLA-TAG and OLA reporter pairs for each target should be from the
same DNA strand.
2. OLA probes should be matched for melting temperature at 51-56°C.
3. OLA-TAG probes should extend out to and include the SNP as the 3’
nucleotide.
4.Use oligo design software to select an appropriate TAG sequence.
5. The OLA-TAG probe is synthesized with the TAG sequence
incorporated at the 5’ end.
6. The OLA reporter probe should have a melting temperature of 5156°C.
7. The OLA reporter probe’s 5’ base should be the nucleotide
immediately downstream from the SNP variant nucleotide.
8. The OLA reporter probe must be modified with phosphate at the 5’
end and with biotin at the 3’ end.
9. If two SNPs are close enough so that OLA-TAG and reporter probes
overlap, target the second SNP on the opposite strand.
dNTPs
These can be purchased from several vendors such as Life
Technologies™ (10297-018). A 25 mM stock mix can be made by
mixing equal amounts of 100 mM dATP, dTTP, dCTP, and dGTP for
the 4dNTP stock mix for gDNA amplification. Individual stocks and
concentrated mixes should be stored at -20°C.
2X Tm Hybridization Buffer
The buffer’s composition is 0.4 M NaCl, 0.2 M Tris, 0.16% Triton
X-100, pH 8.0. It should be filter sterilized and stored at 4°C.
1X Tm Hybridization Buffer
The buffer’s composition is 0.2 M NaCl, 0.1 M Tris, 0.08% Triton
X-100, pH 8.0. It should be filter sterilized and stored at 4°C.
streptavidin-Rphycoerythrin (SAPE)
SAPE at can be purchased from a number of suppliers such as
Moss Incorporated (SAPE-001G75), Life Technologies™ (S866) or
equivalent. A working aliquot should be made fresh by diluting with
1X Tm Hybridization buffer to the required volume and concentrations
needed as indicated in the wash or no wash protocols.
Chapter 5.1.1 | Oligo Ligation Assay (OLA) SNP Typing
www.luminexcorp.com | Page 80
BR_574.01_0613
Protocol 5.1.1 – OLA SNP Typing
Genomic Target Sequence Amplification
Multiplexed PCR amplification of genomic target regions containing SNPs of
interest should be performed under optimized conditions. The parameters listed
below are for example purposes only and may not be optimum for your samples or
any specific genomic amplification kit you may be using.
Each final reaction contains:
Reagent
Amount
gDNA template
50 ng
Qiagen PCR reaction buffer
1X
MgCl2
1.5 mM
dNTP
200 μM each
primer
0.2 μM each
Qiagen HotStar or other Taq polymerase
2.5 Units
Amplification of target regions can be done with the following PCR Cycling
Parameters:
Temperature
Time
Cycle
95°C
15 minutes (for enzyme activation)
94°C
30 seconds
55°C
30 seconds
72°C
30 seconds
72°C
7 minutes
4°C
Hold
35 cycles
Multiplex OLA Reaction
Prior to making the 2X OLA Master Mix, make stocks of 100 nM OLA-TAG primer
mix and 5 μM OLA reporter mix as directed in the OLA Buffer and Reagent Recipes
section.
1. Make a 2X OLA Master Mix as follows:
Reagent
Amount
10X Taq Ligase buffer
2.0 μL
Taq DNA Ligase (40,000 U/mL)
0.25 μL
OLA-TAG primer mix (100 nM each)
1.0 μL
OLA reporter mix (5 μM each)
1.0 μL
ddH2O (Molecular Grade)
5.75 μL
Total volume=
Chapter 5.1.1 | Oligo Ligation Assay (OLA) SNP Typing
10 μL
www.luminexcorp.com | Page 81
BR_574.01_0613
2. Assemble OLA reactions in 20 μL total volume for each sample as follows:
Reagent
Amount
2X OLA Master Mix
10 μL
Amplified genomic targets (0.5 to 5 μL)
Y μL
ddH2O (Molecular Grade) as needed (to 20 μL )
X μL
Total volume=
20 μL
3. Mix OLA reactions by pipetting up and down several times.
4. Cover plate with a plate sealer and perform multiple rounds of ligation in a
thermal cycler with the following parameters:
Temperature
Time
96°C
2 minutes
94°C
15 seconds
37°C
1 minute
4°C
Hold
Cycle
30 cycles
5. Proceed to hybridization with MagPlex-TAG Microspheres using a wash or no
wash protocol.
Hybridization to MagPlex-TAG Microspheres- wash protocol
1. Select the appropriate MagPlex-TAG microsphere sets and resuspend
according to the instructions described in the Product Information Sheet
provided with your microspheres (beads).
2. Combine 2500 microspheres of each set per reaction. (Note: If needed,
an Excel based bead calculator is available for determining the method
and volumes needed for making the bead mix. Contact your Luminex
representative or visit www.luminexcorp.com.)
3. Dilute/concentrate the MagPlex-TAG microsphere mixture to 100 of each
microsphere set per μL in 2X Tm Hybridization Buffer and mix by vortex and
sonication for approximately 20 seconds.
4. Aliquot 25 μL of the MagPlex-TAG microsphere mixture to each well.
5. Add 5 to 25 μL of each OLA reaction to appropriate wells (Note: 1-5 μL is
usually sufficient) and add 25 μL of dH2O to each background well.
6. Adjust the total volume to 50 μL by adding the appropriate volume of dH2O to
each sample well that received less than 25 μL of OLA reaction.
7. Cover the plate with MicroSeal A film to prevent evaporation and hybridize in
a thermal cycler with the following parameters;
96°C for 90 seconds
37°C for 30 minutes
8. Pellet the MagPlex-TAG Microspheres by placing the plate on a magnetic
separator for 30 to 60 seconds.
9. After the beads have pelleted, remove the supernatant being careful not to
disturb the bead pellets.
10. Resuspend the pelleted MagPlex-TAG Microspheres in 75 μL of 1X Tm
Hybridization Buffer on a magnetic separator for 30 to 60 seconds.
11. After the beads have pelleted, remove the supernatant being careful not to
disturb the bead pellets.
Chapter 5.1.1 | Oligo Ligation Assay (OLA) SNP Typing
Note: Microspheres should be
protected from prolonged exposure to
light throughout this procedure.
www.luminexcorp.com | Page 82
BR_574.01_0613
12. Repeat steps 8 to 11 for a total of two washes.
13. Resuspend microspheres in 75 μL of 1X Tm Hybridization Buffer containing
2-8 μg/mL SAPE.
14. Incubate at 37°C for 15 minutes.
15. Analyze 50 μL at 37°C on the Luminex analyzer according to the system
manual.
Hybridization to MagPlex-TAG Microspheres- no wash protocol
1. Select the appropriate MagPlex-TAG microsphere sets and resuspend
according to the instructions described in the Product Information Sheet
provided with your microspheres.
2. Combine 2500 microspheres of each set per reaction.
3. Dilute/concentrate the MagPlex-TAG microsphere mixture to 111 of each
microsphere set per μL in 1X Tm Hybridization Buffer and mix by vortex and
sonication for approximately 20 seconds.
4. Aliquot 22.5 μL of the MagPlex-TAG microsphere mixture to each well.
5. Add 2.5 μL of dH2O to each background well.
6. Add 2.5 μL of each sample to the appropriate wells.
7. Cover the plate with MicroSeal A film to prevent evaporation and hybridize in
a thermal cycler with the following parameters;
96°C for 90 seconds
37°C for 30 minutes
8. Prepare SAPE Mix by diluting SAPE to 10 μg/mL in 1X Tm Hybridization Buffer.
9. Add 100 μL SAPE Mix to each well. Mix gently.
10. Incubate at 37°C for 15 minutes.
11. Analyze 100 μL at 37°C on a Luminex analyzer according to the system
manual.
Note: If needed, an Excel based
bead calculator is available for
determining the method and volumes
needed for making the bead mix.
Contact your Luminex representative
or visit www.luminexcorp.com.
Recommendations for Optimization and Troubleshooting
Low Reporter Intensity
1. Verify the production of the genomic target PCR products (OLA templates) on
agarose gels.
2. Verify the hybridization assay by direct hybridization to 5 and 50 femtomoles
of labeled oligonucleotide targets (i.e., biotinylated TAGs).
3. Titrate the gDNA input for target region generation to determine the optimal
amount for OLA reaction.
4. Titrate the gDNA amplified template input into OLA reaction to determine the
optimal amount of template.
5. Titrate the allele-specific and reporter probe inputs to determine optimal
concentrations for OLA.
6. Increase the number of cycles in the OLA reaction.
7. Decrease and/or increase the OLA annealing temperature.
8 Check the primer and template sequences for potential secondary structure.
9. Redesign the PCR primers.
10. Redesign the OLA probes for the opposite DNA strand.
11. Lengthen the OLA probes.
Chapter 5.1.1 | Oligo Ligation Assay (OLA) SNP Typing
Note: An allele-specific to reporter
probe ratio of 1:50 improves the
probability that an allele-specific
probe will anneal adjacent to a
reporter probe.
www.luminexcorp.com | Page 83
BR_574.01_0613
Poor Discrimination
1. Increase the OLA annealing temperature.
2. Redesign the OLA probes for the opposite DNA strand.
3. Shorten the “leaky” OLA probe.
Poor Reporter Distribution Between Alleles
1. Redesign the OLA probes for the opposite DNA strand.
2. Lengthen the OLA probes to increase signal on the “low” allele.
3. Shorten the OLA probes to decrease signal on the “high” allele.
High Background
1. If not using SAPE already containing BSA (i.e., Moss SAPE-001G75), dilute
SAPE in 1X Tm buffer containing BSA. Final BSA concentration in the reaction
should be 0.1% BSA in the reaction.
2. If the high background is due to contamination of the PCR reaction, replace the
PCR reagents.
3. If high background is observed for the hybridization negative control, replace
the hybridization reagents.
4. If high background is observed for the OLA negative control, replace the OLA
reagents.
References
• Bruse, S., et al. (2008). “Improvements to bead-based oligonucleotide ligation
SNP genotyping assays.” Biotechniques 45(5): 559 - 571.
• Henry-Halldin, C. N., et al. (2012). “Multiplex Assay for Species Identification
and Monitoring of Insecticide Resistance in Anopheles punctulatus Group
Populations of Papua New Guinea.” American Journal Of Tropical Medicine And
Hygiene 86(1): 140-151.
• Schwartz, K., et al. (2009). “Identification of Cystic Fibrosis Variants by
Polymerase Chain Reaction/Oligonucleotide Ligation Assay.” Journal Of
Molecular Diagnostics 11(3): 211-215.
Chapter 5.1.1 | Oligo Ligation Assay (OLA) SNP Typing
www.luminexcorp.com | Page 84
BR_574.01_0613
Chapter 5.1.2
Allele-Specific Primer Extension (ASPE) SNP
Typing
Allele Specific Primer Extension (ASPE) is a flexible, inexpensive and simple
chemistry for detecting SNPs and other sequence variations. The flexibility of the
assay has allowed its use for genotyping typing a number of different genes and
organisms (Francis DM 2012,Koo, Ong et al. 2007, Li, Luo et al. 2011, Li, Jortani et
al. 2011, Marcil, Sinnett et al. 2012).
Figure 15. ASPE mechanism
Figure 15 - Allele-Specific Primer
Extension (ASPE) involves target-
A
specific primer with 3’ bases matching
A
T
3’
TA
G
1
the possible SNP alleles of interest. A) A
dATP, dTTP, dGTP,
dCTP
2
5’
G
3’
primer anneals to the target region with
its 3’ end aligned at the SNP site. B) If
TA
G
the primer finds a perfect match at the
3’ base (as with TAG1 probe) then DNA
5’
polymerase is able to extend the primer,
B
thereby incorporating labeled dNTP’s
A
T
3’
TA
G
1
downstream. Primers with a 3’ mismatch
G
3’
TA
G
2
5’
dATP, dTTP, dGTP,
dCTP
5’
The chemistry takes advantage of a primer’s ability to act as a suitable primer for a
DNA polymerase when the probe 3’ base is complementary to the target SNP’s base
(Figure 15A). When a probe 3’ base is complementary, the polymerase can use it
to synthesize new DNA containing biotin labeled nucleotides, but a primer cannot
promote this extension if its 3’ base is mismatched (Figure 15B). With several rounds
of primer extension, significant quantities of labeled molecules are produced to
generate the signals required for analysis of multiple genotypes in one reaction.
at the SNP site (as with TAG2 probe) are
not extended and no labeled dNTP’s are
incorporated. Inclusion of TAG sequences
enables capture of each possible allele
to a unique MagPlex-TAG Microsphere
(“bead”).
To take advantage of this chemistry with the xMAP platform, each ASPE primer that
identifies a SNP variation needs a unique TAG sequence on its 5’ end (Figure 15). In
addition, for each SNP, gDNA targets containing SNPs of interest must be amplified
before testing with ASPE probe mixes. This is achieved using standard multiplex PCR
amplification methods (Figure 16). Target genomic amplicons can be of various sizes
containing multiple SNP targets.
This combination of gDNA target amplification, primer function for variant
detection, and multiplexing with xMAP beads, often allows this chemistry to be
more reliable than other applications for typing SNP variations in the same reaction.
Chapter 5.1.2 | Allele-Specific Primer Extension (ASPE) SNP Typing
www.luminexcorp.com | Page 85
BR_574.01_0613
Figure 16. Amplifications of gDNA target regions of interest
Figure 16 - Genomic DNA is amplified in
the region of each SNP prior to performing
ASPE assay using standard multiplex
Chr. 1 pair
Chr. 2 pair
Chr. 3 pair
Chr. 4 pair
Chr. 6 pair
Chr. 7 pair
PCR amplification. Amplified targets
may be of various lengths and may even
contain multiple SNPs.
Chr. 5 pair
Targeted PCR
Chr. 1 pair
Chr. 2 pair
Chr. 3 pair
Chr. 4 pair
Chr. 6 pair
Chr. 7 pair
Chr. 5 pair
Materials Needed:
Reagents and Consumables
Vendor
MagPlex®-TAG™ Microspheres
Luminex
Primers for PCR amplification of gDNA target regions.
IDT or other vendor
ASPE primers with 5’ TAG sequences
IDT or other vendor
Qiagen HotStarTaq 2X Master Mix
Qiagen, 203443 or equivalent
ExoSAP-IT or separate Exo I and SAP
GE Healthcare US78200, or
equivalent
Platinum Tsp DNA polymerase, 10X PCR Buffer, 50 mM MgCl2
Invitrogen, 11448-024 or
equivalent
Biotin-14-dCTP
Invitrogen, 19518-018 or
equivalent
dNTPs stocks
Life Technologies™ 10297-018 or
equivalent
2X Tm Hybridization Buffer
See Buffer and Reagent Recipes
section
1X Tm Hybridization Buffer
See Buffer and Reagent Recipes
section
streptavidin-R-phycoerythrin (SAPE)
Moss SAPE-001G75, Life
Technologies S-866 or equivalent
96-well PCR Plate
BioRad MSP9601
96-well Bead Hybridization Plate (optional)
Corning Costar 6509
MicroSeal A
BioRad MSA5001
Magnetic separation plate (special order)
V&P Scientific VP771LD-4CS or
equivalent
Disposable pipette tips; multi- and single-channel (2-1000 mL)
Any suitable brand
25mL reservoirs (divided well)
Any suitable brand
RNase/DNase-Free Microcentrifuge Tubes 1.5 ml
USA Scientific or Equivalent
Barrier Pipette Tips
Any suitable brand
Chapter 5.1.2 | Allele-Specific Primer Extension (ASPE) SNP Typing
For complete equipment and
materials list see Appendix B
Note: Molecular grade ddH2O should
be used for all nucleic acid protocols.
www.luminexcorp.com | Page 86
BR_574.01_0613
Vortex Mixer
Any suitable brand
Microcentrifuge
Any suitable brand
Bath Sonicator (40 - 55 kHz, frequency waves)
Any suitable brand
Centrifuge with Microplate Swinging Bucket Rotor
Eppendorf 5704 or equivalent
Brayer roller, soft rubber or silicon
USA Scientific 9127-2940
Thermocycler with 96-well Head and Heated Lid
Any suitable brand
Luminex Instrument with xPONENT 3.1 or higher software
Luminex
ASPE Buffer and Reagent Recipes
Step
Notes
MagPlex-TAG
Microspheres from
Luminex
Required Microspheres regions should be purchased from Luminex.
They should be stored at 4°C in the dark. For multiplex assays,
combine different bead regions as directed in the protocol.
Enzymes and Enzyme
Reaction Buffers
All enzymes and their reaction buffers can be used as directed in the
protocol.
PCR amplification primers
for gDNA targets.
Proper design of these primers for amplification of target regions
is required for optimum assay performance. Recommendations for
primer designs include
1. PCR primers should be designed to amplify gDNA target regions
containing the SNP(s) of interest.
2. PCR primers should not be labeled.
3. Amplicon size is not restricted.
These primers can be purchased from multiple vendors. Upon receipt,
the primers should be dissolved or dilute with molecular grade ddH2O
to a concentration of 1 mM (1 nanomole/μL). They can be stored as
individual stocks at -20°C. Pooled mixes can be made to deliver 0.2
μM of each primer/ PCR reaction or as your gDNA protocol requires.
ASPE primers with 5’ TAG
sequence
ASPE primers can be ordered from several oligo manufacturers, such
as IDT. Upon receipt, they should be resuspended in molecular grade
ddH2O to 1 mM (1 nanomole/μL). Individual stocks and concentrated
mixes should be stored at -20°C.
When designing the ASPE
primers the following
factors should be
considered.
1. ASPE primers should be synthesized for all sequence variants and
should be from the same DNA strand for each target sequence.
2. ASPE primers should be matched for melting temperature at 5156°C.
3. ASPE primers should extend out to and include the SNP variant base
as the 3’ nucleotide.
4. Use oligo design software to select an appropriate TAG sequence.
5. The ASPE primer is designed to include the TAG sequence in its 5’
end.
6. If two SNPs are close enough such that the TAG-ASPE primers will
overlap, target the second SNP on the opposite strand.
dNTPs
These can be purchased from several vendors such as Life
Technologies™ (10297-018). A 25 mM stock mix can be made by
mixing equal amounts of 100 mM dATP, dTTP, dCTP, and dGTP for
the 4dNTP stock mix for gDNA amplification. Individual stocks and
concentrated mixes should be stored at -20°C.
Biotin-14-dCTP
Biotin labeled dCTP can be purchased from several sources including
Life Technologies™. (Invitrogen, 19518-018). It is supplied at 0.4 mM
in 100 mM Tris-HCl (pH 7.5), 0.1 mM EDTA. Store at -20°C and use as
indicated in the protocol.
Chapter 5.1.2 | Allele-Specific Primer Extension (ASPE) SNP Typing
www.luminexcorp.com | Page 87
BR_574.01_0613
2X Tm Hybridization Buffer
The buffer’s composition is 0.4 M NaCl, 0.2 M Tris, 0.16% Triton
X-100, pH 8.0. It should be filter sterilized and stored at 4°C.
1X Tm Hybridization Buffer
The buffer’s composition is 0.2 M NaCl, 0.1 M Tris, 0.08% Triton
X-100, pH 8.0. It should be filter sterilized and stored at 4°C.
streptavidin-Rphycoerythrin (SAPE)
SAPE at 1 mg/ml can be purchased from a number of suppliers such
as Moss Incorporated (SAPE-001G75), Life Technologies™ (S866) or
equivalent. A working aliquot should be made fresh by diluting with
1X Tm Hybridization buffer to the required volume and concentrations
needed as indicated in the wash or no wash protocols.
Protocol 5.1.2 - for ASPE SNP Typing
Genomic Target Sequence Amplification
Multiplexed PCR amplification of genomic target regions containing SNPs of
interest should be performed under optimized conditions. The parameters listed
below are for example purposes only and may not be optimum for your samples or
any specific genomic amplification kit you may be using.
Each final reaction contains:
Reagent
Amount
gDNA template
50 ng
Qiagen PCR reaction buffer
1X
MgCl2
1.5 mM
dNTP
200 μM each
primer
0.2 μM each
Qiagen HotStar or other Taq polymerase
2.5 Units
Amplification of target regions can be done with the following PCR Cycling
Parameters:
Temperature
Time
95°C
15 minutes (for enzyme activation)
94°C
30 seconds
55°C
30 seconds
72°C
30 seconds
72°C
7 minutes
4°C
Hold
Chapter 5.1.2 | Allele-Specific Primer Extension (ASPE) SNP Typing
Cycle
35 cycles
www.luminexcorp.com | Page 88
BR_574.01_0613
EXO/SAP treatment for the removal of unused primers.
Treat 7.5 μL of each PCR reaction with ExoSAP-IT according to the following
procedure:
Reagent
Amount
PCR Reaction
7.5 μL
ExoSAP-IT
3.0 μL
Total volume=
10.5 μL
Mix and incubate in a thermal cycler with the following protocol
Temperature
Time
37°C
30 minutes
80°C
15 minutes
4°C
Hold (or store at -20°C)
Detailed Multiplex ASPE Reaction Protocol
Prior to making the 2X ASPE Master Mix dilute the 1mM ASPE-TAG primer mix
1:2000 (500 nM each) and the 100 mM 3 dNTP stock 1:1000 (100 μM each).
1. Make a 2x ASPE Master Mix as follows:
Reagent
Amount
10X PCR reaction buffer
2.0 μL
50 mM MgCl2
0.5 μL
TAG-ASPE primer mix (500 nM each)
1.0 μL
Tsp DNA polymerase (5 U/μL)
0.15 μL
3 dNTP mix (-dCTP) (100 μM each)
1.0 μL
400 μM biotin-dCTP
0.25 μL
ddH2O (Molecular Grade)
5.1 μL
Total volume=
10 μL
2. Assemble the ASPE reactions in 20 μL total volume for each sample as follows:
Reagent
Amount
2X ASPE Master Mix
10 μL
Target EXO treated PCR Use up to
Y μL
ddH2O as needed (to 20 μL)
X μL
Total volume=
20 μL
3. Mix each ASPE reaction by pipetting up and down several times.
Chapter 5.1.2 | Allele-Specific Primer Extension (ASPE) SNP Typing
www.luminexcorp.com | Page 89
BR_574.01_0613
4. Cover plate with a plate sealer and perform multiple rounds of primer extension
in a thermal cycler with the following parameters: (Note: The temperature of the
1 minute hybridization step can be adjusted to what is needed for different probe
mixes.)
Temperature
Time
96°C
2 minutes
94°C
30 seconds
55°C
1 minute
37°C
2 minutes
4°C
Hold
Cycle
30 cycles
5. Proceed to hybridization with MagPlex-TAG Microspheres using a wash or no
wash protocol.
Hybridization to MagPlex-TAG Microspheres- wash protocol
1. Select the appropriate MagPlex-TAG microsphere sets and resuspend
according to the instructions described in the Product Information Sheet
provided with your microspheres (beads).
2. Combine 2500 microspheres of each set per reaction. (Note: If needed,
an Excel based bead calculator is available for determining the method
and volumes needed for making the bead mix. Contact your Luminex
representative or visit www.luminexcorp.com.)
3. Dilute/concentrate the MagPlex-TAG microsphere mixture to 100 of each
microsphere set per μL in 2X Tm Hybridization Buffer and mix by vortex and
sonication for approximately 20 seconds.
4. Aliquot 25 μL of the MagPlex-TAG microsphere mixture to each well.
5. Add 5 to 25 μL of each ASPE reaction to appropriate wells (Note: 1-5 μL is
usually sufficient) and add 25 μL of dH2O to each background well.
6. Adjust the total volume to 50 μL by adding the appropriate volume of dH2O to
each sample well that received less than 20 μL of extension reaction.
7. Cover the plate with MicroSeal A film to prevent evaporation and hybridize in
a thermal cycler with the following parameters;
96°C for 90 seconds
37°C for 30 minutes
8. Pellet the MagPlex-TAG Microspheres by placing the plate on a magnetic
separator for 30 to 60 seconds. .
9. After the beads have pelleted, remove the supernatant being careful not to
disturb the bead pellets.
10. Resuspend the pelleted MagPlex-TAG Microspheres in 75 μL of 1X Tm
Hybridization Buffer on a magnetic separator for 30 to 60 seconds.
11. After the beads have pelleted, remove the supernatant being careful not to
disturb the bead pellets.
12. Repeat steps 8 and 11. This is a total of two washes.
13. Resuspend microspheres in 75 μL of 1X Tm Hybridization Buffer containing 2-8
μg/mL SAPE.
14. Incubate at 37°C for 15 minutes.
15. Analyze 50 μL at 37°C on the Luminex analyzer according to the system
manual.
Chapter 5.1.2 | Allele-Specific Primer Extension (ASPE) SNP Typing
Note: Microspheres should be
protected from prolonged exposure to
light throughout this procedure.
www.luminexcorp.com | Page 90
BR_574.01_0613
Hybridization to MagPlex-TAG Microspheres- no wash protocol
1. Select the appropriate MagPlex-TAG microsphere sets and resuspend
according to the instructions described in the Product Information Sheet
provided with your microspheres (beads).
2. Combine 2500 microspheres of each set per reaction.
3. Dilute/concentrate the MagPlex-TAG microsphere mixture to 111 of each
microsphere set per μL in 1X Tm Hybridization Buffer and mix by vortex and
sonication for approximately 20 seconds.
4. Aliquot 22.5 μL of the MagPlex-TAG microsphere mixture to each well.
5. Add 2.5 μL of dH2O to each background well.
6. Add 2.5 μL of each sample to the appropriate wells.
7. Cover the plate with MicroSeal A film to prevent evaporation and hybridize in
a thermal cycler with the following parameters;
96°C for 90 seconds
37°C for 30 minutes
8. Prepare Reporter Mix by diluting SAPE to 10 μg/mL in 1X Tm Hybridization
Buffer.
9. Add 100 μL Reporter Mix to each well. Mix gently.
10. Incubate at 37°C for 15 minutes.
11. Analyze 100 μL at 37°C on the Luminex analyzer according to the system
manual.
Note: If needed, an Excel based bead
calculator is available for determining
the method and volumes needed for
making the bead mix. Contact your
Luminex representative or visit www.
luminexcorp.com.
Recommendations for Optimization and Troubleshooting xTAG
with ASPE Assays
Low Reporter Intensity
1. Verify the production of the PCR products (ASPE templates) on agarose gels.
2. Verify the hybridization assay by direct hybridization to 5 and 50 femtomoles
of labeled oligonucleotide targets (i.e., biotinylated TAGs).
3. Titrate the target input to determine the optimal amount for hybridization.
4. Titrate the template input to determine the optimal amount for ASPE.
5. Titrate the biotinylated dCTP input to determine the optimal concentration for
ASPE.
6. Increase the number of cycles in the ASPE reaction.
7. Decrease and/or increase the ASPE annealing temperature.
8. Check the primer and template sequences for potential secondary structure.
9. Redesign the PCR primers.
10. Redesign the ASPE primers for the opposite DNA strand.
11. Lengthen the ASPE primers.
Poor Discrimination
1. Increase the ASPE annealing temperature.
2. Redesign the ASPE primers for the opposite DNA strand.
3. Shorten the “leaky” ASPE primer.
Chapter 5.1.2 | Allele-Specific Primer Extension (ASPE) SNP Typing
www.luminexcorp.com | Page 91
BR_574.01_0613
Poor Reporter Distribution Between Alleles
1. Redesign the ASPE primers for the opposite DNA strand.
2. Lengthen the ASPE primer to increase signal on the “low” allele.
3. Shorten the ASPE primer to decrease signal on the “high” allele.
High Background
1. 1. If not using SAPE already containing BSA (i.e., Moss SAPE-001G75), dilute
SAPE in 1X Tm buffer containing BSA. Final BSA concentration in the reaction
should be 0.1% BSA in the reaction.
2. If high background is observed for the PCR negative control, verify
performance of the Exo/SAP step.
3. If the high background is due to contamination of the PCR reaction, replace the
PCR reagents.
4. If high background is observed for the hybridization negative control, replace
the hybridization reagents.
5. If high background is observed for the ASPE negative control, replace the ASPE
reagents.
References
• Francis DM, 2012. “DNA Sequence Variation (SNP) Genotyping Using Allele
Specific Primer Extension (ASPE) with the Luminex platform.” The Ohio State
University web site at http://www.extension.org/pages/32476/dna-sequencevariation-snp-genotyping-using-allele-specific-primer-extension-aspe-with-theluminex-pl
• Koo, S., T. Ong, K. Chong, C. Lee, F. Chew and E. Lee (2007). “Multiplexed
genotyping of ABC transporter polymorphisms with the Bioplex suspension
array.” Biological Procedures Online: 27-42.
• Li, G., X. Luo, J. He, Z. Zhu, G. Yu, H. Qin, T. Zeng, Z. Liu, S. Wu, J. Xu and L. RenHeidenreich (2011). “A novel liquid chip platform for simultaneous detection of
70 alleles of DNA somatic mutations on EGFR, KRAS, BRAF and PIK3CA from
formalin-fixed and paraffin-embedded slides containing tumor tissue.” Clinical
Chemistry And Laboratory Medicine 49(2): 191-195.
• Li, Y., S. Jortani, B. Ramey-Hartung, E. Hudson, B. Lemieux and H. Kong (2011).
“Genotyping three SNPs affecting warfarin drug response by isothermal realtime HDA assays.” Clinica Chimica Acta 412: 79-85.
• Marcil, V., D. Sinnett, E. Seidman, F. Boudreau, F. P. Gendron, J. F. Beaulieu,
D. Menard, M. Lambert, A. Bitton, R. Sanchez, D. Amre and E. Levy (2012).
“Association between genetic variants in the HNF4A gene and childhood-onset
Crohn’s disease.” Genes And Immunity 13(7): 556 - 565.
Chapter 5.1.2 | Allele-Specific Primer Extension (ASPE) SNP Typing
www.luminexcorp.com | Page 92
BR_574.01_0613
Chapter 5.1.3
Target-Specific PCR Sequence Detection with
MagPlex®-TAG™ Microspheres (“beads”)
There are a number of different PCR approaches to generate reporter molecules
for detecting sequences in different types of samples. These approaches have
been used for a number of applications including the detection of various
pathogens (Babady, Mead et al. 2012). With standard PCR reaction chemistries,
double-stranded PCR amplicons are generated along the whole length of the target
sequence and primers. These double stranded amplicons can generate low signals
since the biotin labeled TAG strand will preferentially bind its complementary
anti-TAG strand rather than the complementary anti-TAG sequence on the beads.
Elimination or reduction of the amount of unlabeled complementary strand
can be achieved with more complex protocols involving enzyme treatments or
asymmetric PCR chemistries.
A simpler and more straightforward approach is to prevent synthesis of the antiTAG complementary portion of the amplicon during the PCR reaction. This can
be achieved with the use of a TAG containing primer where the TAG sequence
is separated from the sequence specific portion of the primer with an internal
spacer (Figure 17A). When this TAG primer is combined with a sequence-specific
5’ biotinylated reverse primer, an amplicon containing a single-stranded TAG
overhang and a sequence specific double-stranded biotinylated region is generated
(Figure 17B). The TAG portions of these amplicons do not have a competing antiTAG complementary strand to inhibit binding to the anti-TAG sequences on the
MagPlex-TAG beads (Figure 17C).
Figure 17. Outline of Target-Specific PCR probe design and chemistry
Figure 17 - Target-Specific PCR sequence
detection involves (A) a TAG-containing
Sequence Specific Region
gDNA
5’
primer separated from the sequencespecific portion by an internal spacer.
When combined with a biotinylated
3’
Biotinylated primer
Spacer
TA
G
A
3’
sequence-specific reverse primer, (B) a
double-stranded amplicon is created with
a TAG overhang. (C) The TAG overhang
allows hybridization capture to MagPlex-
TAG primer
B
TAG
C
TAG
TAG microsphere without a competing
anti-TAG complementary strand
generated in the PCR reaction.
Chapter 5.1.3 | Target-Specific PCR Sequence Detection with MagPlex®-TAG™ Microspheres (“beads”)
www.luminexcorp.com | Page 93
BR_574.01_0613
Materials Needed:
Reagents and Consumables
Vendor
MagPlex-TAG Microspheres
Luminex®
Spacer modified TAG PCR primers
IDT or other vendor
5’ biotinylated reverse PCR primers
IDT or other vendor
Qiagen HotStarTaq 2X Master Mix
Qiagen 203443 or
equivalent
dNTPs stocks
Life Technologies™ 10297018 or equivalent
2X Tm Hybridization Buffer
See Target-Specific PCR
Buffer and Reagent Recipes
section
1X Tm Hybridization Buffer
See Target-Specific PCR
Buffer and Reagent Recipes
section
streptavidin-R-phycoerythrin (SAPE)
Moss, Inc. SAPE-001G75,
Life Technologies S-866 or
equivalent
96-well PCR Plate
BioRad MSP9601
96-well Bead Hybridization Plate (optional)
Corning Costar 6509
MicroSeal A
BioRad MSA5001
Magnetic separation plate (special order)
V&P Scientific VP771LD-4CS
or equivalent
Disposable pipette tips; multi- and single-channel (2-1000 mL)
Any suitable brand
25mL reservoirs (divided well)
Any suitable brand
RNase/DNase-Free Microcentrifuge Tubes 1.5 ml
USA Scientific or Equivalent
Barrier Pipette Tips
Any suitable brand
Vortex Mixer
Any suitable brand
Microcentrifuge
Any suitable brand
Bath Sonicator (40 - 55 kHz, frequency waves)
Any suitable brand
Centrifuge with Microplate Swinging Bucket Rotor
Eppendorf 5704 or
equivalent
Brayer roller, soft rubber or silicon
USA Scientific 9127-2940
Thermocycler with 96-well Head and Heated Lid
Any suitable brand
Luminex Instrument with xPONENT 3.1 or higher software
Luminex
Chapter 5.1.3 | Target-Specific PCR Sequence Detection with MagPlex®-TAG™ Microspheres (“beads”)
For complete equipment and
materials list see Appendix (B)
Note: Molecular grade ddH2O should
be used for all nucleic acid protocols.
www.luminexcorp.com | Page 94
BR_574.01_0613
Target-Specific PCR Buffer and Reagent Recipes
Step
Notes
MagPlex-TAG
Microspheres from
Luminex
Required Microspheres regions should be purchased from Luminex.
They should be stored at 4°C in the dark. For multiplex assays,
combine different bead regions as directed in the protocol.
Enzymes and Enzyme
Reaction Buffers
All enzymes and their reaction buffers can be used as directed in the
protocol.
PCR Primer Design
PCR primers should be designed to amplify a region containing any
sequence of interest and the pairs should be matched for melting
temperatures at 51-56°C. Primers should amplify a region in the
100-150 bp range for best performance. The TAG containing primer
should have a 12 to 18 atom spacer separating the TAG sequence on
its 5’ end from its sequence specific 3’ end. The reverse primer should
be biotinylated on its 5’ end. When designing these primers use oligo
design software to select an appropriate TAG sequence to include on
the TAG primers.
These primers can be purchased from multiple vendors , such as IDT.
Upon receipt, the primers should be dissolved or dilute with sterile
molecular grade ddH2O to a concentration of 1 mM (1 nanomole/μL).
They can be stored as individual stocks at -20°C. Pooled mixes can
be made to deliver 0.2 μM of each primer/ PCR reaction or as your
optimized PCR protocol requires.
1X Tm Hybridization Buffer
The buffer’s composition is 0.2 M NaCl, 0.1 M Tris, 0.08% Triton
X-100, pH 8.0. It should be filter sterilized and stored at 4°C.
streptavidin-Rphycoerythrin (SAPE)
SAPE can be purchased from a number of suppliers such as Moss
Incorporated (SAPE-001G75), Life Technologies™ (S866) or
equivalent. A working aliquot should be made fresh by diluting with
2X Tm Hybridization buffer to the required volume and concentrations
needed as indicated in the wash or no wash protocols.
Protocol 5.1.3 – Target-Specific PCR Sequence Detection
Target Sequence Amplification
Multiplexed PCR amplification of target regions should be performed under
optimized conditions. The parameters listed below are for example purposes only
and may not be optimum for your samples or any specific genomic amplification
protocol you may be using.
Chapter 5.1.3 | Target-Specific PCR Sequence Detection with MagPlex®-TAG™ Microspheres (“beads”)
www.luminexcorp.com | Page 95
BR_574.01_0613
1. Assembly of PCR reactions. Each final reaction contains:
Reagent
Amount
DNA template
50 ng
Qiagen PCR reaction buffer
1X
MgCl2
1.5 mM
dNTP
200 μM each
xTAG and Biotinylated primer
0.2 μM each
Qiagen HotStar or other Taq polymerase
2.5 Units
2. Cover plate with a plate sealer and place in a thermal cycler. Perform PCR with the
following program: (Note: The temperature of the 55°C hybridization step can be
adjusted as needed).
Temperature
Time
95°C
15 minutes
94°C
30 seconds
55°C
30 seconds
72°C
30 seconds
72°C
7 minutes
4°C
Hold
Cycle
35 cycles
3. Proceed to hybridization with MagPlex-TAG Microspheres using the no wash
protocol.
Hybridization to MagPlex-TAG Microspheres- no wash protocol
1. Select the appropriate MagPlex-TAG microsphere sets and resuspend
according to the instructions described in the Product Information Sheet
provided with your microspheres (beads).
2. Combine 2500 microspheres of each set per reaction.
3. Dilute/concentrate the MagPlex-TAG microsphere mixture to 125 of each
microsphere set per μL in 1x Tm Hybridization Buffer and mix by vortex and
sonication for approximately 20 seconds.
4. Aliquot 20 μL of the MagPlex-TAG microsphere mixture to each well including
those for bead background.
5. Add 1 to 5 μL of each PCR reaction to appropriate wells and add 5 μL of dH2O
to each bead only background well.
6. Adjust the total volume to 25 μL by adding the appropriate volume of dH2O to
each sample well that received less than 5 μL of PCR reaction.
7. Prepare Reporter Mix by diluting SAPE to 8-10 μg/mL in 1X Tm Hybridization
Buffer.
8. Add 70-75 μL SAPE to each well. Mix gently.
9. Cover the plate to prevent evaporation and hybridize in a thermal cycler or a
temperature controlled bench top plate shaker with the following parameters;
37-45°C for 25 to 45 minutes (up to 45°C may be used to improve
specificity of TAG/anti-TAG annealing.)
10. Analyze 70 μL at hybridization temperature on the Luminex analyzer according
to the system manual.
Chapter 5.1.3 | Target-Specific PCR Sequence Detection with MagPlex®-TAG™ Microspheres (“beads”)
Note: Microspheres should be
protected from prolonged exposure to
light throughout this procedure.
Note: If needed, an Excel based
bead calculator is available for
determining the method and volumes
needed for making the bead mix.
Contact your Luminex representative
or visit www.luminexcorp.com.
www.luminexcorp.com | Page 96
BR_574.01_0613
Recommendations for Optimization and Troubleshooting
Low Reporter Intensity
1.
2.
3.
4.
5.
6.
7.
Verify production of amplified products on agarose gels.
Verify labeling of amplified target.
Try increasing and decreasing the target input to determine optimal amount.
Check primer and target sequences for potential secondary structure.
Check primer and target sequences for specific sequence complementarity.
Redesign PCR primers to target a different region if needed.
Try increasing amount of SAPE.
Poor Discrimination
1.
2.
3.
4.
Decrease the target input.
Increase the hybridization temperature to 45°C.
Verify PCR primer sequence specificity and binding characteristics.
Redesign PCR primers to target more unique regions.
High Background
1. If not using SAPE already containing BSA (i.e., Moss SAPE-001G75), dilute
SAPE in 1X Tm buffer containing BSA. Final BSA concentration in the reaction
should be 0.1% BSA in the reaction.
2. If high background is isolated to one or a few microsphere sets, test individual
PCR TAG amplicons with the bead mix to determine if the high background is
related to specific target cross hybridization with the microspheres.
3. Redesign targets with high background.
4. If high background occurs on all microsphere sets try decreasing the target
input to determine optimal amount.
5. Try decreasing amount of SAPE.
References
• Babady, N. E., et al. (2012). “Comparison of the Luminex xTAG RVP Fast Assay
and the Idaho Technology FilmArray RP Assay for Detection of Respiratory
Viruses in Pediatric Patients at a Cancer Hospital.” Journal Of Clinical Microbiology
50(7): 2282 - 2288.
Chapter 5.1.3 | Target-Specific PCR Sequence Detection with MagPlex®-TAG™ Microspheres (“beads”)
www.luminexcorp.com | Page 97
BR_574.01_0613
Chapter 5.1.4
Direct DNA Hybridization Sequence
Detection
For some applications a Luminex® based genomic assay may require coupling
Luminex beads with specific capture sequences that are complementary to
organism specific sequences in the labeled reporter molecules generated by an
assay’s chemistry. These different approaches can be used for gene expression
analysis, genotyping, specific sequence detection or other applications (Yang,
Tran et al. 2001, Itoh, Mizuki et al. 2005, Oehrmalm, Eriksson et al. 2012). In these
situations specificity requires coupling capture probes of different lengths and/or
similar base compositions to different beads in the multiplex mix.
For these types of applications the hybridization of labeled target sequences to
the beads requires stringent hybridization conditions to ensure a high degree
of specificity with robust signal strength and low background. To meet these
needs, the use of TMAC containing buffers has proven to be a good alternative to
other buffer systems (Dunbar and Jacobson 2007, Oehrmalm, Jobs et al. 2010,
Oehrmalm, Eriksson et al. 2012).
This protocol outlines a TMAC based hybridization procedure that can be used for
these types of direct hybridization assays as well as other applications.
Chapter 5.1.4 | Direct DNA Hybridization Sequence Detection
www.luminexcorp.com | Page 98
BR_574.01_0613
Materials Needed:
Reagents and Consumables
Vendor
MagPlex® Microspheres (oligo-coupled)
1.5X TMAC Hybridization solution
See Direct Hybridization
Buffer and Reagent Recipes
section
1X TMAC Hybridization solution
See Direct Hybridization
Buffer and Reagent Recipes
section
TE pH 8.0
See Direct Hybridization
Buffer and Reagent Recipes
section
streptavidin-R-phycoerythrin (SAPE)
Moss, Inc. SAPE-001G75,
Life Technologies S-866 or
equivalent
96-well PCR Plate
BioRad MSP9601
96-well Bead Hybridization Plate (optional)
Corning Costar 6509
MicroSeal A
BioRad MSA5001
Silicon Mat
Phenix Research products
SMX-CM
Magnetic separation plate
Any suitable magnet
Disposable pipette tips; multi- and single-channel (2-1000 mL)
Any suitable brand
25mL reservoirs (divided well)
Any suitable brand
RNase/DNase-Free Microcentrifuge Tubes 1.5 ml
USA Scientific or Equivalent
Barrier Pipette Tips
Any suitable brand
Vortex Mixer
Any suitable brand
Microcentrifuge
Any suitable brand
Bath Sonicator (40 - 55 kHz, frequency waves)
Any suitable brand
Centrifuge with Microplate Swinging Bucket Rotor
Eppendorf 5704 or
equivalent
Brayer roller, soft rubber or silicon
USA Scientific 9127-2940
Thermocycler with 96-well Head and Heated Lid
Any suitable brand
Luminex Instrument with xPONENT 3.1 or higher software
Luminex
Chapter 5.1.4 | Direct DNA Hybridization Sequence Detection
For complete equipment and
materials list see Appendix (B)
www.luminexcorp.com | Page 99
BR_574.01_0613
Direct Hybridization Buffer and Reagent Recipes
Step
Notes
MagPlex Microspheres
coupled with desired
capture sequences
Required Microspheres regions should be purchased from Luminex
and coupled with desired capture probes as outlined in the Nucleic
Acid Coupling protocol (Chapter 3.3.4). The coupled beads should be
resuspended as recommended in the coupling protocol and stored at
4°C in the dark. For multiplex assays, combine different coupled bead
regions as indicted in the following Direct Hybridization Protocols.
1.5X TMAC Hybridization
solution
The composition of this solution is 4.5 M TMAC (Sigma T3411), 0.1%
Sarkosyl (Sigma L7414), 50 mM Tris and 4 mM EDTA. The solution
should be stored at room temperature.
1X TMAC Hybridization
solution
The composition of this solution is 3 M TMAC (Sigma T3411), 0.15%
Sarkosyl (Sigma L7414), 75mM Tris and 6mM EDTA. The solution
should be stored at room temperature. The solution should be stored
at room temperature.
TE pH 8.0
This is a 1X Tris-EDTA Buffer, pH 8.0. It can be purchased directly from
any suitable vendor or made from more concentrated stocks. It should
be filter sterilized and stored at room temperature.
Streptavidin-Rphycoerythrin (SAPE)
SAPE at 1 mg/ml can be purchased from a number of suppliers such
as Moss Incorporated (SAPE-001G75) or Life Technologies™ (S866).
A working aliquot should be made fresh by diluting with 1X TMAC
Hybridization buffer to the required volume and concentrations
needed as indicated in the wash or no wash protocols.
Protocol 5.1.4.1 – Direct DNA Hybridization - no wash protocol
1. Select the appropriate oligonucleotide-coupled microsphere sets.
2. Resuspend the microspheres (beads) by vortex and sonication for
approximately 20 seconds.
3. Prepare a Working Microsphere Mixture by diluting coupled microsphere
stocks to 76 microspheres of each set/μL in 1.5X TMAC Hybridization
Solution. Since 33 μL of Working Microsphere Mixture is required for each
reaction this will provide about 2,500 beads of each region/reaction.
4. Mix the Working Microsphere Mixture by vortex and sonication for
approximately 20 seconds.
5. To each sample or background well, add 33 μL of Working Microsphere
Mixture.
6. To each background well, add 17 μL TE, pH 8.
7. To each sample well add volumes of labeled target reaction and TE, pH 8.0 to
a total volume of 17 µL.
8. Mix reaction wells gently by pipetting up and down several times.
9. Cover the plate to prevent evaporation and hybridize in a thermal cycler with
the following parameters;
95°C for 5 minutes (denaturation step)
45 to 60°C for 15 to 20 minutes (hybridization step)
10. During the hybridization incubation, prepare fresh Reporter Mix by diluting
SAPE to 6-24 μg/mL in 1X TMAC Hybridization Solution to provide a final
SAPE concentration of 2-8 μg/mL.
11. Add 25 μL of Reporter Mix to each well and mix gently by pipetting up and
down several times.
Chapter 5.1.4 | Direct DNA Hybridization Sequence Detection
Note: If needed, an Excel based
bead calculator is available for
determining the method and
volumes needed for making the
Working Microsphere Mixture.
Note: for most assay chemistries
2-5 μL of a robust PCR or labeled
target reaction will be sufficient for
detection.
Note: Use the optimum
hybridization temperature for the
target sequences in the mix.
Note: 25 μL of Reporter Mix is
required for each reaction.
www.luminexcorp.com | Page 100
BR_574.01_0613
12. Incubate the reaction plate at hybridization temperature for 5 minutes.
13. Analyze 50 μL at hybridization temperature on the Luminex analyzer
according to the system manual.
Protocol 5.1.4.2 - Direct DNA Hybridization Washed Protocol
1. Select the appropriate oligonucleotide-coupled microsphere sets.
2. Resuspend the microspheres by vortex and sonication for approximately 20
seconds.
3. Prepare a Working Microsphere Mixture by diluting coupled microsphere
stocks to 76 microspheres of each set/μL in 1.5X TMAC Hybridization
Solution. Since 33 μL of Working Microsphere Mixture is required for each
reaction this will provide about 2,500 beads of each region/reaction.
4. Mix the Working Microsphere Mixture by vortex and sonication for
approximately 20 seconds.
5. To each sample or background well, add 33 μL of Working Microsphere
Mixture.
6. To each background well, add 17 μL TE, pH 8.
7. To each sample well add volumes of labeled target reaction and TE, pH 8.0 to
a total volume of 17 µL. (Note: for most assay chemistries 2-5 μL of a robust
PCR or labeled target reaction will be sufficient for detection.)
8. Mix reaction wells gently by pipetting up and down several times.
9. Cover the plate to prevent evaporation and hybridize in a thermal cycler with
the following parameters;
95°C for 5 minutes (denaturation step)
45 to 60°C for 15 to 20 minutes (hybridization step)
10. During the hybridization incubation, prepare fresh Reporter Mix by diluting
SAPE to 2-8 μg/mL in 1X TMAC Hybridization Solution.
11. Place plate on plate magnet for 30-60 seconds to pellet the microspheres.
12. After beads have collected on side of wells, carefully remove the supernatant.
13. Remove plate from the plate magnet and return the sample plate to
hybridization temperature.
14. Add 75 μL of Reporter Mix to each well and mix gently by pipetting up and
down several times.
15. Incubate the reaction plate at hybridization temperature for 5 minutes.
16. Analyze 50 μL at hybridization temperature on the Luminex analyzer
according to the system manual.
Chapter 5.1.4 | Direct DNA Hybridization Sequence Detection
Note: Microspheres should be
protected from prolonged exposure to
light throughout this procedure.
Note: If needed, an Excel based
bead calculator is available for
determining the method and volumes
needed for making the Working
Microsphere Mixture.
Note: Use the optimum hybridization
temperature for the target sequences
in the mix.
Note: 75 μL of Reporter Mix is
required for each reaction.
Note: An 8-channel pipettor can be
used to extract the supernatant in 8
wells simultaneously.
www.luminexcorp.com | Page 101
BR_574.01_0613
Recommendations for Optimization and Troubleshooting
Low Reporter Intensity
1. Verify coupling and hybridization assay components by direct hybridization to
labeled reverse complementary oligonucleotides (0 to 200 femtomoles).
2. Verify production of amplified target.
3. Verify labeling of amplified target.
4. Try increasing and decreasing the target input to determine optimal amount.
5. Decrease the hybridization temperature.
6. Check probe and target sequences for potential secondary structure.
7. Increase probe length.
8. Decrease size of target.
9. Redesign probes and target for the opposite DNA strand.
Note: Some of these problems and
solutions will be unique to the
chemistry used to generate labeled
targets and not all are addressed in
the following recommendations.
Poor Discrimination
1. If not using SAPE already containing BSA (i.e., Moss SAPE-001G75), dilute
SAPE in 1X Tm buffer containing BSA. Final BSA concentration in the reaction
should be 0.1% BSA in the reaction.
2. Decrease the target input.
3. Increase the hybridization temperature.
4. Decrease probe length.
5. Redesign probes and target for the opposite strand of DNA.
High Background
1. If not using SAPE already containing BSA (i.e., Moss SAPE-001G75), dilute
SAPE in 1X Tm buffer containing BSA. Final BSA concentration in the reaction
should be 0.1% BSA in the reaction.
2. If high background is isolated to one or a few microsphere sets, recouple the
probes to different microsphere sets to determine if the high background is
related to the probes or the microspheres.
3. Resynthesize probes with high background.
4. If high background occurs on all microsphere sets from the same coupling, use
uncoupled microspheres and coupled microspheres with low background to
test hybridization buffers for contamination.
5. Replace all coupling buffers and recouple.
Low Bead Count
1. Microsphere Mix was diluted incorrectly. Make sure the Microsphere Mix is
vortexed thoroughly and prepared correctly.
2. Beads were lost during washes. When using a manual wash, make sure the
assay plate is properly seated in the magnetic separator. Make sure you
selected a suitable magnetic separator based on the type of plate and reaction
volumes used in the assay. Guidelines for plate selection can be found at http://
www.luminexcorp.com/blog/selecting-the-right-plate-magnet-for-luminexassays/ and in Appendix B. Be careful not to hold the pipette tip immediately
above the beads/bead pellet; be sure to aim away from the pelleted beads.
Carefully remove the supernatant slowly. When using automatic plate washers,
make sure the washer settings are programmed according to the plate washer’s
User’s Manual and the appropriate separator is used.
3. Incorrect probe height adjustment. Adjust probe height according to the
instruments User’s Manual.
Chapter 5.1.4 | Direct DNA Hybridization Sequence Detection
www.luminexcorp.com | Page 102
BR_574.01_0613
4. Incorrect protocol set-up on the Luminex instrument. Make sure correct bead
regions are selected based on your particular bead mix.
5. Beads shifting out of region in the bead map on the Luminex instrument.
Ensure hybridization buffer wash made properly and washes (if any) are
performed thoroughly. Make sure the bead solution is stored in the dark at 4°C
to prevent photo bleaching.
References
• Dunbar, S. and J. Jacobson (2007). “Quantitative, Multiplexed Detection of
Salmonella and Other Pathogens by Luminex xMAP Suspension Array.” Methods
Molecular Biology 394: 1-19.
• Itoh, Y., N. Mizuki, T. Shimada, F. Azuma, M. Itakura, K. Kashiwase, E. Kikkawa,
J. K. Kulski, M. Satake and H. Inoko (2005). “High-throughput DNA typing of
HLA-A, -B, -C, and -DRB1 loci by a PCR-SSOP-Luminex method in the Japanese
population.” Immunogenetics 57(10): 717-729.
• Oehrmalm, C., R. Eriksson, M. Jobs, M. Simonson, M. Stromme, K. Bondeson, B.
Herrmann, A. Melhus and J. Blomberg (2012). “Variation-Tolerant Capture and
Multiplex Detection of Nucleic Acids: Application to Detection of Microbes.”
Journal Of Clinical Microbiology 50(10): 3208 - 3215.
• Oehrmalm, C., M. Jobs, R. Eriksson, S. Golbob, A. Elfaitouri, F. Benachenhou,
M. Stromme and J. Blomberg (2010). “Hybridization properties of long nucleic
acid probes for detection of variable target sequences, and development of a
hybridization prediction algorithm.” Nucleic Acids Research 38(21): E195-EU175.
• Yang, L., D. Tran and X. Wang (2001). “BADGE, BeadsArray for the Detection
of Gene Expression, a High-Throughput Diagnostic Bioassay.” Genome Research
11(11): 1888-1898.
Chapter 5.1.4 | Direct DNA Hybridization Sequence Detection
www.luminexcorp.com | Page 103
BR_574.01_0613
Chapter 5.1.5
MicroRNA Analysis
A number of PCR based and direct hybridization assays are available for the
analysis of miRNA expression levels. Most of the PCR based approaches can only
be run as single plex assays in individual reactions or on costly chips increasing
processing times, requiring more sample and limiting the number of samples that
can be processed rapidly (Jang, Simon et al. 2011; Taylor, Satoor et al. 2012; Marco
Ragusa 2013). Hybridization assays can be multiplexed to different degrees with
the use of special costly probes, cassettes and analysis instruments (Cascione,
Gasparini et al. 2013; Naduparambil Korah Jacob 2013). Many of these chemistries
are suitable for analysis of expression levels but often lack the ability to distinguish
between closely related miRNA targets that differ by a single base. In addition to
the lack of single base resolution, these assays can also be costly per sample with
low sample throughput capabilities.
To overcome these obstacles, the Luminex® based nuclease protection approach
takes advantage of a unique combination of three essential assay characteristics:
1. Use of MagPlex®-TAG™ microsphere (“beads”) mixes. Users can create
their own mixes as needed. These magnetic beads are available from
Luminex with unique TAG sequences already coupled to them. These
sequences are universal array sequences that do not cross-hybridizing with
each other or with any known sequence in the biome.
2. Biotin labeled chimeric probes. These are composed of RNA sequences
that are 100% complementary to their mature miRNA targets and a DNA
sequence which is 100% complementary to specific anti-TAG sequences
on the MagPlex®-TAG™ Microspheres (beads). The probes can be easily
designed by the user making the assay more cost effective and flexible to
meet the user’s needs.
3. Nuclease protection chemistry. This chemistry when combined with the
assay’s step down hybridization protocol results in single base resolution
of nucleotide differences even with miRNA species that cannot be
distinguished with other chemistries.
This combination of characteristics also contributes to the assay having a short
1 day protocol without sacrificing single nucleotide specificity even without PCR
amplification (Sorensen 2011).
This is achieved by the ability of the biotinylated chimeric probes to specifically
bind their miRNA targets in a short period of time with the protocol’s step down
hybridization approach. The chimeric probe/miRNA complexes are then rapidly
captured on MagPlex-TAG beads followed by a short nuclease reaction that
degrades mismatched and unbound probes. Following a short SAPE labeling step
and some washes, the samples are ready for analysis.
Chapter 5.1.5 | MicroRNA Analysis
www.luminexcorp.com | Page 104
BR_574.01_0613
Figure 18. miRNA assay work flow
A
Figure 18 - (A) Step-down Probe
Hybridization - DNA/RNA chimeric
B
probes hybridize to target miRNAs during
incremental reductions in annealing
temperature. 2 hours. (B) Microsphere
Hybridization - miRNA-chimeric probe
complexes are hybridized to microspheres.
Step-down Probe Hybridization
C
Microsphere Hybridization
D
30 minutes. (C) RNase Digestion - Excess
probes, single-stranded RNAs and
mismatched probes are digested. Only
perfectly-matched probes are protected.
30 minutes. (D) SAPE Incubation - A brief
incubation with steptavidin-conjugated
RNase Digestions
R-Phycoerythrin (SAPE) incorporates
SAPE Incubation
reporter molecules. 30 minutes.
Detection - Targets of interest are
Materials Needed:
quantified on an xMAP instrument
< 5 hours total to results.
Reagents and Consumables
Vendor
MagPlex®-TAG™ Microspheres
Luminex
Chimeric probes
IDT or other vendor
Stock RNAse One
Promega M4265
Wash and Hybridization buffer
See miRNA Buffer and
Reagent Recipes section
streptavidin-R-phycoerythrin (SAPE)
Moss SAPE-001G75, Life
Technologies S-866 or
equivalent
96-well PCR Plate
BioRad MSP9601
96-well Bead Hybridization Plate (optional)
Corning Costar 6509
MicroSeal A
BioRad MSA5001
Silicon Mat
Phenix Research products
SMX-CM
Magnetic separation plate (special order)
V&P Scientific VP771LD-4CS
or equivalent
Disposable pipette tips; multi- and single-channel (2-1000 mL)
Any suitable brand
25mL reservoirs (divided well)
Any suitable brand
RNase/DNase-Free Microcentrifuge Tubes 1.5 ml
USA Scientific or Equivalent
Barrier Pipette Tips
Any suitable brand
Vortex Mixer
Any suitable brand
Microcentrifuge
Any suitable brand
Bath Sonicator (40 - 55 kHz, frequency waves)
Any suitable brand
Centrifuge with Microplate Swinging Bucket Rotor
Eppendorf 5704 or
equivalent
Brayer roller, soft rubber or silicon
USA Scientific 9127-2940
Thermocycler with 96-well Head and Heated Lid
Any suitable brand
Luminex Instrument with xPONENT 3.1 or higher software
Luminex
Chapter 5.1.5 | MicroRNA Analysis
For complete equipment and
materials list see Appendix B
Note: Molecular grade ddH2O should
be used for all nucleic acid protocols.
www.luminexcorp.com | Page 105
BR_574.01_0613
miRNA Buffer and Reagent Recipes
Title
Title
Enzymes and enzyme
buffers.
All enzymes and their buffers can be purchased from the
recommended manufacturers. Use of each enzyme and its buffer in
different master mixes are indicated in the protocol.
Chimeric probe design
strategy
Proper design of the chimeric probes is critical for proper assay
performance. An excel workbook for designing chimeric probes
is available (Contact your Luminex representative or visit www.
luminexcorp.com.) To design probes with or without the workbook,
use the following procedure.
1. Identify the miRNAs desired for the assay and obtain their
sequences.
2. Select MagPlex-TAG bead regions desired for the plex required for
cover all miRNAs of interest and internal controls.
3. Design the chimeric capture probes so that each chimeric probe will
capture the miRNA desired as well as the anti-TAG sequence on the
beads. Note that the capture end for the probe should be RNA and
the end for the xTAG sequence should be DNA. This chimeric oligo
should be biotinylated at the RNA 5’ end (see table below).
4. Order the biotinylated chimeric DNA/RNA probes from an oligo
vendor. See the Luminex chimeric probe design excel workbook for
additional information for probe design characteristics.
Probe Portion
Sequence
miRNA sequence for mmu-miR-34b-5p
5’-AGGCAGUGUAAUUAGCUGAUUGU-3’
Reverse complement of miRNA:
5’-ACAAUCAGCUAAUUACACUGCCU-3’ (RNA)
Anti-TAG sequence on MagPlex-TAG MTAG-A015
5’-GTTGTAAATTGTAGTAAAGAAGTA-3’
Reverse complement of anti-TAG Sequence 15:
5’-TACTTCTTTACTACAATTTACAAC-3’ (DNA)
Note: The probes MUST be designed to
be a perfect match to the miRNA under
investigation, since the high specificity of
the method allows single base resolution of
mismatches between closely related miRNAs.
Oligo to order: 5’-Biotin-ACAAUCAGCUAAUUACACUGCCUTACTTCTTTACTACAATTTACAAC-3’
Chimeric probe mix:
Individual chimeric probe preparations from the manufacturer can be
dissolved to 100 µM with TE buffer pH 8.0. If you need to make probe
mixes higher than 100 plex, the individual probe should be dissolved to
higher concentrations (200 µM if possible). The individual dissolved
probes can be aliquoted and stored frozen at this point (as individual
concentrates). To create an equimolar mix of chimeric probes, a
concentrated mixed probe stock at 1 µM for each probe is first made
then further diluted to generate a working mix where 1.25 µl of probe
mix for each reaction delivers 10nM for each probe.
Example: A 5 plex miRNA profile is to be analyzed on 100 samples.
The total number of samples will require 100 * 1.25 µl = 125 µl of a
10nM probe mix with all 5 probes. Each of the individual chimeric
probes are at 100 µM and need to be diluted 1:100 to generate the 1
µM concentrated probe mix. This 1 µM mix can be made by adding
1.25 ul of each probe into an empty tube with 118.75 µl of TE buffer
(5 * 1.25 µl = 6.25 µl + 118.75 µl TE buffer creates 125 µl of 1 µM probe
mix). The working stock is made fresh by making a 1:100 dilution of
this 1 µM probe mix with hybridization buffer to bring the probe mix to
the 10 nM concentration. This working dilution is the Chimeric Probe
mix that is used at 1.25 µl/reaction as described in the protocol.
Chapter 5.1.5 | MicroRNA Analysis
www.luminexcorp.com | Page 106
BR_574.01_0613
Hybridization and wash
buffer:
The same buffer is used for hybridization to Luminex beads and
washes. It is a pH 7.7 buffer consisting of 10 mM Tris, 200 mM sodium
acetate, 5 mM EDTA, and 0.05% Tween 20. This buffer can be made
from 3M sodium acetate stock solution, a 0.5 M EDTA solution pH
8.0, a 1M Tris pH 7.5, and a 10% Tween 20 solution – with a final
adjustment to the proper pH as needed. Filters sterilize and store at
4°C.
MagPlex-TAG Magnetic
bead mixes
Pre-defined MagPlex-TAG bead mixes come in a concentration of 2.5
x106 beads per region per mL. Since each region should contribute
1,000 beads per reaction, 0.4 µl of the bead stock would be needed
for each reaction and can be diluted into a maximum volume of 4.0 µl
(see protocol). Creation of a master mixture that is added as 4.0 µl/
reaction to deliver 1,000 beads/rxn for each region can be made as
follows, assuming the bead stock purchased has all the bead regions
required for the assay.
Multiply the number of samples by 0.4 µl. For example, if 100 samples
are to be tested, this would be 40.0 µl of bead stock. Since 0.4 µl of
this stock is needed per reaction, it can be diluted to the 4.0 µl volume
required for each reaction as follows. For 100 samples add 360 µl of
TE pH 8.0 buffer to the 40 µl of bead mix. Place the tube on a magnet
or spin to pellet the beads. Remove all of the supernatant. Resuspend
the beads in 400 ul of hybridization buffer. This will achieve a mix
where 4 µl will deliver 1,000 beads per region to each well for 100
wells/reactions. To compensate for slight fluid loss during pipetting a
20% overage can be calculated for these volumes
Note: For assays above 10 plex, the use of multiple bead stocks of
individual bead regions will require additional concentration steps to
make a master mix that can deliver all the required bead regions at
1,000 beads per region in 4 µl. If high plex bead mixes are required
the purchase of bead stocks containing multiple bead regions is
recommended to simplify or eliminate the concentration steps needed
to make the bead mix that is added to the reaction. Whatever the
bead source, the final bead dilution for use in the assay should be in
hybridization buffer. Also, if needed, an Excel based bead calculator is
available for determining the method and volumes needed for making
the bead mix.
Samples Requirements for
the assay:
Only purified total RNA should be used. Purified miRNA or “small
RNA” is not recommended. Purification methods used to isolate
miRNAs may introduce unwanted bias by selectively purifying some
miRNA species over others, resulting in losses that may be universal
or specific. Isolation of total RNA has no bias toward particular miRNA
species. Traditional methods such as phenol/chloroform extraction
may also be use for total RNA extraction. Some older bind-and-elute
methods are not suitable as they do not recover miRNAs. Please make
sure that a total RNA extraction method that maximizes the recovery
of miRNAs is used. Adjust the sample’s total RNA concentration to
deliver from 250 ng to 500 ng per sample in a volume of 2.5 µl or less.
Example: If the sample RNA concentration is 1 mg/ml (1,000 ng/µl)
then combine 0.5 µl RNA with 2.0 µl of hybridization buffer to achieve
500 ng in the 2.5 µl recommended sample volume.
Chapter 5.1.5 | MicroRNA Analysis
www.luminexcorp.com | Page 107
BR_574.01_0613
Protocol 5.2 – miRNA Analysis
1. In a nuclease free tube, for each sample and a no RNA negative control, make
a sample master mix as follows with 20% overage. The total RNA samples
should be delivering 250 ng to 500 ng of RNA in 2.5 µl.
Reagent
1 rxn
N rxns + 20%
Hybridization buffer
16.25 µl
(16.25 µL x N) + 20%
Sample (Total RNA or H2O for Neg. control)
2.5 µl
(2.5 µL x N) + 20%
Chimeric Probe mix (10 nM each probe)
1.25 µl
(1.25 µL x N) + 20%
20.0 µl
(20.0 µL x N) + 20%
Total volume =
Note: Microspheres should be
protected from prolonged exposure to
light throughout this procedure.
2. Pipette 20.0 µl of the sample master mix to appropriate wells of a 96 well PCR
plate.
3. Seal plate with MicroSeal A with a brayer to secure the seal. Vortex for 5
seconds followed by quick spin to ensure all reagents are at the bottom of the
wells.
4. Cover plate with silicon mat and place in thermal cycler programmed with the
step down profile using the following parameters:
90°C for 3 minutes
80°C for 6 minutes
Program to drop 1°C every 6 minutes until 60°C is achieved (i.e. steps
will be 80° for 6 minutes, then 79°C for 6 minutes, then 78°C for 6
minutes, etc. to 60°C )
37°C and HOLD until user intervention (see steps 5 and 6 below)
37°C for 30 minutes after user intervention
30°C and HOLD for user intervention (see steps 7 to 9 below)
30°C for 30 minutes
END
5. At the 37°C HOLD step, pause the thermal cycler and add 4 µl of the bead mix
to each well. Mix well by pipetting up and down or remove the re-sealed plate,
vortex for 10 to 15 seconds and quick spin for 1–2 seconds. Note: See miRNA
Buffer and Reagent Recipes on how to make the bead mix. The bead mix
should deliver at least 1,000 beads/region for each reaction.
6. Resume step down program (37°C for 30 minutes).
7. Nuclease Enzyme digestion: 5 min prior to the completion of the 37°C bead
hybridization step, prepare a 1:500 dilution of the stock nuclease enzyme using
the hybridization buffer as the diluent. At the 30°C HOLD, pause the thermal
cycler, remove MicroSeal A and add 2.5 µl of diluted nuclease enzyme to each
reaction while the plate remains in the cycler. It is important that the enzyme
is pipetted into the bottom of the tube, not onto the walls. After addition, seal
with new MicroSeal A film.
8. Remove the plate briefly from the thermal cycler and mix well by gentle
vortexing, followed by a brief spin (1 to 2 seconds) to bring the all contents
down into the bottom of the wells.
9. Return plate to the thermal cycler for the final step of 30°C for 30 minutes.
10. Five minutes prior to the end of the 30°C step, prepare a 1:500 dilution master
mix of SAPE. Calculate the volume by using 75 µl per well with an overage of
20%. Example: If 10 samples are tested, make 10x75 µl of reporter solution
plus 20% overage= 900 µl.
Chapter 5.1.5 | MicroRNA Analysis
www.luminexcorp.com | Page 108
BR_574.01_0613
11. Remove the reaction supernatant prior to the addition of SAPE as follows:
Place the plate on a magnetic separator. Let the magnetic beads migrate for 2
minutes.
12. Remove MicroSeal A film. With a multi-channel pipette remove the fluid gently
from the wells without disturbing the bead pellet.
13. Add 200 µl of wash buffer to each well and resuspend the beads by pipetting
up and down 3 or 4 times.
14. Return the plate to the magnetic separator and again allow the microspheres
(beads) to migrate and form a pellet for 2 minutes.
15. Again, remove MicroSeal A film and remove the supernatant gently and
carefully.
16. Add 75 µl of the diluted SAPE solution and mix by pipetting up and down
several times. Seal the plate with MicroSeal A film.
17. Shake the sealed plate on a plate shaker for 30 minutes at room temperature.
Shake at a speed that insures a mixing vortex is formed in each well.
18. Remove plate from plate shaker and place it on the magnetic separator,
allowing the microspheres to migrate for 2 minutes.
19. Remove all of the solution from the wells by pipetting without disturbing the
pellet.
20.Add 200 µl of wash buffer to each well and resuspend the beads by pipetting
up and down 3 to 4 times
21. Return the plate to the magnetic separator and allow beads to migrate for 2
minutes and remove all the supernatant without disturbing the bead pellets.
22.Repeat steps 20 to 22 for another wash.
23.Remove plate form magnet and add 100 µl wash buffer and resuspend beads by
pipetting up and down 3 to 4 times. Caution: Avoid making foam or bubbles.
24.Read the plate in a suitable Luminex instrument which has been adjusted
for the type of plate used. If you prefer, you may transfer the 100 µl of bead
suspension to a standard bead hybridization plate (Corning Costar 6509) for
analysis.
Recommendations for Optimization and Troubleshooting
High Background
1. Wash steps were not performed thoroughly. Ensure that as much supernatant
is removed as possible during each wash step while taking care to avoid
disturbing the microsphere pellet.
2. Possible reagent contamination. Replace all buffers first. Use only nucleasefree, barrier pipette tips for all reagent additions and mixing.
Unexpected Results from Control Samples
1. Reagents were not stored at the recommended temperatures. Make sure all
reagents are stored at the recommended temperatures. For reagents that
are frozen, avoid multiple freeze-thaw cycles. Place reagent master mixes
that contain enzymes on ice during preparation. If indicated, pre-warm other
reagents to room temperature immediately before use.
2. Vortexing enzyme stocks. You should never vortex enzyme stocks. Instead,
flick tube to mix. Gently vortex and quick-spin the enzyme solution only after
you have made the recommended dilution.
3. High signal on Negative Control sample due to contamination. Make sure
all consumables such as tubes and pipette tips are nuclease-free as well as
general reagents such as PBS, 10 mM Tris pH 7.0, and nuclease-free dH2O. If
problem persists, replace all buffer reagents.
Chapter 5.1.5 | MicroRNA Analysis
www.luminexcorp.com | Page 109
BR_574.01_0613
4. Positive Control sample signal is too low. Verify that the purified control RNA
concentration is correct and the RNA is not degraded.
Low MFI Signal
1. RNA concentration or degradation. Verify that the RNA concentration is
correct and the RNA is not degraded.
2. Thermal cycler not functioning properly or error in program. Ensure all actual
incubation temperatures are within ±2°C of the recommended incubation
temperature. Make sure the step down protocol and other steps in the PCR
program are entered correctly.
3. Incorrect probe hybridization temperature and/or annealing temperature.
Ensure probe hybridization and temperature, annealing temperatures are
optimum for the particular probe mix.
4. Nuclease Enzyme too active. Make sure the Enzyme is properly diluted and
not at too high a concentration. Decrease concentration if needed.
5. Either SAPE not added or incorrect SAPE dilution used. Make sure SAPE is
stored at 4°C in the dark, do not freeze SAPE solutions, and ensure SAPE
dilutions are prepared as described in the protocol and SAPE working stock is
protected from light.
6. Luminex instrument was not set for detection using high PMT. Ensure Luminex
analyzer is set to high reporter gain setting (high PMT).
7. Severe agitation. Avoid foam formation when pipetting reagents. You should
perform all reagent additions and mixing gently and to the bottom of the well.
8. Sample evaporation. Make sure all wells are sealed properly, especially during
incubations.
9. Reagent additions not performed correctly. Make sure all reagents are added
at the bottom of each well. Accurate pipetting is critical for achieving tight
%CVs between replicates.
Low Microsphere Count
1. Microsphere Mix was diluted incorrectly. Make sure you thoroughly vortex the
Microsphere Mix vial and prepare the dilution according to the instruction manual.
2. Microspheres were lost during washes. Use the recommended magnetic plate
separator (V&P Scientific VP771LD-4CS) or suitable substitute (see Appendix
B). When performing a manual wash, make sure the plate sits properly on the
magnetic separator. Be careful not to hold the pipette tip directly above or near
where the microspheres are pelleted. Remove the supernatant carefully and
slowly. When using automatic plate washers, make sure the washer settings
are programmed according to the plate washer instruction manual. Make sure
the washing protocol has been optimized for the magnetic separator and plate
type used.
3. Incorrect probe height adjustment on instrument. Adjust the probe height
according to the instructions in the Adjust the Probe Height section.
4. Incorrect protocol set up on the Luminex instrument. Make sure you enter
assay parameters and bead regions correctly when you create your protocol.
5. Microspheres shifting out of region in the bead map on the Luminex
instrument. Make sure wash buffer was prepared correctly. Make sure the
microsphere solution is stored in the dark at 4°C to prevent photo-bleaching.
Chapter 5.1.5 | MicroRNA Analysis
www.luminexcorp.com | Page 110
BR_574.01_0613
Low Specificity
1. Wrong concentration of Probe Mix in the reactions. Make sure the Probe Mix
dilution is prepared correctly.
2. Pipetting errors. Verify that pipettes are calibrated and volumes measured are
accurate.
Low Sensitivity
1. RNA concentration not correct or RNA degraded. Verify that the RNA
concentration not too high or too low and that the RNA is not degraded.
2. Carryover contamination. Make sure you carefully perform the manual washes
to avoid sample transfer mistakes or carryover contamination. While removing
plate sealers, make sure well contents do not splash over adjacent wells.
3. Chimeric probe hybridization to RNA needs to be optimized. Probe
concentration or hybridization temperatures need to be adjusted. A chimeric
probe titration series and different probe hybridization step down temperature
range may need to be tested.
4. Chimeric probe sequences not accurate. Make sure the chimeric probe
sequences are the correct reverse compliment to the target RNA sequence.
Use the Excel based FlexmiR 200 Chimeric probe design tool for proper probe
design. Contact your Luminex representative or visit www.luminexcorp.com.
5. Bead hybridization temperature too high or low. A temperature gradient may
be needed to determine the optimum bead hybridization temperature.
References
• Cascione, L., P. Gasparini, F. Lovat, S. Carasi, A. Pulvirenti, A. Ferro, H. Alder, G.
He, A. Vecchione, C. M. Croce, C. L. Shapiro and K. Huebner (2013). “Integrated
microRNA and mRNA signatures associated with survival in triple negative
breast cancer.” PLoS One 8(2): e55910.
• Jang, J. S., V. A. Simon, R. M. Feddersen, F. Rakhshan, D. A. Schultz, M. A.
Zschunke, W. L. Lingle, C. P. Kolbert and J. Jen (2011). “Quantitative miRNA
expression analysis using fluidigm microfluidics dynamic arrays.” BMC Genomics
12: 144.
• Marco Ragusa, R. C., Andrea Russo, Lidia Puzzo, Teresio Avitabile, Antonio
Longo, Mario D. Toro, Cinzia Di Pietro, Michele Purrello, Michele Reibaldi (2013).
“MicroRNAs in vitreus humor from patients with ocular diseases.” Molecular
Vision (19): 430-440.
• Naduparambil Korah Jacob, J. V. C., Tamara N. Yee, Jidhin Jacob, Hansjuerg
Alde, Priyankara Wickramasinghe, Kirsteen H. Maclean, Arnab Chakravarti
(2013). “Identification of Sensitive Serum microRNA Biomarkers for Radiation
Biodosimetry.” PLoS One 8(2).
• Sorensen, K. (2011). “Individualized miRNA Assay Panels Using Optically
Encoded Beads Next-Generation MicroRNA Expression Profiling Technology.”
Next-Generation MicroRNA Expression Profiling Technology: Methods and Protocols.
J.-B. Fan, Humana Press. 822: 131-141.
• Taylor, C. J., S. N. Satoor, A. K. Ranjan, M. V. Pereira e Cotta and M. V. Joglekar
(2012). “A protocol for measurement of noncoding RNA in human serum.” Exp
Diabetes Res 2012: 168368.
Chapter 5.1.5 | MicroRNA Analysis
www.luminexcorp.com | Page 111
BR_574.01_0613
Appendix A
Common buffers used in xMAP® protocols
xMAP Buffers
Buffer
Composition
Use(s)
Source
Notes
0.1 M NaH2PO4, pH 6.2
Microsphere (“bead”)
activation buffer for protein
coupling
Sigma S3139
Adjust to pH 6.2 with 5 N
NaOH
Filter sterilize
Store at 4 °C
Coupling Buffer2
50 mM MES, pH 5.0
Microsphere-protein
coupling buffer
Sigma M2933
Adjust to pH 5.0 with 5 N
NaOH
Filter sterilize
Store at 4 °C
Phosphate buffered saline
(PBS), pH 7.4 3
138 mM NaCl, 2.7 mM KCl,
pH 7.4
Alternate microsphereprotein coupling buffer
Sigma P3813
Filter sterilize
Store at 4 °C
PBS-Tween buffer
PBS, 0.05% Tween-20,
pH 7.4
Microsphere wash buffer
Sigma P3563
Filter sterilize
Store at 4 °C
PBS-BN buffer4
PBS, 1% BSA, 0.05%
sodium azide
Microsphere blocking/
storage buffer
Assay buffer
Sigma P3688
Sigma S8032
Filter sterilize
Store at 4 °C
PBS–TBN buffer4,5
PBS, 0.1% BSA, 0.02%
Tween-20, 0.05% sodium
azide
Microsphere blocking/
storage buffer
Microsphere wash buffer
Assay buffer
Sigma P3813
Sigma A7888
Sigma P9416
Sigma S8032
Filter sterilize
Store at 4 °C
Assay/Wash Buffer
PBS, 1% BSA, pH 7.4
Assay buffer
Sigma P3688
Filter sterilize
Store at 4 °C
0.1 M MES Buffer pH 4.5
0.1 M MES
Oligonucleotidemicrosphere coupling
buffer
Sigma M2933
Adjust pH w/ 5N NaOH
Filter sterilize
Store at 4 °C
0.02% Tween-20 Wash
0.02% Tween-20
Oligo coupling wash buffer
Sigma P9416
Filter sterilize
Store at room temperature
0.1% SDS Wash
0.1% SDS
Oligo coupling wash buffer
Sigma L4522
Filter sterilize
Store at room temperature
EDC
1-Ethyl-3-[3dimethylaminopropyl]
carbodiimide hydrochloride
(EDC)
Microsphere coupling
activation
Pierce 77149
Store desiccated at -20 °C
TE Buffer pH 8.0
TE
General purpose nucleic
acid buffer
Sigma T9285
Filter sterilize
Store at room temperature
2X Tm Hybridization Buffer
0.2 M Tris pH 8.0, 0.4 M
NaCl, and 0.16% Triton®
X-100
xTAG DNA hybridization
reactions
Filter sterilize
Store at 4 °C
1X Tm Hybridization Buffer
0.1 M Tris pH 8.0, 0.2 M
NaCl, and 0.08% Triton®
X-100
xTAG labeling and wash
buffer
Filter sterilize
Store at 4 °C
1.5X TMAC Hybridization
Solution
4.5 M TMAC, 0.15%
Sarkosyl solution, 75 mM
Tris-HCL, 6 mM EDTA (pH
8.0)
Direct DNA hybridization
microsphere diluent
Activation Buffer
1
Appendix A | Common buffers used in xMAP® protocols
Sigma T3411
Sigma L7414
Sigma T3038
Invitrogen 15575-020
Filter sterilize
Store at room temperature
www.luminexcorp.com | Page 112
BR_574.01_0613
1X TMAC Hybridization
Solution
3 M TMAC, 0.1% Sarkosyl
solution, 50 mM Tris-HCL,
4 mM EDTA (pH 8.0)
Direct DNA hybridization
labeling and wash buffer
Add 1 part Molecular
Grade ddH2O to 2 parts
1.5X TMAC Hybridization
Solution
Filter sterilize
Store at room temperature
1. Activation can be performed in 50 mM MES, pH 6.0–6.2, with similar results.
2. Coupling can be performed in 100 mM MES, pH 6.0, with similar results. For some proteins, better
solubility and better coupling may be achieved at a higher coupling pH.
3. Alternative coupling buffer for proteins that do not couple well at pH 5–6.
4. Also used as assay buffer.
5. Also used as wash buffer.
Appendix A | Common buffers used in xMAP® protocols
www.luminexcorp.com | Page 113
BR_574.01_0613
Appendix B
Equipment needed for xMAP® protocols
Immunoassay Equipment
Vendor
Luminex® xMAP analyzer with xPONENT software
Luminex
Magnet for 1.5 mL microcentrifuge tube washing2
(Dynal MPC®-S Magnetic Particle Concentrator, Invitrogen 120-20D) or equivalent.
Magnet for 96 well plate washing3
(See list below)
Balance
Any suitable brand capable of weighing down to 0.1 mg
Microcentrifuge
Any suitable brand
Hemacytometer or Cell Counter
Cellometer Auto 1000, TC10 Cell Counter, Countess® Automated Cell Counter
Vortex mixer
Any suitable brand
Sonicator bath
Ultrasonic Cleaner, Cole-Palmer, A-08849-00 or equivalent
Rotator
Any suitable brand capable of 15-30 rpm
Microtiter plate shaker
Any suitable brand capable of 800 rpm
1
96-well plate
Nucleic Acid Assay Equipment
Vendor
Thermocycler with 96-well Head and Heated Lid
Any suitable brand
1. Note : MAGPIX® has the ability to perform a final wash step prior to reading the plate.
2. Note: If a magnet is not available, use a microcentrifuge (8000 x g for 1-2 minutes).
3.Note : If a magnet not available, use a centrifuge compatible with 96 well plates (8000 x g for 1-2
minutes)
4.Note: LumAvidin beads are not magnetic and require MultiScreen Filter Plates (Millipore, MABV
N12) and vacuum pump system manifold for vacuum pump system, such as the MultiScreen™ Resist
Vacuum Manifold from Millipore (MAVM0960R).
Appendix B | Equipment needed for xMAP® protocols
www.luminexcorp.com | Page 114
BR_574.01_0613
Magnetic Separators for MagPlex Microspheres with
compatible tubes and plates*
Product
Use
Source
Compatible Tube
Luminex Magnetic Tube Separator
Coupling
Luminex® Corporation, CN-0288-01
1.5 mL, co-polymer microcentrifuge tubes (USA
Scientific 1415-2500)
Dynal MPC®-S magnetic particle
concentrator
Coupling
Life Technologies™ A13346
1.5 mL, co-polymer microcentrifuge tubes (USA
Scientific 1415-2500)
Product
Use
Source
Compatible Plates
Luminex magnetic plate separator
Assays
Luminex® Corporation CN-0269-01
96-well, round-bottom polystyrene solid plates
(Costar 3789 or 3792)
LifeSep™ 96F magnetic separation unit
Assays
Dexter Magnetic Technologies, Inc.
2501008
96-well, round-bottom polystyrene solid plates
(Costar 3789 or 3792)
Ambion® 96-well magnetic ring stand
Assays
Life Technologies™ AM10050
96-well, round-bottom polystyrene solid plates
(Costar 3789 or 3792)
96-well plate magnet
Assays
PerkinElmer (Customer Care) 5083175
96-well, round-bottom polystyrene solid plates
(Costar 3789 or 3792)
96-well, Thermowell P polycarbonate PCR plates
(Costar 6509)
96-well, F-bottom, (chimney well), µclear, med.
Binding, black (Greiner bio-one 655096)
Aluminum Foil Lids (Beckman 538619) or
equivalent
*Note: LumAvidin® beads are not magnetic and require MultiScreen Filter Plates (Millipore, Cat. No.
MABV N12) and vacuum pump system manifold for vacuum pump system, such as the MultiScreen™
Resist Vacuum Manifold from Millipore (MAVM0960R)
Appendix B | Equipment needed for xMAP® protocols
www.luminexcorp.com | Page 115
BR_574.01_0613
Compatible Plates and Consumables
Description
Use
1.5 mL copolymer
microcentrifuge tubes
Source
Catalog Number
Coupling
USA Scientific
1415-2500
1.5 mL Protein LoBind
microcentrifuge tubes
Coupling
Eppendorf
22431081
Extended Fine Tip
Transfer Pipette
Coupling
Samco Scientific
233
96-well, flat bottom,
polystyrene solid plates
Protein/Unheated
assays
Luminex 100/200,
FLEXMAP 3D,
MAGPIX
Corning (Costar)
3912, 3915
96-well, round bottom,
polystyrene solid plates
Protein/Unheated
assays
Luminex 100/200,
FLEXMAP 3D,
MAGPIX
Corning (Costar)
3789, 3792
96-well, Thermowell
polycarbonate PCR
plates, Model P
Nucleic Acid/Heated
Luminex 100/200,
FLEXMAP 3D,
MAGPIX
Corning (Costar)
6509
96-well, Multiscreen-BV
1.2 mm filter plates
Protein/Unheated
Luminex 100/200,
FLEXMAP 3D,
MAGPIX
EMD Millipore
MABVN1250
96-well, uClear, flat
bottom, chimney well
plates
Protein/Unheated
Luminex 100/200,
FLEXMAP 3D,
MAGPIX
Greiner Bio-One
655096
384-well, uClear, flat
bottom, chimney well
plates
Protein/Unheated
FLEXMAP 3D
Greiner Bio-One
781906
384-well, Thermowell
GOLD polypropylene
microplates
Nucleic Acid/Heated
FLEXMAP 3D
Corning (Costar)
3757
384-well, Armadillo PCR
Plates
Nucleic Acid/Heated
FLEXMAP 3D
Thermo Scientific
AB-2384
384-well, Hard-Shell,
thin wall, skirted PCR
Plates
Nucleic Acid/Heated
FLEXMAP 3D
Bio-Rad
HSP-3805
384-well, twin.tec PCR
plate
Nucleic Acid/Heated
FLEXMAP 3D
Eppendorf
951020702
96-well microplate
aluminum sealing tape
Nucleic Acid/Heated
FLEXMAP 3D,
MAGPIX
Corning (Costar)
6570
Microseal ‘A’ film
Nucleic Acid/Heated
Luminex 100/200,
FLEXMAP 3D,
MAGPIX
Bio-Rad
MSA-5001
Appendix B | Equipment needed for xMAP® protocols
Analyzer(s)
Notes
Good for removing
supernatant from
coupling wash steps
Can be used for
washes with vacuum
filtration for LumAvidin/
nonmagnetic beads
www.luminexcorp.com | Page 116
BR_574.01_0613


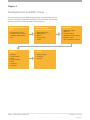


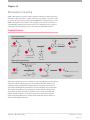
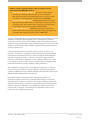
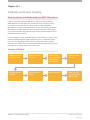


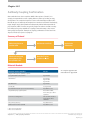


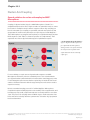
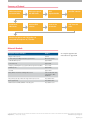


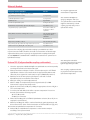
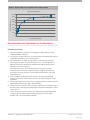

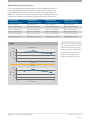
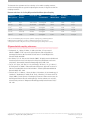

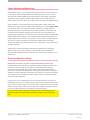


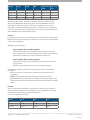
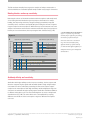
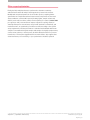

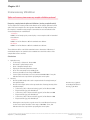


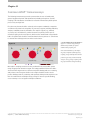

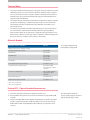
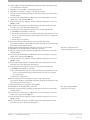

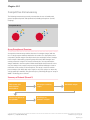
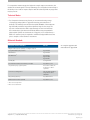
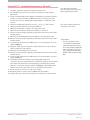

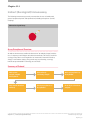


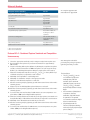

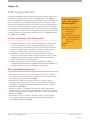


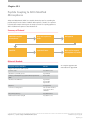

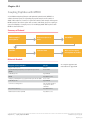
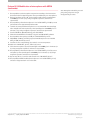

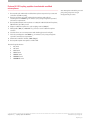


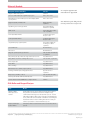
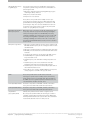
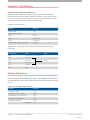


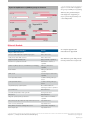

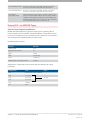
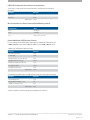
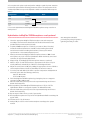


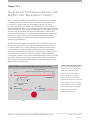
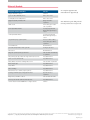
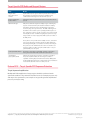


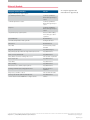
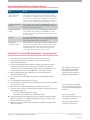
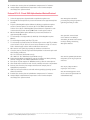
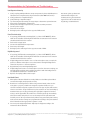


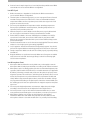
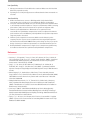
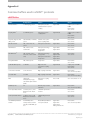

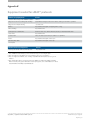
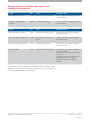


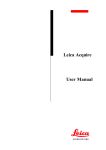


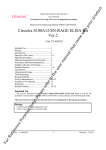

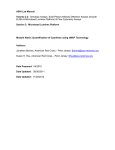


![or BTK [C481S] (cat. # CK-01](http://vs1.manualzilla.com/store/data/005981492_2-10b1708324ced5982eb1bb254f0262a2-150x150.png)
![or BTK [C481S] (cat. # CK-01-1002-384)](http://vs1.manualzilla.com/store/data/005787023_1-2d29b83e06663168d351d396f31f02d5-150x150.png)