1
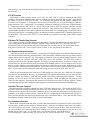
Family Software 3164 Surrey Lane Aston, PA 19014 (610) 497-5561 'Drag Racing Computers and Software' www.iFamilySoftware.com ET PREDICTOR II v7.50 for Palm OS - Instructions Welcome to the world of high-tech drag racing! The ET Predictor II software from Family Software will enable you to properly manage air/fuel ratios for the current air density, track vehicle performance or modifications, and accurately predict elapsed time and throttle stop settings according to varying weather conditions. Included are programs to calculate Air Density, Horsepower Correction, Density Altitude, Dew Point, Vapor Pressure, Corrected Elapsed Time, Run Completion, and our exclusive Run Segment Analysis program for Compulink style race tracks. The next best thing to having an on-board computer. The ET Predictor is the most accurate ET Prediction and Weather Station software available. The ET Predictor provides a Horsepower Correction Factor (HCF) and Air Density Index (ADI) using a standard of 0 elevation, 29.92 In Hg pressure, 60 degrees F temperature, and 0 percent relative humidity. Under these conditions, the HCF equals 1.0000 and the ADI will equal 100.0 percent. The HCF and ADI compensate for pressure, temperature, and relative humidity. Conditions that improve the HCF and ADI are cold air, high air pressure, and low humidity. The Palm version of the ET Predictor looks and works exactly like a Windows program on your PC. If you are not familiar with using a Palm device, first read your Palm user manual on the Palm CD that came with your PDA. Then install the Palm Desktop Software to your PC. Charging the Battery The programs installed in the Palm Zire PDA are battery-backed. Therefore, you must keep the battery charged at a sufficient level to maintain the programs. You should fully charge the PDA at least every two weeks. A battery level indicator at the top of the Applications screen continually shows the current state of the rechargeable battery. You can charge the battery with the included power supply or with the USB cable attached to the PDA and your PC. If you are not going to use the PDA for an extended period of time, leave it plugged into your PC. Backing Up Your PDA Using the USB cable, you should also back up the installed programs to your PC by performing a Hot Sync operation through the Palm Desktop Software. If you allow the battery to fully discharge in the PDA, you will need to Hot Sync the PDA to your PC to restore its memory and installed programs. But, if you don't initially perform a Hot Sync operation, then you will not have a backup of the software and the PDA will have to be returned for programming. Starting the Program Once the program has been installed and registered, you can start it from your Applications screen. Tap on the ET Predictor icon to launch the program. If you bought the PDA from us, the software is already registered. Entering Data into the Program Entering numeric data into a handheld Palm device can be tedious at best. We’ve made it a lot easier and more fool proof by designing an Input Screen that contains large buttons for each numeral and function. The Input Screen works just like a calculator. Whenever the program requires data, or when you wish to Edit data, you will be taken to the Input Screen. At the top of the Input Screen is a Label that shows which variable you are editing. Tap the “C” button to clear the data field, or the “<-“ button to delete the last numeral entered. Tap on Cancel to abort without saving your changes, or Enter to accept your changes. The value that you enter is tested against a range of expected values for that particular data field. If you enter a number that is outside of the normal 2 – Palm ET Predictor II range, or the number is not a valid numerical expression, you will be alerted to your mistake and returned to the Input Screen. Each variable has an Edit button and a data field. The Caption on the Edit button shows the variable name. For example: Elevation 0 In order to edit the value for any data field, tap on its Edit button. In this case, tap on ‘Elevation’ and the Input Screen will appear asking you to enter a new value for the variable Elevation. Fuel Mode The Fuel Mode is used to set the weather correction calibration used in the program to either Methanol or Gasoline. When correcting elapsed time (ET) to Standard Pressure (STP) or when predicting ET, the program needs to know what fuel you are using. To change the Fuel Mode, tap on Menu, tap on Fuel Mode, and then tap on Gasoline or Methanol. The current Fuel Mode is always displayed on the Main Screen. Air Calculations The program uses the Elevation, Barometric Pressure, Temperature, and Humidity, to calculate the current Horsepower Correction Factor (Current HCF), Air Density Index (ADI), and Density Altitude (DA), Dew Point, and Vapor Pressure. The formulas used in this program are the same ones used in our ET Predictor II hand-held computers, ET Predictor software, and RaceLog Pro software. They are the most accurate formulas to be found in this industry. The ET Predictor uses a standard of 0 elevation, 29.92 In Hg pressure, 60 degrees F, and 0 % relative humidity. Under these conditions the HCF equals 1.0000 and the ADI will equal 100.000 percent. Elevation - Range: -3,000 to +26,000 Feet - Elevation is only used if you are using an altimeter or a corrected barometer. If you're using an uncorrected barometer reading absolute pressure, always enter 0 for the elevation. If you have an altimeter, calibrate it to 29.92 In Hg and enter the reported altitude as the elevation. If you are using an analog barometer and your altitude requires that you use a corrected barometer, then you should always enter the number of feet equal to the amount of correction when you calibrated the barometer. Digital barometers and altimeters measure absolute pressure, without any need for correction, so their use is preferred. Barometer - Range: 12 to 35 Inches Hg - If you're using a barometer to obtain the air pressure, enter the barometric pressure from the gauge. When using an altimeter, always enter 29.92 for the barometric pressure. Temp F - Range: 10 to 130 degrees F - Enter the temperature from a digital thermometer or other temperature gauge. From round to round, temperature changes are apt to affect performance more than any other variable. RH% - Range: 0 to 100 Per Cent - You can use a digital hygrometer to find the relative humidity. At low temperature, relative humidity has the least effect on performance. However, at high temperatures, the effect is much greater. For example, 50% RH at 60 F will result in a .01 loss in power, while at 90 F the addition of 50% RH equals about a .03 loss in power. Changes in temperature are also more critical under high humidity. The following is more information on the resulting calculations: Current HCF (Current HP Correction Factor) - The Horsepower Correction Factor is computed using the current weather conditions that you enter. In other words, the HCF equals the current elevation, barometer, temperature, and humidity. When the HCF is higher, less horsepower is produced, and the car will run slower. So, the lower the HCF is, the faster the car will run. You can use the HCF to determine the variance in horsepower or torque that is being produced under different weather conditions. For example, if your engine produces 400 horsepower with an HCF of 1.012, it will produce 404.80 horsepower at sea level conditions (STP) or 1.0000 (400 x 1.012=404.80). 3 – Palm ET Predictor II Vapor Pressure – Vapor Pressure is the exact portion of barometric pressure that is present due to Relative Humidity, or moisture, in the air. Vapor Pressure is used in calculating the horsepower correction. Air Density (Air Density Index) - The Air Density Index (ADI) is the computed ratio of the current density to that of STP with STP having an index of 100 percent. This factor is used to determine the correct jetting or pill size required under varying weather conditions. The higher the ADI, the more air there is available for combustion. Therefore, more fuel must be burned to maintain the correct air/fuel ratio. When using gasoline, a four (4) percent change in the ADI will usually necessitate a change in jet area in order to maintain the same level of performance. Holley jet sizes are about 4 percent apart in flow area. If the ADI goes up four (4) percent, for example 100.0 to 104.0, increase all jet sizes by one number. And, if the ADI goes down four (4) percent, for example 100.0 to 96.0, decrease all jet sizes by one number. Density Alt (Density Altitude) – Density Altitude (DA) is the current air density expressed in feet of elevation. DA is also known as the corrected or relative altitude. DA is not scientific and is very inaccurate. Therefore we do not use this factor in ET Prediction. We only report this value for information purposes only. Dew Point – Dew Point is the calculated temperature at which condensation (moisture) occurs based on the entered air conditions. Dew Point will tell the racer when the traction on the race track will worsen due to condensation. When the actual measured air temperature matches the Dew Point temperature, the race track will be wet. Main Screen Functions - To use one of the Program Functions, just tap on its button. ET Prediction Function Using a base line of performance consisting of a previous ET (Base ET) and its associated Horsepower Correction Factor (Base HCF), this function will calculate and predict your ET under new air conditions. This program will also predict 60', 330', 660' and 1000' times if these are entered into the Edit Base Run Function. Be sure that the Fuel Mode is set correctly. Enter the Base HCF and Base 60’, Base 330’, Base 660’, Base 1000’, and Base 1320’ times in the Edit Base Run Function from the run you wish to predict your new ET from. After entering your base run information, tap on the ET Prediction button, enter the new air conditions in the Enter New Air Screen that appears. Next, click on the Calculate button. The predicted ET’s will appear in the ET Predictions Screen. Tap on Continue and the Current Air Screen will appear showing the Current HCF, Vapor Pressure, Air Density Index, Density Altitude, and Dew Point. To use this function for eighth mile ET Prediction, simply enter a zero (0) in the base run fields for the 1000 foot and 1320 foot. If you are a throttle stop racer, doing this will also set the Throttle Stop Prediction Function to capture the eighth mile ET for predicting the timer duration for an eighth mile track. Throttle Stop Prediction Function This function is used to predict a new throttle stop timer duration setting based on a previous run, its corresponding throttle stop duration (Base TD), and your existing throttle stop factor (TSFactor). You can enter the base throttle stop information for your Base Run in the Edit Base TS Function. After you run the ET Prediction Function, then tap on the TS Prediction button. The Predicted ET along with the current Index, Throttle Stop Factor, and Base Timer Duration is transferred to the Throttle Stop Prediction function automatically. Tap on Calculate to get the new Timer Duration. Notice that you can also edit any of these fields. For example, if you wanted to change the Index from 8.900 to 8.906, you can do that here without having to go back to the Edit Base TS Function. However, any data fields edited will also be changed in the Base TS Information. If you do make changes be sure to tap on Calculate to update the Predicted Timer Duration. Edit Base Run Function This is where you enter your Base Run Information. The base run consists of the Horsepower Correction Factor (Current HCF), calculated from the air conditions when you made the run, and the performance data from 4 – Palm ET Predictor II your time slip. Tap on the button for the data field you wish to edit. Tap on Cancel to abort, or Store, to save this new data. STP ET Function This function is used to quickly correct any ET (60', 330', 660', 1000', or 1320') to standard pressure (STP) conditions. It uses the air conditions from when you made the run and the Actual ET that you enter. After entering the Actual ET, the STP ET will be reported. As an example, for gasoline fuel and weather conditions of 0 Elevation, 29.65 Barometer, 75 Temperature, and 45% RH, an Actual ET of 9.337 would be equal to 9.204 after being corrected to STP. Comparatively, for completely different air conditions of 0 Elevation, 29.80 Barometer, 67 Temperature, and 68% RH, an ET of 9.298 will also equal 9.204 at STP. This program calculates and then removes the effect that the current air density had on the run. This creates a basis to directly compare one ET against another regardless of the weather conditions associated with the run. Comparing these two STP ET's shows us that this particular car is responding perfectly to changes in weather conditions and is consistent right down to the thousandth. The corrected ET (STP ET) is how fast the car would have run under perfect (STP) weather conditions. Edit Base TS (Throttle Stop) Function This is where you enter your Base Throttle Stop Information. The Base TS Information consists of the Index, your existing Throttle Stop Factor (TSFactor), and Base Timer Duration (Base TD). The Base TD is the duration that you had in your throttle stop timer for the Base Run currently entered. Tap on the button for the data field you wish to edit. Tap on Cancel to abort, or Store, to save this data as the new Base TS. Run Segment Analysis Function Other than having an on-board computer, calculating the STP Run Segments is the ultimate method to help a racer obtain maximum consistency and performance. Enter the weather conditions from when you made your run and the interval times from your ET slip. The program sees the track as six (6) separate distance segments. These are the 0'-60', 60'-330', 330'-660', 660'-1000', 1000'-1320', and 0'-1320' distances. The STP corrected time is reported for each of the above distance segments. This allows you to quickly analyze what the car is doing at any point on the track. Because the times are all corrected to STP (standard pressure), you can compare every run you make at a glance and know to the thousandth of a second any variable that exists in your combination or driving style. Once your combination has been optimized, you'll be able to see the variance between lanes or from track to track. If you want to use this function for eighth mile racing, just enter a 0 for the 1000’ and 1320’ ET. While the uncorrected times from each run will (and should) vary with every pass, ideally the STP segment times between passes should be the same. By comparing the STP segments between two runs you can see traction variances, throttle stop function, wind, and other variables that affect performance and prediction.. Traction problems will be seen at the 0-60 foot and 60-330 foot segments. Wind will affect the 660-1000 foot and 1000-1320 foot segments. Second gear shift variances will usually be seen at the 60-330 foot segment. Throttle stop function problems will be seen between the segments of activation and de-activation of the throttle stop. Calculate TS Factor Function This function quickly calculates a throttle stop factor (TSFactor) using two runs. The second run (STP ET #2) must have more timer duration and must be the slower run, or the function can’t work. You should first correct both runs to STP using the STP ET function. Otherwise, the two runs must have been made in exactly the same air conditions, or the result will not be accurate. Enter the STP ET from the first run in the field labeled, STP ET #1. Then, enter the timer duration that was used on that run in the field labeled TSD #1. Next, enter the STP ET and timer duration from the second run and click on the Calculate button. Run Completion Function Based on the information entered under your Base Run Information this function will report a projected ET on a run where you had to hit the brakes or lifted the throttle. Enter the air conditions, from when you made the run, in the Enter New Air Screen. Then tap on Calculate. The function uses the Base 1000’ time and enters it for you under Base SEG, assuming that you are running on a 1/4 mile track and that you ran the car on full throttle past the 1000’ cone. If you lifted earlier, you can enter the 660’ time for the Base SEG. Likewise, if you are running on a 1/8th mile track, you may use the 330’ time for the Base SEG. For the New SEG (New 5 – Palm ET Predictor II Segment) field, enter the corresponding time from your time card from the new run. If you used the Base 1000’ time for the Base SEG, then you must enter the new 1000’ time from your time card for the New SEG. Tap the Calculate button and the program will compute the Projected ET, or what the car would have run in those air conditions on a full pass. A QUICK START FOR ET PREDICTION First you must establish a base line for performance. This can be the result of one good run or an average of several runs. You should calculate the Current Horsepower Correction Factor (CURR HCF) for each pass that you make and log it with your time slip information. Calculating the STP ET for every run will also enable you to determine which run is the best, regardless of the weather conditions present on the run. The HCF is the Horsepower Correction Factor defined by the current weather conditions for the time of that particular run. The HCF is then equal to that Elevation, Barometer, Temperature, and RH%. Therefore, when it becomes time to predict your next ET, it isn't necessary to remember all the previous weather variables. You only have to remember the Current HCF and Actual ET from each run. When you wish to predict a future run, the CURR HCF and Actual ET from your time run will become the BASE HCF and BASE ET that you enter into the Edit Base Run Screen. Step 1: Establish Base Performance. Immediately after each time trial, run the STP ET Function to calculate the Current HCF for that run. If you are running on a Compulink equipped track, you may wish to use the Run Seg Analysis Function to calculate the Current HCF and to analyze your performance. For the following example we will be using the STP ET Function and Gasoline Fuel Mode. We'll say that on the first time run we ran ET of 9.352, a 60 Foot time of 1.348, and the weather conditions were: Barometer=29.82, Temperature=73, and the RH%=56. (If using an Altimeter, enter the altimeter reading as the Elevation and always put 29.92 in for the Barometer.) Tap on the STP ET button. Using an uncorrected barometer (absolute pressure) the Elevation should always be set to 0. Enter 0 for the Elevation. Enter 29.82 for the Barometer. Enter 73 for the Temperature. Enter 56 for the RH%. Tap on Calculate. The program will report Current HCF: 1.0374, Vapor P: 0.459, Air Density: 95.7376, Density Alt: 1,476, Dew Point: 56.4 This is the 'air' for your first pass. Tap on Continue. Next, enter the Actual ET of 9.352 that the car just ran. The program will report: STP ET 9.238 This is the STP Corrected ET. The STP ET is the time that the car would have run if the weather conditions were perfect. On non-throttle stop equipped cars, the best run of the day will normally be the one with the lowest STP ET. We will use this run as our Base Run. The Base 1320 ET will be 9.352, the Base 60 Foot will be 1.348, and the Base HCF will be 1.0374. Step 2: Input Base Run. Tap on the Edit Base Run button. Enter the Base HCF as 1.0374, the Base 1320 ET as 9.352, and the Base 60 as 1.348. Tap on Store. The computer will remember this information when you are ready to predict your next run. Step 3: Predict ET. Two hours later, let's say you are in the staging lanes awaiting your first round. The new weather conditions are: Barometer=29.88, Temperature=70, RH%=60. Tap on the ET Prediction button. Enter the new weather conditions and tap on Calculate. The program will then report the Predicted ET of 9.332 and the Predicted 60 Foot ET of 1.345. This is the predicted performance and is what your car should run under the current weather conditions, providing that the air/fuel ratio is correct. On gasoline engines the air/fuel ratio must be about 12.5 to 1 for proper results. It is important to understand that the Base 60 Foot ET is not used in predicting the full track ET. Rather it is used to predict the 60 foot time only. The predicted 60 foot time is used to keep track of the traction factor. If your actual 60 foot time is not the same as the predicted 60 foot time, the amount of traction available is changing. You may have to adjust your dial to compensate for varying track conditions. If you enter a Base 330, Base 660, or Base 1000 time, then a predicted ET will also be reported for each of these. Enter a 0 for any BASE time that you don't have or do not wish to use. The computer will then skip that prediction. 6 – Palm ET Predictor II Note: For eighth mile tracks, always enter a zero (0) for the Base 1000 and Base 1320. Displacement/Compression Ratio Program To find your engine displacement and/or compression ratio, tap on Menu, tap on More, and tap on Displ/CR. The Displacement program first asks you to enter a value for the following variables - bore, stroke, and number of cylinders. As you enter each value, the displacement is re-calculated and displayed. Once you have calculated displacement, tap on Main Menu to return, or tap on Continue for the Compression Ratio screen. The Compression Ratio screen additionally asks for the cylinder head chamber volume cc's, head gasket thickness, deck height, and piston dome volume cc's. For negative dome volumes, enter a minus (-) sign before the value, as in - 4.4 . As you enter each value, the Compression Ratio is re-calculated and displayed. The gasket volume is calculated from the cylinder bore size and the head gasket thickness. It is more accurate to enter the actual gasket volume, if known. If you know this value, tap on Gasket Volume and enter it here, otherwise the calculated gasket volume will be used in the final result. If you enter the actual gasket volume, the program will store a "0" in the value for the head gasket thickness so that only the actual gasket volume is used in the computation. Tap on Back to make changes to the bore and stroke, or tap on Done to end the program. If you enter values that cannot be computed into a valid compression ratio, the program will just report "0". Hints and Tips In bracket racing, the most important factor is driver and vehicle consistency. Racer's use weather computers for ET Prediction, air/fuel ratio management, and to analyze vehicle performance. When used properly, the computer can help you to achieve the utmost in consistency. By eliminating the variables in your car's performance, it becomes easier to predict the precise dial-in. Being able to consistently 'run the number' will make you a feared competitor and result in more rounds won. Here are a few hints and tips to help in using your weather computer. Air Fuel Ratio Management On gasoline burning engines, the air/fuel ratio must be about 12.5 to 1 for the computer to predict performance accurately. There is no benefit from running a lean mixture. When using a weather computer to predict your dial-in, you want the car to respond to changes in atmospheric conditions. Find a day when the air density is average for the racing season in your area. Then richen the mixture until the car slows down. The car may go faster at first, as it is probably too lean. After this, you shouldn't have to re-jet until the air density changes four (4) per cent or more. By adjusting the fuel mixture for an average air density of 96 per cent, for example, the air can range from 92 to 100 per cent, without having to re-jet. A quick way to check for proper fuel mixture, is to check the color inside the headers. This should be a very dark gray, or almost black. If they are white to a light gray, the mixture is way too lean. As the air density changes from week to week, you will actually see the color change. The header color will appear lighter as the air density increases and darker as it decreases. You can also use an Exhaust Gas Temperature (EGT) gauge to evaluate jetting changes. Call us for information on our Digital EGT kits. Analyzing Performance After adjusting the fuel mixture properly, the car should consistently run right on the predicted ET. If it doesn't, there are variables in your particular combination. Your computer will help you to find these variables. Start by correcting every ET to STP and recording it in your racer's log for every run. STP is the abbreviation for Standard Pressure, also known as sea level conditions. In correcting the ET, we remove the effect that the current atmospheric conditions have on the run. Therefore, the STP ET is the elapsed time the car would have run under perfect weather conditions. This creates a basis to compare one ET against another regardless of the weather conditions associated with the run. When you have removed all the variables, ideally, the STP ET should be the same for every run. The ET Predictor II has a unique feature for locating these variables. Run Segment Analysis is for use with quarter mile tracks with a timing system reporting 60, 330, 660, 1000, and 1320 foot elapsed times. Other than having an on-board computer, it is the best method to get maximum consistency and performance from your race car. After entering the above times, the computer treats the track 7 – Palm ET Predictor II as six (6) separate distance segments. These are the 0-60, 60-330, 330-660, 660-1000, 1000-1320, and 0-1320 foot distances. Reported are the actual time and the STP time for each of the above distance segments. This allows you to analyze what the car is doing at any point on the track. Correcting the segment ET's allows you to compare every run at a glance. This reveals, to one thousandth of a second, any variable that exists in your combination or driving style. Then, after optimizing your combination, you can see any variance between lanes or from track to track. Figure 1 and figure 2, are actual runs made within two (2) months of each other. Each run was the second time trial of the day. The first example is from July 20, 1991 at Cecil County Dragway, MD. The second example is from September 22, 1991 at the same track. Because of the difference in weather conditions between July and September, the actual ET's differ by about 2 tenths of a second, even with the car running on methanol. However, the STP ET's vary by only .003. Look closely at the actual times and corrected segment times for each run. These examples show a perfect combination at work. Using the numbers from the previous weekend at Cecil County, the ET Predictor predicted an ET of 8.864 for the first example. The car ran 8.866. Two months later, using the first example as a base line, the computer predicts an 8.737. The car ran 8.740. Very consistent and very predictable. In order to compare these two (2) runs after using the Run Segment Analysis program, you simply subtract the corrected segment times from each other and note the difference as a plus (+) or minus (-). For example, on the first run the corrected 0-60' segment was 1.258. On the second run, the corrected 0-60' segment was 1.255. The difference is .003. Since the corrected segment on the second run is smaller than the first, this becomes minus .003 or (-.003). On the second run, the 0-60' segment then was .003 faster than the first. So, traction was better. Doing the same for each pair of corrected segment times will show the variance at each point on the track. You can watch shift points, throttle stop function, head or tail wind, traction, and other variables. If your predicted ET's are not matching your actual performance, this analysis will show you why and where to look for problems. If every segment is off by the same amount in the same direction (plus or minus) then you should look for a jetting problem. Being too rich or too lean will affect every segment time. Traction problems will show up in the 0-60 and 60-330 segments. Variation on second gear shifts usually occurs in the 60-330 segment. Head wind and tail wind will affect the 660-1000 and 1000-1320 segments. For wind to be the culprit, both segments should be off in about the same amount and in the same direction. Fuel delivery problems can be mistaken for a head wind. Your throttle stop factor consistency can even be accurately checked by watching the segments where the stop functions. When the corrected ET's are close to perfect, the predicted ET's generated by the computer will be dead on. ET Prediction Hints and Tips By comparing the STP ET's from every run, you can find out exactly how consistent your car is. If the STP ET's vary by .02 then you may want to dial .01 or more under the predicted ET to avoid breaking out. This is especially true for the car being chased. This driver needs to have the confidence to run it 'out the back door', if necessary. One of the rumors concerning methanol is that changes in the air will not affect performance. Any naturally aspirated engine running methanol at a proper air/fuel mixture will respond to changes in air density. So, when using methanol fuel, it is necessary to use methanol calibrated weather computer. Always use the readings from your own gauges. What someone else is doing will not help you. Keep your gauges outside, in the shade, and shielded from the wind. Even with the doors wide open, a trailer will absorb, and retain, radiant heat from the sun. The readings will never be accurate. This is why you cannot use the weather readings reported on your time slip. Depending on the time of day and location of the sensors, temperature readings will vary by 10 degrees or more from the actual temperature. Use a hood scoop or fresh air system of some sort. When you want to predict an ET based on ambient temperature, the actual inlet air must be at that temperature. Under hood temperatures are higher than ambient air and result in poor and inconsistent performance if allowed to enter the carb inlet. Copyright 2004 Family Software. All rights reserved. No liability is expressed or implied. We shall not be liable in any event for claims of incidental or consequential damages in connection with or arising out of, the furnishing, performance, or use of the program(s). 8 – Palm ET Predictor II Run Segment Analysis Example of Run Segment Analysis Compare 2 runs by subtracting the corrected segment times. The difference at each point is the variance in performance that is not due to changes in the air density, but other variables, like traction, shift points, throttle stop, head wind, or tail wind.