1
Chapter 3
Activity 3-2.
Loops and Charts
Use a While Loop and a Chart
Your objective is to use a While Loop and a chart for acquiring and
displaying data in real time.
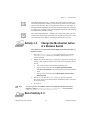
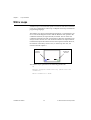
You will build a VI that generates random data and displays it on a chart.
A knob control on the front panel adjusts the loop rate between 0 and 2
seconds and a switch stops the VI. You will change the mechanical action
of the switch so you do not have to turn on the switch each time you run
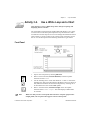
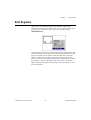
the VI. Use the front panel in the following illustration to get started.
Front Panel
Note
1.
Open a new front panel by selecting File»New.
2.
Place a Vertical Switch (Controls»Boolean) on the front panel.
Label the switch Enable.
3.
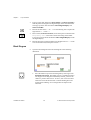
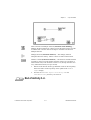
Use the Labeling tool to create free labels for ON and OFF. Select the
Labeling tool, and type in the label text. With the Color tool, shown at
left, make the border of the free label transparent by selecting the T
in the bottom left corner of the Color palette.
4.
Place a waveform chart (Controls»Graph) on the front panel.
Label the chart Random Signal. The chart displays random data
in real time.
Make sure that you select a waveform chart and not a waveform graph. In the
Graph palette, the waveform chart appears closest to the left side.
© National Instruments Corporation
3-5
LabVIEW User Manual