1
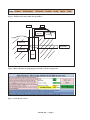
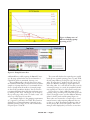
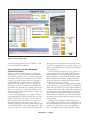
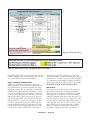
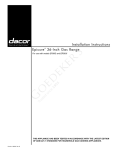
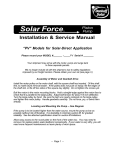
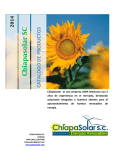
Solar-Powered Water Pump Design
Spreadsheet Version II: User Manual
Circular 671
Thomas Jenkins1
Cooperative Extension Service • Engineering New Mexico Resource Network
College of Agricultural, Consumer and Environmental Sciences • College of Engineering
SPREADSHEET OVERVIEW
The purpose of this user manual and accompanying Microsoft Excel spreadsheet (http://aces.nmsu.edu/pubs/_circulars/
CR671/CR671.xlsm) is to guide you through the basic process of designing a solar-powered water pumping system
and aid in feasibility and implementation decisions. The
spreadsheet is designed to allow you to enter values such as
well location and depth, number and type of animals, etc.
By entering different values, you can investigate a variety of
scenarios before making implementation decisions.
There are NO expressed or implied guarantees with
this spreadsheet/user manual, nor is it intended to replace
professional expertise. It is also important to note that the
system is designed around the use of a small set of submersible DC pumps and photovoltaic (PV) panels as a teaching
example ONLY; other pumps and PV panels are available,
and there are no endorsements of any kind.
It is useful to first read the accompanying paper2 and
skim this manual to get a basic understanding of the spreadsheet and general overview of solar water pumping. Some
experience with computers and spreadsheets is helpful.
The spreadsheet consists of different “sheets” or pages
that are indexed via tabs at the very bottom of the window. There is a title sheet, six sheets that represent the six
main sequential steps in the design methodology, and a
conclusion sheet (Figure 1). The currently selected sheet
has a white background, and in Figure 1 this is the Title
Page sheet.
On each sheet, there are different shaded boxes, areas,
or spreadsheet cells. There are light-purple and light-blue
shaded areas that are instructions and user notes that you
should read when using each sheet. The green cells are
where you can enter information. To enter a value, move
the cursor and click on the green cell (or box), enter your
value in that cell (typically a number), and press the “enter” or “return” key on your keyboard. The orange boxes
display intermediate values that are calculated by the
spreadsheet. The yellow boxes show the final calculations
in each design step, and they will often be used in other
calculations and to generate the final design specifications.
1
2
Some input cells have a red triangle in their top right
corner. When you place the cursor onto that cell, a “popup” note is displayed giving an additional short explanation related to the information in that cell. Some cell entries are restricted in their allowable values. For example,
the “Multiplier” cell in the Daily Water Requirement sheet
(Figure 6) will only accept entries between 0–20. If you
enter a value outside this range, an error message will be
displayed and you must re-enter a valid value in this cell
before continuing.
Some entry cells may also have a “drop-down” menu
associated with them. A cell’s menu can be accessed by
placing the cursor on the cell and clicking on it. A note
is then displayed and a drop-down menu tab is displayed
to the right of the cell. When this tab is clicked, the dropdown menu displays the valid entries for this cell. Just
click on any menu entry to make it the cell’s input value.
STEP-BY-STEP DESIGN PROCEDURE
Step 1. Gather Information
To begin the design procedure, it is useful to have some
information about the existing or proposed well. You
should sketch out some basic parameters using Figure 2
as a simple example. The key values needed are the discharge elevation, water level, pipe fittings (such as elbows and valves), and total length of pipe and its nominal inside diameter. Units of length are feet. For existing
wells, a well driller log often has this information.
Water level is defined as the lowest depth of the water
in the well, including any draw-down levels and seasonal
variations; this is not the pump level, which is the depth
of the pump from the surface to below the water level.
Draw-down is the lowering of water in the well due to
pumping activity. Seasonal variations are seasonal changes in the water level in the well. Discharge elevation is
the elevation from the ground level to the discharge
point. Total length of pipe is the pipe length from the
pump to the discharge point (including any horizontal
Professor ([email protected]), Department of Engineering Technology and Surveying Engineering, New Mexico State University.
Circular 670, Designing Solar Water Pumping Systems for Livestock (http://aces.nmsu.edu/pubs/_circulars/CR670.pdf ).
To find more resources for your business, home, or family, visit the College of Agricultural, Consumer and Environmental
Sciences on the World Wide Web at aces.nmsu.edu
Figure 1. Different sheet tabs within the spreadsheet.
Elbow
Valve
Horizontal
pipe run
Trough
Water level
Draw-down
Pump level
Pump
Well Water
Figure 2. Basic schematic of a pumping system from a well to a storage tank.
Figure 3. Solar Resource sheet.
Circular 671 • Page 2
pipe run such as from the wellhead to the storage tank).
There is another example diagram on the Total Dynamic
Head sheet of the spreadsheet that is color-coded for
your convenience.
Step 2. Determine Available Solar Resource
Once you determine basic well information, open the
spreadsheet and click on the Title Page sheet (the leftmost tab at the bottom of the spreadsheet; see Figure 1).
Read the title page material and view the referenced
internet video on solar pumping. Next, continue to the
first design sheet by clicking on the Solar Resource sheet
tab at the bottom of the spreadsheet.
The purpose of the Solar Resource sheet (Figure 3) is
to calculate the total daily insolation (i.e., sunlight) at
the well’s location. There are four green cell entries for
this step: the state, the season, the latitude in the state,
and how the PV panels are mounted/tilted. First select
the state—Arizona (AZ), New Mexico (NM), Colorado
(CO), Utah (UT), Nevada (NV), Wyoming (WY), or
Montana (MT)—where you plan to install your solar
system by clicking on the green cell and using the state
menu. Then, using the chosen state’s map as an aid, enter the nearest latitudinal coordinate for your well’s location in the “Latitude” cell. For example, New Mexico is
located between latitudes 31° and 36°. A green highlight
will appear on the state map indicating the latitude you
have entered; Figure 4 shows an example in which 31°
has been entered as the latitude for a location in New
Mexico.
Next, you may choose, in the green cell below the
“Latitude” cell, the season (i.e., winter, summer, or all
year) during which you will be pumping water. A summer choice is appropriate if you plan to only pump water during the summer months (i.e., May–September),
winter would be for winter only pumping, and all year
would obviously be year-round pumping. This choice
will be used to calculate the amount of solar energy
available to run your system (summer has more solar
energy), as well as the livestock and other water requirements for different seasons; summer livestock water requirements are significantly higher than winter requirements, and therefore more water must be supplied for
the summer season.
Conservative, worst-case values are used for determining available solar energy. For example, a winter or
all-year choice would use sunlight amounts for December 21 (the shortest day of the year, which has, consequently, the least amount of sunlight), while a summer
choice would use values from mid-May. By using worstcase values, we can expect to supply sufficient water under all conditions. For year-round pastures, we will use
winter sun values and summer water usage values as our
worst-case parameters.
Figure 4. Example of a state map with latitude
31° selected.
PV panel
Tilt angle
Ground
Figure 5. PV panel tilt angles.
PV panels supply power (electricity) to the pump
and are typically pointed due south and tilted at some
angle from the horizontal to help capture the most sunlight; see Figure 5 for an illustration. The tilt angle can
be fixed (i.e., does not change throughout the year) or
physically changed to a seasonal angle. To this end, use
the drop-down menu in the “Tracker or Tilt Angles”
entry cell to enter one of three possible angle choices.
Circular 671 • Page 3
Enter “Latitude” if you plan to tilt the PV panels at a
fixed angle equal to the latitude of your location. A rule
of thumb for a fixed-tilt angle for all-year pumping is to
tilt the PV at an angle equal to the well’s latitude (e.g.,
35° in the case of the Albuquerque area).
Enter “1-Axis Tracker” if you plan to use a 1-axis solar
tracker. Single-axis or 1-axis solar “trackers” are devices
that track or follow the sun as it moves from east to west
during the day. Using a tracker can considerably increase
the total solar energy absorbed by the PV, which means
there is more energy and you can size pumps and panels
smaller and cheaper. However, a tracker adds additional
costs and system complexity. Two-axis trackers are available, but their additional cost and complexity typically do
not justify them for this usage.
Enter “+/- 15°” if you plan to change tilt angles so they
are optimized for winter- or summer-only seasons (i.e.,
latitude plus 15° for winter, latitude minus 15° for summer). For example, if you plan to water only a summer
pasture, the PV panels will collect more sun energy if they
are more horizontal, tilted to an optimal angle equal to
the location’s latitude minus 15°; this angle is good for the
higher summer sun, but bad for the lower winter sun. If
watering in Albuquerque at latitude of ~35°, for example,
the PV panels for a summer-only watering season should
be tilted at 20° (35° minus 15°) from the horizontal. By
being flatter, the panel will catch more of the higher summer sun. Winter-only tilt angle would be 50° (35° plus
15°) from the horizontal, catching more of the lower winter sun. Most users use a fixed-tilt angle because of its ease
of operation and maintenance. See the References section
for more discussions.
Once we have selected the state, latitude, watering season, and tilt angle type, the spreadsheet will determine the
total sunlight for this location. This value will be displayed
in the yellow cell labeled “Total Daily Insolation” and is the
available energy we will have to power the system.
Step 3. Determine Daily Water Requirement
Navigate to the next sheet titled Daily Water Requirement (Figure 6), whose purpose is to calculate the
amount of water you need per day based on your
seasonal choice (winter, summer, or all year), number and type of animals to be watered, and any other
water needs. To calculate the needed water, input the
number of each of the animal type you want to water in the green cells under the “Quantity” column,
which is under the “Water Requirements” general
heading. If you do not have an animal type, just leave
that cell blank (or enter 0). If something is not listed,
input the amount of gallons that item requires per
3
4
day in the green cell labeled “Other Water Requirements.” The amount of water for each animal per
day is calculated by multiplying the number of each
animal type (e.g., 5 horses) by the amount of water
that the animal needs per day (e.g., 15 gal/day). The
amount of water each animal needs varies due to animal size, season, and location (e.g., desert vs. mountain, summer vs. winter, etc.3).
The Daily Water Requirement sheet shows common regional water requirements for various animals in the bottom left area of the window, but you may change these
default values by entering values in the green cells under
the general heading “Typical water requirement for this
region” (Figure 7). Grey-colored cells indicate a recommended range of typical watering values for your seasonal
choice. Again, the spreadsheet calculations are typically
the worst-case values based on your seasonal choice from
the earlier sheet (e.g., summer water values are used for
animals that will be in summer or year-round pastures).
Do not leave any of these cells blank or 0.
The system will calculate a total daily water requirement for each animal type and then sum all these to get
a total “Daily Water Requirement,” which is displayed
in yellow. You may also enter a percentage multiplier
(0–20%) that will add an additional percentage to this
calculation. This additional water can be used to offset
evaporation, refill a storage tank, or adjust for anticipated growth in water requirements. The new adjusted total
is also in yellow as gal/day (and liters/day).
Like windmills, solar pumping systems often pump
extra water into a storage tank that supplies water to
livestock at night or during periods of low light (or calm
days in the case of windmills). You may enter a number
of days for storage and the system will provide a general size of a storage tank that you might use with the
system. This is informational only and has no other use
in the design. For example, a normal storage value for
sunny regions like New Mexico is three days of water,
but it may be up to ten depending on various factors4.
Step 4. Determine How Hard the Pump Must
Work to Move Water From the Well
Navigate to the next sheet titled Total Dynamic Head
(Figure 8), whose function is to determine how hard a
pump must work to move water from the well, through
the total length of piping and all fittings, and to a discharge level at a certain flow rate (gallons per minute
[gpm]) to meet the daily water requirement. This
calculated value, called “Total Dynamic Head (TDH),”
is used to determine the pump size and PV panels
required to power it.
You may contact your county Extension agent for specific values for your location, season, conditions, and animal types.
Consult your county Extension agent for additional information concerning water storage requirements for your area.
Circular 671 • Page 4
Figure 6. Daily Water
Requirement sheet.
Figure 7. Water
requirement table.
Figure 8. Total Dynamic
Head sheet.
Circular 671 • Page 5
Take the well values that you determined in step 1 and
enter them into their associated green cells on the right
side of the Total Dynamic Head sheet. Use Figure 2 and
the color-coded example drawing on the left side of the
Total Dynamic Head sheet as an aid, but note that these
diagrams are just examples to illustrate various terms.
The entered well values are used to calculate the total
vertical lift of the system plus the friction losses in the
pipe and fittings used to transport the water from the
well to the discharge point, giving TDH.
Water level is the lowest depth of water in the well,
including any draw-down and seasonal variations. This is
not the depth of the pump, which is located deeper (i.e.,
submerged under the water). Pump level is how far below
the surface the pump is set and is used to determine total
pipe length. The total length of the pipe includes the entire pipe length in the well from the pump to the surface,
the aboveground elevation to the discharge point, and the
length of all horizontal runs. A well log or the well driller
will often know these values as well as water conditions,
including sand and grit mitigation.
Enter the water pipe inside diameter in inches5 and
pipe material (PVC, poly, or metal) you plan to use with
this well; PVC is recommended. The system also displays a “recommended” optimal pipe diameter. The system does some calculations, and you will not be allowed
to enter a pipe diameter that is too small to handle the
required flow rate. Remember that smaller is almost always better and cheaper, but the pipe diameter must be
large enough for your requirements. Input the number
of each type of fitting in your piping system (e.g., check
valves, elbows, etc.). These numbers should be entered
under the column titled “Quantity” and within the corresponding row of the specific fitting. If you do not have
or do not plan to use some of the fittings listed, leave
those cells empty or input a 0.
Using these inputs, friction losses are calculated based
on pipe size and length, flow rate, and total vertical
distance from the pump to the discharge point (static
head). These losses are part of the calculated TDH displayed in yellow; the standard unit is feet, with equivalent meters and psi shown.
NOTE: In the “Typical Solar Water Pumping Layout” example well diagram on the left side of the Total
Dynamic Head sheet, there is displayed a calculated
“Hydraulic Workload” value below the diagram. This
value can be used to determine if the designed system is
a candidate for solar. If the value is less than 1500 it is a
good candidate, if between 1500 and 2000 it is marginal, and if greater than 2000 other power options should
be considered for your system.
5
Step 5. Select a Pump
If the “Hydraulic Workload” is acceptable for a solarpowered system (i.e., less than 2000), continue to the
sheet titled Pump Selection, whose function is to determine an acceptable pump, the best voltage at which to
run the pump, and the power needed to run this pump
(i.e., power supplied by the PV panels). This is all determined by two important parameters: the previously
calculated flow rate (Q) in gpm and TDH in feet (and,
to a lesser extent, the efficiency of the pump).
For this spreadsheet, whose purpose is only a teaching
example, we will show the method of selecting a suitable
pump by using a very small example group of 1-horsepower (HP) or less pumps from SunPump. Other types,
sizes, and brands of pumps are available, and you are
strongly encouraged to investigate these for their suitability to your situation.
Pumps can be powered by AC or DC, but the discussion in this publication is limited to DC pumps. Pumps
may also be surface-mounted or submersed in the well.
Due to the limited application of surface pumps, we
again will limit our discussion to submersibles.
Submersible water pumps come in a few different
types based on their method of moving water up the
well. There are low-cost “diaphragm” submersibles,
intended for pumping lower water volumes from shallow depths with flow rates from 1/2 to 5 gpm from up
to 230 ft of TDH lift. These may operate on 12 to 30
volts (V) of DC power from any source and are typically constructed of marine-grade bronze and stainless
steel. Designed to be installed below the water level in
a pond, river, cistern, or groundwater well, these typically have higher operating efficiencies than centrifugal
pumps, but require more periodic maintenance due to
their design and have lower tolerances for sand or grit
in the water. These limitations mean these pumps are
not often recommended.
“Helical rotor” is a type of positive displacement submersible pump and is also known as a progressing cavity
pump, eccentric screw pump, or cavity pump. This type
of pump is gaining popularity in solar pumping and has
several positive features. You are encouraged to investigate this type of pump for your applications.
“Centrifugal type” pumps are higher-power submersibles, intended for pumping higher water volumes from
greater depths. They can be used to fill an open tank or
in a pressurized system and operate up to 2000 watts
(W) of DC power at 30 to 180 V from any DC power
source. Constructed of corrosion-resistant marine-grade
bronze and stainless steel, they are multi-stage centrifugal pumps with submersible motors that incorporate
It is best to use the smallest feasible pipe diameter. A common mistake is to use pipe that is too big.
Circular 671 • Page 6
high-efficiency, permanent magnet, brushless DC technology. Supplied with an industry standard NEMA connection, they bolt directly to standard 4-in. submersible
pump ends. This is the pump type group we will use in
this teaching example.
When choosing a pump, select a type, manufacturer,
and a model that will meet two key parameters: required
Q (flow rate) and TDH (total dynamic head)6.
To select a pump, look at the manufacturer’s pump
specifications to determine that the pump can indeed
draw from your required depth and at the needed flow
rate to supply the total daily water requirements with
the given sun energy at your location. To do this, look at
either a table of values showing how the pump operates
under various conditions, or look at a plot of this same
information in what is called the pump curve, which
graphically illustrates how the pump may operate under
different Q and TDH values. The spreadsheet gives operation values for several SunPump pumps as examples
for designing a pumping system (Figure 9).
Let’s say we need to pump 7.2 gpm from a TDH
of 114 feet. If we look at pump data for an example
pump—a SunPumps model 10-230—you should notice
that at different TDH values the pump will move water
at different flow rates and efficiencies and will require
different power. For bigger TDH values, the pump will
move less water per minute (flow rate decreases). If the
pump is operating at 60 V and the TDH for the well is
about 116 feet (slightly above our required 114 ft), then
this pump can only pump up to 4 gpm and requires
257 W of power to operate. If the same pump operates
at 75 V and has the same TDH requirement, then it
can pump at a flow rate of 8.9 gpm but needs 470 W of
power. This pump operating at 75 V with 470 W of PV
panels would meet our needs.
To see this graphically, pump curves plotting the
values of TDH and Q for four models of pumps (SunPump 4-235, 10-230, 18-160, and 30-115), each operating at 75 V, are provided in graph form in the Pump
Selection page (Figure 10).
When each pump’s data is plotted, it yields a curved
line. Any point on the line is an intersection of TDH
and Q, and we can use this line to determine if a pump
will work for our required TDH and Q. If, for example,
our situation has a TDH requirement of about 114 feet
and a Q of 7.2 gpm, then that would be represented by
the red dot, which we have marked with the two red arrows from the GPM and TDH axes (Figure 10). Here,
we can see that the pump point is above the line for the
4-325 pump, beyond (to the right of ) the TDH limits
of both the 30-115 and 18-160, but under the line of
6
Figure 9. Data table of an SCS-10-230 pump.
the 10-230 pump. This indicates that ONLY the 10-230
operating at 75 V would work for our situation, while
the other three pumps would not.
A pump MUST be able to meet the required TDH
and Q, and by looking at pump specifications and pump
curves, we can determine a pump’s suitability for the well
and water requirements. To choose a pump, look at the
manufacturer’s pump data (or pump curve) and select a
type and model that will exceed the requirements of both
our flow rate (Q) and total dynamic head (TDH).
To add a little more complexity to the choice, each
pump can operate at different voltages and at different
efficiencies. Pump efficiency is how well it converts its
power supply (electricity from the PV panels) into the
mechanical work of moving water. If a pump must do
100 W of work to move the water from the well to the
discharge point and is 33% efficient, then it will need
300 W of electrical power (100 / 0.33 = 300). Most
pumps operate from 25% up to about 50% efficiency.
The better efficiencies of a pump are typically found
around the “knee” of the pump curve. The more efficiently a pump operates, the less power will have to be
supplied by the PV panels. We therefore generally try
to pick a pump that we could run at the best voltage
For more information, see Solar Water Pumping: A Practical Introduction by Windy Dankoff (http://www.solarray.com/TechGuides/DankoffPumpArticles_T.php)
or Argaw et al. (2003), Renewable Energy for Water Pumping Applications in Rural Villages (http://www.nrel.gov/docs/fy03osti/30361.pdf ); chapter 4 of Argaw et
al. (2003) contains a discussion of different types of pumps.
Circular 671 • Page 7
Figure 10. Pump curves of
different SunPump pumps
operating at 75 V.
Figure 11. Pump Selection sheet.
and best efficiency while requiring the lowest PV wattage. By using optimal values, the size and number of
required PV panels is minimized, lowering costs.
The spreadsheet will go through this process using
the calculated TDH and Q from previous sheets and the
sample set of pump data/curves to recommend the best
choice of pump from the small set of example pumps
we have in the spreadsheet database. You can view the
recommended pump choice table data and pump curve
by clicking on the “GO!” cells (Figure 11). To return to
the top of the page, click on the “Go back to start!” cell
at the top of the Pump Selection sheet.
Our example (Figure 11) has pumping requirements
of 7.2 gpm for Q and 114 ft for TDH. The system has
displayed its recommended pump of 10-230, recommended operating voltage of 75 V, and recommended
PV panel power of 503 W.
The system will calculate the required power needed
based upon its optimal operating point of Q and TDH,
the real pump efficiency at this point (36% in this case),
and a “de-rating factor” applied to the PV panels. PV
panels lose efficiency through age, high temperatures,
and soiling (dust, etc.), and often de-rate their power by
a certain percentage; as a result, the spreadsheet calculations typically use only 85% of the panel’s rated power.
You can choose to enter a different pump model,
operating voltage, and PV power in the three green cells
at the bottom right corner, as well as different efficiency
values for the PV panels and the pump (Figure 11).
These values were restricted to a certain range to avoid
unusual scenarios when inputting efficiencies that are
too low or too high. The minimum efficiency value for
the PV panel is 50% and for the pump is 10%. Error
messages will be displayed if your choices are not func-
Circular 671 • Page 8
Figure 12. Array Sizing sheet.
tional under the parameters of Q and TDH (i.e., will
not work under these conditions).
Step 6. Determine the Size and Number
of PV Panels Needed
Navigate to the sheet titled Array Sizing (Figure 12),
whose function is to determine the size and number
of PV panels required to meet your chosen pump and
well criteria. Panels can be combined in series (called
a string) to provide enough voltage for the pump to
operate efficiently, and strings can be combined in
parallel to provide enough total power (wattage) for
the pump to work at the required Q and TDH. The
spreadsheet also determines the optimal electrical wire
size for your system. Too small a wire will lose power
and be a potential safety hazard, while too large a wire
size will increase costs.
In this “teaching example,” you are given a choice of
ten standard-sized PV panels as possible choices, from
50 W to 315 W each. You may choose any of the ten
and the system will use this choice to determine how
many are needed in a string (increasing voltages to
match that required of the pump) and how many strings
are needed in parallel (to meet total pump power). The
system also takes into account losses in the system and
de-rating factors of the panels. Given the well scenario
from the user-supplied entries, the system will try to optimize a recommended choice of panel size and display
this value for you.
In the previous sheet (Pump Selection), you chose a
pump operating at 75 V and needing 520 W of power
(shown in yellow at the top of the Array Sizing sheet).
Under the picture of a solar panel, the system has calculated an optimal choice from the ten PV panels. It has
also shown three more potential choices that would be
the next-best choices (1, 3, and 10).
The system determines how many panels are needed in
series (a string) to get to the required 75 V, and then how
many strings are needed to get to the required 520 W of
total power. Also shown is the total number of panels and
the total power generated with this choice; this must be
greater than the power required to function at these parameters. Here, a #10 choice of 315 W each will require
two panels and give us 622 W total, taking into account
losses in wiring.
Small wires can be dangerous and have high power
losses, and the system therefore tries to optimize the wire
size for minimizing losses and cost. The “Acceptable voltage wire losses” entry at the very bottom right allows
you to enter different losses in the wiring that could be
Circular 671 • Page 9
Figure 13. Design Spec sheet.
Figure 14. Total amount of water pumped in winter and summer.
acceptable and bases wire size choice on this and other parameters. Typically, wire losses should stay below 5%, and
wire size should be between #6 and #12AWG.
Step 7. Summary and Economics
Navigate to the sheet titled Design Spec (Figure 13),
which summarizes the previous sheets and generates design specifications for your direct-coupled solar pumping system scenario. The sheet includes an itemized list
of many of the required materials, descriptions of each
(e.g., size and model names), the quantity of each item
or material, an itemized total for each item or material,
and an approximate grand total price for the entire system, not including labor, well, construction materials,
and other balance-of-system costs. The pipe is assumed
to be PVC and the wire is priced at a 250-ft roll, with
length calculated from the pipe length plus 25%. Federal tax credits and an average regional state tax credit
are also shown; a link to specific state credits (http://
www.dsireusa.org/) is also provided so you can view
your state’s available tax credits. Example prices and tax
information are from 2012 and from a random supplier.
No endorsement of this supplier is implied, and prices
always change and should only be used as a guide. You
do not have to input any data within this sheet.
We’re Done
If you want, print out the Design Spec sheet and go to
the Conclusion sheet before closing the spreadsheet.
The Conclusion sheet shows an “example only” system
and displays the total amount of water that would be
pumped in summer and in winter with this system on a
clear day. Because we used worst-case values, these will
be greater than the calculated required daily amount of
water. Typically, this is not an issue if you have system
shut-off sensors in the storage tanks, and it is always
better to be slightly over-designed. However, if you
designed for a summer-only system, the amount of
Circular 671 • Page 10
water that would be pumped in winter may not meet
the requirements because we have tried to optimize for
that seasonal choice.
In Figure 14, the total water pumped is shown as
3555 gallons per day, which exceeds the required 2834
gallons per day. This is based upon a summer seasonal
choice; if you pump during the winter season, you
should be aware that the water pumped might not meet
the required values.
You have now gone through the basic step-by-step
method to design a direct-coupled solar water pumping
system. The parts and materials can be purchased through
many different suppliers, many of which also provide
professional installation and consulting. Remember that
this is an educational tool and should only be used in
that manner. If you are in need of further assistance,
you can contact most solar pump manufactures, the
NMSU College of Engineering’s Engineering NM
program, or your local county Extension agent.
ACKNOWLEDGMENTS
The author wishes to express extreme gratitude for the assistance of the NMSU College of Engineering and Engineering NM (http://engr.nmsu.edu/index.shtml), NMSU
Cooperative Extension Service (http://extension.nmsu.
edu), New Mexico Space Grant Consortium (http://www.
nmspacegrant.com), Southwest Technology Development
Institute (http://www.nmsu.edu/~tdi), and NMSU Department of Engineering Technology and Surveying Engineering (http://et.nmsu.edu).
REFERENCES
Bartlett, B. n.d. Watering systems for grazing livestock
[Online]. Available from http://www.msue.msu.edu/
objects/content_revision/download.cfm/
revision_id.557516/workspace_id.213590/Watering%20
Systems%20for%20Grazing%20Livestock.pdf
Buschermohle, M., and R. Burns. n.d. Solar-powered
livestock watering systems [Online]. Available from
https://utextension.tennessee.edu/publications/
documents/pb1640.pdf
Foster, R., and A. Ellis. 2003. Renewable energy for
water pumping applications in rural villages [Online;
NREL/SR-500-30361]. Available from http://www.
nrel.gov/docs/fy03osti/30361.pdf
Masters, G.M. 2004. Renewable and efficient electric power
systems. Hoboken, NJ: John Wiley & Sons, Inc.
Morris, M., and V. Lynne. 2002. Solar-powered livestock watering system [Online]. Available from
http://www.clemson.edu/sustainableag/IP217_
solar_livestock_watering.pdf
Mott, R.L. 2006. Applied fluid mechanics, 6th ed. Upper
Saddle River, NJ: Pearson Prentice Hall.
National Renewable Energy Labs. 1997. Electricity
when and where you need it: From the sun: Photovoltaics for farms and ranches [Online; NREL/
BR-412-21732]. Available from http://www.nrel.gov/
docs/gen/fy97/21732.pdf
Pfost, D., J. Gerrish, M. Davis, and M. Kennedy. 2007.
Pumps and watering systems for managed beef grazing [Online]. Available from http://extension.
missouri.edu/p/EQ380
Surber, G., K. Williams, and M. Manoukian. n.d.
Drinking Water Quality for Beef Cattle: An Environment Friendly & Production Management Enhancement Technique [Online]. Available from http://
animalrangeextension.montana.edu/articles/
natresourc/Drinking%20Water%20Quality%20
for%20Beef%20Cattle.pdf
Wiles, J. 2001. Photovoltaic power systems and the National Electrical Code: Suggested practices. Sandia National Laboratories, SAND87-0804
INTERNET LINKS
New Mexico State University’s Water Task Force,
various publications: http://aces.nmsu.edu/pubs/
taskforce/#water
NMSU YouTube Video on Solar Water Pumping:
http://www.youtube.com/watch?v=4gFbCdHle0w&
list=PL89870B418A514D27&index=10&feature=pl
pp_video
NMSU YouTube Videos on Renewable Energy Topics:
http://www.youtube.com/playlist?list=PL89870B418
A514D27
Circular 671 • Page 11
Thomas Jenkins has been a
professor in NMSU’s Department
of Engineering Technology and
Surveying Engineering since 1990.
He previously worked for many
years in both private and public
sectors as a computer scientist and
engineer. Professor Jenkins lead
the effort to develop the College of
Engineering Renewable Energy
Technology minor and helped establish the NMSU student organization Engineers Without Borders.
Disclaimer: This document is intended for educational purposes only, i.e., to provide a basic understanding of terminology and concepts of design. It is not intended to be used beyond this purpose. The author tried to use good engineering
analysis; however, all situations are different, and you should consult a professional in all cases.
Brand names appearing in publications are for product identification purposes only. No endorsement is intended, nor
is criticism implied of similar products not mentioned. Persons using such products assume responsibility for their use in
accordance with current label directions of the manufacturer.
Contents of publications may be freely reproduced for educational purposes. All other rights reserved. For permission to use
publications for other purposes, contact [email protected] or the authors listed on the publication.
New Mexico State University is an equal opportunity/affirmative action employer and educator. NMSU and the U.S. Department
of Agriculture cooperating.
Revised September 2014
Las Cruces, NM
Circular 671 • Page 12