1
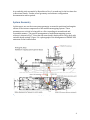
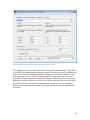
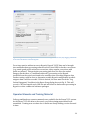
R/V Hugh R. Sharp Multibeam Echosounder System Review Multibeam Advisory Committee Sea Acceptance Team October 31st, 2012 Report prepared by: Jonathan Beaudoin Center for Coastal and Ocean Mapping/Joint Hydrographic Center University of New Hampshire Durham, NH This material is based upon work supported by the National Science Foundation under Grant No. 1150574. Table of Contents Introduction .............................................................................................................................. 3 Survey System Components...........................................................................................................3 Activities...............................................................................................................................................3 System Geometry..................................................................................................................... 4 Sensor and software configuration for offsets ........................................................................7 Acquisition Configuration.................................................................................................. 11 Operator Manuals and Training Material .................................................................... 14 Deployment of MAC Software Tools, Utilities and Documentation ..................... 15 SVP Editor ......................................................................................................................................... 15 Saturation Monitor ........................................................................................................................ 15 Configuration Documentation ................................................................................................... 16 System Performance............................................................................................................ 16 Principal Findings and Recommendations.................................................................. 18 References .............................................................................................................................. 21 Any opinions, findings, and conclusions or recommendations expressed in this material are those of the author(s) and do not necessarily reflect the views of the National Science Foundation. 2 Introduction R/V Hugh R. Sharp undertook an informal sea acceptance test and training session in support of the vessel’s Reson 7125 multibeam echosounder in the vicinity of Lewes, DE from Oct 24-‐26, 2012. Participants in the installation, calibration and training were: • Timothy Deering (UDEL) • Wynn Tucker (UDEL) • Ted Cummiskey (UDEL) • Brian Kidd (formerly of UDEL) • Justin Friesner (Reson) • Jonathan Beaudoin (UNH) The author participated in the activities as part of the NSF funded Multibeam Advisory Committee (MAC) project, an effort to improve the data quality from multibeam echosounders in the U.S. academic fleet. Survey System Components The mapping system consists of the following components: • Reson 7125 SV2/FP3 multibeam echosounder (200/400 kHz) with surface velocimeter • Applanix POSMV V5 inertial measurement unit (IMU): s/n 5250, HW1.1-‐10, SW06.13-‐Aug24/11 • Seabird 911 conductivity-‐temperature-‐depth (CTD) sensor • Hypack 2012 data acquisition software Activities The ship visit occurred during a pre-‐cruise mobilization from Oct. 24 and also included part of the following cruise due to time constraints imposed by Hurricane Sandy. System installation was largely completed prior to the visit by Tim Deering and was fine tuned by the Reson technician on October 24th. A patch test calibration procedure was completed in Delaware Bay by the Reson technician on October 25th followed by training in Hypack and Reson software by the visiting Reson technician for the shipboard technicians. Training was continued on October 26th, along with a test mapping survey during a shortened science cruise ~15NM offshore of Delaware prior to the arrival of Hurricane Sandy. 3 A second ship visit was made by Beaudoin on Nov. 9 to make up for the lost time due to Hurricane Sandy. Further vessel geometry and software configuration documentation was acquired. System Geometry In this report, we use the term system geometry to mean the positional and angular offsets of the various components of the multibeam mapping system. These parameters are critical to being able to collect soundings in an unbiased and repeatable manner. The general arrangement of multibeam mapping system sensors is shown in Fig. 1. Note that the sonar head is deployed on a drop keel with variable depth settings. Figure 2 is a photograph of the arrangement of POSMV GPS antennae on the forward mast. Figure 1. General layout of multibeam mapping system components. 4 Figure 2. POSMV GPS antennae on forward mast as viewed from astern. In these types of visits, the MAC usually examines existing reports, ship drawings and records of survey configuration changes with the aim of independently coming to a set of linear and angular offsets for the ship mapping system components. The only documents available for review consisted of a 2009 survey summary drawing that documented offsets of the two POSMV antennas and the sonar plate, both of which are with respect to the POSMV IMU. Measurements were provided in feet and in meters, however, the sign of the offsets was not carefully transferred between the two systems and care should be taken when referring to this document. The water line offset with respect to the IMU was established by running a clear hose from a through-‐hull fitting up to the auxiliary engineering space where the IMU is installed. The seacock was opened while dockside and a mark was made on the wall opposite the POSMV IMU. The height difference between the reference point (top of the POSMV) and the waterline was determined via a water level and was measured as 0.48 m below the IMU, see Fig. 3. 5 Figure 3. Measurement of water line relative to POSMV IMU. The vessel offsets are summarized in Table 1 using the same coordinate system described by the 2009 survey: • The positive along ship axis points towards the bow • The positive athwart ship axis points to starboard • The positive vertical axis points upward Table 1. Summary of Vessel Linear Offsets in 2009 Survey Coordinate System. Object X (m, positive forward) 0.00 0.00 -‐1.68 4.980 Y (m, positive stbd) Z (m, positive up) 0.00 0.00 -‐0.125 -‐1.804 0.00 -‐0.48 -‐0.402 15.795 POSMV GPS starboard 4.947 1.940 15.792 Sonar head -‐1.767 -‐0.125 -‐4.29 POSMV IMU Water line Sonar plate POSMV GPS port 6 (drop keel flush with hull) The drop keel holds four pods that can accommodate a variety of sensors with the multibeam sensor in the forward most pod. Assuming that the “Sonar plate” referred to in the 2009 survey is the top of the pod when in the flush position, the total multibeam vertical offset is determined through the following: 1. 0.402 m below the RP to the sonar plate 2. An additional offset to accommodate the vertical extent of the sonar pod. 3. An additional offset to accommodate for the distance from the bottom of the sonar pod to the transducer’s reference point (typically the center of the projector). The Reson technician measured the offsets associated with (2) and (3) but only provided the total offset of -‐4.29 m when the drop keel is deployed flush with the hull. Furthermore, the measurements made by the technician indicate a slight along-‐ship offset between the sonar plate and the sonar head (the sonar head is 8.7 cm aft of the sonar plate); presumably this is due to the shift between the sonar plate and the sonar head’s reference point (again, this is typically the center of the projector). The drop keel system can be deployed in four configurations: 1. Retracted into the hull 2. Flush with the hull, sonar z-‐offset is -‐4.29 m relative to the IMU. 3. 1 meter proud of the hull, sonar z-‐offset is -‐5.29 m relative to the IMU. 4. 2 meters proud of the hull, sonar z-‐offset is -‐6.29 m relative to the IMU. Sensor and software configuration for offsets The offsets are placed as follows in the POSMV and Hypack configurations after allowing for changes in sign conventions and shifts of origin as explained below. No offsets are entered into the Reson configuration except for the relative offsets between the 7125 transmitter and receiver (these are pre-‐configured according to the mounting bracket sold with the unit and should not be modified). It is important to point out that double entry of offsets is a common source of positioning bias in multibeam echosounding data and that care should be taken to avoid this. For this particular installation, the POSMV is only configured with the offset to its primary GPS antenna. All other offsets, both linear and angular, are configured in Hypack. Incorrect offsets in the POSMV are difficult to recover from. Incorrect offsets in Hypack are recoverable (as long as the correct offsets are known!) through post-‐ processing in software such as Caris HIPS or in Hypack itself. Applanix 7 The POSMV IMU is set as the reference point in the Applanix software, thus offsets in Table 1 do not require any shift of origin. The only offset entered in the POSMV configuration is that of the primary (starboard) antenna. The position of the secondary antenna is established through the built-‐in GAMS calibration routine. The Applanix coordinate system differs from the 2009 survey in the positive direction of the z-‐axis, thus the starboard antenna’s z-‐offset becomes -‐15.792 m, as shown in Fig. 4. With the POSMV configured as such, the reported position sent to Reson or Hypack acquisition via Ethernet or serial cable will be the position of the POSMV IMU itself. Post-‐processing software should typically not be configured with the POSMV primary GPS antenna offsets since the reported positions are corrected for this already. Figure 4. Applanix POSMV configuration of primary GPS lever arm offset. Hypack The reference point, as configured in the Hypack installation, is the position of the POSMV IMU. Hypack requires vertical offsets be referenced to the water line, thus all z-‐offsets must have 0.48 m removed to make them relative to the water line. The reference point, from the Hypack point of view, is now the position of the POSMV IMU projected down 0.48 m to the water line. As with the Applanix coordinate frame convention, the direction of the vertical axis differs in sign with respect to the 2009 survey, thus the sign of all z-‐offsets are changed. After the water line origin 8 shift, all z-‐offsets must have their signs reversed. Any z coordinate can be transformed as such: Zhypack = (Z2009_survey – (–0.48)) x (-‐1) = -‐ ( Z2009_survey + 0.48 ) For example, the sonar z-‐offset is calculated as: Zhypack = -‐ (-‐4.29 + 0.48 ) = 3.81 And the POSMV IMU z-‐offset is calculated as: Zhypack = -‐ (0.00 + 0.48 ) = -‐0.48 Water line offsets should be measured before and after survey cruises to capture draft variation with fuel consumption, etc. The water line z offset should be used to adjust Hypack z-‐offsets for the POSMV IMU and the Reson 7125 in Hypack using the examples above as a guide. All adjustments should be documented in the survey acquisition log. The POSMV provides the position of the IMU to Hypack thus Hypack does not require entry of the POSMV antenna offsets (as mentioned earlier, entering these offsets will create a positioning error as they will be doubly corrected for). The only offset entries required in Hypack are those of the multibeam head and the IMU with respect to the water line position immediately below the IMU. Table 2 summarizes the offsets as entered into Hypack. Fig. 5 shows entry of the POSMV IMU values in Hypack. Table 2. POSMV and Reson offsets as configured in Hypack. Object POSMV IMU Reson 7125 Along-ship (m, Athwart-ship (m, positive forward) positive to starboard) 0.00 0.00 -‐0.125 -‐1.767 Vertical (m, positive down) -‐0.480 3.807 9 Figure 5. Hypack configuration of POSMV IMU offsets. Note that Hypack insists that vertical offsets are measured from the waterline (second paragraph in “Position” panel). The configuration of the sonar head offsets in Hypack is shown in Fig. 6. Note that it is possible to accommodate the varying transducer depth in Hypack by adjusting the sonar z-‐offset in the HYSWEEP Hardware configuration module as shown in Fig. 6. This approach, however, involves exiting Hypack’s survey mode and it does not document the time that the keel depth was changed. Without good survey line log keeping, it would be difficult to recover from errors in this process since there is no record of when the keel depth was changed and to what value it was changed to. Options to accommodate the variable keel depth should be explored with Hypack personnel. 10 Figure 6. Hypack configuration to accommodate differing keel deployment scenarios. Note that Hypack insists that vertical offsets are measured from the waterline (second paragraph in “Position” panel). Also note that the patch test offsets, as determined by the Reson technician, are entered into the Reson 7125 sonar head offsets in the “Rotation” panel of Fig. 6. Recommendations include: • Documentation for the 2009 survey should be found and included in the survey configuration documentation. If sufficient documentation for the existing survey drawings cannot be found, a repeat survey should be performed at the next dry dock. • Photo documentation of various system components and measurement procedures to ascertain additional x/y/z offsets from sonar frame and sonar head from the MB plate in the original survey. Acquisition Configuration The systems on RV Hugh Sharp can be configured in a number of ways to accommodate various data logging requests. The current acquisition configuration has been found to be the most stable and is recommended for all future surveys: • Hypack records POSMV navigation and orientation via the network and only records the bathymetry data from the Reson 7125. It was found during the 11 • • • installation and calibration trials that the Hypack software was highly unstable when recording Reson “snippets” and “sidescan” data. Testing should be done to determine if stability improves with only the “snippets” data being recorded. Raw data are stored in .HSX data files in each project’s Raw subdirectory. If science parties are interested in acquiring seabed imagery, the most stable solution found during the trials was to have the Reson 7kCenter software record the sounder data in .s7k files. A series of record type filters must be set such that the appropriate data records are recorded. Refer to Fig. 7. Again, Hypack may prove to be stable when only recording the “snippets” data (but not the “sidescan” data). The Hypack driver for the Reson 7125 is currently configured to send start/stop logging commands to the Reson software during such events in Hypack such that the operator only needs to start/stop logging in Hypack. Refer to Fig. 8. POSMV should record raw “POSPAC” data to accommodate post-‐processing of TrueHeave or to perform an ellipsoidally referenced survey (ERS). These data should be recorded at a high rate (100 Hz) if they are being used to correct for roll, pitch and heading. If they are only being used to correct for TrueHeave or for ERS, the data rate can in theory be lowered, however, this limits the usability of the POSMV raw data records in the event that Hypack orientation data are corrupt and it is suggested to maintain the 100 Hz data rate at all times. 12 Figure 7. Data recording setup in Reson 7kCenter to enable seabed imagery acquisition. 13 Figure 8. Hypack driver configuration for Reson 7125 allowing for remote start/stop logging commands to be sent to the Reson 7125 from Hypack. For science parties without access to Hypack, Hypack “.HSX” data can be brought into multibeam data processing software such as Caris HIPS for further corrections (e.g. sound speed profile refraction corrections, tides, angular corrections with patch test offsets). This particular processing path does not allow for seabed imagery (backscatter, or “multibeam sidescan”) processing as the Hypack installation on the vessel was found to be unstable when recording snippets data. Further testing could be done to determine a stable Hypack configuration in which snippets data could be recorded. If this is desired, the user must check the “Log Seabat Datagrams” checkbox in the Reson Setup dialog shown in Fig. 8. This will record a .7K file alongside each .HSX file and will allow for backscatter processing in Hypack or other commercial software packages. Operator Manuals and Training Material Softcopy and hardcopy operator manuals were available for the Reson 7125 system. As the Reson 7125 was new to the vessel, very little training material had been assembled. Training was cut short due to Hurricane Sandy shifting a cruise forward in time. 14 Deployment of MAC Software Tools, Utilities and Documentation SVP Editor SVP Editor is an application that provides pre-‐processing tools to help bridge the gap between sound speed profiling instrumentation and multibeam echosounder acquisition systems. This software was developed and is maintained by the Multibeam Advisory Committee (MAC) and is freely available online at http://mac.unols.org. This software has been installed on the CTD processing machine and training has been provided to all MTs. The software supports the Seabird CTD “cnv” sensor output format available on Hugh Sharp and provides for graphical data interaction in which the operator can validate measurements, remove outliers and extend profiles beyond their maximum sampling depth using oceanographic databases or user-‐specified reference casts. After processing, the SVP Editor can export the cast into a format compatible with Hypack (.vel) or Caris HIPS (.svp). It is recommended to use this software to process and upload all sound speed information for the Reson 7125. The software is routinely updated, more information can be found on the MAC website at mac.unols.org. Further information on the SVP Editor can be found in the user’s manual (Beaudoin, 2012). Saturation Monitor An experimental signal saturation monitor (Saturation Monitor) was installed on the Reson/Hypack PC in support of a research cruise immediately following the Reson 7125 installation in which the author participated. The software was developed by LTJG Glen Rice of NOAA OCS while stationed at UNH’s Center for Coastal and Ocean Mapping/Joint Hydrographic. The software is based on graduate research conducted by LT Sam Greenway, also of NOAA, and is designed to monitor the received echo strength of the Reson 7125 signal relative to a signal level ceiling at which the sonar will be driven into a non-‐linear response regime. The software was left installed on the Reson/Hypack PC in anticipation of future cruises in 2012/2013 during which the author will use the software. Training was provided to the technicians on how to run the software but more documentation should be provided on the installation process and background theory. The software is considered experimental and should not be used for other cruises without consulting the MAC as its misuse could lead to significantly degraded seabed imagery data quality. 15 Configuration Documentation Cookbook style documentation has been provided to the technicians to document and to facilitate verification of system configuration for the POSMV, Reson 7125 and Hypack. These provide detailed, step-‐by-‐step instructions that allow those who are not necessarily intimately familiar with the system to verify critical system settings prior to a mapping mission. These documents are continually updated and newer versions can always be found on line at http://mac.unols.org. Softcopy versions of each of the three documents were provided to the marine technicians in both PowerPoint and PDF format such that updates can be done by technicians to the PowerPoint files and propagated back to the MAC to update copies on the MAC website. System Performance A short survey was undertaken immediately after the installation on October 26th as part of a mapping cruise led by Dr. Art Trembanis of the University of Delaware. This cruise allowed for preliminary assessment of the mapping system’s capabilities. After a patch test, data were acquired over the Red Bird reef site, approximately 15 NM off the coast of Delaware Bay in 27 m of water. Conditions at sea were fair at the beginning of the short cruise but began to degrade toward the evening with the approach of Hurricane Sandy. Bubble wash down events degraded the quality of seabed imagery and bathymetry, leading to data artifacts in mapping products derived from these data, see Fig. 9. The area was mapped in two parts with a ~7 hour break in between to return the Reson technician to shore and conduct other science operations. The first half of the survey was conducted with the drop keel deployed 1 m and the second half of the survey having the keel extended to 2 m. Bubble wash artifacts affected data quality in both configurations, however, it is difficult to discern which of the two configurations is less prone to wash down events due to the long break between the surveys over which wind and sea conditions changed. Though it was initially planned to map the area twice (once at 400 kHz and again at 200 kHz), there was insufficient time and only the 400 kHz coverage was obtained. 16 Figure 9. Example of data artifacts due to bubble wash down events. Seabed imagery (“backscatter”) is shown in the lower right and upper half. A hill shaded terrain model is shown for the same area in the lower left. The wash down related artifacts are correlated with survey line orientation (they are worse on every second line) and thus appear to have a heading dependency. A second mapping survey was completed over the same site on November 10, 2012, again with Dr. Art Trembanis of UDEL. Sea conditions were excellent with 2 ft seas and light winds. Data quality was excellent at 400 kHz. The area was mapped a second time at 200 kHz but the data suffered from increased self-‐noise levels at this frequency, leading to bottom tracking artifacts. It should be noted that the primary goal of the 200 kHz survey was to acquire high quality acoustic backscatter data within the linear regime of the sonar’s receiver. The saturation monitor indicated that the source level should not exceed 195 dB; this is much less that what the manufacturer typically recommends in order to achieve high quality bottom tracking across the swath. The problems with decreased signal-‐to-‐noise ratio (SNR) associated with the low power setting could be due to the configuration particular to this survey and not indicative of achievable performance at higher source levels (at the cost of saturated backscatter measurements). 17 Principal Findings and Recommendations The Reson 7125 system is correctly installed and integrated with the POSMV and Hypack acquisition system and there is no indication of errors in the integration of the systems. There remains uncertainty in the absolute accuracy of the depths due to the inadequately documented sonar z-‐offset calculation. High quality surveys were collected during the cruise immediately following Hurricane Sandy (Nov. 10, 2012) and attest to the quality of the installation and the integration of the survey system components. The system was seen to suffer from bubble wash down effects during the pre-‐ Hurricane Sandy survey where wind speed was steadily increasing. Further testing should be done to better appreciate the degradation of data quality with wind speed and sea state. These types of studies, which can typically be done in less than one day, lead to improved ability to assess whether or not the system will be limited by weather conditions and can aid in management of survey system assets and can help answer questions like “should we even bother going out in this weather?”. The MAC is prepared to contribute personnel for planning, acquisition, processing and analysis if time for testing can be arranged. The range of depths encountered throughout the testing trials did not exceed the maximum range of the system. It is recommended to obtain data over a larger range of depths to better understand the range limitations of the system for both 200 kHz and 400 kHz modes and to establish practical working limits for the system. The MAC is committed to providing personnel for these additional tests if they are desired. Due to the shortened technician training period, it is recommended that follow up training be sought on the operation of the Reson 7125. The MAC can provide training and/or can provide recommendations for different training solutions. The training should be Reson specific as this type of sounder requires much more involved planning and operation as compared to sounders on deep-‐water vessels in the US academic research fleet. Additional sensor and/or software specific recommendations are listed below. Reson -‐ Define a safe default set of operating parameters and save configuration files in safe location on network (and on land) in read only format, use this to “reload” safe settings for each project as system settings will slowly wander from ideal settings with varying operators from cruise to cruise. 18 -‐ -‐ Get 2nd network card in Reson machine, put it on the ship network to allow for data backup, transfer, etc; this enables science parties to do near real-‐ time QC The Reson sound speed probe (velocimeter) should be occasionally checked against the CTD and TSG, online calculators to compute speed of sound from TSG can be found at http://resource.npl.co.uk/acoustics/techguides/soundseawater/content.ht ml; the calculators are java scripts embedded in the webpage that can be saved locally for use when there is no internet connectivity. POSMV -‐ Backup the configuration file on the network and off ship, the configuration files should be date/time tagged and made read-‐only. -‐ There was a “write-‐error” message report by the POSMV, the manufacturer should be contacted about this. -‐ A network switch should be added in the topside rack to allow for local monitoring and recording of the POSMV on the bridge. -‐ The POSMV data should be recorded for all surveys to improve heave corrections or to allow improved vertical/horizontal positioning. It is strongly recommended that logging start at beginning of cruise and stop at end of the cruise for a number of reasons: o Minimize human error in start/stop logging process: During mapping cruises, a request to suddenly begin logging the multibeam data may occur as a scientist walks by the multibeam display and it is beneficial in these cases to have the POSMV logging already. o Eases post-‐processing tasks: file management becomes difficult when the POSMV data are broken over several missions. o Provides a continuous tidal signal for other science mission instrumentation: low pass filtering the POSMV height data can provide tidal correctors for other instrumentation deployed during a cruise. Hypack -‐ Establish a safe default project that is configured for all mapping sensors and offsets that you can quickly bring online in the event of Hypack project file corruptions that detract from system stability. -‐ Establish a set of SOPs to create Hypack projects, acquire and evaluate patch test calibration data, process data. -‐ It is important to configure Hypack such that it is gridding the sounding data into its matrix. This is important for three reasons: o This helps ensure desired coverage is being achieved. The planned amount of swath coverage is based on an assumed depth and will depend on the actual depth when on site. Survey lines are planned typically using the assumed depth and may need to be adjusted to ensure overlap. 19 o The real-‐time grid also facilitates quality assessment. If there is a problem with the motion sensor or sound speed profile, it will be noticeable in the grid and action can be taken to rectify the situation. o This greatly increases the chances of noticing when a survey line has accidentally skipped during a grid survey since it is very noticeable if there’s a hole in the real-‐time grid (matrix). Miscellaneous -‐ Establish SOPs for various logging scenarios: Hypack logging, POSMV logging, 7kCenter logging. Document pros/cons of each method to help inform science party decisions on what mode of acquisition works best for their needs. The MAC can assist with this during a future visit. -‐ The water line offset should be measured pre and post cruise. This value should be adjusted in Hypack and noted in the multibeam acquisition and/or processing log along with time of measurement. -‐ A meter stick should be installed in the auxiliary engine space and zeroed at the height of the IMU instead of relying on marks on the wall to measure water level. Signage should be installed alongside the meter stick to indicate to all personnel the importance of the exact placement of the meter stick in the event that it needs to be removed. -‐ In addition to being used to adjust the sonar z-‐offset in Hypack, the drop keel deployment depth should be noted in the acquisition log for every survey. Along with the uncertain sonar z-‐offset from the installation process, this is potentially the largest potential source of error in this particular installation. A clear and concise SOP should be developed to avoid this potential source of error. Along the same lines, the Reson technician should be contacted to request installation and calculation notes to establish the method used to calculated the sonar z-‐offset. The z-‐offset measurement process and calculation should be repeated by technicians, with the aid of the MAC if desired, and documented such that others could repeat the procedure. 20 References Beaudoin, J. (2012). “SVP Editor Software Manual”, Version 1.0.3 (Sept. 21, 2012), available online via anonymous FTP at ftp://ftp.ccom.unh.edu/fromccom/MAC_DATA/svp_editor/v1.0.3_20120921 /SVP%20Editor%20Manual%20v1.0.3.pdf 21