1
IAR C-SPY® Hardware Debugger
Systems
User Guide
for the Renesas
78K0/78K0S and 78K0R
Microcontroller Subfamilies
CS78KHW-4
CS78KHW-4:Final
COPYRIGHT NOTICE
Copyright © 1998-2010 IAR Systems AB.
No part of this document may be reproduced without the prior written consent of IAR
Systems AB. The software described in this document is furnished under a license and
may only be used or copied in accordance with the terms of such a license.
DISCLAIMER
The information in this document is subject to change without notice and does not
represent a commitment on any part of IAR Systems. While the information contained
herein is assumed to be accurate, IAR Systems assumes no responsibility for any errors
or omissions.
In no event shall IAR Systems, its employees, its contractors, or the authors of this
document be liable for special, direct, indirect, or consequential damage, losses, costs,
charges, claims, demands, claim for lost profits, fees, or expenses of any nature or kind.
TRADEMARKS
IAR Systems, IAR Embedded Workbench, C-SPY, visualSTATE, From Idea To Target,
IAR KickStart Kit, IAR PowerPac, IAR YellowSuite, IAR Advanced Development Kit,
IAR, and the IAR Systems logotype are trademarks or registered trademarks owned by
IAR Systems AB. J-Link is a trademark licensed to IAR Systems AB.
Microsoft and Windows are registered trademarks of Microsoft Corporation.
Renesas is a registered trademark of Renesas Electronics Corporation.
All other product names are trademarks or registered trademarks of their respective
owners.
EDITION NOTICE
Fourth edition: May 2010
Part number: CS78KHW-4
This guide applies to version 4.x of IAR Embedded Workbench® for 78K.
Internal reference: R13, Too6.0, IMAE.
CS78KHW-4:Final
Contents
Tables
...................................................................................................................... vii
Figures
..................................................................................................................... ix
Preface
..................................................................................................................... xi
Who should read this guide ................................................................ xi
How to use this guide ............................................................................ xi
What this guide contains .....................................................................xii
Other documentation ...........................................................................xii
Document conventions .......................................................................xiii
Introduction to C-SPY hardware debugger systems
....................... 1
The IAR C-SPY hardware debugger systems .............................. 1
Differences in debug support ............................................................... 2
The IAR C-SPY Emulator drivers ..................................................... 2
Getting started .......................................................................................... 3
Running the application ....................................................................... 4
Emulator-specific debugging
.......................................................................... 7
Setting up the debugger system ........................................................ 7
Setup ................................................................................................... 7
Hardware configuration ...................................................................... 8
Emulator menu ..................................................................................... 9
Hardware Setup – IE-78 ..................................................................... 11
Hardware Setup – IECUBE/MINICUBE/MINICUBE2/TK-78 for
78K0 and 78K0S ................................................................................ 14
Hardware Setup – IECUBE/MINICUBE2/TK-78 for 78K0R .......... 19
Mask Option ...................................................................................... 24
Pseudo emulation ............................................................................... 24
DMM Function Settings (IECUBE for 78K0R and 78K0) ................ 24
Live Watch Setup .............................................................................. 26
Snap Shot Function Settings (IECUBE for 78K0R and 78K0) ......... 28
Stub Function Settings ....................................................................... 30
iii
CS78KHW-4:Final
Trace Setup – IE-78 .......................................................................... 32
Trace Setup – IECUBE ..................................................................... 34
Timer ................................................................................................. 37
Edit Events – IE-78 ........................................................................... 39
Edit Events – IECUBE/MINICUBE/MINICUBE2/TK-78 .............. 41
Edit Sequencer – IE-78 ..................................................................... 44
Edit Sequencer—IECUBE/MINICUBE/MINICUBE2/TK-78 ........ 45
Trace window ..................................................................................... 47
Trace toolbar ...................................................................................... 48
Trace Save .......................................................................................... 49
Find in Trace (not IECUBE for 78K0S) ............................................ 49
Function Trace window ..................................................................... 51
Find In Trace window ........................................................................ 51
Live Memory window ....................................................................... 52
IECUBE Flash Programming Emulation ...................................... 53
Flash Programming Emulation dialog box (IECUBE only) .............. 53
Edit Flash Emulation Events dialog box (IECUBE only) .................. 54
Edit Flash Emulation Timing dialog box (IECUBE only) ................. 55
Using breakpoints ................................................................................... 58
Event breakpoints ............................................................................... 58
Code hardware breakpoints ................................................................ 59
Breakpoint Usage dialog box ............................................................. 60
C-SPY use of software breakpoints ................................................... 60
78K0R Data Flash Emulation ............................................................. 61
Data Flash Emulation dialog box ....................................................... 61
Programmer PG-FPx Security Flags dialog box (IECUBE only) ...... 62
Flash Shield Setting dialog box (IECUBE for 78K0R) ..................... 63
Data Flash Memory window .............................................................. 64
Using the MINICUBE2 emulator .............................................................. 67
Overview .................................................................................................... 67
78K0 MINICUBE2 reserved resources .......................................... 68
ROM areas used for on-chip debugging ............................................ 68
RAM Space ........................................................................................ 69
IAR C-SPY® Hardware Debugger Systems
iv
User Guide for 78K
CS78KHW-4:Final
Contents
Pins ..................................................................................................... 69
Security ID and option bytes .............................................................. 69
Reserving the ROM memory area for the monitor ............................ 70
Stack area .......................................................................................... 71
Cautions on debugging for 78K0 ...................................................... 71
78K0S MINICUBE2 Reserved Resources .................................... 71
All ROM areas used for on-chip debugging ...................................... 71
RAM Space ....................................................................................... 71
Pins ..................................................................................................... 72
Security ID and the option bytes ........................................................ 72
Reserving the ROM memory area for the monitor ............................ 72
Stack area ........................................................................................... 74
Reserving resources of the serial interface ........................................ 74
Cautions on debugging for 78K0S .................................................... 76
78K0R MINICUBE2 Reserved Resources ................................... 76
ROM areas used for on-chip debugging ............................................ 76
RAM Space ....................................................................................... 76
Pins ..................................................................................................... 76
Security ID and option bytes .............................................................. 76
Reserving the ROM memory area for the monitor ............................ 78
Stack area for debugging .................................................................... 78
Cautions on debugging for 78K0R ................................................... 78
Further reading ....................................................................................... 78
Target system design .......................................................................... 79
Flash programming ............................................................................ 79
Index
....................................................................................................................... 81
v
CS78KHW-4:Final
IAR C-SPY® Hardware Debugger Systems
vi
User Guide for 78K
CS78KHW-4:Final
Tables
1: Typographic conventions used in this guide ........................................................ xiii
2: Differences in available debug support for different target systems ....................... 2
3: Project options for Nexus example ......................................................................... 4
4: Description of Emulator menu commands .............................................................. 9
5: Available memory types in IE-78 emulator .......................................................... 13
6: IECUBE/MINICUBE/MINICUBE2/TK-78 for 78K0 and
78K0S Target Power Off options ............................................................................... 16
7: IECUBE for 78K0 and 78K0S Fail-safe Break options ........................................ 17
8: Available memory types in IECUBE/MINICUBE/MINICUBE2/TK-78 for
78K0 and 78K0S ........................................................................................................ 18
9: IECUBE for 78K0R Fail-safe Break options ........................................................ 21
10: MINICUBE2/TK-78 for 78K0R Target Power Off options ............................... 22
11: Available memory types in IECUBE/MINICUBE2/TK-78 for 78K0R ............. 23
12: Emulator live watch options ................................................................................ 26
13: Description of trace operations in IE-78 series emulator .................................... 33
14: Description of trace trigger points in IE-78 series emulator ............................... 33
15: Description of trace operations in IECUBE emulator ......................................... 35
16: Description of stop conditions in IECUBE emulator .......................................... 35
17: Timer break options ............................................................................................ 38
18: Modifying IE-78 series events ............................................................................ 40
19: Modifying IECUBE events ................................................................................. 42
20: IECUBE events access type ................................................................................ 42
21: Modifying IE-78 series events ............................................................................ 45
22: Modifying IECUBE/MINICUBE/MINICUBE2/TK-78 events ......................... 46
23: Trace window columns ....................................................................................... 47
24: Trace toolbar commands ..................................................................................... 48
25: Find in Trace conditions ...................................................................................... 50
26: Flash emulation events settings ........................................................................... 54
27: 78K0 flash emulation timing error return values ................................................ 56
28: 78K0R flash emulation timing retry values ........................................................ 58
29: Event access types ............................................................................................... 59
vii
CS78KHW-4:Final
30: Security Flag values ............................................................................................ 63
31: Flash shield setting options ................................................................................. 63
32: Data Flash Memory window operations ............................................................ 64
33: Commands on the Data Flash Memory window context menu .......................... 65
34: MINICUBE2 debug features per microcontroller series ..................................... 67
35: Possible values for option byte v4 ...................................................................... 70
36: Possible values for option byte v3 ...................................................................... 77
IAR C-SPY® Hardware Debugger Systems
viii
User Guide for 78K
CS78KHW-4:Final
Figures
1: Communication overview ....................................................................................... 3
2: Emulator setup options ............................................................................................ 7
3: Emulator Hardware Setup message ........................................................................ 8
4: The Emulator menu ................................................................................................. 9
5: IE-78 series Hardware Setup dialog box ............................................................... 12
6: IECUBE/MINICUBE/MINICUBE2/TK-78 for 78K0 and
78K0S Hardware Setup .............................................................................................. 14
7: IECUBE/MINICUBE2/TK-78 for 78K0R Hardware Setup dialog box ............... 19
8: Mask Option Settings dialog box .......................................................................... 24
9: Pseudo Emulation dialog box ................................................................................ 24
10: DMM Function Settings dialog box .................................................................... 25
11: IE-78K0, TK-78 Live Watch Settings dialog box .............................................. 27
12: MINICUBE Live Watch Settings dialog box ..................................................... 28
13: Snap Shot Function Settings dialog box ............................................................. 29
14: Stub Function Settings dialog box ...................................................................... 31
15: IE-78 series Trace Settings dialog box ................................................................ 32
16: IECUBE Trace Settings dialog box .................................................................... 34
17: Timer Settings dialog box ................................................................................... 37
18: IE-78 series Edit Events dialog box .................................................................... 39
19: IECUBE//MINICUBE/MINICUBE2/TK-78 Edit Events dialog box ................ 41
20: IE-78 series Edit Sequencer Events dialog box .................................................. 44
21: IECUBE Edit Sequencer Events dialog box ....................................................... 45
22: Trace window ...................................................................................................... 47
23: Trace toolbar ....................................................................................................... 48
24: Trace Save dialog box ......................................................................................... 49
25: Find in Trace dialog box ..................................................................................... 50
26: Function Trace window ....................................................................................... 51
27: Find In Trace window ......................................................................................... 52
28: Live Memory window ......................................................................................... 52
29: Flash Programming Emulation dialog box ......................................................... 53
30: Edit Flash Emulation Events dialog box ............................................................. 54
ix
CS78KHW-4:Final
31: 78K0 Edit Flash Emulation Timing dialog box .................................................. 55
32: 78K0R Edit Flash Emulation Timing dialog box ............................................... 57
33: Event Breakpoints dialog box ............................................................................. 58
34: Code HW Breakpoints dialog box ...................................................................... 60
35: IECUBE Data Flash Emulation dialog box ........................................................ 61
36: Programmer PG-FPx Security Flags dialog box ................................................. 62
37: Flash shield setting dialog box ............................................................................ 63
38: The Data Flash Memory window ........................................................................ 64
39: Data Flash Memory window context menu ........................................................ 65
40: Register MK1 ...................................................................................................... 75
41: Register PM4 ....................................................................................................... 75
42: Register INTM1 .................................................................................................. 75
IAR C-SPY® Hardware Debugger Systems
x
User Guide for 78K
CS78KHW-4:Final
Preface
Welcome to the IAR C-SPY® Hardware Debugger Systems User Guide for
78K. The purpose of this guide is to provide you with detailed reference
information that can help you use the features in the IAR C-SPY® hardware
debugger systems.
Who should read this guide
You should read this guide if you want to get the most out of the features in the C-SPY
hardware debugger systems. In addition, you should have a working knowledge of:
●
●
●
●
The C or C++ programming language
Application development for embedded systems
The architecture and instruction set of the target processor (refer to the chip
manufacturer's documentation)
The operating system of your host machine.
This guide also assumes that you already have a working knowledge of the target system
you are using, as well as some working knowledge of the IAR C-SPY Debugger. For a
quick introduction to the IAR C-SPY Debugger, see the tutorials available in the IAR
Embedded Workbench® IDE User Guide.
How to use this guide
This guide describes the C-SPY interface to the target system you are using; it does not
describe the general features available in the IAR C-SPY Debugger or the hardware
target board. To take full advantage of the whole debugger system, you must read this
guide in combination with:
●
●
The IAR Embedded Workbench® IDE User Guide which describes the general
features available in the C-SPY debugger
The documentation supplied with the target board you are using.
Note that additional features may have been added to the software after the IAR C-SPY®
Hardware Debugger Systems User Guide for 78K was produced. The release notes
contain the latest information.
xi
CS78KHW-4:Final
What this guide contains
What this guide contains
Below is a brief outline and summary of the chapters in this guide.
●
●
●
Introduction to C-SPY hardware debugger systems describes the C-SPY emulator
systems and how they differ from the IAR C-SPY Simulator.
Emulator-specific debugging describes the additional options, menus, and features
provided by the emulator debugger systems.
Using the MINICUBE2 emulator contains important information about using the
MINICUBE2 OCD Emulator with the 78K0/78K0S and 78K0R Microcontroller
Subfamilies.
Other documentation
The complete set of IAR Systems development tools for the target processor are
described in a series of guides. For information about:
●
●
●
●
●
Using the IAR Embedded Workbench® IDE for 78K, refer to the IAR Embedded
Workbench® IDE User Guide
Programming for the IAR Compilers for 78K, refer to the IAR C/C++ Compilers
Reference Guide for 78K
Programming for the IAR Assemblers for 78K, refer to the IAR Assemblers
Reference Guide for 78K
Using the IAR XLINK Linker, the IAR XAR Library Builder, and the IAR XLIB
Librarian, refer to the IAR Linker and Library Tools Reference Guide
Using the IAR CLIB and DLIB libraries, refer to the IAR Embedded Workbench
IDE online help system.
All of these guides are delivered in hypertext PDF or HTML format on the installation
media.
Recommended web sites:
●
●
IAR C-SPY® Hardware Debugger Systems
xii
User Guide for 78K
CS78KHW-4:Final
The Renesas web site, www.renesas.com, contains information and news about the
78K microcontrollers.
The IAR Systems web site, www.iar.com, holds application notes and other
product information.
Preface
Document conventions
This book uses the following typographic conventions:
Style
Used for
computer
Text that you type or that appears on the screen.
parameter
A label representing the actual value you should type as part of a
command.
{option}
An mandatory part of a command.
[option]
An optional part of a command.
a|b|c
Alternatives in a command.
bold
Names of menus, menu commands, buttons, and dialog boxes that
appear on the screen.
reference
A cross-reference within this guide or to another guide.
…
An ellipsis indicates that the previous item can be repeated an arbitrary
number of times.
Identifies instructions specific to the IAR Embedded Workbench IDE
interface.
Identifies instructions specific to the command line interface.
Identifies helpful tips and programming hints.
Table 1: Typographic conventions used in this guide
xiii
CS78KHW-4:Final
Document conventions
IAR C-SPY® Hardware Debugger Systems
xiv
User Guide for 78K
CS78KHW-4:Final
Introduction to C-SPY
hardware debugger
systems
This chapter introduces you to the IAR C-SPY hardware debugger systems
and how they differ from the IAR C-SPY Simulator.
The chapters specific to C-SPY debugger systems assume that you already
have some working knowledge of the target system you are using, as well as
of the IAR C-SPY Debugger. For a quick introduction, see the IAR Embedded
Workbench® IDE User Guide.
Note that additional features may have been added to the software after this
guide was printed. The release note 78kemu.htm contains the latest
information.
The IAR C-SPY hardware debugger systems
The IAR C-SPY Debugger consists both of a general part which provides a basic set of
C-SPY features, and of a driver. The C-SPY driver is the part that provides
communication with and control of the target system. The driver also provides a user
interface—special menus, windows, and dialog boxes—to the functions provided by the
target system, for instance, special breakpoints.
At the time of writing this guide, the IAR C-SPY Debugger for the 78K microcontroller
is available with drivers for the following hardware target systems:
●
●
●
●
●
●
●
●
●
●
IE–78K0K1–ET
IE–78K0–NS
IE–78K0–NS–A
IE–78K0S–NS–A
QB-78K0xxx (IECUBE)
QB-78K0Sxxx (IECUBE)
QB-78K0Rxxx (IECUBE)
QB-78K0MINI (MINICUBE)
QB-78K0SxxxMINI (MINICUBE)
QB-MINI2 (MINICUBE 2)
1
CS78KHW-4:Final
The IAR C-SPY Emulator drivers
●
●
TK-78K0xxx
TK-78K0Rxxx.
For further details about the concepts that are related to the IAR C-SPY Debugger, see
the IAR Embedded Workbench® IDE User Guide.
DIFFERENCES IN DEBUG SUPPORT
The following table summarizes the key differences between the debug support for the
different target systems:
IE–78K0–NS–A
Feature
Simulator
IE–78K0K1–ET IE–78K0S–NS–A
IE–78K0–NS
QB-78K0xxx
QB-78K0Rxxx
Data breakpoints
x
Code breakpoints
x
x
QB-78K0MINI
QB-78K0SxxxMINI
QB-MINI2
QB-78K0S
TK-78K0xxx
TK-78K0Rxxx
x
x
x
Event breakpoints
x
x
x
x
Real-time execution
x
x
x
x
x
x
x
x
x
x
Simulated interrupts
x
Real interrupts
Cycle counter
x
Execution time
Code coverage
x
x
Data coverage
x
x
Profiling
x
Trace
Timer
x
x
x
x
x
x
x
x
x
Table 2: Differences in available debug support for different target systems
Contact your software distributor or IAR Systems representative for information about
available C-SPY drivers. Below are general descriptions of the different drivers.
The IAR C-SPY Emulator drivers
There are several C-SPY emulator drivers to choose between for the 78K0, 78K0S, or
78K0R microcontrollers. In the IAR Embedded Workbench IDE, you choose the
emulator variant on the Debugger options page.
IAR C-SPY® Hardware Debugger Systems
2
User Guide for 78K
CS78KHW-4:Final
Introduction to C-SPY hardware debugger systems
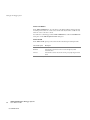
The C-SPY driver is the part that provides communication with and control of the target
system. The driver also provides the user interface—menus, windows, and dialog
boxes—to the functions provided by the target system, for instance, control of the
available hardware breakpoints.
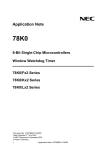
The C-SPY drivers use the Common Exec Interface driver from Renesas to
communicate with the interface card, and the interface card communicates with the
interface on the hardware. The connections and cables that are used on different
evaluation boards might differ.
Note that the Renesas interface card must be installed on your host computer and its
driver must be properly installed. For more information, see the documentation
delivered with the emulator.
Host computer
C-SPY
Debugger
C-SPY driver
Common Exec
Interface
Interface
cable
On-chip
emulation
CPU
Memory
Emulator
Figure 1: Communication overview
Getting started
This section demonstrates how to get started with the IAR C-SPY Emulator. The
application is built and downloaded to the target system, and then executed.
As an example, use the Tutor example project:
1 Choose Help>Information Center.
2 Click the Example projects button.
3
CS78KHW-4:Final
Getting started
3 Click the Tutorials button.
4 Click C and C++ tutorials.
5 Select a destination folder for the workspaceand—in the Workspace window that
appears—click the tutor tab.
RUNNING THE APPLICATION
1 Select the Debug build configuration from the drop-down list at the top of the
Workspace window.
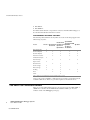
2 Choose Project>Options. In addition to the factory settings, verify the following
settings:
Category
Page
Option/Setting
General Options
Target
Device: Select the device you are using
C/C++ Compiler
Output
Stack/Heap Stack size: 0x100
Generate debug information
Linker
Config
XCL file name: Override default: lnkemu.xcl
Debugger
Setup
Driver: IE-78
Device description: Select a device description file that
corresponds to your target board.
Debugger> Emulator IE-78
Setup
Download – Suppress (deselected)
Download – Verify (selected)
Table 3: Project options for Nexus example
For more information about the C-SPY Emulator options, see Setting up the debugger
system, page 7.
Click OK to close the Options dialog box.
3 Choose Project>Make to compile and link the source code.
4 Start C-SPY by clicking the Debug button or by choosing Project>Debug. The
Hardware Setup dialog box appears. Press OK; C-SPY will download the application
to the target system.
Note: If the power to your target board is not supplied by the MINICUBE2 emulator,
you must start C-SPY with the target board switched off. Switch on the power when
prompted and click OK. This functionality provides support for the Renesas new 78K0
OCD interface.
5 To open the Terminal I/O window, choose View>Terminal I/O.
6 Choose Debug>Go or click the Go button to start the execution.
IAR C-SPY® Hardware Debugger Systems
4
User Guide for 78K
CS78KHW-4:Final
Introduction to C-SPY hardware debugger systems
7 Click the Stop button to stop the execution or wait until program exit is reached.
5
CS78KHW-4:Final
Getting started
IAR C-SPY® Hardware Debugger Systems
6
User Guide for 78K
CS78KHW-4:Final
Emulator-specific
debugging
This chapter describes the options and settings needed for using the C-SPY
hardware debugger systems. The chapter also describes how to use the
debugger. The application can be run in real-time when using these features,
which provides a powerful tool for locating problems in the application or the
hardware.
Setting up the debugger system
Before you start the C-SPY debugger you must set up the generic options for the
debugger system. For information about how to do this, see the IAR Embedded
Workbench® IDE User Guide. When this is done, you must set the emulator-specific
options. To set emulator options, choose Project>Options and click the Setup tab in the
C-SPY Debugger>Emulator category.
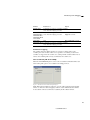
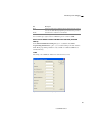
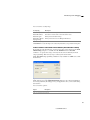
SETUP
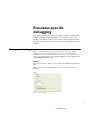
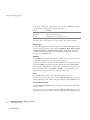
This section describes the emulator options available in the IAR Embedded Workbench
IDE.
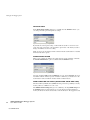
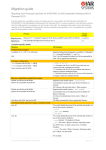
With the options on the emulator Setup page you can modify the behavior of the
download.
Figure 2: Emulator setup options
7
CS78KHW-4:Final
Setting up the debugger system
Suppress
Use this option to debug a non-volatile type of memory. The code image corresponding
to the debugged program must already exist in the target.
If this option is combined with the Verify option, the debugger will read back the code
image from non-volatile memory and verify that it is identical to the debugged program.
Verify
Use this option to verify that the downloaded code image can be read back with the
correct contents.
Use serial port
Use this option to specify the serial port on your host PC to be used for communication
using the FTDI driver.
Note: This option is only available in the TK-78K category.
Use communication log file
Use this option to log the communication between C-SPY and the target system to a file.
To interpret the result, a detailed knowledge of the Common Exec interface is required.
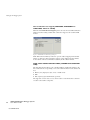
HARDWARE CONFIGURATION
When C-SPY is started for the first time in a new project, the hardware must be set up.
Figure 3: Emulator Hardware Setup message
Click OK to enter the Hardware Setup dialog box. See Hardware Setup – IE-78, page
11, Hardware Setup – IECUBE/MINICUBE/MINICUBE2/TK-78 for 78K0 and 78K0S,
page 14, and Hardware Setup – IECUBE/MINICUBE2/TK-78 for 78K0R, page 19.
When the hardware setup is done and you click OK, the download of the debug file is
started.
If the debug file contains a memory area that is not defined in the hardware setup, several
warnings will be displayed in the Debug Log window.
IAR C-SPY® Hardware Debugger Systems
8
User Guide for 78K
CS78KHW-4:Final
Emulator-specific debugging
The hardware setup is saved for each project and does not have to be set more than once.
If you want to change the setup for a project, choose Hardware Setup from the
Emulator menu.
For further details about the Emulator menu, see Emulator menu, page 9.
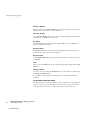
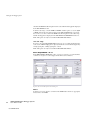
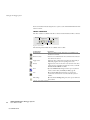
EMULATOR MENU
The Emulator menu appears when running any of the C-SPY emulator drivers.
Figure 4: The Emulator menu
The following commands are available on the menu. Some of the commands are also
available as buttons on the Emulator toolbar.
Menu command
Description
Hardware Setup
Displays the driver-specific Hardware Setup dialog box, in which the
basic configuration for the emulator is done. See Hardware Setup – IE-78,
page 11, Hardware Setup – IECUBE/MINICUBE/MINICUBE2/TK-78 for 78K0
and 78K0S, page 14, and Hardware Setup – IECUBE/MINICUBE2/TK-78 for
78K0R, page 19.
Breakpoint Toggle
During Run
Allows toggling breakpoints on or off during emulator execution.
Toggling a breakpoint on or off will temporarily halt the emulator.
Table 4: Description of Emulator menu commands
9
CS78KHW-4:Final
Setting up the debugger system
Menu command
Description
Mask Option
Displays the Mask Option Settings dialog box, in which the mask
option and pin mode settings can be changed.
Pseudo Emulation
Displays the Pseudo Emulation dialog box, in which the pseudo
emulation behavior can be defined.
DMM Setup
Displays the DMM Function Settings dialog box, see DMM Function
Settings (IECUBE for 78K0R and 78K0), page 24.
Live Watch Setup
Displays the Live Watch Settings dialog box, in which options for the
Live Watch window can be set; see Live Watch Setup, page 26.
Snap Shot Setup
Displays the Snap Shot Function dialog box, see Snap Shot Function
Settings (IECUBE for 78K0R and 78K0), page 28.
Stub Setup
Displays the Stub Function Settings dialog box, see Stub Function
Settings, page 30.
Trace Setup
Displays the driver-specific Trace Setup dialog box, in which the trace
behavior can be defined. For IE-78, see Trace Setup – IE-78, page 32, and
for IECUBE, see Trace Setup – IECUBE, page 34.
Timer Setup
Displays the Timer Settings dialog box, in which the timer behavior
can be defined; see Timer, page 37.
Edit Events
Displays the driver-specific Edit Events dialog box, in which the events
used as breakpoint, trace, timer, trigger output, and sequencer events
can be defined; see Edit Events – IE-78, page 39, and Edit Events –
IECUBE/MINICUBE/MINICUBE2/TK-78, page 41. When this dialog box is
active, you can still access other elements in the IDE.
Edit Sequencer
Displays the driver-specific Edit Sequencer Events dialog box, in
which you can define sequences of events that must occur before a
sequencer event is triggered; see Edit Sequencer – IE-78, page 44, and Edit
Sequencer—IECUBE/MINICUBE/MINICUBE2/TK-78, page 45.
Trace
Opens the Trace View window, which shows the contents of the trace
buffer.
Function Trace
Opens the Function Trace window with the trace data for which
functions were called or returned from; see Function Trace window, page
51.
Live Memory
Opens the Live Memory window, which shows a selected memory area
in real time while your application is being executed.
Data Flash Memory
Displays the Data Flash Memory window, see Data Flash Memory window,
page 64.
Breakpoint Usage
Opens the Breakpoint Usage dialog box, which lists all activated
breakpoints.
Table 4: Description of Emulator menu commands (Continued)
IAR C-SPY® Hardware Debugger Systems
10
User Guide for 78K
CS78KHW-4:Final
Emulator-specific debugging
Menu command
Description
Enable Flash Self
Programming
Enables the flash self-programming feature and makes the Flash
Programming Emulation and PG-FPx Security Flags Setting
Emulation commands available. Only IECUBE for 78K0 and 78K0R
devices with flash memory. If flash programming emulation is enabled,
the internal ROM size defined in the device description file must be used
and cannot be changed.
Flash Programming
Emulation
Opens the Flash Programming Emulation dialog box, in which you
can set up the flash programming emulation. Only IECUBE for 78K0 and
78K0R devices with flash memory. See Flash Programming Emulation dialog
box (IECUBE only), page 53.
Data Flash Emulation
Displays the Data Flash Emulation dialog box, see Data Flash
Emulation dialog box, page 61.
PG-FPx Security Flags Opens the PG-FPx Security Flags Setting Emulation dialog box, in
Setting Emulation
which you can configure the emulation of PG-FPx security. Only IECUBE
for 78K0 and 78K0R devices with flash memory. See Programmer PG-FPx
Security Flags dialog box (IECUBE only), page 62
Flash Shield Setting
Opens the Flash Shield Setting dialog box, in which you can open a
range of flash memory blocks for modification by the flash self
programming. Only IECUBE for 78K0R devices with flash memory. See
Flash Shield Setting dialog box (IECUBE for 78K0R), page 63.
Table 4: Description of Emulator menu commands (Continued)
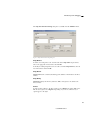
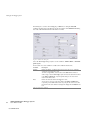
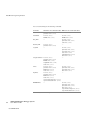
HARDWARE SETUP – IE-78
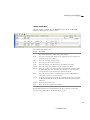
In the Hardware Setup dialog box—available from the Emulator menu—you can
configure the IE-78 series emulator debuggers. There are debugger drivers available for
the 78K0 and 78K0S device families.
For hardware setup of other emulators for the 78K0 and 78K0S device families, see
Hardware Setup – IECUBE/MINICUBE/MINICUBE2/TK-78 for 78K0 and 78K0S,
page 14.
For hardware setup of the emulators for the 78K0R device family, see Hardware Setup
– IECUBE/MINICUBE2/TK-78 for 78K0R, page 19.
11
CS78KHW-4:Final
Setting up the debugger system
Note: There is no driver available that supports an IE-78 series emulator for the 78K0R
device family.
Figure 5: IE-78 series Hardware Setup dialog box
Clock Source
Use the Clock Source options to set the CPU clock source. Select the External option
to use the in-circuit emulator as the CPU clock, and the option Internal when you want
to use the target clock as the CPU clock.
Pin Mask
Use the Pin Mask option to select the non-connected pod pins. If the RESET option is
selected, the pod pin is not connected.
Time Unit
Use the Time Unit drop-down list to select the time unit to be used in the Trace View
window and as TIME registers in the Register window.
Voltage
Use the Voltage options to set the source for power supply of the emulation CPU. Select
the External option to use the target power supply as source, and the option Internal to
use the in-circuit emulator power supply as source.
IAR C-SPY® Hardware Debugger Systems
12
User Guide for 78K
CS78KHW-4:Final
Emulator-specific debugging
Peripheral Break
Use the Peripheral Break options for peripheral emulation. Select Disabled to stop
emulation on break and Enabled when you do not want to stop emulation on break.
Pass Count
Use the Pass Count text box to specify a pass count value that stops the application and
trace when an event has occurred the specified number of times. The valid range of
values is 1–255.
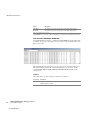
Memory map
With the Memory map options you can specify memory areas.
To define a new memory area, select a memory type from the Type drop-down list, then
enter a start address in the Start address text box and select the memory length from
the Length drop-down list. Click Add to add the memory area to the memory map.
The following memory types are available:
Type
Description
Internal ROM
The internal ROM area, which can be selected in steps of 4 Kbytes
from 4 to 64 Kbytes. By default, the maximum available is defined.
Internal RAM
The internal RAM area, which can be selected in steps of 128 bytes
from 128 to 1024 bytes. By default, the maximum available is defined.
Internal Extended RAM
If the internal RAM area is split in two parts, this type is the second
part of that area. By default, this type is defined if it is available.
External Emulator ROM The emulator alternate ROM area, which can be selected in steps of 4
Kbytes.
External Emulator RAM The emulator alternate RAM area, which can be selected in steps of 4
Kbytes.
External Target area
The target memory area, which can be selected in steps of 4 Kbytes.
Internal Stack Area
The assumed stack area. The internal high-speed RAM area can be
used for the stack. Any stack operations performed outside this area
will result in stack overflow.
Table 5: Available memory types in IE-78 emulator
Unallocated memory areas, except the SFR area, are always set as guarded, which
means that they are read- and write-protected. If an application reads or writes in
guarded memory or writes in ROM, the execution is stopped.
To clear an existing memory area, select it in the Memory map list and click Remove.
Click Remove All to remove all memory areas.
13
CS78KHW-4:Final
Setting up the debugger system
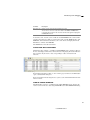
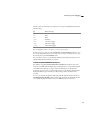
HARDWARE SETUP – IECUBE/MINICUBE/MINICUBE2/TK-78
FOR 78K0 AND 78K0S
This section describes the hardware setup options for the IECUBE, MINICUBE,
MINICUBE2, and TK-78 debugger drivers for the 78K0 and 78K0S device families.
For hardware setup of the IE-78 emulators for the 78K0 and 78K0S device families, see
Hardware Setup – IE-78, page 11.
For hardware setup of the emulators for the 78K0R device family, see Hardware Setup
– IECUBE/MINICUBE2/TK-78 for 78K0R, page 19.
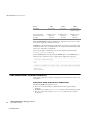
In the Hardware Setup dialog box—available from the Emulator menu—you can
configure your emulator debugger.
Note: There is no driver available that supports a TK-78 series emulator for the 78K0S
device family.
Figure 6: IECUBE/MINICUBE/MINICUBE2/TK-78 for 78K0 and 78K0S Hardware Setup
IAR C-SPY® Hardware Debugger Systems
14
User Guide for 78K
CS78KHW-4:Final
Emulator-specific debugging
ID Code
MINICUBE/MINICUBE2/TK-78 for 78K0: Use this option for devices that are
read-protected with an ID Code. Type a hexadecimal number of 20 digits (10 bytes) as
the ID Code. By default, all digits are F.
To define the ID Code in C, you can use this example:
#pragma constseg=OPTBYTE
__root const unsigned char ucOptionBytes[5]={0x00,0x00,0x00,
0x00,0x02};
#pragma constseg=default
#pragma constseg=SECUID
__root const unsigned char ucSecurityID[10]={0xFF,0xFF,0xFF,
0xFF,0xFF,0xFF,0xFF,0xFF,0xFF,0xFF};
#pragma constseg=default
To define the ID Code in an assembler file (.s26), you can use this example:
ORG 0x0080
; Option bytes. The 0x02 is the value to enable OCD debugging
DB 0x00,0x00,0x00,0x00,0x02
ORG 0x0085
; Security ID
DB 0xFF,0xFF,0xFF,0xFF,0xFF,0xFF,0xFF,0xFF,0xFF,0xFF
END
IECUBE and MINICUBE/MINICUBE2/TK-78 for 78K0S: This option is not used.
Time Unit
IECUBE: Use the Time Unit drop-down list to select the time unit to be used in the
Trace View window and by the TIME registers in the Register window.
MINICUBE/MINICUBE2/TK-78 for 78K0/78K0S: This option is not used.
Main Clock
All: Use the Main Clock option to select the main clock source input to the CPU. If a
main clock board with an oscillator or resonator is connected, the setting is
automatically set to Clock Board and cannot be changed. If no clock board is
connected, the setting is External (the target power supply (TVDD) detection result is
ON) or System (the target power supply (TVDD) detection result is OFF).
MINICUBE for 78K0/78K0S: The main clock is always set to System.
MINICUBE2/TK-78 for 78K0: The main clock is always set to Clock Board.
15
CS78KHW-4:Final
Setting up the debugger system
MINICUBE2 for 78K0S: This option is not used.
Sub Clock
IECUBE for 78K0: Use the Sub Clock option to select the sub clock source input to
the CPU. The setting is External (the target power supply (TVDD) detection result is
ON) or System (the target power supply (TVDD) detection result is OFF).
IECUBE for 78K0S and MINICUBE/MINICUBE2/TK-78 for 78K0/78K0S: This
option is not used.
Monitor Clock
Use the Monitor Clock option to control the operation clock of the monitor program.
System configures the monitor program to be executed using the main clock. User
configures the monitor program to be executed using the clock selected by the user
application.
Peripheral Break
IECUBE/MINICUBE/TK-78 for 78K0/78K0S: Use the Peripheral Break option to
control the behavior of peripheral emulation during a break. Select Disabled to stop
emulation on break and Enabled when you do not want to stop emulation on break.
MINICUBE2 for 78K0/78K0S: This option is not used.
Target
IECUBE: Use the Target option to select whether the target board is to be connected
to the IECUBE in-circuit emulator or not.
MINICUBE/MINICUBE2/TK-78: This option is not used.
Target Power Off
Together with the Pin Mask option Target reset, this option controls the Power Off
emulation of the target board. A reset operation will result in the following:
Target power off Target reset
Result of reset operation
Permit
Selected
No reset operation performed
Permit
Deselected
Executes the application immediately after a reset operation
Not permit
Selected
No reset operation performed
Table 6: IECUBE/MINICUBE/MINICUBE2/TK-78 for 78K0 and 78K0S Target Power Off options
IAR C-SPY® Hardware Debugger Systems
16
User Guide for 78K
CS78KHW-4:Final
Emulator-specific debugging
Target power off Target reset
Result of reset operation
Not permit
IECUBE: Executes the application immediately after a reset
operation
MINICUBE/MINICUBE2/TK-78: Generates a break after a
reset operation
Deselected
Table 6: IECUBE/MINICUBE/MINICUBE2/TK-78 for 78K0 and 78K0S Target Power Off options (Continued)
Pin Mask
Use the Pin Mask option to select the non-connected pod pins.
Fail-safe Break
IECUBE for 78K0: Select the View Setup option to make the Fail-safe Break options
available.
The following fail-safe options are available:
Option
Description
Retry over
The maximum allowable number of retries from a peripheral unit has
been exceeded. 78K0 only.
Fetch from protect
Fetch from fetch-prohibited area.
Read from protect
Read from read-prohibited area.
Write to protect
Write to write-prohibited area.
Non existing SFR
Access to non-existent SFR. 78K0 only.
Read protect SFR
Read of read-prohibited SFR.
Write protect SFR
Write to write-prohibited SFR.
IMS/IXS bank too big
IMS/IXS/BANK setting error. 78K0 only.
Stack overflow
User-specified stack limit exceeded (upper limit).
Stack underflow
User-specified stack limit not reached (lower limit).
Read uninit. RAM
Failure to perform RAM initialization.
Unmapped area
Access to non-mapped area.
Uninit. stack pointer
Failure to perform stack pointer initialization.
Flash self program
Illegal Flash Self Programming. 78K0 only.
Fail-safe peripheral
Fail-safe from peripheral.
Table 7: IECUBE for 78K0 and 78K0S Fail-safe Break options
Note: See the in-circuit emulator and the emulation board documentation for detailed
information about the options.
Deselect the View Setup option to hide the options.
17
CS78KHW-4:Final
Setting up the debugger system
IECUBE for 78K0S and MINICUBE/MINICUBE2/TK-78: This option is not used.
Memory map
In the Memory map section, you can see the predefined memory areas.
IECUBE for 78K0: To define a new memory area, select a memory type from the Type
drop-down list and select the memory length from the Length drop-down list. Click
Add to add the memory area to the memory map.
To clear an existing memory area, select it in the Memory map list and click Remove.
Click Remove All to remove all memory areas.
The following memory types are available:
Type
Description
Internal ROM
The internal ROM area, 4–64 Kbytes. By default, the maximum
available area is defined.
Internal Banked ROM
The internal banked ROM area. It can be 20–224 Kbytes. By default,
the maximum available area is defined.
Internal RAM
The internal RAM area, 128–1024 bytes. By default, the maximum
available area is defined.
External Target area
The target memory area.
Internal Extended RAM
If the internal RAM area is split in two parts, this type is the second
part of that area. It can be 512–14,336 bytes. By default, the maximum
available area is defined.
Internal Stack Area
The assumed stack area. The internal high-speed RAM area can be
used for the stack. Any stack operations performed outside this area
will result in stack overflow.
Table 8: Available memory types in IECUBE/MINICUBE/MINICUBE2/TK-78 for 78K0 and 78K0S
Unallocated memory areas, except the SFR area, are always set as guarded, which
means that they are read- and write-protected. If an application reads or writes in
guarded memory or writes in ROM, the execution is stopped.
IECUBE for 78K0S and MINICUBE/MINICUBE2/TK-78: This section is
non-editable.
IAR C-SPY® Hardware Debugger Systems
18
User Guide for 78K
CS78KHW-4:Final
Emulator-specific debugging
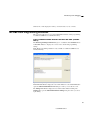
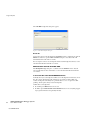
HARDWARE SETUP – IECUBE/MINICUBE2/TK-78 FOR 78K0R
In the Hardware Setup dialog box—available from the Emulator menu—you can
configure your emulator debugger. This section describes the hardware setup options for
the IECUBE, MINICUBE2, and TK-78 debugger drivers for the 78K0R device family.
For hardware setup of emulators for the 78K0 and 78K0S device families, see:
●
Hardware Setup – IE-78, page 11
●
Hardware Setup – IECUBE/MINICUBE/MINICUBE2/TK-78 for 78K0 and 78K0S,
page 14.
Figure 7: IECUBE/MINICUBE2/TK-78 for 78K0R Hardware Setup dialog box
ID Code
MINICUBE2/TK-78 for 78K0R: Use this option for devices that are read-protected
with an ID Code. Type a hexadecimal number of 20 digits (10 bytes) as the ID Code. By
default, all digits are F.
19
CS78KHW-4:Final
Setting up the debugger system
To define the ID Code in C, you can use this example:
#pragma constseg=OPTBYTE
__root const unsigned char ucOptionBytes[4]={0x00,0xFE,
0xFF,0x85};
#pragma constseg=default
#pragma constseg=SECUID
__root const unsigned char ucSecurityID[10]={0xFF,0xFF,0xFF,
0xFF,0xFF,0xFF,0xFF,0xFF,0xFF,0xFF};
#pragma constseg=default
To define the ID Code in an assembler file (.s26), you can use this example:
ORG 0x00C0
; Option bytes
DB 0x00,0xFE,0xFF,0x85
ORG 0x00C4
; Security ID
DB 0xFF,0xFF,0xFF,0xFF,0xFF,0xFF,0xFF,0xFF,0xFF,0xFF
END
IECUBE: This option is not used.
Erase flash before next ID check
MINICUBE2/TK-78 for 78K0R: Use this option to clear the flash memory before
downloading your application.
IECUBE: This option is not used.
Time Unit
Use the Time Unit drop-down list to select the time unit to be used in the Trace View
window and by the TIME registers in the Register window.
Main Clock
Use the Main Clock option to select the main clock source input to the CPU. If a main
clock board with an oscillator or resonator is connected, the setting is automatically set
to Clock Board and cannot be changed. If no clock board is connected, the setting is
System.
MINICUBE2 and TK-78 for 78K0R: The main clock is always set to External.
IAR C-SPY® Hardware Debugger Systems
20
User Guide for 78K
CS78KHW-4:Final
Emulator-specific debugging
Sub Clock
Use the Sub Clock option to select the sub clock source input to the CPU. The setting
is External (the target power supply (TVDD) detection result is ON) or System (the
target power supply (TVDD) detection result is OFF).
MINICUBE2 and TK-78 for 78K0R: The sub clock is always set to External.
Low-voltage
This option enables low-voltage flash programming down to 1.8 V.
IECUBE: This option is not used.
Fail-safe Break
IECUBE: Select the View Setup option to make the Fail-safe Break options available.
The following fail-safe options are available:
Option
Description
Flash illegal
Illegal flash access.
Fetch from protect
Fetch from fetch-prohibited area.
Read from protect
Read from read-prohibited area.
Write to protect
Write to write-prohibited area.
Read protect SFR
Read of read-prohibited SFR.
Write protect SFR
Write to write-prohibited SFR.
Odd word access
Word access on odd address.
Stack overflow
User-specified stack limit exceeded (upper limit).
Stack underflow
User-specified stack limit not reached (lower limit).
Read uninit. RAM
Failure to perform RAM initialization.
Unmapped area
Access to non-mapped area.
Uninit. stack pointer
Failure to perform stack pointer initialization.
Fail-safe peripheral
Fail-safe from peripheral.
Table 9: IECUBE for 78K0R Fail-safe Break options
Note: See the in-circuit emulator and the emulation board documentation for detailed
information about the options.
Deselect the View Setup option to hide the options.
MINICUBE2/TK-78: This option is not used.
21
CS78KHW-4:Final
Setting up the debugger system
Flash programming
MINICUBE2/TK-78 for 78K0R: This option controls flash programming. Select
Permit to allow downloading to flash memory and select Not permit to prohibit
downloading to flash memory.
IECUBE for 78K0R: This option is not used.
Target Power Off
Together with the Pin Mask option Target reset, this option controls the Power Off
emulation of the target board. A reset operation will result in the following:
Target power off Target reset
Result of reset operation
Permit
Selected
No reset operation performed
Permit
Deselected
Executes the application immediately after a reset operation
Not permit
Selected
No reset operation performed
Not permit
Deselected
Generates a break after a reset operation
Table 10: MINICUBE2/TK-78 for 78K0R Target Power Off options
IECUBE for 78K0R: This option is not used.
Target Connect
MINICUBE2/TK-78: This option selects the communication port between the
emulator and the target board. There are two connection interfaces:
TOOL0
TOOL0+TOOL1
1-wire
2-wire
The MINICUBE2 emulator can use both communication interfaces. The TK-78
emulator can only use the TOOL0+TOOL1 interface.
IECUBE: This option is not used.
Pin Mask
Use the Pin Mask option to select the non-connected pod pins.
Peripheral Break
Use the Peripheral Break options to control peripheral emulation.
IECUBE: Select Disabled to stop emulation on break and Enabled when you do not
want to stop emulation on break.
IAR C-SPY® Hardware Debugger Systems
22
User Guide for 78K
CS78KHW-4:Final
Emulator-specific debugging
MINICUBE2/TK-78 for 78K0R: Select Category A to stop timer-related peripheral
emulation during a break. Select Category B to stop peripheral emulation related to
serial communication during a break.
Target
IECUBE: Use the Target option to select whether the target board is to be connected
to the IECUBE in-circuit emulator or not.
MINICUBE2/TK-78: This option is not used.
Memory map
With the Memory map options you can change the predefined memory areas.
To define a new memory area, select a memory type from the Type drop-down list and
select the memory length from the Length drop-down list. Click Add to add the
memory area to the memory map.
The following memory types are available:
Type
Description
Internal ROM
The internal ROM area, 8–960 Kbytes. By default, the maximum
available area is defined.
Internal RAM
The internal RAM area, 512–63,232 bytes. By default, the maximum
available area is defined.
External Target area
The target memory area.
Internal Stack Area
The assumed stack area. The internal high-speed RAM area can be
used for the stack. Any stack operations performed outside this area
will result in stack overflow.
Table 11: Available memory types in IECUBE/MINICUBE2/TK-78 for 78K0R
Unallocated memory areas, except the SFR area, are always set as guarded, which
means that they are read- and write-protected. If an application reads or writes in
guarded memory or writes in ROM, the execution is stopped.
To clear an existing memory area, select it in the Memory map list and click Remove.
Click Remove All to remove all memory areas.
23
CS78KHW-4:Final
Setting up the debugger system
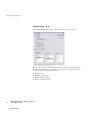
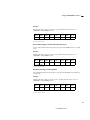
MASK OPTION
In the Mask Option Settings dialog box—available from the Emulator menu—you
can change the mask option and pin mode settings.
Figure 8: Mask Option Settings dialog box
By default, the current option setting—marked with an asterisk—is shown for each
group. Select the group name of the pin and the option name of the mask you want to
change. Click Set to save the new setting.
Note: See the in-circuit emulator and the emulation board documentation for detailed
information about the options.
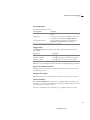
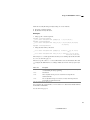
PSEUDO EMULATION
When you are running an emulator driver that supports pseudo emulation commands,
the Pseudo Emulation dialog box is available from the Emulator menu.
.
Figure 9: Pseudo Emulation dialog box
Select the emulation Name and the Command to execute, and click Execute. If you are
not familiar with the emulator’s pseudo emulation commands, you should refer to the
documentation delivered with the emulator and the emulation board.
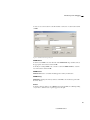
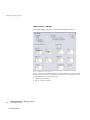
DMM FUNCTION SETTINGS (IECUBE FOR 78K0R AND 78K0)
The Direct Memory Modification (DMM) function provides the possibility to modify
memory addresses or SFRs if an event occurs.
The DMM Function Settings dialog box is available by choosing DMM Setup from
the Emulator menu. Use this dialog box to specify which events that will trigger a
memory modification and the characteristics of the modification. The supported events
IAR C-SPY® Hardware Debugger Systems
24
User Guide for 78K
CS78KHW-4:Final
Emulator-specific debugging
are data accesses and execution events. Events that occur before execution cannot define
a DMM.
Figure 10: DMM Function Settings dialog box
DMM Name
To define a new DMM event, enter the name in the DMM Name drop-down list. Choose
the appropriate characteristics and click OK.
To modify an existing DMM event, select the event in the DMM Name list, enter the
new characteristics and click OK.
DMM Event
DMM Event lists the events that should trigger the memory modification.
DMM Entry
DMM Entry displays the memory addresses and SFRs to be modified, together with
their new values.
Select
To modify a memory address, select Memory. To modify an SFR, select Sfr. Depending
on your choice, different sets of options appear to the right.
25
CS78KHW-4:Final
Setting up the debugger system
Write Address
Use the Write Address option to specify the memory address to modify. Instead of
absolute addresses, also symbol names can be used to define the address area.
Write Data
Use the Write Data text box to specify the new value of the memory address or the SFR.
Data Size
Use the Data Size option to specify the size of the new data. Choose between B for byte
and W for word.
Sfr Name
The Sfr Name drop-down list contains all available SFRs. Choose the SFR that you
want to modify.
Add
When you click the Add button, the new DMM entry will be displayed in the DMM
Entry box.
Change, Delete
If you have selected an item in the DMM Entry box, it can be changed or deleted using
the Change and Delete buttons.
LIVE WATCH SETUP
In the Live Watch Settings dialog box you can define options for the Live Watch
window. The dialog box looks different depending on which emulator your are using.
The following options are available for the different emulators:
Emulator
Realtime area
Options
IE-78K0K1-ET
IE-78K0-NS
IE-78K0-NS-A
A maximum of 2 Kbytes in one area.
Automatic mapping, see below.
None
IE-78K0S-NS-A
Whole memory.
None
IECUBE 78K0
IECUBE 78K0R
Whole memory.
None
Table 12: Emulator live watch options
IAR C-SPY® Hardware Debugger Systems
26
User Guide for 78K
CS78KHW-4:Final
Emulator-specific debugging
Emulator
Realtime area
IECUBE 78K0S
A maximum of 16 bytes in a maximum of 8 None
areas. Automatic mapping, see below.
Options
A maximum of 16 bytes in a maximum of 8 Use read break if not
MINICUBE 78K0
mapped, see below.
MINICUBE 78K0S areas. Automatic mapping, see below.
MINICUBE2 78K0
MINICUBE2 78K0R
TK-78 78K0R
TK-78 78K0
None
Use read break, see below.
MINICUBE2 78K0S A maximum of 16 bytes in a maximum of 8 None
areas. Automatic mapping, see below.
Table 12: Emulator live watch options (Continued)
Automatic mapping
The variables in the Live Watch window are sorted in ascending address order,
excluding non-static variables, which are not possible to read during execution. The
variables are mapped into the real-time area, starting with the variable with the lowest
address and continuing with as many as will fit into the real-time area.
Use read break (TK-78 for 78K0)
When the Use read break option is selected, the read with break method will be used
when reading. This option is not available for all debugger drivers.
Figure 11: IE-78K0, TK-78 Live Watch Settings dialog box
Note: When the Live Memory window is open, the address mapping defined in that
window overrides the address mapping for the live watch. This means that variables
located outside of that area will not be readable by the Live Watch window.
27
CS78KHW-4:Final
Setting up the debugger system
Use read break if not mapped (MINICUBE, MINICUBE2 for
78K0/78K0R, TK-78 for 78K0R)
When the Use read break if not mapped option is selected, the read with break method
will be used when reading variables that could not be mapped to the real-time RAM
monitor.
Figure 12: MINICUBE Live Watch Settings dialog box
Note: When the Live Memory window is open, the address mapping defined in that
window overrides the address mapping for the live watch. This means that variables
located outside of that area will not be readable by the Live Watch window.
SNAP SHOT FUNCTION SETTINGS (IECUBE FOR 78K0R AND
78K0)
The Snap Shot function allows event-controlled addition of further information to the
Trace window. If the corresponding event occurred, this information can be added to the
trace:
●
Memory area (displayed as byte, word, or double word)
●
SFR
●
CPU register (register bank must be specified).
The supported events are data accesses and execution events. Events that occur before
execution cannot define a Snap Shot.
IAR C-SPY® Hardware Debugger Systems
28
User Guide for 78K
CS78KHW-4:Final
Emulator-specific debugging
The Snap Shot Function Settings dialog box is available from the Emulator menu.
Figure 13: Snap Shot Function Settings dialog box
Snap Name
To define a new Snap Shot event, enter the name in the Snap Name drop-down list.
Choose the appropriate characteristics and click OK.
To modify an existing Snap Shot event, select the event in the Snap Name list, enter the
new characteristics and click OK.
Snap Event
Snap Event lists the events that should trigger the addition of information to the Trace
window.
Snap Entry
Snap Entry displays the memory addresses, SFRs, and registers to be added to the
Trace window.
Select
To add a memory address to the Trace window, select Memory. To add an SFR, select
Sfr. To add a register, select Register. Depending on your choice, different sets of
options appear to the right.
29
CS78KHW-4:Final
Setting up the debugger system
Memory Address
Enter the address in the Memory Address text box. Instead of absolute addresses, also
symbol names can be used to define the address area.
Memory Display
Use the Memory Display option to choose between different displays of memory: B for
byte, W for word, and DW for double word.
Sfr Name
The Sfr Name drop-down list contains all available SFRs. Choose the SFR that you
want to add to the Trace window.
Register Name
The Register Name drop-down list contains all available CPU registers. Choose the
register that you want to add to the Trace window.
Register Bank
Use the Register Bank option to specify the register bank. Choose between 0, 1, 2, 3,
or Current.
Add
When you click the Add button, the new Snap Shot entry will be displayed in the Snap
Entry box.
Change, Delete
If you have selected an item in the Snap Entry box, it can be changed or deleted using
the Change and Delete buttons.
It is possible to combine different information types in one combined Snap Shot
definition.
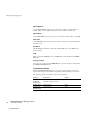
STUB FUNCTION SETTINGS
The Stub function provides the possibility to execute a stub function of the application
on the occurrence of an event. The supported events are data accesses and execution
events. Events that occur before execution cannot define a stub function call.
IAR C-SPY® Hardware Debugger Systems
30
User Guide for 78K
CS78KHW-4:Final
Emulator-specific debugging
The Stub Function Settings dialog box is available from the Emulator menu.
Figure 14: Stub Function Settings dialog box
Stub Name
To define a new stub event, enter the name in the Stub Name drop-down list. Choose
the appropriate characteristics and click OK.
To modify an existing stub event, select the event in the Stub Name list, enter the new
characteristics and click OK.
Stub Event
Stub Event lists the events that should trigger the execution of the stub function.
Go To
Use the Go To option to specify the function that is executed when the event occurs.
Instead of a function name, also an absolute address can be specified.
31
CS78KHW-4:Final
Setting up the debugger system
TRACE SETUP – IE-78
In the Trace Settings dialog box you can define the IE-78 series trace behavior.
Figure 15: IE-78 series Trace Settings dialog box
The trace function has a circular frame buffer where the emulator can save frames. When
the Go or a step command is executed, the trace function can save information for each
executed instruction. The information saved is:
●
Execution time
●
Emulator probe signature
●
OP-fetch address and data
●
Data-access address and data.
IAR C-SPY® Hardware Debugger Systems
32
User Guide for 78K
CS78KHW-4:Final
Emulator-specific debugging
Trace Operation
Sets the trace operation to one of:
Trace Operation
Description
Full trace
The trace starts at any Go or step command, and stops at
break.
Qualify trace
The trace is active as long as the qualify trace event is true.
The qualify event is defined in the Qualify Trace list.
Section (start/stop) trace
The trace starts and stops by the events defined in the
Start Trace and Stop Trace lists, respectively.
Table 13: Description of trace operations in IE-78 series emulator
Trigger Point
The Trigger Point options control how the buffer should be handled when it has
become full.
Trigger point
Description
First frame in buffer
The trigger point is at the beginning of the trace buffer.
Middle frame in buffer
The trigger point is in the middle of the trace buffer.
Last frame in buffer
The trigger point is at the end of the trace buffer.
Table 14: Description of trace trigger points in IE-78 series emulator
Note: Pre-execution breaks and software breaks are not included as break conditions.
Clear trace buffer before Go
When this option is selected, the trace buffer will be cleared before each Go or step
command is performed.
Relative time stamp
When this option is selected, the time is shown relative to the previous trace frame.
Trace Conditions
In the Trace Conditions lists, select the trace events that should control the trace. If
more than one event is selected in the same list, the trace condition will be true when
one of the selected events has occurred.
Select the events that are to be used to start, stop, or qualify for the trace session.
33
CS78KHW-4:Final
Setting up the debugger system
TRACE SETUP – IECUBE
In the Trace Settings dialog box you can define the IECUBE trace behavior.
Figure 16: IECUBE Trace Settings dialog box
The trace function has a circular frame buffer where the emulator can save frames. When
the Go or a step command is executed, the trace function can save information for each
executed instruction. The information saved is:
●
OP-fetch address and data
●
Data-access address and data.
IAR C-SPY® Hardware Debugger Systems
34
User Guide for 78K
CS78KHW-4:Final
Emulator-specific debugging
Trace Operation
To enable the trace operation, select the Enable option and one or more of the operation
suboptions:
Trace Operation
Description
No suboption selected
A full trace is performed. The trace starts at any Go or
step command, and stops at break.
Section trace
The trace starts and stops by the events defined in the
Start Trace and Stop Trace lists, respectively.
Qualify trace
The trace is active as long as the qualify trace event is true.
The qualify event is defined in the Qualify Trace list.
Delay trigger trace
The trace stops by the events defined in the Delay
Trigger Trace list, and after the Delay Count number
of frames.
Table 15: Description of trace operations in IECUBE emulator
To disable the trace operation, select the Disable option.
Stop Condition
The Stop Condition options control how the trace buffer should be handled when it has
become full or when the delay frame count is reached.
Stop condition
Description
No stop
The oldest frames are overwritten until a break occurs.
Stop tracing on trace buffer full
The trace stops when trace buffer is full.
Break execution on trace buffer full
The trace stops and execution breaks when trace buffer
is full.
Stop tracing on delay trigger
The trace stops when delay trigger events fulfilled and
after delay count frames is traced.
Break execution on delay trigger
The trace stops and execution breaks when delay trigger
events fulfilled and after delay count frames is traced.
Table 16: Description of stop conditions in IECUBE emulator
Clear trace buffer before Go
When this option is selected, the trace buffer will be cleared before each Go or step
command is performed.
Trace buffer size
Use this option to set the size of the trace buffer.
35
CS78KHW-4:Final
Setting up the debugger system
Section Trace
In the Section Trace 1, 2, 3, and 4 lists, select the section trace events that should control
the trace. If more than one event is selected in the same list, the trace condition will be
true when one of the selected events has occurred.
Qualify Trace
In the Qualify Trace list, select the trace events that should control the qualify trace. If
more than one event is selected in the same list, the trace condition will be true when
one of the selected events has occurred.
Delay Trigger Trace
Select the trace events that should control the delay trigger trace in the Delay Trigger
Trace list, and specify the Delay count, the desired number frames you want the tracing
to continue after the event condition has been met. If more than one event is selected in
the same list, the trace condition will be true when one of the selected events has
occurred.
IAR C-SPY® Hardware Debugger Systems
36
User Guide for 78K
CS78KHW-4:Final
Emulator-specific debugging
TIMER
In the Timer Settings dialog box you can define the timer behavior. The timer measures
the time between events that you select with the Timer conditions options. The result
is displayed in the C-SPY Debug Log window.
Figure 17: Timer Settings dialog box
Enable conditional measurement
Select this option to enable the timer.
Count rate
Use the Count rate option to set the timer rate value for execution time measurement.
For IE-78, the count rate can be set to between 160 and 20560 ns with an interval of
80 ns. For IECUBE, the count rate can be set to between 1 and 2048 times the current
clock frequency.
Clear timer before Go
When the Clear timer before Go option is selected, the timer will be cleared before any
Go or step command is performed.
37
CS78KHW-4:Final
Setting up the debugger system
Timer conditions
In the Timer conditions lists, select the timer events that should start and stop the time
measuring. If more than one event is selected in the same list, the timer condition is true
when one of the events has occurred.
You define the events that appear in the Timer conditions lists, either in the Edit Events
dialog box or in the Edit Sequencer Events dialog box.
Timer break
In the Timer break option specifies when the timer should stop measuring the time.
Timer break option
Description
Disable
No timer breaks will occur
Overflow
A break will occur when the timer exceeds the highest possible
measurable value
Timeout
A break will occur after the amount of time you specify using the boxes
below
Table 17: Timer break options
IAR C-SPY® Hardware Debugger Systems
38
User Guide for 78K
CS78KHW-4:Final
Emulator-specific debugging
EDIT EVENTS – IE-78
In the Edit Events dialog box, you define the events used as breakpoint, trace, timer and
sequencer events for the IE-78 series emulators.
Figure 18: IE-78 series Edit Events dialog box
In real-time, the emulator compares the address, data, access type, and probe signals
with the events that you have defined. When all defined conditions are true, the event is
raised.
Each event is uniquely named and listed with its settings at the bottom of the Edit
Events dialog box. In the list, the Usage column shows how the event is used, that is, as
breakpoint, trace, timer, or sequencer event.
Name
To define a new event, enter the event name in the Name listbox and choose appropriate
characteristics. Click Add.
39
CS78KHW-4:Final
Setting up the debugger system
To modify an existing event, select the name of the event in the Name listbox, enter the
new characteristics and click one of the following buttons:
Button
Description
Remove
Clear the selected event.
Remove All
Clear all the events in the list.
Modify
Modify the event to the settings you select.
Table 18: Modifying IE-78 series events
For each event you can specify the access type, address, data, and external probe.
Access type
Use the Access type options to define the type of access that should trigger the event.
Select the access type from one of the following: Read/Write, Read, Write, OP fetch,
1-bit External Trigger, or 8/16-bit External Trigger. An OP Fetch event will by
default break after execution, but you can modify it to break before execution by
selecting the option Before exec.
Address
Use the Address options to define an address, or address range. Any access to the area,
or optionally outside the area, causes the event to be triggered.
To define a single address, enter the value in the Start field. To define an address range,
select the Use Range option and enter the start and end values in the Start and End
fields, respectively. Note that it is possible to enter a label instead of an address value.
For address ranges, use the options Inside or Outside to specify whether the event
should be triggered by accesses inside or outside the address range.
Data
Use the Data options to define a data value that should trigger the event.
You can choose to enter a value and a mask in the Value and Mask fields, respectively.
The bit pattern for the value with the mask applied is displayed in the Pattern text box.
8/16-bit external data
Use the 8/16-bit external data options to define an external probe value that should
trigger the event.
You can choose to enter a value and a mask in the Value and Mask fields, respectively.
The bit pattern for the value with the mask applied is displayed in the Pattern text box.
IAR C-SPY® Hardware Debugger Systems
40
User Guide for 78K
CS78KHW-4:Final
Emulator-specific debugging
EDIT EVENTS – IECUBE/MINICUBE/MINICUBE2/TK-78
In the Edit Events dialog box, you define the events used by the IECUBE, MINICUBE,
MINICUBE2 for 78K0, and TK-78 emulators as breakpoint, trace, timer and sequencer
events. MINICUBE2 cannot use events with code written for 78K0S devices.
Figure 19: IECUBE//MINICUBE/MINICUBE2/TK-78 Edit Events dialog box
In real-time, the emulator compares the address, data, access type, and probe signals
with the events that you have defined. When all defined conditions are true, the event is
raised.
Each event is uniquely named and listed with its settings at the bottom of the Edit
Events dialog box. In the list, the Usage column shows how the event is used, that is, as
breakpoint, trace, timer, or sequencer event.
41
CS78KHW-4:Final
Setting up the debugger system
Name
To define a new event, enter the event name in the Name listbox and choose the
appropriate characteristics. Click Add.
To modify an existing event, select the name of the event in the Name listbox, enter the
new characteristics and click one of the following buttons:
Button
Description
Remove
Clear the selected event.
Remove All
Clear all the events in the list.
Modify
Modify the event to the settings you select.
Table 19: Modifying IECUBE events
For each event you can specify the access type, address, data, and external probe.
Pass count
Use the Pass count text box to set the number of times the event must be repeated before
the event is triggered. The valid range of values is 1–255.
Access type
Use the Access type options to define the type of access that should trigger the event.
Access type
Event triggered by
Read/write
A read/write access.
Read
A read access.
Write
A write access.
OP fetch
An operation fetch access. An OP fetch event will by default
break after execution, but you can modify it to break before
execution by selecting the option Before exec (IECUBE 78K0
only).
1-bit external trigger
A 1-bit signal from the external emulation probe. Use the
option 1-bit ext. edge to specify the exact type of trigger.
IECUBE 78K0 only.
16-bit external trigger
16-bit data from the external sense clip attached to the
external emulation probe. Use the 16-bit external data
options to specify the exact type of trigger. IECUBE 78K0 only.
Table 20: IECUBE events access type
IAR C-SPY® Hardware Debugger Systems
42
User Guide for 78K
CS78KHW-4:Final
Emulator-specific debugging
Address
Use the Address options to define an address, or address range. Any access to the
specified address or address range with the specified condition, causes the event to be
triggered.
To define a single address, select a single condition option (==, >=, or <=) and enter the
value in the Start field. To define an address range, select the Inside or Outside
condition option and enter the start and end values in the Start and End fields,
respectively.
Only the equal (==) condition is available for the MINICUBE, MINICUBE2, and
TK-78 emulators and only a single address can be entered.
Note: It is possible to enter a label instead of an address value.
Data
Use the Data options to define a condition, access size, and a data value or data range.
An access with data or data range with the specified condition, access size and mask,
causes the event to be triggered.
To define a single data value, select a single condition option (==, !=, >=, or <=), access
size (Byte or Word) and enter the data value in the Start field. You can choose to enter
a mask in the Mask field. The bit pattern for the value with the mask applied is displayed
in the Start Pattern text box.
To define a data range, select the Inside or Outside condition option, access size (Byte
or Word) and enter the start and end values in the Start and End fields, respectively.
You can choose to enter a mask in the Mask field. The bit pattern for the value range
with the mask applied is displayed in the Start Pattern and End Pattern text boxes.
The following restrictions apply to the MINICUBE, MINICUBE2, and TK-78
emulators:
●
Only the equal (==) condition is available
●
Only byte accesses are available
●
Only a single address can be entered.
16-bit External Data
Use the 16-bit External Data options to define a condition, access size, and an external
data value or external data range. Any access with 16-bit external data or data range with
the specified condition, access size and mask, causes the event to be triggered.
To define a single data value, select a single condition option (==, !=, >=, or <=), access
size (Byte or Word) and enter the data value in the Start field. You can choose to enter
43
CS78KHW-4:Final
Setting up the debugger system
a mask in the Mask field. The bit pattern for the value with the mask applied is displayed
in the Start Pattern text box.
To define a data range, select the Inside or Outside condition option, access size (Byte
or Word) and enter the start and end values in the Start and End fields, respectively.
You can choose to enter a mask in the Mask field. The bit pattern for the value range
with the mask applied is displayed in the Start Pattern and End Pattern text boxes.
Note: This option can only be used with the IECUBE 78K0 emulator.
1-bit ext. edge
If you have selected 1-bit external trigger as the type of access that should trigger the
event, use the 1-bit ext. edge option to specify whether the event should be triggered by
a rising signal pulse, a falling signal pulse, or both.
Note: This option can only be used with the IECUBE 78K0 emulator.
EDIT SEQUENCER – IE-78
In the Edit Sequencer Events dialog box, you can set a sequence of events that must
occur before a sequencer event is triggered in the IE-78 series emulators.
Figure 20: IE-78 series Edit Sequencer Events dialog box
Name
To define a new event, enter the event name in the Name listbox and choose appropriate
characteristics. Click Add.
IAR C-SPY® Hardware Debugger Systems
44
User Guide for 78K
CS78KHW-4:Final
Emulator-specific debugging
To modify an existing event, select the name of the event in the Name listbox, enter the
new characteristics and click one of the following buttons:
Button
Description
Modify
Modify the event to the settings you select.
Remove
Clear the selected event.
Remove All
Clear all the events in the list.
Table 21: Modifying IE-78 series events
Enable
A sequencer event can consist of up to four events that must be triggered in a sequence.
You can only select one event in each Enable list, and the same event can only be used
once in the sequence of events.
Each event is uniquely named and listed with its settings at the bottom of the Edit
Sequencer Events dialog box. In the list, the Usage column shows how the event is
used, that is, as breakpoint, trace, timer, or sequencer event.
EDIT SEQUENCER—IECUBE/MINICUBE/MINICUBE2/TK-78
In the Edit Sequencer Events dialog box, you can set a sequence of events that must
occur before a sequencer event is triggered in the IECUBE emulator.
Figure 21: IECUBE Edit Sequencer Events dialog box
45
CS78KHW-4:Final
Setting up the debugger system
Name
To define a new event, enter the event name in the Name listbox and choose the
appropriate characteristics. Click Add.
To modify an existing event, select the name of the event in the Name listbox, enter the
new characteristics and click one of the following buttons:
Button
Description
Modify
Modify the event to the settings you select.
Remove
Clear the selected event.
Remove All
Clear all the events in the list.
Table 22: Modifying IECUBE/MINICUBE/MINICUBE2/TK-78 events
Pass count
Use the Pass count text box to set the number of times the event must be repeated before
the event is triggered. The valid range of values is 1–255.
Enable
A sequencer event can consist of up to four events that must be triggered in a sequence.
You can only select one event in each Enable list. You do not have to use all Enable
lists.
If the Disable event occurs, the sequence starts over with the first Enable event again.
78K0 only: For each Enable and Disable list you can specify whether the events
defined in that list should be OR’ed or AND’ed to fulfill the condition.
Each event is uniquely named and listed with its settings at the bottom of the Edit
Sequencer Events dialog box. In the list, the Usage column shows how the event is
used, that is, as breakpoint, trace, timer, or sequencer event.
IAR C-SPY® Hardware Debugger Systems
46
User Guide for 78K
CS78KHW-4:Final
Emulator-specific debugging
TRACE WINDOW
The Trace window—available from the Emulator menu for IE-78 and IECUBE
emulators—displays the trace buffer content.
Figure 22: Trace window
The columns in the window are:
Column
Description
Frame
The number of the trace buffer frame. By double-clicking the frame number, the
traced fetch address will be displayed in the editor window.
Event
The name of the single events that have been triggered by the event conditions. For
information about event conditions.
Time
This is the time stamp of the trace frame.
Probe
This is the probe value of the trace frame.
Fetch
This is the fetch type of the instruction associated with the trace frame.
Address
This is the address of the instruction associated with the trace frame.
Opcode
This is the operation code of the instruction associated with the trace frame. After
the hexadecimal value, extra information can be displayed: x2 if two instructions
were executed and C if the instruction was read from the I-Cache.
Trace
This is the recorded sequence of executed machine instructions. Optionally, the
corresponding source code can also be shown.
Access
This is the access type of the instruction associated with the trace frame. DMA stands
for DMA transfer. The address and data information shows which transfer that was
performed.
Address
This is the address of the access.
Data
This is the data the access has read or written.
Table 23: Trace window columns
For information about how to add information to the Trace window, see Snap Shot
Function Settings (IECUBE for 78K0R and 78K0), page 28.
47
CS78KHW-4:Final
Setting up the debugger system
For more information about using the trace system, see the IAR Embedded Workbench®
IDE User Guide.
TRACE TOOLBAR
The Trace toolbar is available in the Trace window and in the Function Trace window:
Enable/Disable
Find
Toggle source
Clear trace data
Browse
Edit settings
Save
Figure 23: Trace toolbar
The following function buttons are available on the toolbar:
Toolbar button
Description
Enable/Disable
Enables and disables tracing. This button is not available in the
Function trace window.
Clear trace data
Clears the trace buffer. Both the Trace window and the Function
trace window are cleared.
Toggle Source
Toggles the Trace column between showing only disassembly or
disassembly together with corresponding source code.
Browse
Toggles browse mode on and off for a selected item in the Trace
column. For more information about browse mode, see the IAR
Embedded Workbench® IDE User Guide.
Find
Opens the Find in Trace dialog box where you can perform a
search; see Find in Trace (not IECUBE for 78K0S), page 49.
Save
Opens a Trace Save dialog box where you can save the
recorded trace information to a text file, with tab-separated
columns.
Edit settings
Opens the Trace Settings dialog box, where you can define the
trace behavior.
Table 24: Trace toolbar commands
IAR C-SPY® Hardware Debugger Systems
48
User Guide for 78K
CS78KHW-4:Final
Emulator-specific debugging
TRACE SAVE
The Trace Save dialog box—available from the Trace window toolbar—saves the trace
buffer content to a file.
Figure 24: Trace Save dialog box
Set the Frame range you want to save. If you select the Append to file option, the new
data will be added at the end of an already existing file. If you deselect the option, a new
file will be created and the old one, if there is one, will be overwritten.
FIND IN TRACE (NOT IECUBE FOR 78K0S)
Using the Find in Trace dialog box—available in the Trace window as a button or by
choosing Edit>Find and Replace>Find—you can search the trace window.
49
CS78KHW-4:Final
Setting up the debugger system
Performing trace searches when debugging a 78K0S device using the IECUBE
emulator, the dialog box looks different. See the description of the Find in Trace dialog
box in the IAR Embedded Workbench® IDE User Guide.
Figure 25: Find in Trace dialog box
Select the Access type and specify the search conditions: Address, Data, or External
probe signals.
If more than one search condition is enabled, all conditions must be true.
Condition
Description
Address
Defines an address, or address range. Any access to the area, or optionally
outside the area, triggers the event.
To define a single address, enter the value in the Start field. To define an
address range, select the Use range option and enter the start and end values
in the Start and End fields, respectively. Note that you can enter a label
instead of an address value.
Data
Defines the data value that should trigger the event.
You can choose to enter a value and a mask in the Value and Mask fields,
respectively. Use the Size radio buttons to specify the size of the access. The
bit pattern for the value with the mask applied is displayed in the Pattern text
box.
Table 25: Find in Trace conditions
IAR C-SPY® Hardware Debugger Systems
50
User Guide for 78K
CS78KHW-4:Final
Emulator-specific debugging
Condition
Description
External probe
Defines a probe value that should trigger the event.
You can choose to enter a value and a mask in the Value and Mask fields,
respectively. The bit pattern for the value with the mask applied is displayed in
the Pattern text box.
Table 25: Find in Trace conditions (Continued)
To start the search, enter the search conditions and click Find First. To search from the
current position in the trace buffer or search from a frame set in the Frame list box, click
Find Next. To find all frames that match your search criteria and display them in the
Find In Trace window, click Find All.
The Frame list box lists all found frames.
FUNCTION TRACE WINDOW
The Function Trace window—available from the Emulator menu—displays a subset of
the trace data displayed in the Trace window. Instead of displaying all rows, the Function
Trace window only shows trace data corresponding to calls to and returns from
functions.
Figure 26: Function Trace window
For information about the toolbar, see Trace toolbar, page 48. However, the Save button
opens a standard Save dialog box.
For more information about using the trace system, see the IAR Embedded Workbench®
IDE User Guide.
FIND IN TRACE WINDOW
The Find In Trace window—available from the View>Messages menu—displays the
result of searches in the trace data using the Find All feature in the Find in Trace dialog
51
CS78KHW-4:Final
Setting up the debugger system
box. For information about how to open this dialog box, see Find in Trace (not IECUBE
for 78K0S), page 49.
Figure 27: Find In Trace window
The Find In Trace window looks like the Trace window, showing the same columns and
data, but only those rows that match the specified search criteria. Double-clicking an
item in the Find In Trace window brings up the same item in the Trace window.
For more information about using the trace system, see the IAR Embedded Workbench®
IDE User Guide.
LIVE MEMORY WINDOW
The Live Memory window shows the selected memory area in realtime when the
application is being executed. All changes during the execution are displayed in red.
Figure 28: Live Memory window
Choose what memory area to display by entering information in the three text boxes to
the right of the memory zone list box:
●
Address. The start address of the memory area. It must be a legal memory address.
●
Length. The length of the memory area, in the range 0x001–0x400. The length can
be adjusted according to emulator restrictions.
●
Refresh interval. The number of milliseconds between each update. The refresh
interval is 100 to 10000 milliseconds in steps of 10.
IAR C-SPY® Hardware Debugger Systems
52
User Guide for 78K
CS78KHW-4:Final
Emulator-specific debugging
Click x1, x2, or x4 to display the memory contents in units of 8, 16, or 32 bits.
IECUBE Flash Programming Emulation
This section describes how to set up and test IECUBE emulation of flash programming
for 78K0 and 78K0R devices with flash memory.
FLASH PROGRAMMING EMULATION DIALOG BOX (IECUBE
ONLY)
The Flash Programming Emulation dialog box—available from the Emulator menu
for IECUBE emulators—displays an overview of the current flash programming
settings.
Note: Flash programming emulation is only available for 78K0 and 78K0R devices
with flash memory.
Figure 29: Flash Programming Emulation dialog box
The Event Overview box displays the active flash emulation events. The Events button
opens the Edit Flash Emulation Events dialog box where you can edit the events.
The Timing Overview box displays the user-defined flash emulation timing. The
Timing button opens the Edit Flash Emulation Timing dialog box where you can set
up the timing.
53
CS78KHW-4:Final
IECUBE Flash Programming Emulation
For more information about flash programming, see the Flash Memory Programming
documentation for your device, available from the Renesas website
www.renesas.eu/docuweb.
EDIT FLASH EMULATION EVENTS DIALOG BOX (IECUBE
ONLY)
In the Edit Flash Emulation Events dialog box—available from the Flash
Programming Emulation dialog box—you can set up events to test the flash self
programming error handling.
Note: Flash programming emulation is only available for 78K0 and 78K0R devices
with flash memory.
Figure 30: Edit Flash Emulation Events dialog box
Define the events using the following boxes:
Box
Description
Bank
The bank where the emulation will generate the defined error. The
maximum value is determined by the symbol _CODEBANK_BANKS. This
field is not available for 78K0R, because it has no banked code model.
Address
The address where the emulation will generate the defined error (in
hexadecimal notation). The maximum value is determined by the ROM
size of the device. The error will not be generated at any other address.
Command
The flash control firmware function to be executed. See the Flash
Memory Programming documentation for your device.
Table 26: Flash emulation events settings
IAR C-SPY® Hardware Debugger Systems
54
User Guide for 78K
CS78KHW-4:Final
Emulator-specific debugging
Box
Description
Error
Sets the operation of the self library function that generates the returned
error. See the Flash Memory Programming documentation for your device.
Enable
Select this box to enable the event definition.
Table 26: Flash emulation events settings
You can define up to eight events for 78K0 and up to two events for 78K0R.
EDIT FLASH EMULATION TIMING DIALOG BOX (IECUBE
ONLY)
In the Edit Flash Emulation Timing dialog box—available from the Flash
Programming Emulation dialog box—you can edit the timing of the flash emulation.
Note: Flash programming emulation is only available for 78K0 and 78K0R devices
with flash memory.
78K0
The timing of the 78K0 flash emulation is defined in microseconds.
Figure 31: 78K0 Edit Flash Emulation Timing dialog box
55
CS78KHW-4:Final
IECUBE Flash Programming Emulation
You can set the timing for the following commands:
Command
CZ6 Series errors and return values MF2 Series errors and return values
Init
no error (0x00)
parameter error (0x05)
no error (0x00)
ModeCheck
no error (0x00)
FLMD0 error (0x01)
no error (0x00)
FLMD0 error (0x01)
Get_XXX
—
no error (0x00)
parameter error (0x05)
read error (0x20)
GetInfo_XXX
no error (0x00)
parameter error (0x05)
—
Set_XXX
—
no error (0x00)
parameter error (0x05)
protection error (0x10)
erase error (0x1A)
verify/blank error (0x1B)
write error (0x1C)
Swap_BootCluster no error (0x00)
parameter error (0x05)
FLMD0 error (0x18)
verify/blank error (0x1B)
write error (0x1C)
—
Write
no error (0x00)
parameter error (0x05)
FLMD error (0x18)
write error (0x1C)
no error (0x00)
parameter error (0x05)
protection error (0x10)
write error (0x1C)
EepWrite
no error (0x00)
—
parameter error (0x05)
FLMD error (0x18)
write error (0x1C)
eeprom-write-verify error (0x1D)
eeprom-write-blank error (0x1E)
EEPROMWrite
—
Table 27: 78K0 flash emulation timing error return values
IAR C-SPY® Hardware Debugger Systems
56
User Guide for 78K
CS78KHW-4:Final
no error (0x00)
parameter error (0x05)
protection error (0x10)
write error (0x1C)
eeprom-write-verify error (0x1D)
eeprom-write-blank error (0x1E)
Emulator-specific debugging
Command
CZ6 Series errors and return values MF2 Series errors and return values
Verify
no error (0x00)
parameter error (0x05)
verify/blank error (0x1B)
—
Verify
—
no error (0x00)
parameter error (0x05)
verify/blank error (0x1B)
BlankCheck
no error (0x00)
parameter error (0x05)
verify/blank error (0x1B)
no error (0x00)
parameter error (0x05)
verify/blank error (0x1B)
Erase
no error (0x00)
parameter error (0x05)
erase error (0x1A)
no error (0x00)
parameter error (0x05)
protection error (0x10)
erase error (0x1A)
EepErase
no error (0x00)
parameter error (0x05)
erase error (0x1A)
—
Table 27: 78K0 flash emulation timing error return values (Continued)
Click Default to set the timing values to the factory defaults.
78K0R
The timing of the 78K0R flash emulation is defined by the Retry values. The default
retry value is 0 (=no retry), which results in the fastest timing. The higher the retry value,
the more delayed the timing will be.
Figure 32: 78K0R Edit Flash Emulation Timing dialog box
57
CS78KHW-4:Final
Using breakpoints
You can set the retry values for the following commands:
Command
Description
Write
The active retry value for the write command.
Erase
The active retry value for the erase command.
Set_XXX
The active retry value for the set_info command.
EEPROMWrite The active retry value for the eeprom_write command.
Table 28: 78K0R flash emulation timing retry values
Click Default to set the retry values to the factory defaults.
Using breakpoints
This section describes issues related to using breakpoints in the C-SPY hardware
debugger systems.
EVENT BREAKPOINTS
When you are running the emulator driver, the Event breakpoint dialog box becomes
available from the context menu in the Breakpoints window. Use this dialog box to
specify an event as a breakpoint condition.
.
Figure 33: Event Breakpoints dialog box
The Break At list contains all events defined in the Edit Events or Edit Sequencer
dialog boxes. To use an event as a condition for the breakpoint, select an event from the
IAR C-SPY® Hardware Debugger Systems
58
User Guide for 78K
CS78KHW-4:Final
Emulator-specific debugging
list. The events are divided into seven different access types, distinguished in the list by
a bracketed tag:
Tag
Event access type
[F]
Fetch
[R]
Read
[W]
Write
[R/W]
Read/write
[XT1]
1-bit external trigger
[XT8]
8-bit external trigger
[XT16]
16-bit external trigger
Table 29: Event access types
For an explanation of the access types, see Access type, page 42.
To inspect an event, click one of the View Events or View Sequencer buttons to open
the corresponding dialog boxes in view-only mode. To define or modify an event, open
these dialog boxes from the Emulator menu.
For a description of how to use breakpoints and about the Breakpoints window, see the
IAR Embedded Workbench® IDE User Guide.
CODE HARDWARE BREAKPOINTS
For emulators supporting Fetch break before execution, the breakpoint type Code
hardware is available. This breakpoint type is implemented as an event fetch breakpoint.
Code hardware breakpoints are triggered when an instruction is fetched from the
specified location. If you have set the breakpoint on a specific machine instruction, the
breakpoint will be triggered and the execution will stop, before the instruction is
executed.
To set a code hardware breakpoint, right-click in the Breakpoints window and choose
New Breakpoint>Code HW from the context menu. To modify an existing breakpoint,
select it in the Breakpoints window and choose Edit from the context menu.
59
CS78KHW-4:Final
Using breakpoints
The Code HW breakpoints dialog box appears.
.
Figure 34: Code HW Breakpoints dialog box
Break At
Specify the location for the breakpoint in the Break At text box. Alternatively, click the
Edit browse button to open the Enter Location dialog box, described in the IAR
Embedded Workbench® IDE User Guide.
For a description of how to use breakpoints and about the Breakpoints window, see the
IAR Embedded Workbench® IDE User Guide.
BREAKPOINT USAGE DIALOG BOX
The Breakpoint Usage dialog box—available from the Emulator menu—lists all
active breakpoints. For more information, see the IAR Embedded Workbench® IDE
User Guide.
C-SPY USE OF SOFTWARE BREAKPOINTS
Normally when you set a breakpoint, C-SPY sets two breakpoints for internal use. To do
this, the software breakpoints in the emulator are used. The fact that C-SPY uses
software breakpoints is normally not a problem. However, one exception is C-SPY
profiling, which requires many software breakpoints.
C-SPY will set a breakpoint if:
●
the C-SPY option Run to has been selected
●
the linker option With runtime control modules has been selected (debug support
for program termination and optionally file I/O).
IAR C-SPY® Hardware Debugger Systems
60
User Guide for 78K
CS78KHW-4:Final
Emulator-specific debugging
Exceeding the number of available software breakpoints will cause the debugger to
single step. This will significantly reduce the execution speed.
You can prevent the debugger from using breakpoints in these situations by deselecting
these options.
78K0R Data Flash Emulation
This section describes how to set up and test IECUBE emulation of flash programming
for 78K0 and 78K0R devices with flash memory.
DATA FLASH EMULATION DIALOG BOX
The Data Flash Emulation dialog box is available from the Emulator menu. Use this
dialog box to access the data flash memory from the Data Flash Memory window. The
Data Flash Emulation dialog box also provides options for testing error handling and
timing issues in the data flash memory.
Figure 35: IECUBE Data Flash Emulation dialog box
Enable data flash
Use this option to enable the data flash emulation and the Data Flash memory window.
61
CS78KHW-4:Final
78K0R Data Flash Emulation
Data Flash Map
Use this option to select the memory area (Chip Select) that the data flash will be
mapped to.
Enable data emulation
Use this option to enable the error emulation and timing emulation.
Error Emulation: (Default: not set)
●
Write (a generation address must be specified)
●
Erase (a generation address must be specified)
●
Internal verify (a generation address must be specified)
●
Blank check (a generation address must be specified)
Timing Emulation:
●
Write (Min, Typical (default), Typical worst (worst case), Max)
●
Erase (Min, Typical (default), Typical worst (worst case), Max)
Note: A generation address is the address where the error occurs. If this address is
outside the data flash memory area, an error message is issued.
PROGRAMMER PG-FPX SECURITY FLAGS DIALOG BOX
(IECUBE ONLY)
The Programmer PG-FPx Security Flags dialog box—available from the Emulator
menu for IECUBE emulators—sets the initial value of the flash programming security
flags.
Note: This feature is only available for 78K0 and 78K0R devices with flash memory.
Figure 36: Programmer PG-FPx Security Flags dialog box
IAR C-SPY® Hardware Debugger Systems
62
User Guide for 78K
CS78KHW-4:Final
Emulator-specific debugging
You can set these security flags:
Security flag
Description
Disable Chip Erase
Protects the entire chip contents from erase.
Disable Block Erase
Protects the contents of the current block from erase.
Disable Program
Write-protects the flash memory.
Disable Boot Cluster
Reprogramming
Write-protects the boot area. Only for MF2 devices.
Table 30: Security Flag values
Click Restore to reset the flags to the values they had when you opened the dialog box.
FLASH SHIELD SETTING DIALOG BOX (IECUBE FOR 78K0R)
By default, the entire flash memory is write-protected by a flash shield. Use the Flash
Shield Setting dialog box—available from the Emulator menu for IECUBE
emulators—to specify that a range of memory blocks can be modified by the flash
self-programming. This memory range is called a flash shield window.
Note: IECUBE flash programming emulation is only available for 78K0R devices with
flash memory.
Figure 37: Flash shield setting dialog box
Note: When you open the Flash Shield Setting dialog box, the values in it might have
been changed either by the debugger or by your application, since you closed the dialog
box last time.
You can set these options:
Option
Description
Flash Shield Window Opens the flash shield window.
Table 31: Flash shield setting options
63
CS78KHW-4:Final
78K0R Data Flash Emulation
Option
Description
Start Block
The number of the first memory block of the flash shield window.
End Block
The number of the last memory block of the flash shield window.
Table 31: Flash shield setting options
Click Restore to restore the values to what they were when you opened the dialog box.
DATA FLASH MEMORY WINDOW
The Data Flash Memory window—available from the Emulator menu when data flash
is enabled—gives an up-to-date display of a specified area of the data flash memory and
allows you to edit it.
Figure 38: The Data Flash Memory window
The Data Flash Memory window lets you save and restore the data flash memory area.
This saving/restoring includes the value and the ID tag. To save or restore, use the
commands Save memory to file and Restore memory from file available on the
context menu.
Toolbar
The toolbar at the top of the window provides these commands:
Command
Description
Address
The location you want to view. This can be a memory address, or the name of a
variable, function, or label.
Table 32: Data Flash Memory window operations
IAR C-SPY® Hardware Debugger Systems
64
User Guide for 78K
CS78KHW-4:Final
Emulator-specific debugging
Display area
The display area shows the addresses currently being viewed, the memory contents in
the format you have chosen, and the ID tags. You can edit the contents of the Memory
window.
Data coverage is displayed with these colors:
●
Yellow indicates data that has been read
●
Blue indicates data that has been written
●
Green indicates data that has been both read and written.
Note: Data coverage is not supported by all C-SPY drivers. Data coverage is supported
by the C-SPY Simulator.
To view the memory corresponding to a variable, you can select it in the editor window
and drag it to the Data Flash Memory window.
Data Flash Memory window context menu
This context menu is available in the Data Flash Memory window:
Figure 39: Data Flash Memory window context menu
These commands are available on the context menu:
Menu command
Description
1x, 2x, 4x Units
Switches between displaying the memory contents in units of 8, 16,
or 32 bits.
Data Coverage
Choose between:
Enable toggles data coverage on and off.
Show toggles between showing and hiding data coverage.
Clear clears all data coverage information.
Table 33: Commands on the Data Flash Memory window context menu
65
CS78KHW-4:Final
78K0R Data Flash Emulation
Menu command
Description
Save memory to file
Displays the Data Flash dialog box, where you can save the
contents of a specified memory area to a file, see the Memory
Save dialog box described in the IAR Embedded Workbench® IDE
User Guide. The supported formats are Intel Hex, Intel Hex with ID
tag, and Motorola S-record.
Restore memory from file
Displays a standard Open dialog box, where you can choose the file
to restore from.
Restore memory from file
with ID-tag
Displays a standard Open dialog box, where you can choose the file
to restore from.
Table 33: Commands on the Data Flash Memory window context menu
IAR C-SPY® Hardware Debugger Systems
66
User Guide for 78K
CS78KHW-4:Final
Using the MINICUBE2
emulator
This chapter contains important information about using the MINICUBE2
OCD Emulator with the 78K0/78K0S and 78K0R Microcontroller Subfamilies.
Read this chapter as a supplement to the chapter Emulator-specific debugging.
Overview
Table 34, MINICUBE2 debug features per microcontroller series, shows the different
debugging features of the MINICUBE2 emulator, depending on which microcontroller
series you are using:
Feature
78K0
78K0S
78K0R
Security
10-byte ID code
authentication
No
10-byte ID code
authentication
Yes
Yes
Yes
Go & Go, Start from
here, Come Here,
Restart, Single step
Go & Go, Start from
here, Come Here,
Restart, Single step
Go & Go, Start from
here, Come Here,
Restart, Single step
Hardware breakpoints
Break before
execution: 1
(unavailable when a
software break is used)
Access breakpoints: 1
No
1
Software breakpoints
2000
2000
2000
Yes
Yes, if interrupts are
enabled
Yes
Pseudo real-time
monitoring
No
Pseudo real-time
monitoring in 2-wire
mode
Application download
Execution variants
Forced breakpoints
RAM monitoring
Table 34: MINICUBE2 debug features per microcontroller series
67
CS78KHW-4:Final
78K0 MINICUBE2 reserved resources
Feature
Pin masking
Time measurement
(from execution start
to break)
78K0
78K0S
78K0R
For reset pin
For reset pin
For internal and
external reset pins
Resolution: 100 µs,
Max. time:
~100 hours
Resolution: 100 µs,
Max. time:
~100 hours
Resolution: 100 µs,
Max. time:
~100 hours
Table 34: MINICUBE2 debug features per microcontroller series (Continued)
When the MINICUBE2 emulator is debugging an application, some resources cannot
be used by the application and must be reserved.
All ROM areas used by the monitor program must be reserved by your application. Any
modification of these areas is prohibited. These areas must be excluded from the usable
address space in the linker command file.
Device-specific linker command files to be used as templates are included in the
$TOOLKIT_DIR$\config\ directory.
If unused ROM addresses are filled using the XLINK option -H, the XLINK option -h
must be used to exclude the resources required by the debug monitor program.
//--------------------------------------------------------------// Fill-up unused ROM areas
//---------------------------------------------------------------HFF
//--------------------------------------------------------------// Monitor program areas 00002-00003, 007E-018F must be excluded
//---------------------------------------------------------------h0004-007D
-h0190-ROM-END
78K0 MINICUBE2 reserved resources
Some resources must be reserved by your application. Any modification of these areas
is prohibited.
ROM AREAS USED FOR ON-CHIP DEBUGGING
The following ROM areas must be reserved:
●
●
●
IAR C-SPY® Hardware Debugger Systems
68
User Guide for 78K
CS78KHW-4:Final
The reset vector, which will be overwritten by the monitor program during
debugging
The IRQ vector at address 0x0002,0x0003, which is used by the monitor program
The CALLT table entry at address 0x007E,0x007F, which is used for software
breakpoints
Using the MINICUBE2 emulator
●
●
●
●
The OCD option byte area address at 0x0084, which is used for configuring the
OCD interface
The Security ID area at 0x0085–0x008E, which contains the authentication code
Monitor area 1 at 0x008F–0x018F, which is used by the monitor program
Monitor area 2 beginning at 0x0190. The exact size is device-specific and defined
in the linker command file. This area is used by the monitor program for the pseudo
RRM area.
RAM SPACE
The following RAM areas must be reserved:
●
●
Up to additional 16 bytes of the stack area
The 16-bytes pseudo RRM area at 0xF7F0–0xF7FF.
PINS
The following pins must be reserved:
Either
● X1 and X2
or
● OCD1A (P3.1) and OCD1B (P3.2)
SECURITY ID AND OPTION BYTES
The option byte at address 0x0084 configures the OCD interface. Make sure that the
interface is enabled before starting a debug session.
The Security ID allows an authentication check before the debug session is started. The
behavior when an incorrect Security ID is encountered can be configured. The Security
ID of an erased device is 10 times 0xFF.
Define the Security ID and the option bytes using one of two methods:
●
●
In specific constant segments
By absolute memory allocation.
Example 1
Using specific constant segments:
#pragma constseg=OPTBYTE
__root const unsigned char optbyte[5] = {v0,v1,v2,v3,v4};
#pragma constseg=SECUID
__root const unsigned char secu_ID[10]= {s0,s1,s2,s3,s4,s5,s6,
s7,s8,s9};
#pragma constseg=default
69
CS78KHW-4:Final
78K0 MINICUBE2 reserved resources
Example 2
Using absolute memory allocation:
__root const unsigned char optbyte[5] @ 0x0080 = {v0,v1,v2,v3,
v4};
__root const unsigned char secu_ID[10] @ 0x0085 = {s0,s1,s2,s3,
s4,s5,s6,s7,s8,s9};
The ten bytes s0–s9 make up the ID Code that you are defining. By default, all values
are 0xFF. See ID Code, page 15.
The device-specific values v0–v3 are described in the device documentation. The value
v4 configures the OCD interface according to Table 35, Possible values for option byte
v4:
Value of v4
Description
0x00
Debugging is unavailable even if an OCD emulator (such as MINICUBE2) is
connected. Only for flash programming.
0x02
The on-chip flash memory is not erased, no matter how many times the
Security ID code authentication fails
0x03
All on-chip flash memory areas are erased if the Security ID code
authentication fails
All other values
Not allowed.
Table 35: Possible values for option byte v4
You can change the segment names OPTBYTE and SECUID. New names must be defined
in the linker command file.
See also ID Code, page 15.
RESERVING THE ROM MEMORY AREA FOR THE MONITOR
The addresses 0x02, 0x03 and an area starting at address 0x8F must be reserved for
the debug monitor program. If this area is rewritten by the flash self-programming,
on-chip debugging can no longer be performed. Reserve these areas in the linker
command file.
This area cannot be used by linked application code:
//--------------------------------------------------------------// Reserved ROM area for Minicube Firmware: 0090-0349
//---------------------------------------------------------------
Device-specific linker command file templates reserving all necessary areas are
included with the product. The templates are located in the $TOOLKIT_DIR$\config\
IAR C-SPY® Hardware Debugger Systems
70
User Guide for 78K
CS78KHW-4:Final
Using the MINICUBE2 emulator
directory. The naming convention is transparent. The template for the µPD78F0893
device is named lnk78f0893.xcl, for example.
STACK AREA
On-chip debugging requires up to 16 bytes of additional stack. Therefore the stack size
of the application must be increased. In the IAR Embedded Workbench IDE, choose
Project>Options and open the Stack/Heap page in the General Options category. If
you are debugging from the command line, the stack size is defined in the linker
command file:
//--------------------------------------------------------------// Size of the stack.
//---------------------------------------------------------------D_CSTACK_SIZE=80
CAUTIONS ON DEBUGGING FOR 78K0
There are a number of important things you need to know when debugging with the
MINICUBE2 emulator. Refer to chapter 4.2.7 of the QB-MINI2 On-Chip Debug
Emulator with Programming Function User’s Manual, available from the Renesas
website www.renesas.eu/docuweb.
78K0S MINICUBE2 Reserved Resources
Some resources must be reserved by your application. Any modification of these areas
is prohibited.
ALL ROM AREAS USED FOR ON-CHIP DEBUGGING
The following ROM areas must be reserved:
●
●
●
●
The INTP1 IRQ vector, which is used by the monitor (only for the 78K0S/KU1+
and 78K0S/KY1+ series)
The INTP3 IRQ vector, which is used by the monitor (only for the 78K0S/KA1+
and 78K0S/KB1+ series)
The CALLT table entry at address 0x007E,0x007F, which is used for software
breakpoints
Monitor area 1, 304 bytes at the end of the internal ROM, which is used by the
monitor program
RAM SPACE
An additional 5 bytes of the stack area must be reserved.
71
CS78KHW-4:Final
78K0S MINICUBE2 Reserved Resources
PINS
The following pins must be reserved:
●
●
●
●
INTP1 (only for the 78K0S/KU1+ series and the 78K0S/KY1+ series)
INTP3 (only for the 78K0S/KA1+ series and the 78K0S/KB1+ series)
X1 and X2 (only during the download of the monitor program and the application)
RESET
SECURITY ID AND THE OPTION BYTES
The 78K0S microcontroller series does not support Security ID and option bytes to
configure the OCD interface. However, the option bytes needed to configure the
microcontroller must be defined correctly.
Define the option bytes using one of two methods:
●
●
In specific constant segments
By absolute memory allocation.
Examples
1 Using specific constant segments:
#pragma constseg=OPTBYTE
__root const unsigned char optbyte[2] = {v0,v1};
#pragma constseg=default
2 Using absolute memory allocation:
__root const unsigned char optbyte[2] @ 0x0080 = {v0,v1};
The device-specific values v0 and v1 are described in the device documentation.
See also ID Code, page 15.
RESERVING THE ROM MEMORY AREA FOR THE MONITOR
The debug monitor program performs initialization processing for debug
communication interface and run or break processing for the CPU. The used area must
be filled with 0xFF. This area must not be rewritten by your application. 304 bytes at the
end of the internal ROM area cannot be used by your application. This area can not be
used for any segment definition.
IAR C-SPY® Hardware Debugger Systems
72
User Guide for 78K
CS78KHW-4:Final
Using the MINICUBE2 emulator
The location of the area depends on the size of flash memory of the device:
1-Kbyte Flash Devices
//--------------------------------------------------------------// Reserved ROM area for MINICUBE2 Monitor Program: 02D0-03FF
//---------------------------------------------------------------
2-Kbyte Flash Devices
//--------------------------------------------------------------// Reserved ROM area for MINICUBE2 Monitor Program: 06D0-07FF
//---------------------------------------------------------------
4-Kbyte Flash Devices
//--------------------------------------------------------------// Reserved ROM area for MINICUBE2 Monitor Program: 0ED0-0FFF
//---------------------------------------------------------------
8-Kbyte Flash Devices
//--------------------------------------------------------------// Reserved ROM area for MINICUBE2 Monitor Program: 1ED0-1FFF
//---------------------------------------------------------------
Device-specific linker command file templates are included in the
$TOOLKIT_DIR$\config\ directory. Modify and use these templates to reduce the
defined ROM area.
Example: 8-Kbyte Flash Device
//--------------------------------------------------------------// Startup, runtime library, non-banked, interrupt
// and CALLT functions code segment.
//--------------------------------------------------------------//-Z(CODE)RCODE,CODE=0086-1FFF
-Z(CODE)RCODE,CODE=0086-1ECF
//--------------------------------------------------------------// Data initializer segments.
//--------------------------------------------------------------//-Z(CONST)NEAR_ID,SADDR_ID,DIFUNCT=0086-1FFF
-Z(CONST)NEAR_ID,SADDR_ID,DIFUNCT=0086-1ECF
//--------------------------------------------------------------// Constant segments
//--------------------------------------------------------------//-Z(CONST)CONST,SWITCH=0086-1FFFF
-Z(CONST)CONST,SWITCH=0086-1ECF
73
CS78KHW-4:Final
78K0S MINICUBE2 Reserved Resources
The area 0x007E–0x007F is used for software breakpoints. Therefore this area cannot
be used by the application and must be reserved. By default, these addresses are a part
of the CALLT table. When debugging an application with MINICUBE2 the address area
of the CALLT table segment CLTVECT must be reduced from 0x0040–0x007F to
0x0040–0x007D:
//--------------------------------------------------------------// CALLT vector segment
//---------------------------------------------------------------Z(CODE)CLTVEC=0040-007D
STACK AREA
On-chip debugging requires an additional 5 bytes of stack. Therefore the stack size of
the application must be increased. In the IAR Embedded Workbench IDE, choose
Project>Options and open the Stack/Heap page in the General Options category. If
you are debugging from the command line, the stack size is defined in the linker
command file:
//--------------------------------------------------------------// Size of the stack.
//---------------------------------------------------------------D_CSTACK_SIZE=40
RESERVING RESOURCES OF THE SERIAL INTERFACE
The INTP pin is used for communication between MINICUBE2 and the target system.
The settings related to the INTP pin are performed by the debug monitor program, but
if the setting is changed by the user application, a communication error might occur. To
prevent such a problem from occurring, you must secure the communication serial
interface in the your application.
In particular, take care of the following issues:
Interrupt mask flag register
Do not disable interrupts using the interrupt mask flag register that corresponds to the
INTP pin in use.
IAR C-SPY® Hardware Debugger Systems
74
User Guide for 78K
CS78KHW-4:Final
Using the MINICUBE2 emulator
Example
Only the following setting of register MK1 is possible when the target device is a
78K0S/KB1+ and pin INTP3 is used.
Bit 7
Bit 6
Bit 5
Bit 4
Bit 3
Bit 2
Bit 1
Bit 0
1
*
*
*
*
0
*
1
* = any value
Figure 40: Register MK1
Port mode registers of alternate-function ports
Do not set the alternate-function port that corresponds to the INTP pin in use to output
mode.
Example
Only the following setting of register PM4 is possible when the target device is a
78K0S/KB1+ and pin INTP3 is used.
Bit 7
Bit 6
Bit 5
Bit 4
Bit 3
Bit 2
Bit 1
Bit 0
*
*
*
*
*
*
1
*
* = any value
Figure 41: Register PM4
External interrupt mode registers
The external interrupt mode register that corresponds to the INTP pin in use must be set
to rising edge.
Example
Only the following setting of register INTM1 is possible when the target device is a
78K0S/KB1+ and pin INTP3 is used.
Bit 7
Bit 6
Bit 5
Bit 4
Bit 3
Bit 2
Bit 1
Bit 0
*
*
*
*
*
*
0
1
* = any value
Figure 42: Register INTM1
75
CS78KHW-4:Final
78K0R MINICUBE2 Reserved Resources
CAUTIONS ON DEBUGGING FOR 78K0S
There are a number of important things you need to know when debugging with the
MINICUBE2 emulator. Refer to chapter 5.2.7 of the QB-MINI2 On-Chip Debug
Emulator with Programming Function User’s Manual, available from the Renesas
website www.renesas.eu/docuweb.
78K0R MINICUBE2 Reserved Resources
Some resources must be reserved by your application. Any modification of these areas
is prohibited.
ROM AREAS USED FOR ON-CHIP DEBUGGING
The following ROM areas must be reserved:
●
●
●
●
●
●
The reset vector (will be overwritten by the monitor program during debugging)
The IRQ vector at address 0x0002,0x0003 is used by the monitor program
The OCD option byte area address at 0x00C3 is used for configuring the OCD
interface
The Security ID area at 0x00C4–0x00CD contains the authentication code
Monitor area 1 at 0x00CE–0x00D7. Used by the monitor program
Monitor area 2, 1024 bytes at the end of the internal ROM. Used by the monitor
program. If the pseudo RRM feature is not used in 2-wire mode, this area is only 88
bytes.
RAM SPACE
An additional 6 bytes of the stack area must be reserved.
PINS
The following pins must be reserved:
●
●
In 1-wire mode: TOOL0
In 2-wire mode: TOOL0 and TOOL1
SECURITY ID AND OPTION BYTES
The option byte at address 0x00C0 configures the OCD interface. Make sure that the
interface is enabled before starting a debug session.
The Security ID allows an authentication check before the debug session is started. The
behavior in case of a using a wrong security ID can be configured. The Security ID of
an erased device is 10 times 0xFF.
IAR C-SPY® Hardware Debugger Systems
76
User Guide for 78K
CS78KHW-4:Final
Using the MINICUBE2 emulator
Define the Security ID and option bytes using one of two methods:
●
●
In specific constant segments
By absolute memory allocation.
Examples
1 Using specific constant segments:
#pragma constseg=OPTBYTE
__root const unsigned char optbyte[4] = {v0,v1,v2,v3};
#pragma constseg=SECUID
__root const unsigned char secu_ID[10]= {s0,s1,s2,s3,s4,s5,s6,
s7,s8,s9};
#pragma constseg=default
2 Using absolute memory allocation:
__root const unsigned char optbyte[5] @ 0x00C0 = {v0,v1,v2,v3,
v4};
__root const unsigned char secu_ID[10] @ 0x00C4 = {s0,s1,s2,s3,
s4,s5,s6,s7,s8,s9};
The ten bytes s0–s9 make up the ID Code that you are defining. By default, all values
are 0xFF. See ID Code, page 19.
The device-specific values v0–v2 are described in the device documentation. The value
v3 configures the OCD interface according to Table 36, Possible values for option byte
v3:
Value of v3
Description
0x00
Debugging is unavailable even if an OCD emulator (such as MINICUBE2) is
connected. Only for flash programming.
0x05
Not allowed.
0x84
All on-chip flash memory areas are erased if the Security ID code
authentication fails
0x85
The on-chip flash memory is not erased, no matter how many times the
Security ID code authentication fails
Table 36: Possible values for option byte v3
You can change the segment names OPTBYTE and SECUID. New names must be defined
in the linker command file.
See also ID Code, page 19.
77
CS78KHW-4:Final
Further reading
RESERVING THE ROM MEMORY AREA FOR THE MONITOR
The addresses 0x02, 0x03, the area between 0x00CE–0x00D7, and the last 1024 bytes
of the internal ROM must be reserved for the debug monitor program. If this area is
rewritten by the flash self-programming, on-chip debugging can no longer be
performed. Reserve these areas in the linker command file.
This area cannot be used by linked application code:
//--------------------------------------------------------------// Reserved ROM area for Minicube Firmware: 000CE-000D7
//
0FC00-0FFFF
//---------------------------------------------------------------
Device-specific linker command file templates reserving all necessary areas are
included with the product. The templates are located in the $TOOLKIT_DIR$\config\
directory. The naming convention is transparent. The template for the µPD78F1166
device is named lnk78f1166_a0.xcl, for example.
STACK AREA FOR DEBUGGING
On-chip debugging requires another 6 bytes of stack. Therefore the stack size of the
application must be increased. In the IAR Embedded Workbench IDE, choose
Project>Options and open the Stack/Heap page in the General Options category. If
you are debugging from the command line, the stack size is defined in the linker
command file:
//--------------------------------------------------------------// Size of the stack.
//---------------------------------------------------------------D_CSTACK_SIZE=80
CAUTIONS ON DEBUGGING FOR 78K0R
There are a number of important things you need to know when debugging with the
MINICUBE2 emulator. Refer to chapter 6.2.6 of the QB-MINI2 On-Chip Debug
Emulator with Programming Function User’s Manual, available from the Renesas
website www.renesas.eu/docuweb.
Further reading
For more information about using the OCD emulator MINICUBE2, see the QB-MINI2
On-Chip Debug Emulator with Programming Function User’s Manual, available from
the Renesas website www.renesas.eu/docuweb.
For information about known problems and for a list of supported devices, see the
QB-MINI2-EE Universal Flash Memory Programmer and Serial On-chip Debugger
IAR C-SPY® Hardware Debugger Systems
78
User Guide for 78K
CS78KHW-4:Final
Using the MINICUBE2 emulator
Operating Precautions guide. It is available from the Renesas website
www.renesas.eu/docuweb.
TARGET SYSTEM DESIGN
The target system design is described in the MINICUBE2 (QB-MINI2) User’s Manual
for all microcontroller series.
FLASH PROGRAMMING
Using the MINICUBE2 emulator as a flash programmer is described in MINICUBE2
(QB-MINI2) User’s Manual for all microcontroller series.
79
CS78KHW-4:Final
Further reading
IAR C-SPY® Hardware Debugger Systems
80
User Guide for 78K
CS78KHW-4:Final
Index
Index
A
Access type (IECUBE Edit Events dialog box) . . . . . . . . . 42
Access type (IE-78 Edit Events dialog box) . . . . . . . . . . . . 40
Access type (MINICUBE Edit Events dialog box) . . . . . . . 42
Access type (MINICUBE2 Edit Events dialog box) . . . . . . 42
Access type (TK-78 Edit Events dialog box) . . . . . . . . . . . 42
Address (IECUBE Edit Events dialog box) . . . . . . . . . . . . 43
Address (IE-78 Edit Events dialog box) . . . . . . . . . . . . . . . 40
Address (MINICUBE Edit Events dialog box) . . . . . . . . . . 43
Address (MINICUBE2 Edit Events dialog box) . . . . . . . . . 43
Address (TK-78 Edit Events dialog box) . . . . . . . . . . . . . . 43
assumptions, programming experience . . . . . . . . . . . . . . . . xi
Automatic mapping, live watch option . . . . . . . . . . . . . . . . 27
B
Breakpoint toggle during run (Emulator menu) . . . . . . . . . . 9
Breakpoint Usage dialog box (Emulator menu) . . . . . . . . . 60
breakpoints
code hardware . . . . . . . . . . . . . . . . . . . . . . . . . . . . . . . . 59
event . . . . . . . . . . . . . . . . . . . . . . . . . . . . . . . . . . . . . . . 58
usage, in emulator . . . . . . . . . . . . . . . . . . . . . . . . . . . . . 60
Breakpoints dialog box
Code HW . . . . . . . . . . . . . . . . . . . . . . . . . . . . . . . . . . . . 59
Event . . . . . . . . . . . . . . . . . . . . . . . . . . . . . . . . . . . . . . . 58
C
Clear timer before Go (timer option) . . . . . . . . . . . . . . . . . 37
Clock Source, IE-78 hardware setup . . . . . . . . . . . . . . . . . . 12
code hardware breakpoints . . . . . . . . . . . . . . . . . . . . . . . . . 59
_CODEBANK_BANKS (symbol) . . . . . . . . . . . . . . . . . . . 54
Common Exec Interface driver . . . . . . . . . . . . . . . . . . . . . . . 3
Communication log (C-SPY emulator option) . . . . . . . . . . . 8
configuration, of emulator hardware . . . . . . . . . . . . . . . . . . . 8
conventions, typographic . . . . . . . . . . . . . . . . . . . . . . . . . xiii
copyright notice . . . . . . . . . . . . . . . . . . . . . . . . . . . . . . . . . . ii
Count rate (timer option) . . . . . . . . . . . . . . . . . . . . . . . . . . 37
C-SPY emulator options
Communication log . . . . . . . . . . . . . . . . . . . . . . . . . . . . . 8
serial port for TK-78K . . . . . . . . . . . . . . . . . . . . . . . . . . . 8
Suppress . . . . . . . . . . . . . . . . . . . . . . . . . . . . . . . . . . . . . . 8
Verify . . . . . . . . . . . . . . . . . . . . . . . . . . . . . . . . . . . . . . . . 8
D
data coverage, in Data Flash Memory window . . . . . . . . . . 65
Data Flash Emulation (dialog box) . . . . . . . . . . . . . . . . . . . 61
Data Flash Map, IECUBE data flash emulation . . . . . . . . . 62
Data Flash Memory window . . . . . . . . . . . . . . . . . . . . . . . . 64
context menu . . . . . . . . . . . . . . . . . . . . . . . . . . . . . . . . . 65
Data Flash Memory (IECUBE window) . . . . . . . . . . . . . . . 64
Data (IECUBE Edit Events dialog box) . . . . . . . . . . . . . . . 43
Data (IE-78 Edit Events dialog box) . . . . . . . . . . . . . . . . . . 40
Data (MINICUBE Edit Events dialog box) . . . . . . . . . . . . . 43
Data (MINICUBE2 Edit Events dialog box) . . . . . . . . . . . . 43
Data (TK-78 Edit Events dialog box) . . . . . . . . . . . . . . . . . 43
debug file, downloading . . . . . . . . . . . . . . . . . . . . . . . . . . . . 8
debugger drivers
comparisons . . . . . . . . . . . . . . . . . . . . . . . . . . . . . . . . . . . 2
supported . . . . . . . . . . . . . . . . . . . . . . . . . . . . . . . . . . . . . 1
debugging, using emulator . . . . . . . . . . . . . . . . . . . . . . . . . . 7
demo application, running with C-SPY emulator . . . . . . . . . 4
dialog boxes
Breakpoint Usage. . . . . . . . . . . . . . . . . . . . . . . . . . . . . . 60
Data Flash Emulation. . . . . . . . . . . . . . . . . . . . . . . . . . . 61
DMM Function Settings . . . . . . . . . . . . . . . . . . . . . . . . 24
Edit Events . . . . . . . . . . . . . . . . . . . . . . . . . . . . . . . . 39, 41
Edit Flash Emulation Events . . . . . . . . . . . . . . . . . . . . . 54
Edit Flash Emulation Timing . . . . . . . . . . . . . . . . . . . . . 55
Edit Sequencer Events . . . . . . . . . . . . . . . . . . . . . . . . . . 45
Find in Trace . . . . . . . . . . . . . . . . . . . . . . . . . . . . . . . . . 49
Flash Programming Emulation . . . . . . . . . . . . . . . . . . . 53
Flash Shield Setting . . . . . . . . . . . . . . . . . . . . . . . . . . . . 63
Hardware Setup (IECUBE Emulator menu). . . . . . . . . . 19
Hardware Setup (IE-78 Emulator menu) . . . . . . . . . . . . 11
Hardware Setup (MINICUBE Emulator menu) . . . . . . . 14
81
CS78KHW-4:Final
Hardware Setup (MINICUBE2 Emulator menu) . . . 14, 19
Hardware Setup (TK-78 Emulator menu) . . . . . . . . 14, 19
Live Watch Settings . . . . . . . . . . . . . . . . . . . . . . . . . . . . 26
OCD interface . . . . . . . . . . . . . . . . . . . . . . . . . . . . . . . . . 4
Programmer PG-FPx Security Flags . . . . . . . . . . . . . . . 62
Pseudo Emulation . . . . . . . . . . . . . . . . . . . . . . . . . . . . . 24
Snap Shot Function Settings . . . . . . . . . . . . . . . . . . . . . 29
Stub Function Settings . . . . . . . . . . . . . . . . . . . . . . . . . . 31
Trace Save . . . . . . . . . . . . . . . . . . . . . . . . . . . . . . . . . . . 49
Trace Settings
IECUBE . . . . . . . . . . . . . . . . . . . . . . . . . . . . . . . . . . 34
IE-78 emulator . . . . . . . . . . . . . . . . . . . . . . . . . . . . . 32
Disable Block Erase (flash programming security flag) . . . 63
Disable Boot block cluster reprogramming
(flash programming security flag) . . . . . . . . . . . . . . . . . . . . 63
Disable Chip Erase (flash programming security flag) . . . . 63
Disable Program (flash programming security flag) . . . . . . 63
disclaimer . . . . . . . . . . . . . . . . . . . . . . . . . . . . . . . . . . . . . . . ii
DMM Function Settings (dialog box) . . . . . . . . . . . . . . . . . 24
document conventions. . . . . . . . . . . . . . . . . . . . . . . . . . . . xiii
documentation
other documentation . . . . . . . . . . . . . . . . . . . . . . . . . . . xii
this guide . . . . . . . . . . . . . . . . . . . . . . . . . . . . . . . . . . . . xi
E
Edit Events dialog box (IECUBE Emulator menu) . . . . . . . 41
Edit Events dialog box (IE-78 Emulator menu) . . . . . . . . . 39
Edit Events dialog box (MINICUBE Emulator menu) . . . . 41
Edit Events dialog box (TK-78 Emulator menu) . . . . . . . . . 41
Edit Flash Emulation Events (dialog box). . . . . . . . . . . . . . 54
Edit Flash Emulation Timing (dialog box) . . . . . . . . . . . . . 55
Edit Sequencer Events dialog box (MINICUBE Emulator
menu) . . . . . . . . . . . . . . . . . . . . . . . . . . . . . . . . . . . . . . . . . 45
Edit Sequencer Events dialog box (TK-78 Emulator menu) 45
Edit Sequencer Events dialog box
(IECUBE Emulator menu) . . . . . . . . . . . . . . . . . . . . . . . . . 45
Edit Sequencer Events (IE-78 Emulator menu). . . . . . . . . . 44
edition, of this guide . . . . . . . . . . . . . . . . . . . . . . . . . . . . . . . ii
eeprom_write (flash emulation command) . . . . . . . . . . . . . 58
IAR C-SPY® Hardware Debugger Systems
82
User Guide for 78K
CS78KHW-4:Final
8/16-bit external data (IE-78 Edit Events dialog box) . . . . . 40
emulator
communication overview . . . . . . . . . . . . . . . . . . . . . . . . . 3
hardware configuration . . . . . . . . . . . . . . . . . . . . . . . . . . 8
setting up . . . . . . . . . . . . . . . . . . . . . . . . . . . . . . . . . . . . . 7
emulator memory type. See memory types, emulator
Emulator toolbar . . . . . . . . . . . . . . . . . . . . . . . . . . . . . . . . . . 9
Enable conditional measurement (timer option) . . . . . . . . . 37
Enable data emulation
IECUBE data flash emulation . . . . . . . . . . . . . . . . . . . . 62
Enable Flash Self Programming (Emulator menu) . . . . . . . 11
Enable (IECUBE Edit Sequencer Events dialog box) . . . . . 46
Enable (IE-78 Edit Sequencer Events dialog box) . . . . . . . 45
Erase flash before next ID check, TK-78 hardware setup . . 20
Erase flash before next ID check,
MINICUBE2 hardware setup . . . . . . . . . . . . . . . . . . . . . . . 20
erase (flash emulation command) . . . . . . . . . . . . . . . . . . . . 58
event breakpoints . . . . . . . . . . . . . . . . . . . . . . . . . . . . . . . . 58
Event Overview . . . . . . . . . . . . . . . . . . . . . . . . . . . . . . . . . 53
events
defining . . . . . . . . . . . . . . . . . . . . . . . . . . . . . . . . . . . . . 59
editing . . . . . . . . . . . . . . . . . . . . . . . . . . . . . 39–42, 45–46
events in IECUBE emulator, defining . . . . . . . . . . . . . . . . . 42
events in IE-78 emulator, defining . . . . . . . . . . . . . . . . 39, 44
events in MINICUBE emulator, defining . . . . . . . . . . . . . . 42
events in MINICUBE2 emulator, defining . . . . . . . . . . . . . 42
events in TK-78 emulator, defining . . . . . . . . . . . . . . . . . . . 42
External emul RAM, emulator memory type . . . . . . . . . . . 13
External emul ROM, emulator memory type . . . . . . . . . . . 13
external interrupt mode registers (78K0S MINICUBE2) . . 75
External target area, emulator memory type . . . . . . 13, 18, 23
F
Fail-safe Break, IECUBE hardware setup . . . . . . . . . . . 17, 21
Find in Trace (dialog box). . . . . . . . . . . . . . . . . . . . . . . . . . 49
Find in Trace (window). . . . . . . . . . . . . . . . . . . . . . . . . . . . 51
flash control firmware functions . . . . . . . . . . . . . . . . . . . . . 54
Flash Programming Emulation (dialog box) . . . . . . . . . . . . 53
Index
flash programming security flags . . . . . . . . . . . . . . . . . . . . 62
Flash programming, MINICUBE2 hardware setup . . . . . . . 22
Flash programming, TK-78 hardware setup . . . . . . . . . . . . 22
Flash Shield Setting (dialog box) . . . . . . . . . . . . . . . . . . . . 63
flash shield window . . . . . . . . . . . . . . . . . . . . . . . . . . . . . . 63
Function Trace (window) . . . . . . . . . . . . . . . . . . . . . . . . . . 51
H
hardware configuration . . . . . . . . . . . . . . . . . . . . . . . . . . . . . 8
hardware debugger systems, overview . . . . . . . . . . . . . . . . . 1
Hardware Setup dialog box (IECUBE Emulator menu) . . . 19
Hardware Setup dialog box (IE-78 Emulator menu) . . . . . . 11
Hardware Setup dialog box (MINICUBE Emulator menu). 14
Hardware Setup dialog box (TK-78 Emulator menu) . . 14, 19
Hardware Setup dialog box
(MINICUBE2 Emulator menu). . . . . . . . . . . . . . . . . . . 14, 19
I
ID Code, MINICUBE hardware setup . . . . . . . . . . . . . . . . 15
ID Code, MINICUBE2 hardware setup . . . . . . . . . . . . 15, 19
ID Code, TK-78 hardware setup . . . . . . . . . . . . . . . . . . 15, 19
IECUBE Emulators
editing events . . . . . . . . . . . . . . . . . . . . . . . . . . . . . . . . . 41
editing sequencer events . . . . . . . . . . . . . . . . . . . . . . . . 45
hardware . . . . . . . . . . . . . . . . . . . . . . . . . . . . . . . . . . . . 19
trace settings . . . . . . . . . . . . . . . . . . . . . . . . . . . . . . . . . 34
IE-78 Emulators
editing events . . . . . . . . . . . . . . . . . . . . . . . . . . . . . . . . . 39
editing sequencer events . . . . . . . . . . . . . . . . . . . . . . . . 44
hardware setup . . . . . . . . . . . . . . . . . . . . . . . . . . . . . . . . 11
trace settings . . . . . . . . . . . . . . . . . . . . . . . . . . . . . . . . . 32
IE–78K0K1–ET emulator, features . . . . . . . . . . . . . . . . . . . . 2
IE–78K0–NS emulator, features . . . . . . . . . . . . . . . . . . . . . . 2
IE–78K0–NS–A emulator, features. . . . . . . . . . . . . . . . . . . . 2
IE–78K0S–NS–A emulator, features . . . . . . . . . . . . . . . . . . 2
important information
78K0 MINICUBE2 debugging . . . . . . . . . . . . . . . . . . . 71
78K0R MINICUBE2 debugging . . . . . . . . . . . . . . . . . . 78
78K0S MINICUBE2 debugging . . . . . . . . . . . . . . . . . . 76
Internal Banked ROM, emulator memory type . . . . . . . . . . 18
Internal Extended RAM, emulator memory type . . . . . 13, 18
Internal RAM, emulator memory type . . . . . . . . . . 13, 18, 23
Internal ROM, emulator memory type . . . . . . . . . . 13, 18, 23
Internal Stack Area, emulator memory type . . . . . . 13, 18, 23
interrupt mask flag register (78K0S MINICUBE2). . . . . . . 74
L
Live Memory window (Emulator menu) . . . . . . . . . . . . . . . 52
Live Watch Settings (dialog box) . . . . . . . . . . . . . . . . . . . . 26
Live watch, hardware setup . . . . . . . . . . . . . . . . . . . . . . . . . 26
M
Main Clock, IECUBE hardware setup . . . . . . . . . . . . . 15, 20
Main Clock, MINICUBE hardware setup . . . . . . . . . . . . . . 15
Main Clock, MINICUBE2 hardware setup . . . . . . . . . . 15, 20
Main Clock, TK-78 hardware setup . . . . . . . . . . . . . . . 15, 20
Mask option, hardware setup . . . . . . . . . . . . . . . . . . . . . . . 24
Memory map, IECUBE hardware setup . . . . . . . . . . . . 18, 23
Memory map, IE-78 hardware setup . . . . . . . . . . . . . . . . . . 13
Memory map, MINICUBE hardware setup . . . . . . . . . . . . 18
Memory map, MINICUBE2 hardware setup . . . . . . . . 18, 23
Memory map, TK-78 hardware setup . . . . . . . . . . . . . . 18, 23
memory types
IE-78 emulator . . . . . . . . . . . . . . . . . . . . . . . . . . . . . . . . 13
MINICUBE emulator. . . . . . . . . . . . . . . . . . . . . . . . . . . 18
MINICUBE2 emulator. . . . . . . . . . . . . . . . . . . . . . . . . . 18
TK-78 emulator . . . . . . . . . . . . . . . . . . . . . . . . . . . . . . . 18
memory, inspecting in real time . . . . . . . . . . . . . . . . . . . . . 52
MINICUBE Emulators
editing events . . . . . . . . . . . . . . . . . . . . . . . . . . . . . . . . . 41
editing sequencer events . . . . . . . . . . . . . . . . . . . . . . . . 45
features . . . . . . . . . . . . . . . . . . . . . . . . . . . . . . . . . . . . . . 2
hardware . . . . . . . . . . . . . . . . . . . . . . . . . . . . . . . . . . . . 14
83
CS78KHW-4:Final
MINICUBE2 Emulators . . . . . . . . . . . . . . . . . . . . . . . . 14, 19
features . . . . . . . . . . . . . . . . . . . . . . . . . . . . . . . . . . . 2, 67
further reading . . . . . . . . . . . . . . . . . . . . . . . . . . 71, 76, 78
MINICUBE2 reserved resources
78K0 . . . . . . . . . . . . . . . . . . . . . . . . . . . . . . . . . . . . . . . 68
78K0R . . . . . . . . . . . . . . . . . . . . . . . . . . . . . . . . . . . . . . 76
78K0S . . . . . . . . . . . . . . . . . . . . . . . . . . . . . . . . . . . . . . 71
Monitor Clock, IECUBE hardware setup . . . . . . . . . . . . . . 16
Monitor Clock, MINICUBE hardware setup . . . . . . . . . . . 16
Monitor Clock, MINICUBE2 hardware setup. . . . . . . . . . . 16
Monitor Clock, TK-78 hardware setup . . . . . . . . . . . . . . . . 16
N
Name (IECUBE Edit Events dialog box) . . . . . . . . . . . . . . 42
Name (IECUBE Edit Sequencer Events dialog box) . . . . . . 46
Name (IE-78 Edit Events dialog box) . . . . . . . . . . . . . . . . . 39
Name (IE-78 Edit Sequencer Events dialog box) . . . . . . . . 44
Name (MINICUBE Edit Events dialog box) . . . . . . . . . . . . 42
Name (MINICUBE2 Edit Events dialog box) . . . . . . . . . . . 42
Name (TK-78 Edit Events dialog box) . . . . . . . . . . . . . . . . 42
O
OCD interface (dialog box). . . . . . . . . . . . . . . . . . . . . . . . . . 4
1-bit ext. edge (IECUBE Edit Events dialog box) . . . . . . . . 44
option bytes (78K0 MINICUBE2 debugging) . . . . . . . . . . 69
option bytes (78K0R MINICUBE2 debugging) . . . . . . . . . 76
option bytes (78K0S MINICUBE2 debugging) . . . . . . . . . 72
P
part number, of this guide . . . . . . . . . . . . . . . . . . . . . . . . . . . ii
Pass count (IECUBE Edit Events dialog box) . . . . . . . . 42, 46
Pass count (MINICUBE Edit Events dialog box) . . . . . . . . 42
Pass count (MINICUBE2 Edit Events dialog box) . . . . . . . 42
Pass count (TK-78 Edit Events dialog box) . . . . . . . . . . . . 42
Pass Count, IE-78 hardware setup . . . . . . . . . . . . . . . . . . . . 13
Peripheral Break, IECUBE hardware setup . . . . . . . . . 16, 22
IAR C-SPY® Hardware Debugger Systems
84
User Guide for 78K
CS78KHW-4:Final
Peripheral Break, IE-78 hardware setup . . . . . . . . . . . . . . . 13
Peripheral Break, MINICUBE hardware setup . . . . . . . . . . 16
Peripheral Break, MINICUBE2 hardware setup . . . . . . 16, 22
Peripheral Break, TK-78 hardware setup . . . . . . . . . . . 16, 22
Pin Mask, IECUBE hardware setup . . . . . . . . . . . . . . . 17, 22
Pin Mask, IE-78 hardware setup . . . . . . . . . . . . . . . . . . . . . 12
Pin Mask, MINICUBE hardware setup . . . . . . . . . . . . . . . . 17
Pin Mask, MINICUBE2 hardware setup . . . . . . . . . . . . 17, 22
Pin Mask, TK-78 hardware setup . . . . . . . . . . . . . . . . . 17, 22
Pin mode, hardware setup . . . . . . . . . . . . . . . . . . . . . . . . . . 24
pins, reserving (78K0 MINICUBE2 debugging). . . . . . . . . 69
pins, reserving (78K0R MINICUBE2 debugging) . . . . . . . 76
pins, reserving (78K0S MINICUBE2 debugging) . . . . . . . 72
pod pins, IECUBE emulator ignoring . . . . . . . . . . . . . . . . . 22
pod pins, IE-78 emulator ignoring . . . . . . . . . . . . . . . . . . . 12
pod pins, MINICUBE emulator ignoring . . . . . . . . . . . . . . 17
pod pins, MINICUBE2 emulator ignoring . . . . . . . . . . . . . 17
pod pins, TK-78 emulator ignoring . . . . . . . . . . . . . . . . . . . 17
port mode registers (78K0S MINICUBE2) . . . . . . . . . . . . . 75
prerequisites, programming experience. . . . . . . . . . . . . . . . xi
Programmer PG-FPx Security Flags (dialog box) . . . . . . . . 62
programming experience. . . . . . . . . . . . . . . . . . . . . . . . . . . xi
Pseudo Emulation (dialog box) . . . . . . . . . . . . . . . . . . . . . . 24
publication date, of this guide . . . . . . . . . . . . . . . . . . . . . . . . ii
Q
QB-78K0MINI emulator, features . . . . . . . . . . . . . . . . . . . . 2
QB-78K0Rxxx emulator, features . . . . . . . . . . . . . . . . . . . . . 2
QB-78K0S emulator, features . . . . . . . . . . . . . . . . . . . . . . . . 2
QB-78K0SxxxMINI emulator, features . . . . . . . . . . . . . . . . 2
QB-78K0xxx emulator, features . . . . . . . . . . . . . . . . . . . . . . 2
R
RAM areas, reserving (78K0 MINICUBE2 debugging) . . . 69
RAM areas, reserving (78K0R MINICUBE2 debugging) . . 76
RAM areas, reserving (78K0S MINICUBE2 debugging) . . 71
registered trademarks . . . . . . . . . . . . . . . . . . . . . . . . . . . . . . ii
Index
retry values, of flash emulation commands . . . . . . . . . . . . . 57
ROM addresses, filling (MINICUBE2) . . . . . . . . . . . . . . . . 68
ROM areas, reserved (78K0 MINICUBE2 debugging) . 68, 70
ROM areas, reserved (78K0R
MINICUBE2 debugging) . . . . . . . . . . . . . . . . . . . . . . . 76, 78
ROM areas, reserved (78K0S
MINICUBE2 debugging) . . . . . . . . . . . . . . . . . . . . . . . 71–72
S
security flags, for flash programming . . . . . . . . . . . . . . . . . 62
Security ID (78K0 MINICUBE2 debugging) . . . . . . . . . . . 69
Security ID (78K0R MINICUBE2 debugging) . . . . . . . . . . 76
self library functions . . . . . . . . . . . . . . . . . . . . . . . . . . . . . . 55
sequencer events, defining . . . . . . . . . . . . . . . . . . . . . . . . . 45
sequencer events, defining (IE-78) . . . . . . . . . . . . . . . . . . . 44
serial interface (78K0S), reserving resources . . . . . . . . . . . 74
serial port for TK-78K (C-SPY emulator option) . . . . . . . . . 8
set_info (flash emulation command) . . . . . . . . . . . . . . . . . . 58
16-bit External Data (IECUBE Edit Events dialog box) . . . 43
Snap Shot Function Settings (dialog box) . . . . . . . . . . . . . . 29
stack, reserving (78K0 MINICUBE2 debugging) . . . . . . . . 71
stack, reserving (78K0R MINICUBE2 debugging). . . . . . . 78
stack, reserving (78K0S MINICUBE2 debugging) . . . . . . . 74
Stub Function Settings (dialog box) . . . . . . . . . . . . . . . . . . 31
Sub Clock, IECUBE hardware setup . . . . . . . . . . . . . . 16, 21
Sub Clock, MINICUBE2 hardware setup . . . . . . . . . . . . . . 21
Sub Clock, TK-78 hardware setup . . . . . . . . . . . . . . . . . . . 21
Suppress (C-SPY emulator option) . . . . . . . . . . . . . . . . . . . . 8
T
Target Connect, MINICUBE2 hardware setup . . . . . . . . . . 22
Target Connect, TK-78 hardware setup . . . . . . . . . . . . . . . . 22
Target Power Off, IECUBE hardware setup . . . . . . . . . . . . 16
Target Power Off, MINICUBE hardware setup . . . . . . . . . . 16
Target Power Off, MINICUBE2 hardware setup . . . . . . 16, 22
Target Power Off, TK-78 hardware setup . . . . . . . . . . . 16, 22
Target, IECUBE hardware setup . . . . . . . . . . . . . . . . . . 16, 23
Time Unit, IECUBE hardware setup . . . . . . . . . . . . . . . 15, 20
Time Unit, IE-78 hardware setup . . . . . . . . . . . . . . . . . . . . 12
Time Unit, MINICUBE2 hardware setup . . . . . . . . . . . . . . 20
Time Unit, TK-78 hardware setup . . . . . . . . . . . . . . . . . . . 20
Timer break (timer option) . . . . . . . . . . . . . . . . . . . . . . . . . 38
Timer conditions (timer option) . . . . . . . . . . . . . . . . . . . . . 38
Timer (Emulator menu) . . . . . . . . . . . . . . . . . . . . . . . . . . . 37
Timing Overview . . . . . . . . . . . . . . . . . . . . . . . . . . . . . . . . 53
timing, of flash emulation . . . . . . . . . . . . . . . . . . . . . . . . . . 55
TK-78 Emulators
editing events . . . . . . . . . . . . . . . . . . . . . . . . . . . . . . . . . 41
editing sequencer events . . . . . . . . . . . . . . . . . . . . . . . . 45
features . . . . . . . . . . . . . . . . . . . . . . . . . . . . . . . . . . . . . . 2
hardware setup . . . . . . . . . . . . . . . . . . . . . . . . . . . . . 14, 19
TK-78K0Rxxx emulators, features . . . . . . . . . . . . . . . . . . . . 2
toolbar
Emulator . . . . . . . . . . . . . . . . . . . . . . . . . . . . . . . . . . . . . 9
trace buffer . . . . . . . . . . . . . . . . . . . . . . . . . . . . . . . . . . . . . 32
inspecting contents of . . . . . . . . . . . . . . . . . . . . . . . . . . 47
saving to file . . . . . . . . . . . . . . . . . . . . . . . . . . . . . . . . . 49
trace buffer in IECUBE emulator, setting . . . . . . . . . . . . . . 35
Trace buffer size (IECUBE) . . . . . . . . . . . . . . . . . . . . . . . . 35
trace buffer (IECUBE) . . . . . . . . . . . . . . . . . . . . . . . . . . . . 34
Trace Save (dialog box) . . . . . . . . . . . . . . . . . . . . . . . . . . . 49
Trace Settings dialog box
IECUBE. . . . . . . . . . . . . . . . . . . . . . . . . . . . . . . . . . . . . 34
IE-78 emulator . . . . . . . . . . . . . . . . . . . . . . . . . . . . . . . . 32
trace settings in IECUBE emulator
Clear trace buffer before go . . . . . . . . . . . . . . . . . . . . . . 35
Delay count . . . . . . . . . . . . . . . . . . . . . . . . . . . . . . . . . . 36
Delay Trigger Trace . . . . . . . . . . . . . . . . . . . . . . . . . . . . 36
Qualify Trace . . . . . . . . . . . . . . . . . . . . . . . . . . . . . . . . . 36
Section Trace . . . . . . . . . . . . . . . . . . . . . . . . . . . . . . . . . 36
Stop Condition . . . . . . . . . . . . . . . . . . . . . . . . . . . . . . . . 35
Trace Operation . . . . . . . . . . . . . . . . . . . . . . . . . . . . . . . 35
trace settings in IE-78 emulator
Clear trace buffer before go . . . . . . . . . . . . . . . . . . . . . . 33
Relative time stamp . . . . . . . . . . . . . . . . . . . . . . . . . . . . 33
Trace conditions . . . . . . . . . . . . . . . . . . . . . . . . . . . . . . . 33
85
CS78KHW-4:Final
Trace Operation . . . . . . . . . . . . . . . . . . . . . . . . . . . . . . . 33
Trigger Point . . . . . . . . . . . . . . . . . . . . . . . . . . . . . . . . . 33
Trace toolbar . . . . . . . . . . . . . . . . . . . . . . . . . . . . . . . . . . . . 48
Trace (window) . . . . . . . . . . . . . . . . . . . . . . . . . . . . . . . . . . 47
trademarks . . . . . . . . . . . . . . . . . . . . . . . . . . . . . . . . . . . . . . ii
typographic conventions . . . . . . . . . . . . . . . . . . . . . . . . . . xiii
U
unused ROM addresses, filling (MINICUBE2). . . . . . . . . . 68
Use read break if not mapped, live watch option. . . . . . . . . 28
Use read break, live watch option . . . . . . . . . . . . . . . . . . . . 27
V
Verify (C-SPY emulator option) . . . . . . . . . . . . . . . . . . . . . . 8
version, IAR Embedded Workbench . . . . . . . . . . . . . . . . . . . ii
View Events (button) . . . . . . . . . . . . . . . . . . . . . . . . . . . . . 59
View Sequencer (button) . . . . . . . . . . . . . . . . . . . . . . . . . . . 59
Voltage, IE-78 hardware setup . . . . . . . . . . . . . . . . . . . . . . 12
W
windows
Data Flash Memory (IECUBE) . . . . . . . . . . . . . . . . . . . 64
Find in Trace . . . . . . . . . . . . . . . . . . . . . . . . . . . . . . . . . 51
Function Trace . . . . . . . . . . . . . . . . . . . . . . . . . . . . . . . . 51
Live Memory . . . . . . . . . . . . . . . . . . . . . . . . . . . . . . . . . 52
Trace . . . . . . . . . . . . . . . . . . . . . . . . . . . . . . . . . . . . . . . 47
write (flash emulation command) . . . . . . . . . . . . . . . . . . . . 58
Symbols
_CODEBANK_BANKS (symbol) . . . . . . . . . . . . . . . . . . . 54
Numerics
1-bit ext. edge (IECUBE Edit Events dialog box) . . . . . . . . 44
16-bit External Data (IECUBE Edit Events dialog box) . . . 43
IAR C-SPY® Hardware Debugger Systems
86
User Guide for 78K
CS78KHW-4:Final
78kemu.htm (emulator release note) . . . . . . . . . . . . . . . . . . . 1
8/16-bit external data (IE-78 Edit Events dialog box) . . . . . 40