1
SaaS Analytics
Analyzing usage data to improve software
Bart Schaap - 1308297
Tim Castelein - 1512277
February 10, 2014
Summary
TOPdesk is a company that develops a software product, also called TOPdesk, for companies
that supply services. Using concrete information about how the TOPdesk software is used, the
development and maintenance process of the software could be greatly improved. In the current
situation this information is unavailable to TOPdesk.
For this Bachelor of Science project an application has been developed that can obtain
concrete information about how the TOPdesk software is being used by its customers. The
system consists of two parts: getting information about customer configuration settings and
getting information about user interaction with the TOPdesk software. Because these two
parts are not enough to obtain all the information that TOPdesk is interested in, a method of
getting additional information has also been developed. How the system retrieves the customer
configuration settings can be found in chapter 4. To read about how the information about user
interactions is obtained, see chapter 5. The method that gathers the additional information is
explained in chapter 6. Finally the conclusion of this project as well as recommendations for
future work can be found in chapter 8.
A working prototype application has been delivered that is set up in a way that TOPdesk
can easily create additional functionality and obtain more and more concrete information about
how the TOPdesk software is being used. Within this project we only analyzed testing data
representative to customer data and we did not analyze actual customer data. This is because
our program was not yet cleared to be used in production and the testing data was enough test
the workings of our application.
i
Preface
This report is the result of the development of a prototype application for gathering usage data,
carried out at as an assignment issued by TOPdesk. The project was executed for the Bachelor
Project course at the Delft University of Technology. We carried out this project working full
time at TOPdesk, starting mid November 2013 and ending mid February 2014.
We would like to thank everyone from the TOPdesk development team Zythos for their
support. Special thanks go to Roel Spilker for providing immutable guidance throughout the
process and to Richard van der Vliet for supporting us with the product vision. Also we want
to thank our TU Delft supervisor, Andy Zaidman, for providing clear expectations and critical
comments on our progress.
ii
Contents
1 Introduction
1.1 TOPdesk company description . . . . . . . . . . . . . . . . . . . . . . . . . . . .
1.2 Problem description . . . . . . . . . . . . . . . . . . . . . . . . . . . . . . . . . .
1.3 Assignment . . . . . . . . . . . . . . . . . . . . . . . . . . . . . . . . . . . . . . .
1
1
1
2
2 Requirements
2.1 Project requirements . . . . . . . . . . . . . . . . . . . . . . . . . . . . . . . . . .
2.2 Functional requirements . . . . . . . . . . . . . . . . . . . . . . . . . . . . . . . .
2.3 Nonfunctional requirements . . . . . . . . . . . . . . . . . . . . . . . . . . . . . .
3
3
3
3
3 Project approach
3.1 Scrum . . . . . . . . . . . . .
3.2 Tools . . . . . . . . . . . . . .
3.2.1 Eclipse . . . . . . . . .
3.2.2 Mercurial . . . . . . .
3.2.3 Maven . . . . . . . . .
3.2.4 Jira . . . . . . . . . .
3.3 Planning . . . . . . . . . . . .
3.3.1 Week 1 - Sprint 0 . . .
3.3.2 Week 2 & 3 - Sprint 1
3.3.3 Week 4 & 5 - Sprint 2
3.3.4 Week 6 & 7 - Sprint 3
3.3.5 Week 8 & 9 - Sprint 4
3.3.6 Week 10 & 11 . . . . .
.
.
.
.
.
.
.
.
.
.
.
.
.
.
.
.
.
.
.
.
.
.
.
.
.
.
.
.
.
.
.
.
.
.
.
.
.
.
.
.
.
.
.
.
.
.
.
.
.
.
.
.
.
.
.
.
.
.
.
.
.
.
.
.
.
.
.
.
.
.
.
.
.
.
.
.
.
.
.
.
.
.
.
.
.
.
.
.
.
.
.
.
.
.
.
.
.
.
.
.
.
.
.
.
.
.
.
.
.
.
.
.
.
.
.
.
.
.
.
.
.
.
.
.
.
.
.
.
.
.
.
.
.
.
.
.
.
.
.
.
.
.
.
.
.
.
.
.
.
.
.
.
.
.
.
.
.
.
.
.
.
.
.
.
.
.
.
.
.
.
.
.
.
.
.
.
.
.
.
.
.
.
.
.
.
.
.
.
.
.
.
.
.
.
.
.
.
.
.
.
.
.
.
.
.
.
.
.
.
.
.
.
.
.
.
.
.
.
.
.
.
.
.
.
.
.
.
.
.
.
.
.
.
.
.
.
.
.
.
.
.
.
.
.
.
.
.
.
.
.
.
.
.
.
.
.
.
.
.
.
.
.
.
.
.
.
.
.
.
.
.
.
.
.
.
.
.
.
.
.
.
.
.
.
.
.
.
.
.
.
.
.
.
.
.
.
.
.
.
.
.
.
.
.
.
.
.
.
.
.
.
.
.
.
.
.
.
.
.
.
.
.
.
.
.
.
.
.
.
.
.
.
.
.
.
.
.
.
.
.
.
.
.
.
.
.
.
.
.
.
.
.
.
.
.
.
.
.
.
.
.
.
.
.
.
.
.
.
.
.
.
.
.
.
.
.
.
5
5
6
6
6
6
6
7
7
7
7
8
8
8
4 Database
4.1 Design . . . . . . . . . . . .
4.1.1 Stored procedures .
4.1.2 Alternative solutions
4.1.3 Chosen solution . . .
4.2 Implementation . . . . . . .
4.3 Testing . . . . . . . . . . .
4.3.1 Evaluation . . . . .
.
.
.
.
.
.
.
.
.
.
.
.
.
.
.
.
.
.
.
.
.
.
.
.
.
.
.
.
.
.
.
.
.
.
.
.
.
.
.
.
.
.
.
.
.
.
.
.
.
.
.
.
.
.
.
.
.
.
.
.
.
.
.
.
.
.
.
.
.
.
.
.
.
.
.
.
.
.
.
.
.
.
.
.
.
.
.
.
.
.
.
.
.
.
.
.
.
.
.
.
.
.
.
.
.
.
.
.
.
.
.
.
.
.
.
.
.
.
.
.
.
.
.
.
.
.
.
.
.
.
.
.
.
.
.
.
.
.
.
.
.
.
.
.
.
.
.
.
.
.
.
.
.
.
.
.
.
.
.
.
.
.
.
.
.
.
.
.
.
.
.
.
.
.
.
.
.
.
.
.
.
.
.
.
.
.
.
.
.
.
.
.
.
.
.
.
.
.
.
.
.
.
.
9
9
9
9
10
10
11
11
5 Log parsing
5.1 Logstash . . . . . . . . . . . . .
5.2 Parsing log files . . . . . . . . .
5.2.1 Event factories . . . . .
5.2.2 States . . . . . . . . . .
5.2.3 Event analyzer . . . . .
5.2.4 Modularization . . . . .
5.2.5 Messaging Queues . . .
5.2.6 Multiple log line parsers
5.3 Answering research questions .
5.4 Testing . . . . . . . . . . . . .
5.4.1 Unit tests . . . . . . . .
5.4.2 Field tests . . . . . . . .
5.5 Evaluation . . . . . . . . . . . .
.
.
.
.
.
.
.
.
.
.
.
.
.
.
.
.
.
.
.
.
.
.
.
.
.
.
.
.
.
.
.
.
.
.
.
.
.
.
.
.
.
.
.
.
.
.
.
.
.
.
.
.
.
.
.
.
.
.
.
.
.
.
.
.
.
.
.
.
.
.
.
.
.
.
.
.
.
.
.
.
.
.
.
.
.
.
.
.
.
.
.
.
.
.
.
.
.
.
.
.
.
.
.
.
.
.
.
.
.
.
.
.
.
.
.
.
.
.
.
.
.
.
.
.
.
.
.
.
.
.
.
.
.
.
.
.
.
.
.
.
.
.
.
.
.
.
.
.
.
.
.
.
.
.
.
.
.
.
.
.
.
.
.
.
.
.
.
.
.
.
.
.
.
.
.
.
.
.
.
.
.
.
.
.
.
.
.
.
.
.
.
.
.
.
.
.
.
.
.
.
.
.
.
.
.
.
.
.
.
.
.
.
.
.
.
.
.
.
.
.
.
.
.
.
.
.
.
.
.
.
.
.
.
.
.
.
.
.
.
.
.
.
.
.
.
.
.
.
.
.
.
.
.
.
.
.
.
.
.
.
.
.
.
.
.
.
.
.
.
.
.
.
.
.
.
.
.
.
.
.
.
.
.
.
.
.
.
.
.
.
.
.
.
.
.
.
.
.
.
.
.
.
.
.
.
.
.
.
.
.
.
.
.
.
.
.
.
.
.
.
.
.
.
.
.
.
.
.
.
.
.
.
.
.
.
.
.
.
.
.
.
.
.
.
.
.
.
.
.
.
.
.
.
.
.
.
.
.
.
.
.
.
.
.
12
12
12
13
13
13
14
14
16
16
17
17
17
18
.
.
.
.
.
.
.
iii
6 Aspects
6.1 Design . . . . . . . . . . . . . .
6.1.1 Altering TOPdesk code
6.1.2 Bytecode weaving . . .
6.1.3 AspectJ . . . . . . . . .
6.2 Implementation . . . . . . . . .
6.3 Testing . . . . . . . . . . . . .
6.4 Evaluation . . . . . . . . . . . .
7 Software Improvement
7.1 First feedback . . . .
7.2 Improvements . . . .
7.3 Final feedback . . .
.
.
.
.
.
.
.
.
.
.
.
.
.
.
.
.
.
.
.
.
.
.
.
.
.
.
.
.
.
.
.
.
.
.
.
.
.
.
.
.
.
.
.
.
.
.
.
.
.
.
.
.
.
.
.
.
.
.
.
.
.
.
.
.
.
.
.
.
.
.
.
.
.
.
.
.
.
.
.
.
.
.
.
.
.
.
.
.
.
.
.
.
.
.
.
.
.
.
.
.
.
.
.
.
.
.
.
.
.
.
.
.
.
.
.
.
.
.
.
.
.
.
.
.
.
.
.
.
.
.
.
.
.
.
.
.
.
.
.
.
.
.
.
.
.
.
.
.
.
.
.
.
.
.
.
.
.
.
.
.
.
.
.
.
.
.
.
.
.
.
.
.
.
.
.
.
.
.
.
.
.
.
.
.
.
.
.
.
.
.
.
.
.
.
.
.
19
19
19
19
20
20
22
22
Group feedback
24
. . . . . . . . . . . . . . . . . . . . . . . . . . . . . . . . . . 24
. . . . . . . . . . . . . . . . . . . . . . . . . . . . . . . . . . 24
. . . . . . . . . . . . . . . . . . . . . . . . . . . . . . . . . . 24
8 Conclusion
8.1 Reflection . . . . . . . . . . . . . . . . . . . . . . . . .
8.2 Requirement evaluation . . . . . . . . . . . . . . . . .
8.3 Recommendations for future work . . . . . . . . . . .
8.3.1 Executing the database queries in a production
8.3.2 Using the log files from customers . . . . . . .
8.3.3 Usability . . . . . . . . . . . . . . . . . . . . .
8.3.4 Result processing . . . . . . . . . . . . . . . . .
8.3.5 Application expansion . . . . . . . . . . . . . .
. . . . . . . .
. . . . . . . .
. . . . . . . .
environment
. . . . . . . .
. . . . . . . .
. . . . . . . .
. . . . . . . .
.
.
.
.
.
.
.
.
.
.
.
.
.
.
.
.
.
.
.
.
.
.
.
.
.
.
.
.
.
.
.
.
.
.
.
.
.
.
.
.
.
.
.
.
.
.
.
.
.
.
.
.
.
.
.
.
25
25
26
26
26
26
27
27
27
A Research questions
A.1 Research questions that can be answered querying the database . . . . . . . . . .
A.2 Research questions that can be answered processing the log files from the TOPdesk
application . . . . . . . . . . . . . . . . . . . . . . . . . . . . . . . . . . . . . . .
A.3 Research questions that cannot be answered processing the log files from the
TOPdesk application or querying the database . . . . . . . . . . . . . . . . . . .
29
29
B User manual
B.1 Database query execution
B.1.1 Configuration file .
B.2 Log file analysis . . . . . .
B.2.1 Configuration file .
31
31
31
31
32
.
.
.
.
.
.
.
.
.
.
.
.
.
.
.
.
.
.
.
.
.
.
.
.
.
.
.
.
C Orientation report
.
.
.
.
.
.
.
.
.
.
.
.
.
.
.
.
.
.
.
.
.
.
.
.
.
.
.
.
.
.
.
.
.
.
.
.
.
.
.
.
.
.
.
.
.
.
.
.
.
.
.
.
.
.
.
.
.
.
.
.
.
.
.
.
.
.
.
.
.
.
.
.
.
.
.
.
.
.
.
.
.
.
.
.
.
.
.
.
.
.
.
.
.
.
.
.
29
30
33
D SIG Feedback
39
D.1 Initial SIG Feedback . . . . . . . . . . . . . . . . . . . . . . . . . . . . . . . . . . 39
D.2 Final SIG Feedback . . . . . . . . . . . . . . . . . . . . . . . . . . . . . . . . . . 39
iv
1
1.1
Introduction
TOPdesk company description
TOPdesk is a company creating and supplying Service Management Software. With over five
thousand customers in the Netherlands they are the leading supplier in their sector.
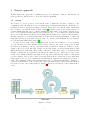
The software that TOPdesk develops is a program that supports companies and organizations in managing their services. These services range from ICT help-desks to facility management. Because TOPdesk develops the software in such a way that it should be beneficial to
every organization that supplies services, every organization gets the same program. Then these
organizations can, with the help of TOPdesk, configure their installation according to their own
needs.
The users of the TOPdesk application can use the software to register everything they need
to correctly provide some specific service. For instance a helpdesk would use the application to
register each question that is asked. This way they can monitor if the question can be answered
and if the person asking the question correctly receives an answer to their question. There are
multiple modules available that can be added to the application. All of those modules can help
in managing specific service processes. Because each company is different, not every company
will use the same modules. This in turn will result in that every customer and every user could
be using the application in a different way.
Most of the TOPdesk installations are installed on-premise. This means that the customer
has the TOPdesk software installed on their own hardware and maintain everything themselves.
The last few years more and more customers are switching to a new solution of using TOPdesk
called Software as a Service, hereafter called SaaS. When a customer chooses to use SaaS,
TOPdesk then installs the application for that customer on hardware that is maintained by
TOPdesk employees. This entails that the customer is free of worries over maintaining the
hardware and the installation of their application. Now customers can access their application
from the cloud, meaning they only need an internet connection to start using TOPdesk. The
trend of customers choosing for a SaaS solution is growing and the balance is starting to shift
in favor of the SaaS solution in respect to on-premise.
1.2
Problem description
Because every customer gets the same software, not everyone will use this product in the same
way and some functions might not even be used at all. To TOPdesk it would be very helpful to
see how the program is configured and used by these organizations. This usage data can be used
to make informed decisions about development of the software regarding existing functionality
and possible improvements. In the current situation TOPdesk is only able to obtain qualitative
information about the usage data. This is obtained by asking feedback from the customers. The
problem with this is that this information is subjective and incomplete. The incompleteness is
caused by that users are mostly unaware of the details of how they use the TOPdesk application.
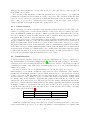
TOPdesk now wants a way to get objective information about the usage of their software.
This information should be obtained from as many users as possible to incorporate all the
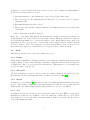
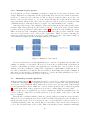
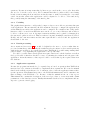
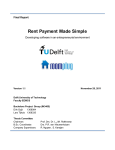
actions of different types of users. An example of a research question from TOPdesk is what
the average time is that specific tabs within the program are being kept open by users. These
tabs are similar to tabs that are opened in web-browsers. In figure 1 an example of what these
tabs look like is shown.
1
Figure 1: Topdesk tabs
1.3
Assignment
The goal of this Bachelor of Science project is to create a prototype application that is capable
of answering research questions about the usage of the TOPdesk application. Because of the
growing amount of SaaS customers TOPdesk now has access to the usage data which was
otherwise not available with customers that had an on-premise installation of TOPdesk. This
available data will be the source of information which the application should use to answer
the questions asked by TOPdesk. The group of customers using SaaS exist of specific types
of companies. Mostly very small and very big companies choose for a SaaS solution, and the
middle sized companies for now mostly use an on-premise solution. With this in mind, we can
only answer questions about these types of companies.
Not all research questions can be answered with this available data. Therefore the project
also entails making extra information available so that these questions also can be answered
using the application.
2
2
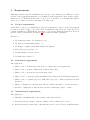
Requirements
This chapter first describes how TOPdesk expected us to work on this project. Then an overview
is given of the requirements that have been identified for the application. Most of these requirements are set by TOPdesk at the start of our project. Some have been identified throughout
the project because we had more information at that point.
2.1
Project requirements
At the start of our project TOPdesk set out a few requirements on the tools and development
process we would be going to use. All of these requirements came forth out of that the development department of TOPdesk also uses these to develop the TOPdesk application. Below is
the list of these requirements. In chapter 3 these items are further explained.
We have to:
• Use Scrum as software development process.
• Use Jira as a Scrum management tool.
• Use Eclipse, configured with TOPdesk specific plugins.
• Create the project in Java code.
• Use Mercurial for version control.
• Use Maven as a build tool.
2.2
Functional requirements
The application:
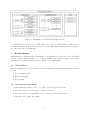
1. Must be able to present usage data needed to answer the research questions.
2. Must be able to present configuration details as usage data.
3. Must be able to present user actions as usage data.
4. Must be able to obtain previously unavailable usage data from the TOPdesk application.
5. Must be able be expanded upon by TOPdesk developers to answer additional research
questions.
6. Must be configurable so that its users can select which customers to get the data from.
7. Should be configurable so that its users can select which usage data to obtain.
2.3
Nonfunctional requirements
The application:
8. Must have a minimum risk to the security of the SaaS network.
9. Should present the results so that the validity of those results can be tested.
10. Should present the result data so that this data can’t be traced back to individual users.
3
11. Must be able to process large amounts of data.
12. Should contain decoupled processes to grant flexibility in how to use the software and
reduce complexity of the software.
4
3
Project approach
In this chapter the approach to realizing this project is discussed. First we will discuss our
strategy, then we will show the tools we used and the planning.
3.1
Scrum
We worked on our project in a development team of TOPdesk. Because of this we could
communicate directly with the developers which helped with understanding the TOPdesk code
and made it easier to discuss problems we would encounter. The development teams of TOPdesk
use a software development method called Scrum[1]. Scrum is a way of developing software by
creating small tasks that can be completed within the time frame of one sprint. A sprint is one
cycle of development in which first is decided what needs to be done this cycle, then the tasks
are executed and afterward all new and working implementations are deployed and presented.
An important aspect of scrum is that tasks are defined in an incremental fashion, so that each
task will build upon previously executed tasks. To monitor and maintain the development
process and tasks JIRA Agile is used[2].
Because we were part of the development team, we also used Scrum for our development
process. We have chosen for sprints of two weeks so that we can review our progress on time
and intervene if things go wrong. We started with a sprint 0 in which we orientated on the
design of the project and filled the backlog for the first sprint. A typical sprint started with
filling the back log with tasks. These tasks could also be tasks that could be executed in later
sprints, or tasks that are applicable throughout the entire project. Then the product owner
would decide which tasks have the highest priority and would plan the tasks for this sprint
together with us. The product owner represents TOPdesk as a client and decides what that
client wants to get out of the application and thus has the last say in deciding the priorities of
tasks. The remaining tasks would remain in the back log. Each task will first be assigned to
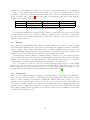
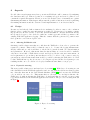
a specific team member of the scrum team. Then the task is then executed and afterward it
is reviewed by the other team members. Figure 2 shows how iterations of the scrum method
work.
Figure 2: Scrum
5
A definition of done is defined at the start of the project in order to evaluate if a task is finished.
We used the following definition of done:
• The implementation of the task should be agreed upon by the entire team.
• The code written for the tasks should have undergone a code review done by someone
outside the team.
• Each implementation should be tested.
• The product owner should be updated with the global implementation choices and details
of the tasks.
• The documentation should be updated.
Every day of each sprint, first thing in the morning there would be a stand-up in which you
would inform the rest of the team about your doings each day. When problems are encountered
we would ask team members to confer in a separate room to discuss this problem. After each
sprint there would be a retrospective to specify what could be improved upon or what went well
in order to improve on the development process. After most sprints we demoed our project to
inform interested employees of TOPdesk about our progress and to gather feedback.
3.2
Tools
This chapter describes the tools we used during our project.
3.2.1
Eclipse
TOPdesk has an installation of Eclipse available to us in which the commonly used plug-ins were
readily configured. Next to this a Workspace Mechanic configuration is used by the development
of TOPdesk so that code is presented in a uniform way. This supports code reviewing from
developers outside of the project.
3.2.2
Mercurial
We used Mercurial for version control because the existing TOPdesk repositories are also
Mercurial repositories. As graphical interface for this we used TortoiseHG[3][4].
3.2.3
Maven
As build tool we used Maven[5]. Maven is a tool used for building and managing any Java-based
project. The benefits of using Maven are that it makes the build process easy and uniform.
TOPdesk also uses Maven which was and extra motivation to choose to use Maven.
3.2.4
Jira
As mentioned in the project strategy and requirements chapters we used JIRA to monitor and
maintain the Scrum process. In this we can create tasks and organize these by epics. Then
these tasks can be become sub-tasks of a specific sprint, so that we can monitor the progression
of the tasks within this sprint.
6
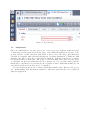
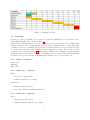
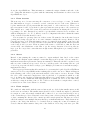
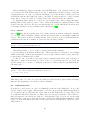
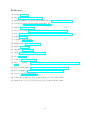
Figure 3: Planning in weeks
3.3
Planning
Because we decided on sprints of two weeks we created the planning based on iterations of two
weeks. This planning can be found in figure 3.
The specifics of the planning are based on epics. Epics are big development goals to which sprint
tasks are assigned. Our original planning was fine until we finished sprint 1. After this sprint
we shifted our focus to analyzing the user actions because much more research questions could
be obtained from the user actions then from the configuration details. The specific research
questions can be found in appendix A. This is why we finished the configuration details analysis
quickly in sprint 2 and started on the epic of analyzing the user actions. The resulting planning
in which we incorporated all the adjustments made during our project is found below:
3.3.1
Week 1 - Sprint 0
Orientation
Planning
Fill backlog
3.3.2
Week 2 & 3 - Sprint 1
Epics:
• Create test environment.
• Analyze databases for settings.
Deliverables:
• Initial orientation report.
• Prototype database analyzing framework.
3.3.3
Week 4 & 5 - Sprint 2
Epics:
• Expand test environment.
• Analyze multiple databases for settings.
7
• Analyze logs for usage data.
Deliverables:
• Expanded version of database analyzing framework.
• Log file analyzer for a single type of event.
• Product demo.
3.3.4
Week 6 & 7 - Sprint 3
Epics:
• Analyze logs for usage data.
• Decouple log analyzer processes.
Deliverables:
• Log file analyzer for a multiple types of events.
3.3.5
Week 8 & 9 - Sprint 4
Epics:
• Adjust TOPdesk code to log additional user actions.
Deliverables:
• Code to send to SIG.
• Method to create the additional logging.
3.3.6
Week 10 & 11
Deliverables:
• Final code to send to SIG.
• Final report.
• Final presentation.
8
4
Database
A number of research questions we got from TOPdesk could be answered by getting the information from the customer databases and analyzing this information. Therefore we needed a
framework for getting this data and presenting the analysis. Because of the requirements set by
TOPdesk it was important that the framework not infringes on the integrity and the privacy
of the customer data. This chapter discusses the design, implementation and testing of this
framework.
4.1
Design
In order for our application to be able to get information from the customer databases, the
application needs to be able to connect to the databases on the SaaS network and retrieve the
results from database queries. The SaaS network has multiple database servers and each of
those servers contains multiple customer databases. This network is a separate network from
the main TOPdesk network on which our program will run. The thing to note is that the
databases of customers are spread over four different database servers, which could possibly
add difficulty in retrieving data from multiple customer databases.
4.1.1
Stored procedures
To deal with the integrity and privacy issues we wanted to limit the freedom of our program
and what the user can do with it. So we looked for a solution in which we give access only to
specific parts of the data. Also the user should not be able to change customer data on the
server. A possible solution was to implement stored procedures on the database servers. A
stored procedure is a group of SQL statements that can be executed on the database server
when the procedure is called[6]. This can be used to restrict user interaction with the database
to predefined queries.
At first we wanted to create a single stored procedure which could be used to execute a
predefined query on a selected set of databases. We created a stored procedure in the master
database and called this procedure multiple times by making separate connections to each
database and executing this stored procedure. The problem with this approach was that the
database-user we used to connect to the database servers had to have ’SELECT’ permission on
every database on which we wanted to execute the procedure, giving the user too much access.
4.1.2
Alternative solutions
We tried a couple of alternatives to this approach like signing the stored procedure by a certified
database-user with ’SELECT’ permission or creating the stored procedure on each database and
adding a database-user to these databases. Signing the procedure did not work correctly because
the database-user without the ’SELECT’ permission was still not able to use the stored procedure on a database because the ’SELECT’ permission was still needed to access the database.
Creating a stored procedure and user for each database would not scale well for maintenance
on the production servers. Creating multiple stored procedures would create an even bigger
maintenance issue.
As a working alternative we created a separate database which will be filled with the setting
data and user count of each other relevant database. This is done using a stored procedure
which is executed periodically. The execution and creation is done with ’sysadmin’ permissions
so this procedure cannot be called by the user we used to connect to the database servers. A
second stored procedure is created which gets all the data from this separate database. The
9
database-user has permission to execute this stored procedure and this procedure is called on
from within our program.
The benefit of this alternative is that the database-user does not have to get additional
permissions each time another database is added to the server. The downside is that the data
retrieved won’t be the most recent data as well as that this method uses up additional storage
space. Also, to get access to additional tables a change to the stored procedure would be
required and this would result in additional copying and storage.
4.1.3
Chosen solution
After consideration about the scalability of the separate database solution we came back to the
solution of creating a user for each relevant database on the server. Added to this we gave these
users only SELECT permission on specific columns of specific tables. This will in effect give the
user the possibility to select the same data as would be available using the previous solution,
but without the overhead of extra and duplicate data storage.
We created a stored procedure which will be run periodically and which will create the users
and the permissions. This procedure will check which databases on the server are databases of
TOPdesk applications. Then it will drop a previous user created with our stored procedure.
Afterward it will create a user on each database so that we can inherit the permissions from these
users. These users get column permissions granted based on the information we are interested in
at that moment and without columns which could contain private information.Another upside
to this solution is that we now can freely design and change our SQL queries instead of being
tied by the predetermined SQL statements in a stored procedure.
4.2
Implementation
To interact with the database servers and execute the SQL queries we decided to make use of
the Java DataBase Connectivity (JDBC) library[7]. JDBC works with creating a connection to
a database server and executing an SQL query on that server. Then we can return a result set
containing the results of the SQL query, and thus giving us access to the desired information
within our program.
Because we want to choose on which databases we execute the query we created a
DatabaseQuery object which contains the query and the selected databases. The database
handler then checks which database belongs to which database server, so the queries are executed
on the correct server. The information we were interested in was located in the ’Settings’ table
and the result set could contain two types of results. The first is a system wide setting, which
is a unique entry in the database. Querying this setting would result in one result for each
database the query was executed on. The next type is a user setting, which has an entry in the
database for each user that has changed that specific setting. Querying this setting would result
in multiple results for each database the query was executed on. For each type we now can
group the data respectively by customer and by user of each customer. The results of querying
a user setting can seen in table 1.
Setting name
Customer1
Customer2
# setting turned on
10
7
# setting turned off
5
9
Table 1: Result of querying a user setting
With these results came the problem that we now know how many users have or don’t have
a user setting turned on, but we do not know the number of users that have not adjusted this
10
setting. To get this number we added a second query to the DatabaseQuery object which can
be used to count entries from a specific table. In the case of the user setting we want to know
the number of users in the customer database. This can be found by counting the users located
in the ’gebruiker’ table. Table 2 shows the result of querying the same user setting with the
addition of the number of users.
Setting name
Customer1
Customer2
# setting turned on
10
7
# setting turned off
5
9
# default/undefined
51
49
Table 2: Result of query with total number of users
For TOPdesk at this stage it was more important to get the data then to have the program
generate visual feedback, so we decided to print the results directly to a CSV file. To give more
freedom to the receiver of the information we printed the result set of the query as well as the
analysis of this result set.
4.3
Testing
Before we started implementing the database analyzer framework we had to set up a testing
environment that simulates the SaaS network from which the application should obtain the
data to analyze. This testing environment had to consist of multiple database servers each
containing multiple databases that are representative of a TOPdesk application database and
should be located on a different network then the main TOPdesk network.
We implemented this by using two existing database servers located on a separate network
used for testing the SaaS deployment and created multiple databases on these servers. We then
simulated every interaction our application had to have with the SaaS network by connecting
to this testing environment and executing the functionality of our application.
For code testing we decided to test only the methods that did not depend on the JDBC
library, as we did not want to test the library itself. As almost all methods depend on the
library this part of the program was not prone to testing. This resulted in testing our own
grouping function and custom result writing function using unit tests[8].
4.3.1
Evaluation
There are a few things to remark regarding our implementation of the framework. Firstly we
expect the user of the program to be knowledgeable about SQL queries and databases, which
is in accordance with the expectations of TOPdesk. This is important because we do not
limit the user in how the query can be set up. If a query is set up badly ould result in a
noticeable performance impact. Secondly we specifically define which columns and tables the
user has access to. This can be changed according to the future needs of TOPdesk, although
this requires a change in the program code as well as a change in the permissions of the users
created on the database servers.
11
5
Log parsing
The previous chapter explains how we can obtain static information from the database. Now we
are interested in obtaining dynamic information from the users. We want to be able to gather
information on when a user does a specific action within the TOPdesk application. We decided
to use the log files generated by the TOPdesk application for this, because these were already
available to us and contain large amounts of usage information. In this chapter we will describe
how we got the information out of these log files and the issues we encountered. Because of the
issues we encountered and how we incorporated Scrum the design and implementation of each
issue is explained in each specific section.
5.1
Logstash
To analyze the log files from TOPdesk we wanted to use an existing program or library. This
would help us in focusing on the analysis of the data from the log files instead of focusing on
getting the data ourselves. We first tried logstash to see if it could help us with analyzing the
log files[9]. Logstash is a program that can monitor log files for changes. Whenever a change
occurs in a log file a new log entry is added to the log file which should then be parsed for later
analysis. Log stash then can be used to store the information gotten from parsing the log files
by writing the information to a CSV file or store it in an elasticsearch cluster[10]. Elesticsearch
is a real-time search and analytics engine. To visually represent the results of searching and
analyzing the data in the elasticsearch cluster we used Kibana[11]. With this we could correctly
monitor TOPdesk log files and analyze the data that is generated. However, our application’s
main focus was to analyze static log files and not monitor and analyze live data. The resulting
analysis also was not enough to answer most research questions. We therefore still needed to
process the data ourselves and we stopped looking into log management tools like logstash.
Using logstash did give us an idea of how we should go about processing log files and analyzing
the data.
5.2
Parsing log files
In order to get the information we need out of the log files we needed to parse the log lines
from the log files and identify multiple user actions or events from those log lines. We started
with one log file and tried to retrieve all occurrences of an event in which a user opened a tab
within the TOPdesk application, which we called an OpenTabEvent. To do this we identified
the format of a standard log line and used a regular expression to get the parameters of interest
out of this log line. The parameters we were interested in are the timestamp, the username,
the log message and the name of the class that logged the message. We wanted to know the
timestamp in order to answer questions that rely on absolute or relative times/dates. The
username is important because we want to be able to group answers to the research questions
by users. This username was then transformed to it’s hash-code representative so this data can
not be traced back to that specific user. The log message and name of the class that logged the
message are used to identify specific types of events.
Now we have the parameters of every log line from the log file available to us within our
program that matches this global pattern. We can use these parameters to check if the log line
represents an OpenTabEvent. This is done by checking if the class that logged the message is the
same class that handles opening tabs and then using a regular expression to see if the log message
contains a specific identifier unique to the OpenTabEvent. This identifier was determined by
researching the log files from the TOPdesk application and the code for the before-mentioned
class. Using the result of the previous regular expression we obtained additional information
12
about the OpenTabEvent. This information contains the unique identifier and title of the
tab. Using this information together with the timestamp and username we then created an
OpenTabEvent object.
5.2.1
Event factories
The next step we took was retrieving all occurrences of a second type of event. To handle
the differentiation of types of events we created event factories for each event. Whenever a
log line matches the global pattern this line was passed to each event factory. These event
factories returned event objects if the log line represents an event specific to the event factory.
This enabled us to easily add events and event factories without modifying the logic in the
log parsing code. Also this made it possible to specify which event factories you want to use
without changing the code. To do this we created a configuration file that contains the names
of the event factories that should be used.
Now we wanted to get usage data out of these events. We wanted to know the time between
opening and closing a specific tab so we can for instance analyze the average duration of how
long tabs are kept open. This information can not be extracted from a single event but could
from multiple events. So we created another event called the ClosedTabEvent, which represents
a tab being closed by a user. Then we printed all events to a CSV file so that the user can
execute their own calculations on the data to get the average duration of how long tabs are
kept open. For our product owner this was enough at first, although more processing would be
preferable.
5.2.2
States
Instead of just printing the events we wanted to output analyzed data based on the events.
Because some analysis require multiple events that happen in a specific order we wanted to
implement states that represent the current user situation. This state should be updated every
time an event of this user is processed. Now we could keep track of how many tabs are open
or how long a specific tab has been kept open. Multiple problems were found when trying to
implement the states.
The biggest problem was that all events had to be present in the log file. If a ClosedTabEvent
was not preceded by a OpenTabEvent the resulting state would be incorrect. This would happen
if the starting point of the log file was in the middle of the session of a user. Because of this
the order of the events and completeness of the log file had to be guaranteed which we could
not do at this point. Another problem was that whenever a corrupt change of the state would
occur, due to an error within the TOPdesk application or within our own code, the entire state
would stay corrupt from that point on. We could not check whether corruption has occurred,
so states were not the best solution for our issue.
5.2.3
Event analyzer
We considered what failed with the states solution and we decided that smaller states would
work better as a solution. The smaller states should be able to handle incomplete log files and
if corruption occurs only a single result should be affected. So we created another layer on top
of the events that processes events and creates data points. A data point is the smallest point
of data, containing the data needed to answer specific research questions. The layer we created,
called the analyzer, uses multiple listeners that keep a small internal state. These listeners are
specific to the data point that is to be obtained from processing the events. For instance we
created a listener that returns a data point of the duration of how long a tab was open. The
13
listener first waits until an OpenTabEvent comes along and saves the tab it represents in its
internal state. When a CloseTabEvent is processed which represents the same tab as a tab saved
in its internal state the data point is created and returned to the analyzer. We implemented
the listeners in a similar fashion as the event factories so we could easily turn listeners on or
off using the configuration file. We then printed the resulting data points to a CSV file. Our
product owner now agreed with us that this CSV output was preferred over the previous output,
in that it presents better processed and more usable data tot the user.
5.2.4
Modularization
Now all of the processes are dependent on the other processes and could only be used together.
We wanted to be able to use parts of our program to for instance let TOPdesk generate events
and send these events directly to our program for analyzing. In this case we want to skip the
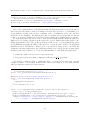
parsing of log files and log lines. To achieve this we decided to divide the program into the
following processes:
• File parser - This has log files as input and log lines as output.
• Log line parser - This has log lines as input and events as output.
• Event parser - This has events as input and data points as output.
• Data Point Store - This stores the data points and prints them to CSV.
Figure 4: Process modules
To realize the independence of each process we wanted to let each process run on its own
thread. Now we wanted a way to pass each process’ output to the next process without knowing
anything about the state of that next process, as can be seen in figure 4. This could be used to
decouple the processes in order to reduce the complexity of our program and to be able to run
each process as a stand-alone process. We made this possible by the use of messaging queues.
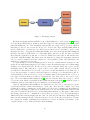
5.2.5
Messaging Queues
Message queues provide an asynchronous communication protocol. This means that you can
send and receive messages without knowing who is on the other side of the message queue. The
sender transmits a message to a queue and there it stays until it is read by the receiver. This
process is shown in figure 5. This solution is ideal for our case because we want processes to
be able to transmit their output to the next process without having to wait for that process to
finish. Also each process would be able to run as a stand-alone process by using these message
queues because it does not matter which program or process fills up the message queue the
process uses as input. As can be seen in figure 5 multiple receivers would be able to read
messages from the queue, which would give us the possibility to run multiple instances of the
same process parallel with the same queue as input.
14
Figure 5: Messaging system
From the messaging systems available we chose RabbitMQ for a couple of reasons[12]. Firstly
we looked if the third party programs we used have support for the messaging system. We found
that RabbitMQ was one of the messaging systems that were supported by logstash, which at
that time we tried to incorporate in our project. Logback also supports RabbitMQ which is
used by TOPdesk to generate the logs. Both logstash and Logback could thus be used to send
messages directly to our application using RabbitMQ. A second reason was that RabbitMQ was
already being used by TOPdesk so we could easily ask for aid if we would encounter problems.
Deploying the application would also be easier for TOPdesk because they would already have
experience with RabbitMQ. The last reason was that incorporating the messaging system in
our code would be intuitive and easy compared to other systems, because other systems needed
much more configuration before use.
To send messages over the messaging queues we needed to transform these messages to byte
arrays. For normal Strings this is not a problem, because Java includes support for transforming
Strings to byte arrays and back. We also needed to send event and data point objects over the
messaging queues. Encoding these objects could be done easily enough. However, then the
problem arose that when we decoded the objects we lost the information about what type of
object was represented, because we used sub-classes for each type of event and data point. To
deal with this problem we needed to create a serializer that would transform the object to a
byte array, as well as make it possible to transform the byte array back to the correct object
type. We created this serializer using Gson[13]. Gson is a library that can be used to convert
objects into their JSON representation and transform them back again[14]. JSON is a way of
formatting data in a way that is easy for humans to understand and edit.
After we implemented RabbitMQ in our application we were able to run each process independently and have them send messages to each other. We tested the complete cycle from
reading the log files to writing the csv file with 63 log files each containing about 250.000 log
lines. After about thirty log files the program started to slow down significantly. This problem
was caused by that the file parser process was much faster than the log line parser. This caused
the message queue used to communicate between these processes to be flooded with messages.
This in turn caused the messaging system to run out of the allocated memory. RabbitMQ solves
this by storing messages shortly on the file system to not exceed the allocated memory. Because
the computer is rapidly exchanging data in memory for data on disk the performance of the
computer starts to drop. This problem is called thrashing.
15
5.2.6
Multiple log line parsers
To deal with the problem of thrashing we wanted to make the log line parser work more efficiently. This was done by filtering out the log lines that did not meet some criteria so that these
would not be parsed in each event factory. The log lines we wanted to filter out are the ones
that are created by the system. So one of the criteria was that the log line should not have an
empty user name, which would only be the case when a log line is created by the system. This
optimization helped, although it was not enough to stop the thrashing from occurring.
Our next solution was to have multiple log line parsers that all use the same message queue
as input. This ensures that the log file parser does not flood the queue as the log line parsers
together can keep up with the log file parser. Figure 6 shows the flow of the resulting processes.
This solved the problem of thrashing, although this introduced the problem of that the events
were not received in the correct order by the event parser. When we started exploring the
solutions for this new problem we decided together with the product owner that focusing on
other tasks had a higher priority than improving the performance.
Figure 6: Multiple log line parsers
We decided then that we would implement the processes in a sequential way and thus only
running one instance of each parser. However we created the program in such a way that it is
possible to run parallel executions of the application for each customer or set of log files. To deal
with the problem of trashing we changed the configuration of RabbitMQ to make sure it does
not write to disk when exceeding the allocated memory. RabbitMQ enforces this by making it
impossible for the senders to transmit a message to a queue and then putting the process of
those senders on hold until memory space is freed up.
5.3
Answering research questions
As stated in the chapter 1, our application would be a prototype to answer research questions
of TOPdesk. This means that our application is not yet able to answer all of the questions that
were given to us by TOPdesk. These answers were given to us to specify points of interest and
not as requirements we had to fulfill. An overview of these questions can be found in appendix
A together with which of these questions we were able to answer using our test log files.
To expand upon our application, we created a manual for TOPdesk explaining how code
could be added to answer more research questions. A global outline of the steps to take will
now be explained.
First should be identified which log lines are generated when a relevant user action is taken.
This is done by recreating the user action in the test TOPdesk application and checking how
this updates the log file. Now an event factory can be created that uses a regular expression to
obtain the identified log line. An event should be created that could be used by the event factory
to store the relevant details of the log line. This event should at least contain the timestamp
16
and the user name contained in the log line. Next a listener is needed to specify the logic of
when a single event or a set of events will result in a data point. This data point should then
be created containing the relevant details needed to answer the research question.
An implementation of the previous steps to, for instance research which search queries are
executed, could be:
• An event of containing the timestamp, user name and search query, called
SearchQueryEvent.
• An event factory containing a regular expression used to identify if a log line represents a
SearchQueryEvent.
• A data point containing the search query and the user that executed it.
• A listener that creates the data point from a SearchQueryEvent only if the search query
is not empty.
5.4
5.4.1
Testing
Unit tests
As testing framework we made use of JUnit[8]. For each class we defined unit tests to make sure
the individual functions work correctly, except for some classes that were generated with use of
the Lombok library. Lombok is a library that makes it easy to implement standard code blocks
using simple annotations[15]. The use of Lombok resulted in that some functions were added
that we not covered in our test classes, as these functions are already tested by the Lombok
developers.
We had trouble testing the classes that used the messaging system to receive input and
transmit output. This is because we could not properly mock or stub the inner workings of the
connection to the messaging system. This is partly of how we implemented these classes and in
this could definitely be improved upon. However we split up the responsibilities in those classes
and extracted their internal methods into other classes in order to test those methods using unit
test. In other classes we used stubbing to stand in for some other programming functionality
that were necessary for the execution of methods.
5.4.2
Field tests
A large part of testing our application comes from using field tests. As a source for testing the
validity of the produced results we used a log file we generated from using our test TOPdesk
application. Because we generated this log file by triggering specific events we could easily
compare the results of our application to what we know really occurred and thus ensuring the
validity of the results.
To test how our program works when handling large sets of data, we used the log files that
were generated over one week by the TOPdesk application used by the support department
of TOPdesk itself. This gave us a testing set of logs comparable to the actual data that our
program should process. These log files were used throughout the development process to test
the overall performance and scalability of our application.
17
5.5
Evaluation
A benefit of how we set up the application is that adding functionality to answer research
questions has been made rather easy, as can be seen in the previous section. Running multiple
instances of the entire process cycle is well handled by our application which means it scales well
with processing log files of more customers. We tested this by creating multiple customers and
for each of those customer we processed the 63 log files mentioned in section 5.2.5. The results
of these tests can be found in table 3 in which we compare the application with and without
the use of threads that were introduced in section 5.2.4. We can see that for each customer
added the entire process slows down by a few second per log file per customer until the cpu
starts reaching it’s maximum capacity, as opposed to the seven seconds of when we did not use
threads.
Amount of customers
1
2
10
Pre-modularization
63 x 7 = 441 seconds
63 x 7 x 2 = 882 seconds
63 x 7 x 10 = 4410 seconds
Post-modularization
63 x 7 = 441 seconds
63 x 8 = 504 seconds
63 x 45 = 2835 seconds
Table 3: Scaling test
Some points can be identified that we would like to improve upon. Firstly it would be
helpful for the user of the application that the results processed as much as possible before being
presented. This could be managed by using the data points we end up with and analyzing these
to give give a precise answer to a research question. Because of each research question being
very different, this would mean creating such an analyzer for each type of data point. A general
analyzer could be created for grouping the data by user or customer and then executing basic
operations like counting the amount of data points per group. Because TOPdesk was satisfied
with just receiving the data points in a CSV file, it was not required of us to produce these
kind of results, so we did not focus on implementing this during our project. Next to this the
graphical user interface could be improved to make it easier to configure the application whilst
also limiting the freedom of the user. This limiting would be beneficial in making the program
more reliable and consistent.
During this stage of the project we encountered the problem that we could not answer every
research questions using the existing log files of querying the database. How we resolved this
problem will be discussed in chapter 6.
18
6
Aspects
Not all of the research questions we have gotten from TOPdesk could be answered by analyzing
the databases and logs. This is because not everything is logged and some log lines do not
contain the required information. Therefore we needed another source of information to gather
this missing information. This chapter will present the possible solutions we found for gathering
the missing information and the decision for and implementation of our chosen solution.
6.1
Design
Because we had already built a framework for analyzing log files we came to the conclusion
that in order to gather the extra information we wanted to generate more log entries, containing specifics about user actions or user and system information. Because TOPdesk already
incorporated a logger tool we decided to make use of this logger and add the log entries to the
existing TOPdesk application logging. This also ensures that the generated log entries enter
the logs in the correct chronological order.
6.1.1
Altering TOPdesk code
Our first possible solution was that we could alter the TOPdesk code in order to generate the
required log entries. This would be relatively easy to do, because the logging infrastructure
already exists and we only would have to invoke the log methods with our own information
and parameters. However, this means that the functionality we created would be available
only after a new build of TOPdesk is created and deployed in the customer environment. A
new requirement we got at this point was that we need to be able to add or remove extra log
generation in a shorter time frame than would be possible by altering the TOPdesk code. Next
to this, TOPdesk has a policy about new code being incorporated in the development process,
resulting in that our code could not be deployed within the time limit of our project.
6.1.2
Bytecode weaving
The next possible solution we found was bytecode weaving[16]. With bytecode weaving we can
take class files from the TOPdesk application and our own class files and weave them together
into class files that run in the Java Virtual Machine (JVM)[17] and executes the TOPdesk
code as well as our own code. This means that we can write code and inject this into the
TOPdesk code without altering the TOPdesk code itself and that we can add or remove extra
log generation whenever the TOPdesk application is restarted. The process of weaving is shown
in figure 7.
Figure 7: Bytecode weaving
19
This weaving had to happen somewhere after the TOPdesk code is compiled and before the
code is run by the JVM. That is why we needed to implement load-time weaving. Load-time
weaving will weave our own code with the TOPdesk code at the moment a class loader loads
a TOPdesk class file and defines the class to the JVM. To support this a so called ”weaving
agent” has to be used to enable a ”weaving class loader” that can weave the class files.
To implement this solution we created our own weaving agent. After testing and implementing this weaving agent we came to the conclusion that using an existing library for this
would better suit our needs. We chose the library AspectJ, because this library is widely used
for weaving, and had better performance then other libraries[18].
6.1.3
AspectJ
AspectJ[19] supports the weaving agent for load-time weaving as well as creating the class files
to be weaved. These class files contain pointcuts and advices that are encapsulated within an
’aspect’. The weaver works by checking whether some execution of the program matches the
pointcut in some way. For example we can create the following pointcut:
@Pointcut ( " ( execution ( void somepackage . SomeClass . SomeMethod () ) ) " )
public void pointcutMethod () {};
This will search the code for a call to a method that has the signature
”void somepackage.SomeClass.SomeMethod()”. This represents a void method of SomeClass
within somepackage without any parameters. Now we have what is called a join point at the
locations that ’SomeMethod()’ is called.
To run our own code at those join points we have to implement the advice part of the aspect.
This advice consists of the moment our own code is to be executed in respect to the join point
and the actual code to execute. So using the pointcut we declared earlier we can implement the
following advice:
@Before ( " pointcutMethod () " )
public void adviceMethod ( JoinPoint point ) {
// Own code here .
}
This will execute our own code before the method specified in the pointcut starts executing,
just after the arguments to the method call are evaluated.
6.2
Implementation
Now that we could execute our own code within the execution of the TOPdesk code we could
add the desired extra logging. When trying to use the logger from the TOPdesk application
we encountered the problem that the logger class from the TOPdesk code was being loaded
by a different class loader than the one that loads our own aspect class files. The solution to
this problem was to use reflection so that we could build the logger object in our own program
using the name of the logger class and the name of the method that returns an instance of this
logger. To deal with this we used the context class loader from TOPdesk to build the logger
using reflection.
20
Below is an excerpt of our code that uses the context class loader as well as reflection:
...
Class <? > factory = Class . forName ( " org . slf4j . LoggerFactory " , true ,
Thread . currentThread () . g e t C o n t e x t C l a s s L o a d e r () ) ;
Method method = factory . getMethod ( " getLogger " , String . class ) ;
Object log = method . invoke ( null , " E xt ra As pe ct Lo gg in g " ) ;
...
One of the requirements set by TOPdesk is that the implementation of aspects should not
have any noticeable impact on the performance and customer experience. So if anything goes
wrong with the weaving of the aspects or running of the code within the advice, the customer
should not notice anything. We implemented this by catching all exceptions that are thrown
by the code execution within advices and then doing nothing after catching these exceptions.
To start using these aspects we need to start weaving them with the TOPdesk class files.
This is done by creating a jar file from the aspects we created. This jar file is then added to the
TOPdesk jar library folder. The jar files from AspectJ also need to be put in this library folder
and an XML file specifying the names of the aspects to be used should be added to the TOPdesk
installation folder. In addition to this we need to specify the weaving agent to the JVM. By
adding the following arguments to the JVM run parameters we can specify the weaving agent
and the specific aspect that are to be used by this installation of the TOPdesk application.
• -javaagent:<path to library folder>/aspectweaver.jar
• -Dorg.aspectj.weaver.loadtime.configuration=file:aspects for logging.xml
An example of what we then do within the advice of an aspect is found below. In this
example we want to log the height and the width of the browser window of every TOPdesk user
whenever this user resizes the browser window:
@Pointcut ( " ( execution (* topdeskpackage . topdeskclass .
s e t C l i e n t A r e a D i m e n s i o n s (..) ) ) " )
public void p o i n t c u t S e t C l i e n t A r e a D i m e n s i o n s () {}
@Before ( " p o i n t c u t S e t C l i e n t A r e a D i m e n s i o n s () " )
public void beforeMethod ( JoinPoint point ) {
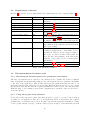
try {
logDimensions ( point ) ;
}
catch ( Exception e ) {};
}
public void logDimensions ( JoinPoint point ) throws Exception {
Object obj = point . getArgs () [0];
Method heightMethod = obj . getClass () . getMethod ( " getHeight " , null ) ;
Method widthMethod = obj . getClass () . getMethod ( " getWidth " , null ) ;
logInfo ( " Dimensions of the window : Height = " + heightMethod . invoke ( obj
) + " ; Width = " + widthMethod . invoke ( obj ) ) ;
}
21
6.3
Testing
For testing the correctness of our aspects we decided on four elements that are important. This
also includes the responsibility of the developer as mentioned in the evaluation.
• Are the pointcuts matching only the intended method(s)?
• Does the advice reference the right pointcut?
• Does the advice do what we expect?
• An incorrect/faulty aspect should not have a noticeable impact on the running application.
To test if a pointcut is matching only the intended method(s) we used field testing. By
defining the pointcut as precise as possible we can make sure the pointcut only triggers from
within some specific class. Now we tested the correctness of the pointcut by invoking all the
methods within this class and checking to see if the aspect responds correctly. It was important
that the pointcut definition was not set to target too many methods. This would result in
invoking the advice too many times and could also lead to unwanted recursion that could
severely hinder the performance. Correctly referencing the pointcut from the advice is the
responsibility of the developer of the advice because this depends on which pointcut should
trigger the advice.
Testing the code within advices is hard to do in our case, because in most advices we use
reflection to get the information we need from the TOPdesk code. This is because reflection
depends on fully qualified class names and method signatures. To test the advice methods
we would have to mock almost every method call inside the advice method, which would only
test the mocked interactions and not the actual advice method. Advices should be kept as
small as possible to not influence the performance too much. Also nothing from the TOPdesk
code should be altered from within an advice. If an advice turns to be incorrect or faulty the
developer has to make sure nothing noticeable happens to the TOPdesk execution. We covered
this with catching the exceptions and doing nothing with them. The developer of an aspect
should use the same approach when creating a new advice.
6.4
Evaluation
Because all definitions within aspects are string based and point to pre-existing methods, classes
and packages, the developer of the aspects is responsible for implementing the aspect correctly.
This includes the definition of the pointcut, catching of exception and triggering the correct
advice at the correct pointcut.
It is worth mentioning that using aspects could be used to change the internal state of an
application. This could result in incorrect and unwanted behavior. Therefore the implementation of aspects should undergo the normal development process to include testing conform
the TOPdesk standards. We would still advise to use aspects for additional logging or even
integrate aspects to be responsible for parts of the logging done by the TOPdesk application.
This because using aspects could be used to remove the code needed for logging out of the
classes and thus making those classes more maintainable. It also would make it possible to for
instance log every method call with only one aspect containing one pointcut and one advice.
Using load-time weaving also makes it possible to add or remove specific log line generation
whenever a TOPdesk application is restarted. Lastly aspects could be used to specify for each
separate TOPdesk installation what is to be logged.
It should be made clear that using the aspects, created by us or those that are created in
the future, is not part of the application. It is a separate way of generating extra log entries
22
in log files which then could be used by the application to process and analyze. Using the
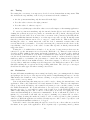
logs generated with aspects we now answered research questions we were previously unable
to answer. For example, we answered the research question ”What browser window sizes are
used?” using the logs in our test environment that now include log entries generated by the
aspects.
23
7
Software Improvement Group feedback
In this chapter we will summarize the feedback we have received from the Software Improvement
Group. The full versions, written in Dutch, can be found in appendix D.
7.1
First feedback
The first point of feedback is that we scored low with the Componant Balance of our project.
This is caused by that we did not divide our code into different projects. Not having our
code divided into different projects was not a big problem at this stage, although it would
become increasingly useful to add more structure when the code volume would start to grow.
Specifically the Graphical User Interface should be separated from the rest of the application
to clarify the responsibilities. Remarks about the code itself were made about Unit Interfacing.
It was stated that we used an above average amount of parameters which means our program
lacks abstraction. It also usually leads to more complex methods and confusing method calls.
Above remarks considered we received four out of five stars on the maintainability model, which
indicated an above average maintainability of the code.
7.2
Improvements
To improve our project using the feedback we received we changed a couple of things. We
divided our program into multiple projects and used Maven to build these projects as well as
specify the relation of these projects. We separated based on core components of our application,
so we resulted in having a parent project for the maven build and a project for the graphical
user interface, configuration, database handling and log parsing. To improve upon the Unit
Interfacing we introduced a new value class containing the parameters that were used together
as method parameters. This resulted in having a lot of methods that now use only one parameter
instead of four, which improved the human readability and made calling those methods clearer.
7.3
Final feedback
The final feedback we received states that the improvements we made resulted in higher scores
for the Component Balance as well as the Unit Interfacing. We also received positive remarks
about using Maven as a build tool as well as including 1000 lines of test code. The result of
the improvements was that we still achieved on overall score of four out of five stars, although
these four stars now point much more towards a five star rating.
24
8
Conclusion
In this chapter we will give our conclusive remarks about what we learned from this project,
how we fulfilled the requirements and what our recommendations are for future work on this
application. It can be stated that we finished our project in a successful way, both in meeting
with the requirements set by TOPdesk as well as creating a working prototype application that
is set up in a way that TOPdesk can easily add additional functionality and answer more and
more research questions.
8.1
Reflection
This project has been a big learning experience for the both of us. During this project one
of the things we learned most from were the code-reviews we received. This gave us a deeper
understanding of creating more readable and maintainable Java code. Added to this we read
Effective Java and Java, Concurrency in practice[20][21]. These books helped us with making
effective use of the Java programming language and it’s existing fundamental libraries.
Working in a development team has given us a better insight in how software is being
developed by companies and how this differs from developing software alone or at the university.
This also showed us the importance of having good communication between different teams and
departments. This showed itself in that we asked the Operations department for help during the
implementation of stored procedures. Because the development team uses the Scrum method to
support the development process we learned that this method works really well, although for
us it had it’s flaws, as we were working on new software. This did not work efficiently because
it is hard to create a small task of a problem that is very abstract at first. Also with a team
of only two members some team member qualities are missing that would otherwise likely be
present with more people involved. Perhaps with the experience we have now we could have
used the Scrum method a lot better to support our project.
During the project we have received a lot of positive responses towards our application.
This showed that the company is interested in incorporating our prototype and gave use the
impression that we were contributing to the company.
25
8.2
Requirement evaluation
In table 4 we describe how we implemented the requirements as can be found in chapter 2.
Requirements
1. (Answer questions)
Implemented
Yes
2.
3.
4.
5.
6.
Yes
Yes
Yes
Yes
Yes
(Configuration details)
(User actions)
(Unavailable data)
(Expandability)
(Select customers)
7. (Select usage data)
Yes
8. (Security risk)
Yes
9. (Result validity)
Yes
10. (Untraceable results)
Yes/no
11. (Large data)
12. (Decoupling)
Yes
Yes
Remarks
This was the global implementation of the application.
See chapter 4.
See chapter 5.
See chapter 6.
See section 5.3.
We used a configuration file as described in section 5.2.1 for this.
This was added to the configuration file as described in section 5.2.3.
See section 4.1. Log parsing and aspects have
no impact on the security of the SaaS network.
We used test environments to be able to verify
the results from the database queries as well as
the log processing.
The user names found in the results of log processing are transformed to their hashcode representation. However if you compare results to
the source log files you still could identify the
user. We also can’t guarantee if an entry in the
database or a log line does not contain private
information.
See section 5.5
See sections 5.2.4 and 5.2.5
Table 4: Requirement evaluation
8.3
8.3.1
Recommendations for future work
Executing the database queries in a production environment
The way our application now connects to the database is not optimal. We would recommend
that our application is granted full reading access to the database servers to grant more flexibility
to the user of the application. This in turn will create the requirement that the user of our
application should be knowledgeable about querying TOPdesk databases in order to not corrupt
the customer data and also have the required permissions to have access to the customer data.
With the help of pre-formatted queries and configuration it can made easier for the user to
create the queries.
8.3.2
Using the log files from customers
To use the actual customer log files, these files should be copied to a secure location, that is
accessible by our application. The user of our application therefore should have the required
permissions to access this secure location. Because of how we the application handles processing
of the log files, having a storage of all the desired logs is enough to start answering research
26
questions. Because it is important that log lines are processed in the correct order, these files
also need to be in the correct order. We recommend that these log files would be saved using
hourly rotations using the hour and date in the file name to make referencing the correct files
easier. As another solution the application could be adjusted to be able to order random log
files, possibly using the timestamp of the first log line.
8.3.3
Usability
The graphical user interface could greatly be improved upon, as we did not prioritize this part
of the application. The user interface should contain an easy way to configure the application as
well as limit the user in how the application can be configured. For example a list of all possible
listeners could be created from which the user can choose one or more listeners, and would not
be able to add incorrect ones. A big improvement in usability can be gained by changing how
the customer log files are selected. This now takes a long time if multiple customers are added.
Ideally only the customer names and the time span should be selected and the application
should then do the rest.
8.3.4
Result processing
As we mentioned in section 5.5 it would be helpful for the user to receive results that are
processed as much as possible. Ideally the results directly give answer to the research questions,
without the user needing to process the data points. This might be possible using existing third
party software, or by expanding the application to incorporate this.
It could be possible that research questions require data from both the database as well as
the logs. Because of this there should be a way of combining the results from both parts of the
application. As an alternative to this, aspects could be created that log the required data from
the database.
8.3.5
Application expansion
Because the program was intended to be expanded upon, based on questions that TOPdesk is
interested in, a lot of future work will be to implement these expansions. We created a manual
that describes all the steps that need to be taken in order to have the application answer these
specific questions. This manual is specific to the TOPdesk infrastructure and documents some
inner workings of the TOPdesk code. Because of this the manual is left out of the report.
This manual also contains the description of the stored procedure to create users with column
permissions on the database servers. Finally this manual describes how to implement and use
aspects to generate extra logging.
27
References
[1] Scrum. scrum.org.
[2] Jira. atlassian.com/software/jira.
[3] Bryan O’Sullivan. Mercurial: The definitive guide. hgbook.red-bean.com/read.
[4] Tortoise hg. http://tortoisehg.bitbucket.org.
[5] Maven. maven.apache.org.
[6] Stored procedures. technet.microsoft.com/en-us/library/aa174792.
[7] Jdbc. oracle.com/technetwork/java/javase/tech/index-jsp-136101.html.
[8] Junit. junit.org.
[9] Logstash. logstash.net.
[10] Elasticsearch. elasticsearch.org.
[11] Kibana. kibana.org.
[12] Rabbitmq. rabbitmq.com.
[13] Gson. code.google.com/p/google-gson/.
[14] Json. json.org.
[15] Lombok. projectlombok.org.
[16] Bytecode weaving.
html.
eclipse.org/aspectj/doc/next/devguide/bytecode-concepts.
[17] Java virtual machine. docs.oracle.com/javase/specs/jvms/se7/html/.
[18] Aop benchmark. docs.codehaus.org/display/AW/AOP+Benchmark.
[19] Aspectj. eclipse.org/aspectj.
[20] Joshua Bloch. Effective Java. Addison Wesley, second edition, 2008.
[21] Brian Goetz. Java, Concurrency in practive. Addison Wesley, 2006.
28
A
Research questions
This section describes which research questions were provided to us as examples of what our
application should be able to answer.
A.1
Research questions that can be answered querying the database
• What languages are in the knowledge base?
• Which application languages are used?
• Which permissions do the users have?
• Which buttons are put in the quick launch?
• Which settings are enabled?
• How are pages set up?
• What is the most common way of setting up TOPdesk?
A.2
Research questions that can be answered processing the log files from
the TOPdesk application
• Which browser types are used?
• Which browser versions are used?
• Which operating systems are used?
• What do the users search for?
• How many errors occur?
• What reports are created and how many times?
• How many times do they create card X (new incident, reservation, ...)?
• How often are cards modified?
• Maximum/average number of tabs that are opened the same time?
• Tabs
– how many are open?
– how many are open in edit mode?
– are tabs closed?
• How much time is spent in a certain module/card?
• Average time they spent on a card?
• Which/How many cards are opened/created and then closed within seconds?
• How many operators in a company use the module page/dashboard/other specific functionalities?
29
• Which modules are really used by our customers (not only bought)?
• How often are searches successful?
A.3
Research questions that cannot be answered processing the log files from
the TOPdesk application or querying the database
Because the information should be available from within the TOPdesk application, these questions can be answered by logging this additional information.
• What browser window sizes are used?
• Which browser languages are used?
• What screen sizes are used?
• Do they use keyboard shortcuts?
– What percentage of the time do the user use keyboard shortcuts?
• Does screens/window size vary within organization?
• What parts are preferably used for specific actions (planner vs. overviews vs. cards or
taskboard/checklist vs grid)
30
B
User manual
B.1
Database query execution
To use the application in order to execute a query on customer databases the following steps
need to be taken:
Firstly the configuration file will be loaded in the GUI. This file needs to be edited according
to the specific question. First ’QUERY’ needs to be defined as an MSSQL query to retrieve
the data you are interested in. Each customer you want to retrieve this data from, the name
of the customer database should be added to the list of ’DATABASES FOR QUERY’ so the
application will execute the query on those databases. The servers that contain these databases
should be defined in the list ’SERVER NAMES’. The ’TOTAL QUERY’ should be used if a
total number of database entries is required to analyze the database results, otherwise this line
should be commented out.
After setting up the configuration correctly the application can be instructed to execute the
database analysis. The results will then be stored in a CSV file.
B.1.1
Configuration file
• USERNAME: the username that can log into all the servers required.
• PASSWORD: the password of the username.
• SERVER NAMES: the names of all the servers you want to be able to send queries to.
• DATABASES FOR QUERY: the name of the databases the query should be executed on.
• QUERY: Query to be executed on the selected databases.
• TOTAL QUERY: Query that must return an integer labeled with ’total’.
B.2
Log file analysis
To use the application in order to analyze log files the following steps need to be taken.
Firstly the configuration file will be loaded in the GUI. This file needs to be edited according to the specific question. First ’MQHOST’ needs to specify the name of where the
RabbitMQ service is running. The ’GLOBAL PATTERN REGEX’ should contain a regular
expression that defines the basic format of a log line. This regular expression should contain groups to be able to extract specific information out of the log line. These groups at
the least have to consist out of: ’timestamp’, ’username’, ’log’ and ’logger’. The next configuration item is ’TIMESTAMP PATTERN’ in which the format of a timestamp is defined.
’BEGIN TIMESTAMP’ and ’END TIMESTAMP’ should match the ’TIMESTAMP PATTERN’
and should contain the start and end time of time span during which you want to investigate the
usage data. In order to answer specific research questions only those listener and event names
need to be added to ’EVENTS’ and ’LISTENERS’, that are essential to answering these questions. Which of the listeners and events you can choose from are listed in the comments above
these configuration entries. By adding more listeners and events then needed, the application
will execute slower than needed.
After this the customernames and their corresponding log files need to be added. This is
done by clicking the ’Add customer’ button. Now you will be prompted to enter the customer
name, after which you can select the log files you want to process, belonging to that customer.
After this you can run the log analysis and for each data point type a CSV file is created with
the results of the selected listeners and events.
31
B.2.1
Configuration file
• MQHOST: Host name of where the RabbitMQ service is running.
• GLOBAL PATTERN REGEX: Regular expression that defines the global log line format.
This format must include the following groups:
– timestamp
– username
– log
– logger
• TIMESTAMP PATTERN: This should represent the timestamp retrieved from the global
pattern.
• BEGIN TIMESTAMP: Only the log lines between this timestamp and ’END TIMESTAMP’
are used. The timestamp should be formatted like ’TIMESTAMP PATTERN’.
• END TIMESTAMP: Only the log lines between this timestamp and ’BEGIN TIMESTAMP’
are used. The timestamp should be formatted like ’TIMESTAMP PATTERN’.
• EVENTS: The names of the events you want to retrieve from the log files.
• LISTENERS: The names of the listeners you want to have active during the execution of
the application. Make sure that ’EVENTS’ include all the event names that these listeners
require to function.
32
C
Orientation report
33
Orientation Report
Bart Schaap 1308297
Tim Castelein 1512277
February 7, 2014
1
Introduction
For our Bachelor of Science project we will create a software product in order to track and
analyze data on how the TOPdesk software is being used by their customers. This information
is to be used by TOPdesk in order to make informed decisions in the development and design
process regarding specific parts of the TOPdesk software. This may for example mean that a
developer wants to know whether a button is used at all by their customers in order to make
an informed decision on removing the button in the next release.
This report will contain our findings of the orientation phase of the project. In section 2 we will
describe the situation of TOPdesk and what our project can do for them. Requirements set by
TOPdesk will be addressed in section 3. Section 4 will contain a basic outline of the system
design and functionality. Section 5 will conclude on which tools and programming languages
we will use during this project.
2
TOPdesk and our project
In this chapter the situation of TOPdesk will be described and what the impact of our project
is.
A part of the customers have their TOPdesk software installed on servers which are owned by
TOPdesk. The customers can then access their installation and data by logging in to these
servers using a web-portal. This way the customers do not have to worry about maintaining the
server and the installation themselves, because this will be handled by TOPdesk. This method
of making access to software available is called Software as a Service (SaaS).
The SaaS network is a separate network from the main TOPdesk network and can be divided
in three parts. The first part is called the Guest Operating System (GOS). This is where
the installation and log files are stored for each customer. There are multiple GOS units and
each unit contains multiple installations. Second is the database storage. There are multiple
database servers and on each of them are multiple databases of customers. For important or
special customers databases are stored on a separate server. At last there is a storage unit
which contains the configuration files for all customers. This network is displayed in figure 1.
The goal of our project is to use the SaaS network to obtain the usage data mentioned in the
introduction. Because the data is stored on a network which is accessible to TOPdesk we will
be able to obtain this data, which would otherwise be unavailable when the software is installed
’on-premise’ at the customer. The application will be able to handle requests for data ranging
from how many users have a setting turned on to how often a button is pressed by users,
possibly compared to another button. Additionally the functionality of the application could
1
Figure 1: Visualisation of the TOPdesk SaaS network
be expanded based on the need of TOPdesk for more (types of) information. TOPdesk can
use this information in their development process and, when functionality is added, in decision
processes from other departments.
3
Requirements
In this chapter we will discuss the requirements of our application. Because the service TOPdesk
delivers to their customers has to be of high standards, our application has to meet these
standards as well. These standards will be added to the requirements.
3.1
Stakeholders
There are multiple groups of people interested in the usage data. We have identified the following
groups:
• Product Management
• Functional Design
• Development
3.2
Functional requirements
• The stakeholders must be able to see usage data from SaaS customers.
• The users can choose which types of data they want.
• The users can select from which groups of customers they want the data.
• The users can compare the results.
2
3.3
Non-functional requirements
• Development must be able to test the validity of the results.
• There must be a minimum risk to security.
• Result data must be anonymous and untraceable to individual users of the TOPdesk
application.
4
Global System Design
This section describes the global system design and its main components. As we have seen in
figure 1 the data is spread out over different SaaS servers. We have therefore chosen for three
major components of our program: data handlers, a data processor and a user interface (UI)
as shown in figure 2.
Figure 2: Global data flow
The other two blocks contain the ’Metric Storage’ and the ’SaaS Network’, which are external
parts of the program. The metric storage is the storage from the program where it can store the
result history and other useful metric data so it can access it on a later date without connecting
to the SaaS network. The SaaS network block is an abstract of figure 1.
In the next three subsections we will describe the main functions of the three major components.
4.1
User Interface
In the UI it will be possible to create an inquiry based on what kind of information the user
wants. Using predefined categorizations we can limit which data the user can choose from. It
will also be possible to create an inquiry based on time spans or specific customer types. The
inquiry will then be sent to the processor. When the processor responds with the answer the
UI will visualize the result.
3
The UI will at least have the before mentioned functions. Other functions might be implemented based on the requirements in section 3 such as the option to retrieve previous results
and compare these to other results..
4.2
Data Processor
The data processor receives the inquiry from the UI and will then interpret the inquiry. Afterwards it will decide whether it will get the usage data from the SaaS network through the data
handler and send the corresponding inquiry or if it will get the usage data from the already
stored metrics. When the data handler returns the requested data it will process the data into
specified metrics. These metrics will be stored in the metric storage for later use of to combine
them with other request.
4.3
Data handler
The idea is to have a data handler for each type of data that we wish to analyze. For instance
the data from the database will be retrieved using a database handler. This component will be
the link between the processor and where the data resides. This makes adding new sources of
data fairly easy as only a new data handler has to be made. The data handler will receive a
request from the processor and makes the connection with the SaaS network on which it then
executes the request. The result of this request will go through the parser so only the data that
is needed will be returned to the processor. This is needed to filter out the unnecessary lines
from the log files which are full of extra information.
5
Project Tools and Software
5.1
Mercurial
For version control we use the version control system Mercurial and TortoiseHg as GUI for
Mercurial.[1][2]
5.2
5.2.1
Programming languages
Java
One of the reasons to create the main part of our program in Java is that because of the JDBC
it is really easy to implement SQL-based database access.[3] Because a main functionality of our
program is retrieve data from a database this will be very helpful. Also the TOPdesk software
code is mainly written in Java, so it complies more with how TOPdesk approaches software
development. Finally Java can run on any platform, so our program can run on any machine.
5.2.2
Python
We will not use Python as the main part of the program but we might use it in the parsing of
the logs, because regular expression in Python are more readable then in Java. Another project
within TOPdesk uses Python to parse specific log files which we can use as an example for our
own log parser.
4
5.3
Testing
For testing purposes we will use JUnit to test the correctness of small functions [4]. For other
tests we will use virtual machines on a test server in order to represent the live SaaS servers.
In this test environment we will test whether our program complies with the requirements
mentioned in section 3. We will also work with the TOPdesk code review process, in which
TOPdesk employees review our code and give feedback.
5.4
Maven
Maven helps in structuring your project. We use maven with the Checkstyle plug-in to standardize the code we write. [5][6].
5.5
Scrum
During the project we will make use of the software development method Scrum.[7] This method
uses sprints of 1-4 weeks to create a usable and potentially releasable product functionality. We
have chosen for sprints of 2 weeks. We have chosen this so that we can review our progress
on time and intervene if things go wrong. We started with a sprint 0 in which we orientated
on the design of the project and filled the backlog for the first sprint. Before each sprint the
Product Owner will decide which functionality has the highest priority and create a planning
accordingly together with the development team. To monitor and maintain the development
process and sprints JIRA Agile is used.[8]
6
Future research
In the near future we expect to do more research when we come across problems during our
sprints. We have two problems in our sights which are the security and anonymity issues and
the way the separate functions communicate with each other without waiting for a long period
of time. These subjects will be addressed in the final report when we have made the decisions.
References
[1] Bryan O’Sullivan. Mercurial: The definitive guide. hgbook.red-bean.com/read.
[2] Tortoise hg. http://tortoisehg.bitbucket.org.
[3] Jdbc. oracle.com/technetwork/java/javase/tech/index-jsp-136101.html.
[4] Junit. junit.org.
[5] Maven. maven.apache.org.
[6] Checkstyle. maven.apache.org/plugins/maven-checkstyle-plugin.
[7] Scrum. scrum.org.
[8] Jira. atlassian.com/software/jira.
5
D
D.1
SIG Feedback
Initial SIG Feedback
The following is the feedback we received at the start of the fourth sprint of our project.
De code van het systeem scoort 4 sterren op ons onderhoudbaarheidsmodel, wat
betekent dat de code bovengemiddeld onderhoudbaar is. De hoogste score is niet
behaald door lagere scores voor Component Balance en Unit Interfacing.
Het eerste wat opvalt is dat de code niet in componenten opgedeeld is, alles staat nu
bij elkaar in n project. Dit veroorzaakt de lage score voor Component Balance, want
die metriek kijkt naar hoe een systeem in componenten is opgedeeld. Het gebrek
aan componenten is nu nog geen groot probleem omdat het systeem nog klein is,
maar als het codevolume gaat groeien is het handig om wat meer structuur toe te
voegen. Als de GUI groter of ingewikkelder wordt zou je er bijvoorbeeld voor kunnen
kiezen om die in een apart project te zetten, om zo ongewenste afhankelijkheden te
voorkomen en een duidelijke scheiding tussen verantwoordelijkheden aan te brengen.
Een ander punt dat er nu geen build tools worden gebruikt. Zulke tools zorgen
ervoor dat je op een gestandaardiseerde manier een build kunt maken, en het scheelt
je daarnaast tijd omdat je het niet steeds met de hand hoeft te doen.
Het is positief dat jullie commentaar toevoegen, maar wees kritisch in de toegevoegde
waarde van het commentaar ten opzichte van de code. Als een methode ”sortFilesByDate()” heet hoef je geen commentaar ”sorts files based on date” toe te voegen.
Bovenstaande opmerkingen gaan vooral over de organisatie. Unit Interfacing gaat
over de code zelf, en betreft het aantal parameters. Doorgaans duidt een bovengemiddeld aantal parameters op een gebrek aan abstractie. Daarnaast leidt een groot aantal parameters nogal eens tot verwarring in het aanroepen van de methode en in de
meeste gevallen ook tot langere en complexere methoden. In jullie geval valt het op
dat de reeks (DateTime timeStamp, String username, String log, String logger) heel
vaakt wordt doorgegeven. Je zou kunnen overwegen om een object te introduceren
dat deze vier velden heeft, dan hoef je alleen maar dat object door te geven in plaats
van de hele lijst.
Maar over het algemeen scoort de code bovengemiddeld, hopelijk lukt het om dit
niveau te behouden tijdens de rest van de ontwikkelfase.
Als laatste nog de opmerking dat er geen (unit)test-code is gevonden in de codeupload. Het is sterk aan te raden om in ieder geval voor de belangrijkste delen van
de functionaliteit automatische tests gedefinieerd te hebben om ervoor te zorgen dat
eventuele aanpassingen niet voor ongewenst gedrag zorgen.
D.2
Final SIG Feedback
The following is the final feedback we received at during the tenth week of our project.
In de tweede upload zien we dat zowel het codevolume als de score voor onderhoudbaarheid licht zijn gestegen.
Het eerste dat opvalt is dat jullie de code-indeling hebben aangepast. Het systeem
is nu in duidelijke (technische) componenten opgedeeld. Als gevolg van deze aanpassing is de deelscore voor Component Balance sterk gestegen.
39
De verschillende componenten zijn als Maven-project gedefinieerd. Dit maakt voor
mensen die nog niet bekend zijn met de code, zoals ons, makkelijker te begrijpen hoe
de componenten met elkaar verbonden zijn. Daarnaast is hiermee het buildproces
gestandaardiseerd, waarmee het makkelijker wordt om het systeem aan andere tools
(bijvoorbeeld Cobertura voor het meten van de testdekking) te koppelen.
Bij Unit Interfacing zien we dat jullie een aantal methodes hebben ge-refactored,
waardoor ze nu minder parameters nodig hebben. De deelscore voor Unit Interfacing
is door deze aanpassingen van 3 naar 4 sterren gestegen.
Op systeemniveau zitten jullie overigens nog steeds op 4 sterren, al is het van een
magere vier sterren bij de eerste upload naar een dikke 4 gestegen. Jullie code is
dus boven markgemiddeld onderhoudbaar.
Tot slot is het goed om te zien dat jullie sinds de eerste upload ongeveer 1000 regels
aan testcode hebben toegevoegd. Hopelijk zal het volume van de test code ook
groeien op het moment dat er nieuwe functionaliteit toegevoegd wordt.
Uit deze observaties kunnen we concluderen dat de aanbevelingen van de vorige
evaluatie zijn meegenomen in het ontwikkeltraject.
40