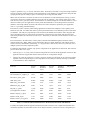
1
Dynamic Analysis and Profiling of Multi-threaded Systems Daniel G. Waddington Lockheed Martin Advanced Technology Laboratories, Cherry Hill, NJ, USA [email protected] Nilabja Roy and Douglas C. Schmidt Vanderbilt University, Nashville, TN, USA {nilabjar, schmidt}@dre.vanderbilt.edu 1 Introduction A thread is a logical flow of execution within a program. In implementation terms, a thread is a lightweight representation of execution state, such as a program counter and associated registers, a runtime stack of activation records, a priority, and scheduling state. Threads typically reside within a single process, which represents a more coarse-grained unit of protection and resource allocation. Threads have traditionally been used on single processor systems to help programmers implement logically concurrent tasks and manage multiple activities within the same program (Rinard, 2001). For example, a program that handles both GUI events and performs network I/O could be implemented with two separate threads that run within the same process. Here the use of threads avoids the need to “poll” for GUI and packet I/O events, as well as also avoids the need to adjust priorities and preempt running tasks, which is instead performed by the operating system’s scheduler. With the recent advent of multi-core and symmetric multi-processor (SMP) systems, threads represent logically concurrent program functions that can be mapped to physically parallel processing hardware. For example, a program deployed on a four-way multi-core processor must provide at least four independent tasks to fully exploit the available resources (of course it may not get a chance to use all of the processing cores if they are occupied by higher priority tasks). As parallel processing capabilities in commodity hardware grow, the need for multi-threaded programming will increase because explicit design of parallelism in software will be key to exploiting performance capabilities in next-generation processors, at least in the short term (Sutter, 2005). This chapter will review key techniques and methodologies that can be used to collect event and timing information from running systems. We shall highlight the strengths and weaknesses of each technique and lend insight into how, from a practical perspective, they can be applied. 1.1 Understanding Multi-threaded System Behavior Building large-scale software systems is both an art and an engineering discipline. Software construction is an inherently recursive process, where system architects and developers iterate between problem understanding and realization of the solution. A superficial understanding of behavior is often insufficient for production systems, particularly mission-critical systems where performance is tightly coupled to variations in the execution environment, such as load on shared resources and hardware clock speeds. Such variations are common in multi-threaded systems where execution is directly affected by resource contention arising from other programs executing at the same time on the same platform. To build predictable and optimized large-scale multi-threaded systems, therefore, we need tools that can help (1) improve understanding of software subsystems and (2) alleviate the potential chaotic effects that may arise from their broader integration. Multi-threaded programs result in inherently complex behavior (Lee, 2006; Sutter & Larus, 2005) for several reasons, including (1) the use of non-deterministic thread scheduling and pre-emption and (2) control and data dependencies across threads. Most commercial operating systems use priority queue-based, preemptive thread scheduling. The time and space resources a thread needs to execute on an operating system are thus affected by: • Thread priority, which determines the order in which threads run. • Processor affinity, which defines the processors that the thread may run on. • Execution state, which defines whether the thread is ready, waiting, or stopped. • Starvation time, which is caused by system delay during peak load periods. Switching execution context between multiple threads results in an execution “interleaving” for each processor in the system. In a single-processor system, there is only one stage of scheduling; that is, the choice of deciding which runnable thread to execute next. Systems that have multiple cores or SMP processors require an additional stage that maps the threads ready to run on to one of many possibly available cores, as shown in Figure 1. Figure 1. Interleavings Caused by 1-Stage and 2-Stage Scheduling Even if we know exactly how long each thread will have access to the processor (which ignores any form of priority-driven pre-emption and inter-thread dependency), the number of feasible inter-leavings that can occur in the system are staggering. For example, using the criteria in Figure 1, which has only four independent threads, each with eight execution quanta, there are 1017 possible interleavings for just one processor. Server-based systems with hundreds of threads and tens of processors are now common. Over the next decade we expect tera-scale systems that will have hundreds of cores (Intel Corporation, 2006b). 1.2 Approaches to Extracting Multi-threaded Behavioral Characteristics There are two basic approaches to behavioral analysis: static and dynamic. Static analysis involves inspecting the underlying constituents of a system without executing any program. It requires some “model” of the system or implementation artifact that is directly correlated with expected behavior. For example, analysis of program source code is considered a form of static analysis. This type of analysis has the advantage that it can be performed without running the system and can thus explore dimensions of behavior that may be hard to stimulate through manipulation of program input. Static analysis (Jackson & Rinard, 2000) is the formal construction (potentially through reverse engineering) of program execution models. These models can be analyzed to derive and ensure behavioral characteristics. Model checking (Clarke, Grumberg, & Peled, 2000) is a static analysis technique that is often applied to multithreaded programs to explore all feasible interleavings exhaustively to ensure correctness properties, such as absence of deadlock and livelock (Rinard, 2001). This approach can check all feasible paths of execution (and interleavings) and thus avoid leaving any unchecked behavior. Due to the vast number of feasible interleavings a large multi-threaded system may exhibit, however, model checking is computationally expensive and limited in its applicability. Other forms of static-analysis, such as automated checking of design intent (Greenhouse, 2003) and program analysis driven theorem proving (Freund & Quadeer, 2003), have also been applied to multi-threaded systems to ensure correct behavior. Each approach typically makes a trade-off between analytical thoroughness and computational cost. Static-analysis techniques typically do a good job of modeling relative time and temporal ordering. They do not model—and thus cannot reason about—absolute (wall-clock) time. The only practical approach to behavioral analysis that can incorporate aspects of absolute time is dynamic analysis, also known as profiling. Profiling is inspection of behavior of a running system. An advantage of this approach is that it can measure aspects of the system and know that they are exactly representative of the system. Approaches to profiling can be classed as either active or passive. Active profiling requires that the application and/or system being measured explicitly generate information about its execution. An example of active profiling is the user of compiler-based probe insertion, where the application makes callbacks to the trace collection engine to record execution behavior. Conversely, passive profiling relies on explicit inspection of control flow and execution state through an external entity, such as a probe or modified runtime environment. Passive profiling typically does not require any modification of the measured system, but is harder to implement and may require specialized tracing hardware. Profiling collects precise and fine-grained behavioral data from a running multi-threaded system, which can be coupled with off-line analysis to help summarize and reason about observed results. The collected data is thus accurate and representative of system execution, as long as the overhead of the measurement has not unduly influenced the results. Profiling can also only provide behavioral data for control paths that actually execute, so successfully applying profiling tools depends largely on analyzing multiple runs of the program that test all relevant paths in the system. This coverage can be achieved through careful selection of stimuli (e.g., input data) to the system, as well as through artificial fault injection. Profiling is limited, however, to the inspection of behavior that can be made to run by appropriate stimulation of the system, e.g., through selection of input. This limitation means that profiling is more useful for behavior analysis in circumstances where a sampling of behavior is sufficient. For example, profiling is useful for optimizations that aim to improve performance on statistically frequent paths of execution. Conversely, profiling is not well suited to ensure correct behavior in a system when only one execution in a million can lead to system failure. Both static analysis and dynamic analysis have their pros and cons. Advanced behavioral analysis solutions (Nimmer & Ernst, 2001; Waddington, Amduka, DaCosta, Foster, & Sprinkle, 2006) use a combination of them to provide a more complete picture of system behavior. The remainder of this chapter presents and evaluates general approaches to profiling within the context of multi-threaded systems. We examine the type and scale of behavioral data that can be collected dynamically from running systems and review state-of-the-art profiling tools and technologies available today. 2 Background Behavioral analysis is the examination and understanding of a system’s behavior. Within the context of computing systems, behavioral analysis can be applied throughout the software lifecycle. The role of behavioral analysis—and the benefits it brings—vary according to its how it is applied and the point in the life cycle to which it is applied. At a broad level, behavioral analysis supports assurance, optimization, diagnosis and prediction of software-system execution. Table 1 shows the relationship between these roles and different stages of software development. Role Lifecycle Stage Purpose Assurance Design, Implementation, Testing Ensuring correct functionality and performance. Optimization Implementation Ensuring optimal use of computing resources. Diagnosis Integration, Testing Determining the conditions that lead to unexpected behavior. Prediction Maintenance Assessing how program modifications and integration will affect system behavior. Table 1. Roles of Behavioral Analysis in Software-Systems Development 2.1 Non-deterministic Behavior in Multi-threaded Systems Systems that behave according to classical physics, including electronic computers that are based on the von Neumann architecture, are deterministic in a strict sense. Actually predicting the behavior of a computing system, however, is fundamentally connected with the ability to gather all necessary information about the start state of the system. In most cases this is impractical, primarily due to very long causal chains (sequences of inter-related effects) and environmental interactions (i.e., input) that are hard to predict. In this chapter, we define determinism as the ability to predict the future state of a system. We therefore consider computer systems as generally being non-deterministic because we cannot practically predict the future state of the system. Accurate predictions would require a complete understanding of the start state, as well as prediction of environmental variables, such as user interaction and environmental effects (e.g., temperature sensitivity). Most enterprise-style computing systems today demonstrate non-deterministic behavior. Key sources of nondeterminism in these systems include distributed communications (e.g., interaction across a network to a machine with unknown state), user input (e.g., mouse/keyboard), and dynamic scheduling (e.g., priority-based with dynamic priority queues). These activities and actions typically result in a system whose execution is hard to predict a priori. A prominent cause of non-determinism in multi-threaded systems stems from the operating system’s scheduler. The choice of which logical thread to execute on which physical processor is derived from a number of factors, including thread readiness, current system load (e.g., other threads waiting to be run), priority, and starvation time (i.e., how long a thread has been waiting to be run). Many commercial-off-the-shelf (COTS) operating systems use complex scheduling algorithms to maintain appropriate timeliness for time-sensitive tasks and also to achieve optimal use of processing resources. From the perspective of behavior analysis, however, these types of scheduling algorithms make static prediction of scheduling outcome infeasible in practice. Certain properties, such as absence of deadlock, can be checked effectively using static analysis because all possibilities can be explored explicitly. However, other properties, such as the absolute time taken to execute given functionality, can only be assessed practically using runtime profiling. 2.2 Behavioral Characteristics Relevant to Multi-threaded Programs Certain elements of behavior result from, and are thus pertinent to, the use of multi-threaded programming. We define the “behavior” of a system as the set of properties that are determined through measurement and inspection of the following principal elements: • Events - something that occurs in the system, e.g., a thread is created or a cache is flushed. • Event attributes - aspects of events that vary across instances of events, including time of occurrence and system state, e.g., the thread was created at time T or thread X migrated from core 1 to core 2. • Propositional relationships (order, causality, equality - associations between events, e.g., the server thread always completes initialization before the client thread or thread X waits for Y and thread Y waits for X (deadlock). These are the principal characteristics of a software system that must be measured to build a definition of behavior. Dynamic analysis and profiling tools must examine these characteristics of a system to build a representative picture of behavior. There is no single set of properties that must be included in a definition of behavior, because the capture of behavior is always scoped to a given concern (e.g. performance or correctness). Table 2 illustrates example characteristics that can be determined through analysis and profiling. Element(s) Property Description Events and Attributes Thread Migration Distribution of threads/processes as they are migrated across processors. Events and Attributes Lock Hold and Wait Times Absolute time that given threads wait on locks and hold locks. Events and Attributes Execution Time Time taken to execute between two given code points (same or different threads). Events and Attributes Level of Concurrency Distribution of actual (and possible) concurrent execution over time. Relationships Absence of deadlock Whether or not there is possibility for deadlock in the system. Relationships Thread Dependency Which other threads in the system a given thread is dependent upon. Table 2. Example Behavioral Characteristics To provide a sense of the necessary sampling scale (i.e., frequency of events) in today’s COTS-based systems, we performed a simple experiment to gather some system metrics. Understanding the expected sampling rates is necessary to understanding the viability and impact of different profiling techniques. Our experimentation is based on measurements taken from Microsoft Windows XP, running on a dual-processor, hyper-threaded (Intel Xeon 2.8 GHz) system, executing a stress-test web client/server application. The measurements were taken using both Windows performance counters and the on-chip Intel performance counters. Table 3 shows the results. Category Metric Range Processor Clock Rate 2,793,000,000 Hz * Micro-ops Queued 630,000,000 uops/second * Instructions Per Second 344,000,000 instructions/second * L2 Cache Reads 65,000,000 reads/second * Number of Threads 500 total count Context Switch Rate 800 – 170,000 switches/sec Thread Queue Length 0 – 15 total count Scheduling Quanta 20 – 120 ms System Calls 400 – 240,000 calls/sec Hardware Interrupts 300 – 1000 interrupts/sec Synchronization Objects 400 – 2200 total count Thread Scheduling System Resources * per logical processor Table 3. Example Metric Ranges The data listed in Table 3 is comprised primarily of finer-grained metrics that occur at very high frequencies in the lower levels of the system. Of course, less frequent “application-level” events are also of interest in understanding the behavior of a system. For example, rare error conditions are often of significant importance. The data in Table 3 shows that the frequency (and therefore quantity) of measurable events can vary significantly by up to nine orders of magnitude. The impact of measurement is proportionally scaled and therefore analysis methodologies that work well for low-frequency events may not do so for higher-frequency events. 2.3 Challenges of Multi-threaded System Profiling The rest of this chapter focuses on the realization and application of runtime profiling on multi-threaded systems. Profiling multi-threaded systems involves addressing the following key challenges: • Measurement of events at high frequencies – Events of interest typically occur at high frequency. The overhead and effect of measurement on the system being measured must be controlled carefully. Without careful control of overhead, results become skewed as the process of measurement directly alters the system’s behavior. • Mapping across multi-level concepts – Threads can be used at multiple levels of a system. For example, threads can exist in the OS, virtual machine, and in the application (lightweight threads and fibers). Virtual machine and application-layer threads map to underlying OS threads. Extracting the mapping between thread representations is inherently hard because in many cases the mappings are not one-to-one and are even dynamically adjusted. • Extraction of complex interactions – Threads represent the fundamental unit of execution in a software system and are inherently interdependent. Their interactions are facilitated through the sharing of system resources, such as memory, file, and devices. Determining which resources are the medium of thread interaction is inherently hard because measuring events on all of the resources in the system is not feasible due to excessive instrumentation overhead. • Interpolation between raw events and broader properties – Deriving the behavior of a system requires more than simple collection of event data. Raw event data (i.e., that collected directly) must be used to build a composition of behavior that can be more readily analyzed by engineers. Abstraction and collation of data is a key requirement in deriving properties of synchronization that exist in multi-threaded systems. Research in the area of multi-threaded software profiling and analysis has made some inroads into these challenges. We review the state-of-the-art in tools and techniques below, some of which are still limited to research prototypes, and discuss how they try to address some of the challenges described above. 3 Compiler-based Instrumentation The most common approach to runtime profiling is to modify the code that executes so that it explicitly generates trace information. There is a wide array of techniques that can be used to do this, applied at different stages of the program code lifecycle, as shown in call-outs A to D in Figure 2. Source-to-source transformation (metaprogramming) that introduces explicit trace functionality into existing source code. A Source code Instrumentation of preprocessed code through AspectOriented Programming. B Preprocessed Code Instruction level binary rewriting typically with control flow redirection and trampoline functions). Just-in Time (JIT) modification of binary instructions. C Binary Code (Objects ) D Binary Code (Linked) Instrumented code targets a processor simulator Instrumented code targets same processor as original binary code Instrumented code targets a different processor from original binary code Binary Code (Loaded / Executing) 1 2 3 Figure 2. Different Points of Code Modification Simulation Native Cross-target 3.1 Source-code Instrumentation Instrumenting source code by hand is impractical in large systems. Alternatively, instrumentation can be automated through source-to-source transformation. Meta-programming frameworks, such as Proteus (Waddington & Yao, 2005), TXL (Cordy, Halpern, & Promislow, 1991), Stratego (Visser, 2001) and DMS (Baxter, 2004), enable modifications to source code before it is compiled or preprocessed (Figure 2, label A). These meta-programming frameworks provide a programming language that can be used to define contextsensitive modifications to the source code. Transformation programs are compiled into applications that perform rewriting and instrumentation of source, which is given as input. Source code can also be instrumented just before it is compiled in a form of preprocessing (Figure 2, label B). Aspect-oriented programming (Spinczyk, Lohmann, & Urban, 2005; Kiczale, Hilsdale, Hugunin, Kersten, Palm, & Griswold, 2001) is an example of preprocessed code modification. Applying instrumentation to source code, as opposed to applying it to binary code, makes it easier to align trace functionality with higher-level, domain-specific abstractions, which minimizes instrumentation because the placement of additional code is limited to only what is necessary. For example, to measure the wait times of threads that are processing HTTP packets received from a network in a given application, developers could instrument only those wait calls that exist in a particular function, as opposed to all wait calls across the complete program. Definition of the context (function and condition) is straightforward in a meta-programming or aspect-programming language. The following excerpt illustrates an AspectC++ (Spinczyk et al., 2005) rule for such an example. Given the original code: #include <stdio.h> #include <pthread.h> pthread_mutex_t * mute; int main() { pthread_mutex_init(mute, NULL); pthread_mutex_lock(mute); pthread_mutex_unlock(mute); return 0; } void ReadPacket() { /* code that we wish to instrument */ pthread_mutex_lock(mute); pthread_mutex_unlock(mute); } The following AspectC++ aspect defines a rule that inserts calls to function TraceEvent() after each call to pthread_mutex_lock that exists within function ReadPacket (expressed through a join-point filter). aspect TraceAspect { advice call("% pthread_mutex_lock(...)") && within("% ReadPacket(...)") : after() { TraceEvent(); } }; The result of “weaving” (i.e., source-to-source transformation) the above source code is the following. The weaving process has defined additional classes and inline functions to support the specified trace functionality. It has also redirected control flow according to the trace requirement (after call to function). #ifndef __ac_fwd_TraceAspect__ #define __ac_fwd_TraceAspect__ class TraceAspect; namespace AC { inline void invoke_TraceAspect_TraceAspect_a0_after(); } #endif … #line 1 "main.cc" #include <stdio.h> #include <pthread.h> pthread_mutex_t * mute; int main() { pthread_mutex_init(mute, NULL); pthread_mutex_lock(mute); pthread_mutex_unlock(mute); return 0; } /* Function generated by aspect weaver to call the “trace” aspect after calls to pthread_mutex_lock */ inline int __call__ZN10ReadPacketEv_0_0 (::pthread_mutex_t * arg0) { AC::ResultBuffer< int > result; ::new (&result) int (::pthread_mutex_lock(arg0)); AC::invoke_TraceAspect_TraceAspect_a0_after (); return (int &)result; } void ReadPacket() { __call__ZN10ReadPacketEv_0_0 (mute); pthread_mutex_unlock(mute); } … class TraceAspect { public: static TraceAspect *aspectof () { static TraceAspect __instance; return &__instance; } static TraceAspect *aspectOf () { return aspectof (); } public: void __a0_after() { printf("TRACE"); } }; namespace AC { inline void invoke_TraceAspect_TraceAspect_a0_after () { ::TraceAspect::aspectof()->__a0_after (); } } Aspect-oriented programming and other forms of source-to-source transformation are useful for selective and precise instrumentation of source code. Modification of source code is portable with respect to different processor architectures. The impact on performance that the measurement incurs is often minimal because instrumentation is customized and only inserted where absolutely necessary. Instrumentation can be performed in the same order of time that is needed to compile the code. Source-code instrumentation is ideal for coarsegrained event tracing, particularly where the trace criteria must be related to application-level abstract events that are hard, if not impossible, to detect at the instruction level. Nevertheless, source-code instrumentation is target language dependent and can also be problematic when dealing with language idiosyncrasies, such as C/C++ preprocessing and syntactic variations. 3.2 Static Binary-code Instrumentation An alternative approach to adding event-tracing functionality to source code is to modify compiled binary code directly. Many compilers and profiling tools, such as Rational Purify and Quantify (IBM Corporation, 2003), can compile code with additional profiling instrumentation and also to link with pre-instrumented runtime libraries. For example, applying the command line options –pg, -ftrace-arcs, and -ftest-coverage, to the GNU GCC compiler produces binary code that is instrumented with additional functionality that traces the count of function calls and basic blocks executed in the program. The following excerpts show the basic profiling instrumentation produced by the GNU GCC compiler for this example C source code: void foo(){ if(i<10) i++; else i=0; return; } The generated assembly code (x86) without instrumentation is: 08048373 <foo>: 8048373: 55 8048374: 89 e5 8048376: 83 3d 804837d: 7f 08 804837f: ff 05 8048385: eb 0a 8048387: c7 05 804838e: 00 00 8048391: c9 8048392: c3 8048393: 90 78 95 04 08 09 78 95 04 08 78 95 04 08 00 00 push mov cmpl jg incl jmp movl %ebp %esp,%ebp $0x9,0x8049578 8048387 <foo+0x14> 0x8049578 8048391 <foo+0x1e> $0x0,0x8049578 leave ret nop The generated assembly code (x86) with instrumentation is: 080488da <foo>: 80488da: 80488db: 80488dd: 80488e2: 80488e9: 80488eb: 80488f1: 80488f8: 80488ff: 8048901: 8048908: 804890b: 8048912: 8048919: 804891a: 55 89 e8 83 7f ff 83 83 eb c7 00 83 83 c9 c3 e5 62 3d 16 05 05 15 18 05 00 05 15 fd ff ff 00 a2 04 08 09 00 a2 04 08 38 a2 04 08 01 3c a2 04 08 00 00 a2 04 08 00 00 40 a2 04 08 01 44 a2 04 08 00 push mov call cmpl jg incl addl adcl jmp movl %ebp %esp,%ebp 8048644 <mcount@plt> $0x9,0x804a200 8048901 <foo+0x27> 0x804a200 $0x1,0x804a238 $0x0,0x804a23c 8048919 <foo+0x3f> $0x0,0x804a200 addl adcl leave ret $0x1,0x804a240 $0x0,0x804a244 The first highlighted (80488dd) block represents a call to the profiling library’s mcount() function. The mcount() function is called by every function and records in an in-memory call graph table a mapping between the current function (given by the current program counter) and the function’s parent (given by return address). This mapping is typically derived by inspecting the stack. The second highlighted block (80488f1) contains instructions that increment counters for each of the basic blocks (triggered by the -ftrace-arcs option). Profiling data that is collected through the profiling counters is written to a data file (gmon.out). This data can be inspected later using the GNU gprof tool. Summarized data includes basic control flow graph information and timing information between measure points in code. The overhead incurred through this type of profiling can be significant (up to 60%) primarily because the instrumentation works on an “all or nothing” premise. Table 4 shows experimental results measuring the performance impact of the GCC profiling features. Tests were performed by running the BYTEmark benchmark program (Grehan, 1995) on a 3.00 GHz Intel Pentium-D running Redhat Enterprise Linux v4.0. It is however possible to enable profiling on selected compilation units thereby keeping instrumentation to a minimum. Test No profiling With profiling % Slow Down Numeric Sort 812.32 498.2 38.67 String Sort 103.24 76.499 25.90 Bitfield 4.35E+08 1.65E+08 62.11 FP Emulation 73.76 52.96 28.20 Fourier 15366 15245 0.79 Assignment 24.292 9.77 59.78 Huffman 1412.7 1088.7 22.93 Neural Net 18.091 12.734 29.61 LU Decomp 909.76 421.48 53.67 Table 4. Slow-down incurred by GNU GCC Profiling This type of code instrumentation is termed static because the code is modified before execution of the program (Figure 2, label C). COTS compiler-based instrumentation for profiling is generally limited to function calls and iteration counts. Another more powerful form of static binary instrumentation involves the use of a set of libraries and APIs that enable users to quickly write applications that perform binary re-writing (Hunt, & Brubacher, 1999; Larus & Schnarr, 1995; Srivastava & Eustace, 1994; Romer, et al., 1997). The following capabilities are typical of binary rewriting libraries: • Redirection of function calls and insertion of “trampoline-functions” that execute the originally called function (Hunt & Brubacher, 1999; Buck & Hollingsworth, 2000) • Insertion of additional code and data. • Control and data-flow analysis to guide instrumentation. The following code illustrates the use of control-flow analysis and insertion of additional code through the Editing Executable Library (EEL) (Larus & Schnarr, 1995), machine-independent, executable editing API: int main(int argc, char* argv[]) { executable* exec = new executable(argv[1]); exec->read_contents(); routine* r; FOREACH_ROUTINE (r, exec->routines()) { instrument(r); while(!exec->hidden_routines()->is_empty()) { r = exec->hidden_routines()->first(); exec->hidden_routines()->remove(r); instrument(r); exec->routines()->add(r); } } } addr x = exec->edited_addr(exec->start_address()); exec->write_edited_executable(st_cat(argv[1], “.count”), x); return (0); void instrument(routine* r) { static long num = 0; cfg* g = r->control_flow_graph(); bb* b; FOREACH_BB(b, g->blocks()) { if (1 < b->succ()->size()) { edge* e; FOREACH_EDGE (e, b->succ()) { // incr_count is the user-defined code snippet e->add_code_along(incr_count(num)); num += 1; } } } } r->produce_edited_routine(); r->delete_control_flow_graph(); EEL code “snippets” encapsulate of pieces of code that can be inserted into existing binary code. They are either written directly in assembly language (which makes the instrumentation machine dependent) or written using a higher-level language that is compiled into assembly. To graft snippet code into existing code, each snippet must identify registers used in the snippet that must be assigned to unused registers. 3.3 Dynamic Binary-code Instrumentation An alternative to static binary instrumentation is dynamic instrumentation. Dynamic instrumentation, implemented as Just-in Time (JIT) compilation, is performed after a program has been loaded into memory and immediately prior to execution (Figure 2, label D). Dynamic instrumentation has the advantage that profiling functionality can be selectively added or removed from the program without the need to recompile: Trace functionality is only present when needed. Moreover, dynamic instrumentation can be applied reactively, e.g., in response to some event in the system, such as processor slow down. Dynamic instrumentation is especially useful for facilitating conditional breakpoints in code, e.g., Buck and Hollingsworth (2000) show that this approach is 600 times more efficient than conventional trap-based debug breakpoints. The Paradyn work from the University of Wisconsin, Madison (Miller, Callaghan, Cargille, Hollingsworth, Irvin, & Karavanic, 1995) was designed specifically for performance measurement of parallel programs. Paradyn uses dynamic instrumentation to apply trace functionality according to a set of resource hierarchies, as shown in Figure 3 (shaded nodes represent an example focus, all spin locks in CPU#1, in any procedure). Entities within the resource hierarchies effectively represent the scope of the current tracing functionality. Figure 3. Paradyn Sample Profiling Criteria Buck and Hollingsworth continued to develop the dynamic instrumentation element of Paradyn in their Dyninst work (Buck & Hollingsworth, 2000). Similar to the EEL API described earlier, Dyninst is a C++ programming API that allows the insertion of code “snippets” at selected points in the binary code. Dyninst also provides a thread abstraction that allows developers to associate instrumentation with specific threads that are running in the system, which is a necessary part of their selective profiling scheme. Dyninst and Paradyn are designed to target the native processor; the modified instructions target the actual un- derlying hardware. Other work, such as Pin (Luk, et al., 2005), Dixie (Fernandez, Ramirez, Cernuda, & Espasa, 1998), DynamoRIO (Bruening, 2004), and Valgrind (Nethercote, 2004), have pursued the use of crosscompilation so that the modified binary code can be executed on an emulated (i.e., virtual) machine architecture. Targeting a virtual machine provides more control and the ability to inspect low-level details of behavior, such as register and cache activity. It also does not necessarily imply translation across different instruction set architectures (ISA). In most instances, the virtual machine uses the same ISA as the underlying host, so that whilst hooks and interceptors can be put in place, the bulk of the code can simply be passed through and executed by the host. The Pin program analysis system (Luk, et al. 2005) is an example of dynamic compilation targeting a virtual machine architecture using the same ISA as the underlying host. As shown in Figure 4, the Pin system consists of: • Instrumentation API - used to write programs that perform dynamic interception and replacement. • JIT Compiler - compiles and instruments the bytecode immediately before execution. • Code cache - caches translations between the target binary and the JIT compiled code. • Emulation unit - interprets instructions that cannot be executed directly. • Dispatcher - retrieves and executes code from the code cache. Figure 4. The Pin Software Architecture To analyze a program’s behavior (multi-threaded or not), Pin users must write a program that performs dynamic instrumentation. Pin provides an API based on the ATOM API (Srivastava & Eustace A, 1994) that abstracts away the underlying instruction set idiosyncrasies and allows the passing of context information, such as register contents, to the injected code as parameters. Pin programs typically consist of analysis and instrumentation elements. The basic building blocks for defining instrumentation points are machine instructions, basic blocks, procedures, images, and applications. For example, the C++ code below shows the use of the Pin API to instrument the target code with trace functions each time sleep() is invoked. First, a replacement function is defined with the same signature as the function that is being replaced (in this example sleep()). typedef VOID * ( *FP_SLEEP )( unsigned int ); // This is the replacement routine. VOID * NewSleep( FP_SLEEP orgFuncptr, UINT32 arg0, ADDRINT returnIp ) { // Normally one would do something more interesting with this data. // cout << "NewSleep (" << hex << ADDRINT ( orgFuncptr ) << ", " << dec << arg0 << ", " << hex << returnIp << ")" << endl << flush; // Call the relocated entry point of the original (replaced) routine. // VOID * v = orgFuncptr( arg0 ); return v; } A callback function ImageLoad() is used to intercept binary-image loads that are executed by the target application. The Pin API can then be used to obtain the function that will be replaced with the new tracing/trampoline function. // Pin calls this function every time a new img is loaded. // It is best to do probe replacement when the image is loaded, // because only one thread knows about the image at this time. VOID ImageLoad( IMG img, VOID *v ) { // See if sleep() is present in the image. If so, replace it. // RTN rtn = RTN_FindByName( img, "sleep" ); if (RTN_Valid(rtn)) { cout << "Replacing sleep in " << IMG_Name(img) << endl; // Define a function prototype that describes the application routine // that will be replaced. // PROTO proto_sleep = PROTO_Allocate( PIN_PARG(void *), CALLINGSTD_DEFAULT, "sleep", PIN_PARG(int), PIN_PARG_END() ); // Replace the application routine with the replacement function. // Additional arguments have been added to the replacement routine. // The return value and the argument passed into the replacement // function with IARG_ORIG_FUNCPTR are the same. // AFUNPTR origptr = RTN_ReplaceSignatureProbed(rtn, AFUNPTR(NewSleep), IARG_PROTOTYPE, proto_sleep, IARG_ORIG_FUNCPTR, IARG_FUNCARG_ENTRYPOINT_VALUE, 0, IARG_RETURN_IP, IARG_END); cout << "The original entry point to the replaced function has been moved to 0x"; cout << hex << ( ADDRINT ) origptr << dec << endl; // Free the function prototype. PROTO_Free( proto_sleep ); } } else { cout << "Could not find routine in image\n"; } The instrumentation function is “hooked” onto image loads through IMG_AddInstrumentFunction() as follows: int main( INT32 argc, CHAR *argv[] ) { // Initialize symbol processing // PIN_InitSymbols(); // Initialize pin // PIN_Init( argc, argv ); // Register ImageLoad to be called when an image is loaded // IMG_AddInstrumentFunction( ImageLoad, 0 ); // Start the program in probe mode, never returns // PIN_StartProgramProbed(); return 0; } The target program is run until completion through PIN_StartProgramProbed(). Pin also supports the ability to dynamically “attach” and “detach” from a long-running process if transient tracing is needed. Dynamic compilation and virtual machine execution incur overhead. With respect to Pin, overhead is primarily a result of performing JIT-compilation, helped by the use of a code-translation cache. Figure 5 shows Pin performance data taken from Luk et al. (2005). These results show that the slowdown incurred by Pin is typically in the region of four times slower. Even though this is a significant slowdown, to our knowledge, the Pin approach is one of the fastest, dynamic-compilation based profiling solutions available today. Normalized Execution Time (%) Instrumenting program code with tracing functionality is a powerful means of understanding system behavior. Modifying source code provides a straightforward means to collect trace information that must relate to application-level program functionality. It therefore enables the customization of trace insertion according to the program “features” of interest. 500 Without instrumentation With basic-block counting 450 400 350 300 250 200 150 100 50 vpr twolf vortex perlbmk parser mcf gzip gcc gap crafty bzip2 0 Test Application Figure 5. Pin Performance Test Results (Luk et al., 2005) Alternatively, binary instrumentation is well-equipped to handle complex software where the executed code cannot be identified until runtime. Binary-level modifications and execution on virtual machine architectures allow straightforward inspection of machine-level registers and data, such as the stack and caches. Conversely, because binary modification operates at such a low level, it is sometimes hard to specify what to instrument when semantics cannot be easily linked to program-level functions and basic blocks. Binary instrumentation is primarily supportive of active profiling, although the use of a virtual machine to execute code also provides a means to profile passively. From the perspective of profiling multi-threaded programs specifically, binary-code instrumentation can provide an effective means to intercept and instrument synchronization functions where source code is not available or when very fine-grained information is needed, such as access to cache state. Binary-code instrumentation also provides detailed access to memory and thus access to thread and process-control blocks useful in profiling multi-threaded applications. 4 Operating System and Middleware Profiling All applications rely upon services provided by the underlying OS. These services are primarily used to coordinate access to shared resources within the system. To measure service “requests” probes can be placed directly within the OS code that can record individual application access to provided services. Many COTS operating systems also provide a number of performance counters that explicitly track usage of shared resources. Data generated from these counters along with data from embedded probes can be usefully combined to form a more complete picture of application behavior. Another common form of shared processing infrastructure is distributed computing middleware, such as OMG’s CORBA and Microsoft’s .NET, which provide common services, such as location transparency and concurrency management. Distributed computing middleware often provides a number of “hook points” that are accessible to users. These hooks provide placeholders for adding probe functionality that can be used to measure events typically hidden deeper within the middleware. This section first discusses techniques that can be used to place probes into OS services and how one can combine this information with data generated from OS-performance counters. We then discuss the general practices of distributed-application monitoring using the services available in distributed computing middleware. 4.1 Inserting Probes into OS Services A typical OS process contains one or more threads and a shared memory space. Application code that is executed by threads within a process is free to access various OS resources and services, such as virtual memory, files, and network devices. Access to these resources and services is facilitated through APIs that are provided by system libraries. Each thread in the system executes in either user space or kernel space, depending upon the work that it is doing at that given time. Whenever a thread makes a system call, it transitions (e.g., via a trap) into kernel mode (Soloman, 1998; Beck, et al., 1999). Calls to system calls for thread management (e.g., thread creation, suspension, or termination) and synchronization (e.g., mutex or semaphore acquisition) will often incur a transition to kernel mode. System-call transitioning code therefore provides a useful interception point at which process activity can be monitored and a profile of system resource use can be extracted on a per-thread basis. Figure 7 shows the use of this so-called “inter-positioning” technique where libraries are built that mimic the system API. These libraries contain code that records a call event and then forward calls to the underlying system library. Compiled Binary Running Process Instrumented Library System Library User Space Kernel Space Figure 6. Process Systems calls “Intercepted” by Profiling Library The threadmon (Cantrill, 1997) tool uses inter-positioning to insert trace code between the user-level threads library and the application by redefining many of the functions that the library uses internally to change thread state. This technique is also used by VPPB (Broberg, 1999) to gather user-level thread information. In both approaches, data obtained by user library inter-positioning is integrated with data collected from other OS services, such as the UNIX /proc file system or kstat utility. The threadmon and VPPB tools both target the Solaris OS and therefore rely upon Solaris-specific system utilities, such as memory mapping of /dev/kmem to access the kernel. Cantrill (1997) and Broberg (1999) have also used another tool known as Trace Normal Form (TNF) (Murayama, 2001). This tool generates execution event traces from the Solaris kernel and user processes. Solaris provides an API for inserting TNF probes into the source code of any C/C++ program. A TNF probe is a parameterized macro that records argument values. The code excerpt below shows how C macro probes can be inserted at the beginning and end of critical code to record the absolute (wall-clock) time required for the code to execute. #include <tnf/probe.h> . . extern mutex_t list_mutex; . . TNF_PROBE_1(critical_start, "critical section start", "mutex acquire", tnf_opaque, list_lock, &list_mutex) mutex_lock(&list_mutex); . . /* critical section code */ . . mutex_unlock(&list_mutex); TNF_PROBE_1(critical_end, "critical section end", "mutex release", tnf_opaque, list_lock, &list_mutex) These probes can be selectively activated dynamically at run time. Events are recorded each time a probe is executed. Each probe automatically records thread-specific information, such as the thread identifier, but it may also record other data related to the state of the application at the time the event was triggered. Event records are written to a binary file that is subsequently parsed and analyzed by an offline process. The Solaris kernel also contains a number of TNF probes that can record kernel activity, such as system calls, I/O operations, and thread state change. These probes can be enabled/disabled using a command line utility known as prex (Murayama, 2001). Data records from the probes are accumulated within a contiguous portion of the kernel’s virtualaddress space and cannot be viewed directly. Another utility that runs with administrator privileges can be used to extract the data and write it to a user file. This data can then be correlated with other user-level data to provide a clear understanding of the behavior of the application run. The probe-based technique described above provides a detailed view of the running state of the application. Behavioral data details call counts, timing information, and resource use (thread and system state). There are some drawbacks to this type of approach, however, including: • The solution is not portable because it depends on Solaris features that are not available on other operating systems. • It requires a considerable amount of development effort because thread libraries must be modified. • Applications must be separately built and linked for profiling. • Tools that are used to collect the data like TNF or kstat may require lengthy setup and configuration. 4.2 Microsoft Windows Performance Counters Other operating systems have comparable features that can be used to get comparable data-defining application behavior. For example, Microsoft Windows provides performance counters (Microsoft, 2007a) that contain data associated to the running system. Windows provides a console that can be used to select certain specific counters related to specific processes. Once selected, the values of these counters will be displayed on the console at regular intervals. Table 5 shows example counters that are available. Category Description Sample Counters Process Provides data related to each process. % Processor Time, % User Time, IO activity, Page Faults etc. Processor Provides information about the overall machine. % Processor time, % User Time, %Idle Time etc. Memory Provide data related to the memory of the system. Available Bytes, #Page Faults/sec, #Page Reads/sec etc. Threads Provides data on the threads in the system. # of Context Switches/sec, Thread State, Thread Wait Reason etc. Table 5. Performance Counters Provided by the Windows Operating System Windows stores the collected values in the registry, which is refreshed periodically. Developers typically retrieve the data from the registry directly or use an API known as Performance Data Helper (Microsoft, 2007; Pietrik, 1998). Alternatively, the Microsoft .NET framework provides the System.Diagnostics namespace that facilitates access to all the counters from within a .NET application. Windows performance counters can be used to acquire data related to the running system, which can be correlated with a particular application run. These counters give an external view of the application, however, and there is no straightforward method of mapping counter values to logical application events. To more closely inspect a running application, therefore, instrumentation is needed within the application itself to record logical events and combine them with data generated through performance counters. 4.3 Distributed System Monitoring A distributed application consists of components spread over a network of hosts that work together to provide the overarching functionality. The complexity of distributed applications is often considerably greater than a stand-alone application. In particular, distributed applications must address a number of inherent complexities such as latency, causal ordering, reliability, load balancing, and optimal component placement, that are either absent from (or less complicated in) stand-alone applications. The analysis and profiling of distributed applications involves monitoring key interactions and their characteristics along with localized functionality occurring within each component. 4.3.1 Monitoring of Component-Based Systems (MCBS) MCBS (Li, 2002) is a middleware-based monitoring framework that can be used to capture application semantics, timing latency, and shared resource usage. The MCBS approach recreates call sequences across remote interfaces. Probes are instrumented automatically through the Interface Description Language (IDL) compiler, which directly modifies the generated stubs and skeletons that record function entry and return, as shown in Figure 7. Instrumented Probes Client Stub Skeleton Server Instrumented Probes Figure 7. MCBS Stubs and Skeletons are Instrumented with Probes Along with tracking interactions, the MCBS-modified stubs and skeletons also record all transactions (as a call sequence), parameters (e.g., in, in/out), and return values. Event data is recorded to a log and a unique identifier assigned so that the scenario/call chain can be identified later. This identifier is generated at the start probe and is propagated through the calling sequence via thread-specific storage (Schmidt, 2000). When each new interface is invoked, the stub receives the identifier from the thread-specific storage, creates a record with it, and stores a number identifying its position in the call chain. After control returns to the caller stub, the last record is generated. Hence, the call chain is recorded and mapped across threads. Whenever a new thread is created by the user application code the parent thread identifier is stored along with the new thread identifier, which helps identify the actual call chain in cases where threads are spawned by user-application code (i.e., by tracking parental hierarchy). Event data is stored in a memory buffer during application execution and is dumped to a file regularly as the buffer becomes full. An offline data collector picks up the different files for the different processes and loads it in a database. The analyzer component processes the data in the database and forms the entire call graph. The end-to-end timing latency of call scenarios is measured by noting the time at the client stub when the call is made and again when the call returns from the server. The latency is measured from the difference of these two timestamps. The overhead due to the interference of these probes is measured and tabulated against normal non-instrumented operation (Li, 2002). Table 6 shows performance data for a sample application. The sample scenarios are known to have deterministic functionality, i.e., they perform the same set of actions every time they run, so multiple system runs can be compared together. To minimize measurement overhead, only specific components of the application are monitored. This selection process can be done in two ways: • Statically prior to executing, where monitored components are selected and the application is then run. The application must be stopped and restarted if the selected set of components changes. • Dynamically while the application is running, where the monitored components can be selected at runtime. Dynamic selection helps developers focus on problem area and analyze it without incurring overhead due to measurement of other components. Function Average (msec) Standard Deviation (msec) Average (msec) Standard Deviation (msec) Interference EngineController::print 1.535 0.158 1.484 1.288 3.4% DeviceChannel:;is_supplier_set 1.865 0.054 1.236 0.025 50.9% IO::retrieve_from_queue 10.155 0.094 9.636 0.094 5.4% GDI::draw_circle 95.066 10.206 85.866 11.342 10.7% RIP::notify_downstream 13.831 2.377 11.557 0.381 19.7% RIP::Insert_Obj_To_DL 2.502 0.141 1.879 0.127 33.2% IO::push_to_queue 13.626 0.298 13.580 2.887 0.3% UserApplication::notified 0.418 0.04 0.282 0.099 48.3% Render::deposit_to_queue 0.529 0.097 0.358 0.010 47.8% Render::render_object 7.138 2.104 6.280 0.074 13.6% Render::retrieve_from_queue 0.501 0.040 0.318 0.010 57.6% Table 6. Overhead of Instrumentation Due to Probes Inserted in Stubs and Skeletons Li (2002) has implemented both approach and shown that static selection is less complex than dynamic selection because dynamic selection needs to take care of data inconsistency, which can occur if a component proc- ess receives an off event (whereby monitoring is stopped) while it runs. In this case, selection must be deferred until the system reaches a steady state. Steady state will vary from application to application and is thus hard to identify in generically. 4.3.2 OVATION OVATION (Object Computing Incorporated, 2006; Gontla, Drury, & Stanley, 2003) is a distributed monitoring framework that uses similar concepts as the MCBS framework, but it is targeted for CORBA middleware, such as TAO (Schmidt, Natarajan, Gokhale, Wang, & Gill, 2002) and JacORB (Brose, 1997). It therefore uses CORBA Portable Interceptors to insert probes. Portable Interceptors are based on the Interceptor pattern (Schmidt, 2000), which allows transparent addition of services to a framework and automatic triggering of these services when certain events occur. Whenever a CORBA client calls a server component, therefore, client stub and server skeleton interceptors are invoked, which record the event. These interception points also occur in the reverse order when the call returns from server to client. OVATION thus provides a more transparent and standard than the non-standard way of inserting probes into the stub and skeleton code used by MCBS. OVATION provides a number of pre-defined probes, such as: • Snooper Probe, which captures the CORBA end-to-end invocation path. Provides such things as request name, arguments, request start time, end time and the threads and the processes to which it belongs. • Milestone Probe, which permits the manual demarcation of specific events in the application code. • Trace Probe, which is used to capture information about the other non-CORBA, C++ object method calls. It also allows users to add their own probes to the monitoring framework, thereby allowing application developers to monitor certain application-specific characteristic without changing their source code. OVATION also provides mechanisms that allow applications to enable or disable these probes transparently. OVATION re-creates the dynamic-system-call graph among components in a given scenario, along with latency measurement. OVATION generates log files during program execution that contain information detailing processes, threads and objects involved in the interaction. The OVATION visualizer transforms the log file into a graphical representation of the recorded remote object interactions. The distributed-system monitoring tools described above help monitor distributed application behavior by recreating call graphs along with latency information for application traces. This capability is helpful because it simplifies the generation and collection of distributed application data so it can analyzed in detail. For example, (Li, 2002) describes how shared-resource-use data, such as processor consumption or heap-memory use in a particular application run, can help measure performance, devise capacity plans, and guide componentplacement algorithms. One disadvantage of these tools is that they cannot follow local procedure calls, so a developer cannot track local application events. It may therefore be necessary to combine distributed monitoring tools with other application profiling tools, such as threadmon described in Section 4.1. As a result, the entire profiling process may become unduly complicated because both sets of tools must be configured in a single run and there may be subtle interdependencies, such as conflicts in thread-library instrumentation used by local techniques, such as threadmon (Cantrill, 1997) and MCBS (Li, 2002). 5 Virtual Machine Profiling With the rebirth of virtual machines (VMs), such as the Java Virtual Machine and the Microsoft Common Runtime Language (CLR), the paradigm of application development and deployment has changed from the traditional architecture of applications interacting directly with the underlying OS. Figure 8 illustrates a typical VM-based application architecture where each user application is layered above the VM. User Application User Application User Application Virtual Machine Virtual Machine Virtual Machine Operating Sytem Hardware Figure 8. Applications Running on Virtual Machine The use of VMs to run managed programs helps make profiling more portable. For example, techniques like dynamic instrumentation of complete binaries (discussed in Section 3) for VM platforms is more straightforward because the application runs within the context of the VM and is thus easier to access and profile, and generated bytecode (Gosling, 1995) is standardized, portable, and more straightforward to instrument. In general, profiling techniques, such as sampling and instrumentation, remain the same in a VM. There are a number of ways, however, in which these techniques can be used. The main factors that affect a particular method include (1) implementation difficulty, (2) overhead incurred, and (3) level of detail in the output. This section describes different methods used for VM profiling and compares and contrasts the pros and cons of each. 5.1 Virtual Machine Sampling Sampling techniques typically result in less overhead than instrumentation techniques because sampling involves recording the program-counter value at regular (usually fixed) intervals, rather than using embedded code snippets into the application program at various points to record events. The corresponding program counter values (i.e., memory addresses) associated with each method are identified a priori and stored in a search structure. When the application runs on the VM, the program counter for each thread is recorded at regular intervals and stored with a processor timestamp. Once profiling is complete, the recorded data is analyzed, the number of invocations on each method counted, and the time spent executing each call calculated. Despite being relatively lightweight, however, sampling-based profiling methods are susceptible to certain problems (Subramaniam, 1994), including: • Straddling effect of counters - the initial analysis to segregate the bytecode for different methods will be approximate, causing inconsistent results. • Short sub-methods - short-lived calls that take less time than the sampling frequency may not be recorded at all. • Resonance effects - the time to complete a single iteration of a loop can coincide with the sampling period, which may sample the same point each time, while other sections are never measured. These problems can be avoided by using techniques described in (Subramaniam, 1994). To obtain a consistent picture of application behavior, however, a significant number of runs must be performed. This number will again vary from application to application, so the sampling period also may need to be configured for a particular application. Another method of sampling is described by (Binder, 2005). This approach does not check the program counter at regular intervals. Instead, a snapshot of the call stack is recorded by each thread after a certain number of bytecodes are executed. The motivation for this approach is that bytecode counting is a platform-independent method of resource accounting (Binder, 2001; Binder, 2004). Bytecode counting can also be done without relying on more low-level, platform-dependent, utilities to acquire resource usage data, which make it more portable and easier to maintain. The work in (Binder, 2005) is an example of bytecode counting implemented by statically instrumenting bytecode. 5.2 Profiling via VM Hooks A VM hook is a previously defined event, such as method entry/exit or thread start/stop, that can occur within the context of a running application. The profiling agent implements callback methods on the profiling interface and registers them with VM hooks. The VM then detects the events and invokes the corresponding callback method when these events occur in the application. It is straightforward to develop profilers based on VM hooks because profiler developers need only implement an interface provided by the VM and need not worry about the complications that can arise due to interfering with the running application. Although the VM and profiling agent provide the monitoring infrastructure, profiler developers are responsible for certain tasks, such as synchronization. For example, multi-threaded applications can fire multiple instances of the same event simultaneously, which will invoke the same callback method on the same instance of the profiling agent. Callbacks must therefore be made reentrant via synchronization mechanisms, such as mutexes, so the profiler internal state is not compromised. The Microsoft Common Language Runtime (CLR) profiler and the Java Virtual Machine Tool Interface (JVMTI) are examples of VM profilers that that support VM hooks, as discussed below. 5.2.1 CLR Profiler The CLR Profiler (Hilyard, 2005) interface allows the integration of custom profiling functionality provided in the form of a pluggable dynamic link library, written in a native language like C or C++. The plug-in module, termed the agent, accesses profiling services of the CLR via the ICorProfilerInfo2 interface. The agent must also provide an implementation of ICorProfilerCallback2 so that the CLR can call back the agent to indicate the occurrence of events in the context of the profiled application. At startup, the CLR initializes on the agent, which configures the CLR and establishes which events are of interest to the agent. When an event occurs, the CLR calls the corresponding method on the ICorProfilerCallback2 interface. The agent then collects the running state of the application by calling methods on ICorProfilerInfo2. Figure 9 below illustrates the series of communications triggered by each function entered in the CLR execution. In between processing function enter/exit call-backs, the profiling agent requests a stack snapshot so that it can identify the fully qualified method name and also the parent (i.e., the method from which the method being traced was call) of the call. Figure 9. Messaging Sequence of CLR Profiling Inspecting the stack to determine parental methods (and ultimately the call-chain) is a useful technique for disambiguating system calls. For example, this approach can be used to disambiguate different lock calls so that per-lock information (e.g., hold and wait times) can be correlated with different call sites in the source code. 5.2.2 JVMTI Profiler The JVMTI (Sun Microsystems Corporation, 2004) is similar to the CLR Profiler Interface in that it requires a plug-in, which is implemented as a dynamic link library using a native language that supports C. The JVM interacts with the agent through JVMTI functions, such as Agent_OnLoad(JavaVM *vm, char *options, void *reserved) and Agent_OnUnload(JavaVM *vm), which are exported by the agent. The JVM supplies a pointer, via the Agent_Onload() call, that the agent can use to get an instance of the JVMTI environment. The agent can use this pointer to access JVMTI features, such as reading the state of a thread, stopping/interrupting threads, obtaining a stack trace of a thread, or reading local variable information. The agent uses the SetEventCallbacks() method to pass a set of function pointers for different events it is interested. When events occur, the corresponding function is called by the JVM, which allows the agent to record the state of the application. The CLR and JVMTI profilers share many common features, such as events related to methods or threads and stack tracing ability. There are differences, however, e.g., the JVMTI provides application-specific details, such as the method name, object name, class name, and parameters, from the calls, whereas the CLR interface provides them in a metadata format and details can only be extracted using the metadata API, which is tedious. The JVMTI also provides additional features compared to the CLR, including monitor wait and monitor waited, which provide information related to thread blocking on critical sections of code. Research (Reiss, 2003; Reiss, 2005) has shown that the JVMTI interface incurs significant runtime overhead This overhead stems from the fact that profiling agent is written in a native language, so whenever there is a call to this agent there is the need to make JNI calls (Sun Microsystems Corporation, 2002). JNI calls can incur significant overhead because they perform actions like saving registers, marshaling arguments, and wrapping objects in JNI handles (Dmitriev, 2002). This overhead may not be acceptable for some applications, so explicit bytecode instrumentation may be a solution that has less overhead because it does not require the use of JNI. 5.3 Bytecode Instrumentation Although sampling and hook-based instrumentation can be performed with relatively little overhead, the extent of the information collected is limited and often insufficient to build application-level detail. Bytecode instrumentation inserts bytecode that performs application tracing within compiled code. In this approach, profiler developers redefine classes they need to profile by replacing the original bytecode with instrumented bytecode that contains logging actions at the occurrence of specified events. This approach enables the capture of application-specific events, such as transaction completion or data regarding critical sections of the application that may not be possible using only the standard events provided by the profiler interface discussed in Section 5.3. Bytecode instrumentation therefore has less overhead and greater flexibility the profiler interface, though it can also be more complex. There are several types of bytecode instrumentation, including: • Static instrumentation, which involves changing the compiled code offline before execution i.e., creating a copy of the instrumented intermediate code. Many commercial profilers, such as OptimizeIt (Borland 2006), work this way. Static instrumentation has also been implemented by Reiss (2003) and later extended in (Reiss, 2005). • Load-time instrumentation, which calls the agent before loading each class, and passes it the bytecode for the class that can be changed by the agent and returned. The JVMTI/CLR profiler interfaces are examples of load-time instrumentation. • Dynamic instrumentation, which works when the application is already running and also uses a profiler interface (Dmitriev, 2002). The agent makes a call to the VM passing it the new definitions of the classes that are installed by the VM at runtime. As discussed in Section 3, dynamic instrumentation supports “fix and continue” debugging instead of exiting, recompiling, and restarting. It also helps to reduce application overhead by enabling developers to (1) pinpoint specific regions of code that are experiencing performance problems at runtime and (2) instrument the classes’ involved, rather than instrumenting the entire application. Instrumented classes can be replaced with the original ones after sufficient data is collected. The gathered data can be analyzed offline, the problem fixed, and the classes can be replaced at runtime. Dynamic instrumentation of bytecode is more straightforward than dynamic instrumentation of low-level machine instructions (as described in Section 3). It can also be more portable across operating systems because it uses bytecode. There is a method call provided by the JVMTI known as RedefineClasses() that is called by a profiler agent to insert the “new” bytecode of the class. When this method is called, the JVM performs all the steps needed to load a class, parse the class code, create objects of the class, and initializes them. After these steps are complete, the JVM performs hot-swapping by suspending all threads and replacing the class, while ensuring that all pointers are updated to point to the new object (Dmitriev, 2001). These dynamic instrumentation activities can incur significant overhead in production environments and thus must be accounted for during dynamic instrumentation. Current research is addressing this problem by optimizing the swapping method so that bytecode replacement can be done at the finer-grained method level, rather than at the coarser-grained class level (Dmitriev, 2002). Similar techniques are also being explored on the .NET platform by (Vaswani, 2003). A number of tools have been developed to help instrument bytecode, much like the API for Pin described in Section 3. Examples of these tools include BIT (Lee, 1997) and IBM’s Jikes Bytecode Toolkit (IBM Corporation, 2000). These tools shield application developers from the complexity of bytecode by providing an API that can be used to parse the bytecode and change it. The three bytecode instrument techniques described above incur similar overhead, due to the execution of instrumented code. Although dynamic bytecode instrumentation is the most flexible approach, it also has several drawbacks, including: • It is more complex and error-prone, than static and load time instrumentation, especially because it allows bytecode modification at runtime. • Dynamic instrumentation requires creating ‘new’ objects of the ‘new’ classes corresponding to all ‘old’ objects in the application, initializing their state to the state of the old object, suspend the running threads, and switching all pointers to the ‘old’ objects to the ‘new’ objects. This replacement process is complicated, e.g., application state may be inconsistent after the operation, which can cause incorrect behavior. • Static and load-time instrumentation are generally easier to implement than dynamic instrumentation because they need not worry about the consistency of a running application… Dynamic instrumentation has a broader range of applicability, however, if done efficiently. Current research (Dmitriev, 2004;Dmitriev, 2002) is focusing on how to make dynamic instrumentation more efficient and less complicated. 5.4 Aspect-Oriented Techniques used for Instrumentation Although explicit bytecode instrumentation is more flexible and incurs less overhead than VM hooks, the implementation complexity is higher because developers must be highly skilled in bytecode syntax to instrument it effectively without corrupting application code. Aspect Oriented Programming (AOP) helps remove this complexity and enables bytecode instrumenting at a higher level of abstraction. Developer can therefore focus on the logic of the code snippets and the appropriate insertion points, rather than wrestling with low-level implementation details (Davies, Huismans, Slaney, Whiting, & Webster, 2003). Relevant AOP concepts include (1) join-points, which define placeholders for instrumentation within the application code, (2) point-cuts, which identify a selection of join-points to instrument, and (3) advice, which specifies the code to be inserted at the corresponding join-point. AspectWerkz (Boner, 2003) is a framework that uses AOP to support static, load-time, and dynamic (runtime) instrumentation of bytecode. The pros and cons of the various techniques are largely similar to that discussed in Section 5.4. There are also other pros and cons affecting the use of AOP, which we discuss below. The AOP paradigm makes it easier for developers to insert profiling to an existing application by defining a profiler aspect consisting of point-cuts and advice. The following excerpt illustrates the use of AspectWerkz to define join-points before, after, and around the execution of the method HelloWorld.greet(). The annotations in the comments section of the Aspect class express the semantics e.g., “@Before execution (* <package_name>.<class_name>.<method_name>)” means the method will be called before the execution of the <method_name> mentioned. //////////////////////////////////////////////////////////// // package testAOP; import org.codehaus.aspectwerkz.joinpoint.JoinPoint; public class HelloWorldAspect { /** * @Before execution(* testAOP.HelloWorld.greet(..)) */ public void beforeGreeting(JoinPoint joinPoint) { System.out.println("before greeting..."); } /** * @After execution(* testAOP.HelloWorld.greet(..)) */ public void afterGreeting(JoinPoint joinPoint) { System.out.println("after greeting..."); } /** * @Around execution(* testAOP.HelloWorld2.greet(..)) */ public Object around_greet (JoinPoint joinPoint) { Object greeting = joinPoint.proceed(); return "<yell>" + greeting + "</yell>"; } } Advice code can be written in the managed language, so there is no need to learn the low-level syntax of bytecode because the AOP framework can handle these details. The bulk of the effort therefore shifts to learning the framework rather than bytecode/IL syntax, which is advantageous because these frameworks are similar even if the target application language changes, e.g., from Java to C#. Another advantage is the increased reliability and stability provided by a proven framework with dedicated support, e.g., developers need not worry about problems arising with hot-swap or multiple threads being profiled because these are handled by the framework. Some problems encountered by AOP approaches are the design and deployment overhead of using the framework. AOP frameworks are generally extensive and contain a gamut of configuration and deployment options, which may take time to master. Moreover, developers must also master another framework on top of the actual application, which may make it hard to use profiling extensively. Another potential drawback is that profiling can only occur at the join-points provided by the framework, which is often restricted to the methods of each class, i.e., before a method is called or after a method returns. Application-specific events occurring within a method call therefore cannot be profiled, which means that non-deterministic events cannot be captured by AOP profilers. For a specific case, therefore, the decision to choose a particular profiling technique depends upon application requirements. The following criteria are useful to decide which approach is appropriate for a given application: • Sampling is most effective when there is a need to minimize runtime overhead and use profiling in production deployments, though application-specific logical events may not be tracked properly. • The simplest way to implement profiling is by using the JVMTI/CLR profiling interface, which has the shortest development time and is easy to master. Detailed logical events may not be captured, however, and the overhead incurred may be heavier than bytecode/IL instrumentation. • Bytecode/IL instrumentation is harder to implement, but gives unlimited freedom to the profiler to record any event in the application. Implementing a profiler is harder than using the JVMTI/CLR profiling interface, however, and a detailed knowledge of bytecode/IL is required. Among the different bytecode/IL instrumentation ways, complexity of implementation increases from static-time instrumentation to loadtime to dynamic instrumentation. Dynamic instrumentation provides powerful features, such as “fix and continue” and runtime problem tracking. • The use of an AOP framework can reduce the development complexity and increase reliability because bytecode/IL need not be manipulated directly. Conversely, AOP can increase design and deployment overhead, which may make it unsuitable for profiling. Moreover, application-level events may be hard to capture using AOP if the join-points locations are limited. 6 Hardware-based Profiling Previous sections have concentrated on modifications to program code (e.g., via instrumentation) or code that implements the execution environment (e.g., VM profiling). This section focuses on hardware-profiling techniques that collect behavioral information in multi-threaded systems. Hardware profiling is typically reserved for embedded and safety-critical system where understanding and ensuring system behavior is of utmost importance. Although hardware profiling can be relatively costly, it offers the following advantages over software profiling solutions: • Non-intrusive data collection. Behavioral data can be collected with little or no impact on normal execution of the target system. • Support for fine-grained data collection. High frequency data can be precisely collected at speeds typically up to the processor/bus clock speeds. • Off-chip inspection capability. Elements of behavior, such as bus and cache interconnect activity, that do not propagate directly into a general-purpose CPU can be inspected. Hardware profiling is particularly advantageous for analyzing certain types of system behavior (such as memory cache hits/misses) that are not easily inspected through software means. Nevertheless, while hardware profiling excels at inspection of fine-grained system events, deriving higher-level measures can be harder. For example, using a hardware profiler to determine the level of concurrency in a system would be hard. This section describes the two main categories of hardware-based profiling solutions: on-chip performance counters and onchip debugging/in-circuit emulation interfaces. 6.1 On-chip Performance Counters On-chip debugging/profiling interfaces are specialized circuitries that are added to a microprocessor to collect events and measure time. Modern COTS processors provide on-chip performance monitoring and debugging support. On-chip, performance-monitoring support includes selectable counting registers and timestamping clocks. The Intel Pentium/Xeon family of processors and the IBM PowerPC family of processors both provide these performance monitoring features (Intel Corporation, 2006a; IBM Corporation, 1998). For example, the Intel Xeon processor provides one 64-bit timestamp counter and eighteen 40-bit-wide Model Specific Registers (MSR) as counters.1 Each core (in a multi-core configuration) has its own timestamp counter and counter registers. The timestamp counter is incremented at the processor’s clock speed and is constant (at least in later versions of the processors) across multiple cores and processors in an SMP environment. Timestamp counters are initially synchronized because each is started on the processor RESET signal. Timestamp counters can be written to later, however, potentially get them out of sync. Counters must be carefully synchronized when accessing them from different threads that potentially execute on different cores. The performance counters and timestamp MSRs are accessed through specialized machine instructions (i.e., RDMSR, WRMSR, and RDTSC) or through higher-level APIs such as the Performance Application Programming Interface (PAPI) (London, K., Moore, S., Mucci, P., Seymour, & K., Luczak, R. 2001). A set of control registers are also provided to select which of the available performance monitoring events should be maintained in the available counter set. The advantages of using on-chip performance counters are (1) they do not cost anything in addition to the off-the-shelf processor and (2) they can be used with a very low overhead. For instance, copying the current 64-bit timestamp counter into memory (user or kernel) through the Intel RDTSC instruction costs less than 100 cycles. Countable events on the Intel Xeon processor include branch predictions, prediction misses, misaligned memory references, cache misses and transfers, I/O bus transactions, memory bus transactions, instruction decoding, micro-op execution, and floating-point assistance. These events are counted on a per-logical core basis, i.e., the Intel performance counter features do not provide any means of differentiating event counts across different threads or processes. Certain architectures, however, such as the IBM PowerPC 604e (IBM Corporation, 1998), do provide the ability to trigger an interrupt when performance counters negate or wrap-around. This interrupt can be filtered on a per processor basis and used to support a crude means of thread-association for infrequent 1 Note the different processor models have a different number of performance counters available. events. On-chip performance counters are not particularly useful in profiling characteristics specific to multi-threaded programming (such as those listed in Table 2). Nevertheless, on-chip timestamp collection can be useful for measuring execution time intervals. For example, measurement of context switch times of the operating systems can be easily done through the insertion of RDTSC into the OS-kernel switching code. Coupling timestamp features with compiler-based instrumentation (as described in Section 3) can be an effective way to measure lock wait and hold times. 6.2 On-chip Debugging Interfaces and In-circuit Emulators (ICE) Performance counters are only useful for counting global events in the system. Additional functionality is therefore needed to perform more powerful inspection of execution and register/memory state. One way to provide this functionality is by augmenting the “normal” target processor with additional functionality. The term in-circuit emulator (ICE) refers to the use of a substitute processor module that “emulates” the target microprocessor and provides additional debugging functionality. ICE modules are usually plugged directly into the microprocessor socket using a specialized adapter, as shown in Figure 10. Many modern microprocessors, however, provide explicit support for ICE, including most x86 and PowerPC-based CPUs. A special debug connector on the motherboard normally provides access to the on-chip ICE features. Figure 10. Example ICE Adapter and ICE Module Two key standards define debugging functionality adopted by most ICE solutions; JTAG (IEEE, 2001) and the more recent Nexus (IEEE-ISTO, 2003). The Nexus debugging interface is a super-set of JTAG and consists of between 25 and 100 auxiliary message-based channels that connect directly to the target processor. The Nexus specification defines a number of different “classes” of support that represent different capability sets composed from the following sets: • Ownership Trace Messaging (OTM), which facilitates ownership tracing by providing visibility of which process identity (ID) or operating system task is activated. An OTM is transmitted to indicate when a new process/task is activated, thereby allowing development tools to trace ownership flow. For embedded processors that implement virtual addressing or address translation, moreover, an OTM is also transmitted periodically during runtime at a minimum frequency of every 256 Program/Trace messages. • Program Trace via Branch Trace Messaging (BTM), where messages are triggered for each change in program flow discontinuity as a result of either a branch decision or an exception. Control flow can be correlated to program code, where the code is static. BTM messages include timestamp information and the full target-branch address. Thread/task ownership can be correlated from the last received OTM message. • Data Trace Messaging (DTM), where a minimum of two trace windows define the start and end memory addresses that should be monitored. DTM messages are dispatched on each read and write of memory in the defined range. Depending on the type of DTM message, a timestamp, the data value read/written, the address of memory access, the current mapped page, and a control flow association are included. • Runtime System Memory Substitution via Memory Substitution Messaging (MSM), which has the ability to substitute portions of memory with new code passed from the debugging host via the Nexus interface. Triggers for substitution are exit, reset, and watchpoints. • Signal Watchpoint and Breakpoint Events, which are used to indicate that specific instruction addresses or data addresses (conditional) have been accessed. Watchpoints are a variation of breakpoints that do not halt the target processor. Both watchpoints and breakpoints can be set to OS and runtime library functions of interest, e.g., thread control and synchronization. Nexus and JTAG-compatible devices can be chained together and read from the same debugging host, which is particularly useful for SMP and multi-core environments, where the profiling needs to collate events from different processors. On-chip debugging interfaces and ICE solutions provide a primitive means for extracting low-level behavior of a program. They are particularly useful at collecting “raw”, low-level details of execution, such as control flow and memory activity, that in turn can be used to assure absence of race conditions, deadlock, etc. For example, the following approach might be used to ensure that a program is free of race-conditions: • Identify address ranges for memory that are shared across one or more threads. • Identify addresses for synchronization locks and/or functions. • Establish data-write triggers for identified memory addresses and record triggered events over the execution of the program in a test run. • Ensure that the appropriate sequence of take lock, access memory (N times), release lock, is followed. Of course, because this type of profiling is dynamic, the properties can only be ensured for the states the program entered during the test. 7 Future Trends In our experience there is no single approach to system profiling that can address every need. We believe that the best approach is to use a combination of static and dynamic analysis to provide a more complete picture of system behavior. Static analysis can be used to explore all possible paths of execution and statistically proportion their execution likelihood. Likewise, dynamic analysis can be used to collect distributions of wallclock time for different portions of execution. We have used this technique in our own work in system behavior profiling for large-scale DoD applications with a reasonable degree of success. Even when both analysis techniques are combined, however, certain behavioral properties of large-scale software systems are still inherently hard to measure, including absence of deadlock and livelock conditions, effective parallelism, and worst-case execution time. These properties can often be assured to a given statistical probability, though both dynamic and static analyses are unable to provide absolute guarantees in all cases. Even techniques like explicit-state model checking can only provide guarantees in very small systems, where interaction with the external environment is well understood and controlled. Why are these properties so hard to measure accurately? We believe that the answer to this stems from sources of (apparent) non-determinism in today’s software systems. Deep causal chains and unpredictable interactions between threads and their environment lead to an incomprehensible number of behavior patterns. The openness of operating systems in their external interactions, such as networks, devices, and other processors, and the use of throughput-efficient-scheduling strategies, such as dynamic priority queues and task preemption, are the principal cause of such behavioral uncertainty. Real-time and safety-critical operating systems try to ensure higher levels of determinism by applying constraints on execution, such as offline scheduling and resource reservation. We believe that the continued move towards increasing the number of physical processing cores on a single CPU will provide a natural means of partitioning the behavior space and ensuring clear and analyzable interactions across units of execution. Nevertheless, both dynamic and static analysis tools will remain crucial to understanding the behavior of software systems developed now and in the future. 8 Concluding Remarks This chapter reviewed four approaches to analyzing the behavior of software systems via dynamic analysis: compiler-based instrumentation, operating system and middleware profiling, virtual-machine profiling, and hardware-based profiling. We highlighted the advantages and disadvantages of each approach with respect to measuring the performance of multi-threaded and SMP systems, and demonstrated how these approaches can be applied in practice. Table 7 summarizes our assessment of the utility of each approach with respect to key problems that arise in developing large-scale, multi-threaded systems. The number of dots in each category indicates how effective the approach is for measuring the corresponding characteristic. Compilerbased Instrumentation Operating System & Middleware Profiling Virtual Machine Profiling Hardware-based Profiling Synchronization overhead (e.g., cost of locking) Task latency & jitter Task execution quanta (i.e., time processor held by executing thread) Unsafe memory access (e.g., race conditions) Processor migration Deadlock and livelock Effective parallelism Priority inversion Worst-case execution time Table 7. Summary of Dynamic Profiling Capabilities The results in Table 7 show that dynamic profiling is particularly useful where fine-grained event data can be collected and used to derive characteristics of the running system. Dynamic analysis is weaker and less capable, where the behavioral characteristic depends on system-wide analysis such as the global thread state at a given point in time. It is therefore clear that runtime profiling alone is not sufficient to build up complete image of system behavior due to the “as observed” syndrome, i.e., dynamic analysis can only assure statistical “certainty” of behavior because it just collects behavioral data for a given execution trace. The alternative to dynamic analysis is static analysis, such as program analysis, model checking. The benefits of static analysis are its ability to (1) perform analysis without running the system (useful for pre-integration testing) and (2) allow the inspection of all theoretically possible (albeit less frequent) conditions. Although static analysis is promising in some areas, however, it also cannot present and predict a complete picture of behavior for large-scale systems. In particular, static-analysis techniques are limited in their practical applicability (e.g., scalability) and in their ability to relate to wall-clock time. Behavioral analysis technology will be increasingly important as the systems we build become larger, more parallel, and more unpredictable. New tools and techniques that strategically combine static and dynamic analysis, and that partition the system into well-defined “behavioral containers”, will be critical to the progression along this path. 9 References Baxter, I., (2004) DMS: Program Transformations for Practical Scalable Software Evolution. Proceedings of the 26th International Conference on Software Engineering, pp. 625-634. Beck, M., Bohme, H., Dziadzka, M., Kunitz, U., Magnus, R., & Verworner, D. (1999) Linux Kernel Internals (2nd Ed.) Addison Wesley Longman Publishing. Binder W. and Hulaas J. (2004) A portable CPU-management framework for Java. IEEE Internet Computing, October 2004, 8(5), pp.74-83. Binder W., Hulaas J, and Villaz A. (2001) Portable resource control in Java Proceedings of the 2001 ACM SIGPLAN Conference on Object Oriented Programming, Systems, Languages and Applications. 36(11), pp.139-155. Binder W. (2005) A portable and customizable profiling framework for Java based on bytecode instruction counting. In Third Asian Symposium on Programming Languages and Systems (APLAS 2005) Vol. 3780 Lecture Notes in Computer Science, Springer Verlag, pp.178-194. Boner J. (2004) AspectWerkz - Dynamic AOP for Java. Proceeding of the 3rd International Conference on Aspect-Oriented Development (AOSD 2004), March 2004, Lancaster, UK. Borland Software Corporation (2006), Borland Optimize-it Enterprise Suite [Computer software] Retrieved on 5 January 2007, http://www.borland.com/us/products/optimizeit/index.html Broberg, M., Lundberg, L., & Grahn, H. (1999) Visualization and Performance Prediction of Multithreaded Solaris Programs by Tracing Kernel Threads. Proceedings of the 13th International Parallel Processing Symposium, April 1999. Brose G. (1997) JacORB: Implementation and design of a Java ORB. Proceedings of IFIP DAIS’97, September. 1997, pp. 143–154. Bruening, D. L. (2004) Efficient, Transparent, and Comprehensive Runtime Code Manipulation. Unpublished doctoral dissertation, Massachusetts Institute of Technology. Buck, B., & Hollingsworth, J. K. (2000) An API for Runtime Code Patching. International Journal of High Performance Computing Applications, pp. 317-329. Cantrill, B., & Doeppner, T. W. (1997) Threadmon: A Tool for Monitoring Multithreaded Program Performance. Proceedings of the 30th Hawaii International Conference on Systems Sciences, pp. 253-265, January 1997. Clarke, E. M., Grumberg, O., & Peled, D. A. (2000) Model Checking. The MIT Press, Massachusetts Institute of Technology, Cambridge, Massachussetts. Collins, R. (1997) In-circuit Emulation: How the Microprocessor Evolved Over Time. Dr. Dobbs Journal, Septermber 97. Retrieved 5 January 2007 from http://www.rcollins.org/ddj/Sep97. Cordy, R., Halpern C., & Promislow, E. (1991) TXL: A Rapid Prototyping System for Programming Language Dialects. Proceedings of the International Conference on Computer Languages, 16(1), pp. 97-107. Davies J., Huismans, N., Slaney, R., Whiting, S., & Webster, M. (2003) An Aspect-Oriented Performance Analysis Environment. AOSD'03 Practitioner Report, 2003. Dmitriev M. (2002), Application of the HotSwap Technology to Advanced Profiling. Proceedings of the First Workshop on Unanticipated Software Evolution, held at ECOOP 2002 International Conference, Malaga, Spain, 2002. Dmitriev, M. (2001) Safe Evolution of Large and Long-Lived Java Applications. Unpublished Doctoral Dissertation, Department of Computing Science, University of Glasgow, Glasgow G12 8QQ, Scotland, 2001. Dmitriev, M. (2001) Towards Flexible and Safe Technology for Runtime Evolution of Java Language Applications. Proceedings of the Workshop on Engineering Complex Object-Oriented Systems for Evolution, In Association with OOPSLA 2001 International Conference, Tampa Bay, Florida, USA, 2001. Dmitriev M. (2004) Profiling Java Applications Using Code Hotswapping and Dynamic Call Graph Revelation. Proceedings of the 4th international workshop on Software and Performance pp. 139-150, Redwood Shores, California, 2004. Fernandez, M., & Espasa, R. (1999) Dixie: A Retargetable Binary Instrumentation Tool. Workshop on Binary Translation, held in conjunction with the International Conference on Parallel Architectures and Compilation Techniques. Freund, S. N., & Qadeer, S. (2003) Checking Concise Specifications of Multithreaded Software. Technical Note 01-2002, Williams College. Gontla, P., Drury, H. & Stanley, K.(2003) An Introduction to OVATION - Object Viewing and Analysis Tool for Integrated Object Networks, CORBA News Brief, Object Computing Inc., May 2003. [Electronic media] Retrieved on 5 January 2007 http://www.ociweb.com/cnb/CORBANewsBrief-200305.html. Gosling J. (1995) Java intermediate bytecodes. ACM SIGPLAN workshop on intermediate representations (IR'95). Papers from the 1995 ACM SIGPLAN workshop on Intermediate representations, p.111-118, 23 January 1995, San Francisco, California, United States Greenhouse, A. (2003) A Programmer-Oriented Approach to Safe Concurrency. Unpublished doctoral dissertation, Carnegie Mellon University School of Computer Science. Grehan, R. (1995) BYTEmark Native Mode Benchmark, Release 2.0, [Computer software] BYTE Magazine. Hilyard, J. (2005) No Code Can Hide from the Profiling API in the .NET Framework 2.0 MSDN Magazine January 2005. Retrieved on 5 January 2007 from http://msdn.microsoft.com/msdnmag/issues/05/01/ CLRProfiler/ Hunt, G., & Brubacher, D. (1999) Detours: Binary Interception of Win32 Functions. Proceedings of the 3rd USENIX Windows NT Symposium. pp. 135-144. IBM Corporation (1998) PowerPC 604e RISC Microprocessor User’s Manual with Supplement for PowerPC 604 Microprocessor. Publication No. G522-0330-00. [Electronic media] Retrieved 4 January 2007 from http://www-3.ibm.com/chips/techlib/. IBM Corporation (2000) Jikes Bytecode Toolkit [Computer Software]. Retrieved on January 6 2007, from http://www-128.ibm.com/developerworks/opensource/. IBM Corporation (2003) Whitepaper: Develop Fast, Reliable Code with IBM Rational PurifyPlus. Retrieved 9 January 2007 from ftp://ftp.software.ibm.com/software/rational/web/whitepapers/2003/PurifyPlusPDF.pdf. IEEE (2001) IEEE Standard Test Access Port and Boundary-scan Architecture. IEEE Std. 1149.1-2001. IEEE-ISTO (2003) The Nexus 5001 Forum Standard for Global Embedded Processor Debug Interface, Version 2.0. [Electronic media] Retrieved 5 January 2007 from http://www.ieee-isto.org. Intel Corporation (2006a) Intel 64 and IA-32 Architectures Software Developer’s Manual. Vol. 3B, System Programming Guide, Part 2. Retrieved 4 January 2007 from www.intel.com/design/processor/manuals/253669.pdf. Intel Corporation (2006b) Intel’s Tera-Scale Research Prepares for Tens, Hundreds of Cores. Technology@Intel Magazine. Retrieved 4 January 2007 from http://www.intel.com/technology/magazine/computing/tera-scale-0606.htm. Jackson, D., & Rinard, M. (2000) Software Analysis: A Roadmap. Proceedings of the IEEE International Conference on Software Engineering, pp. 133-145. Kiczale, G., Hilsdale, E., Hugunin, J., Kersten, M., Palm, J., & Griswold, W. G. (2001) An Overview of AspectJ. Lecture Notes in Computer Science, 2072, pp. 327-355. Larus, J., & Schnarr, E. (1995) EEL: Machine-Independent Executable Editing. Proceedings of the ACM SIGPLAN Conference on Programming Language Designes and Implementation, pp.291-300. Lee, E. A. (2006) The Problem with Threads. IEEE Computer, Vol. 39, Issue 11, pp.33-42. Lee, H. B. (1997) BIT: Bytecode Instrumenting Tool, Unpublished MS thesis, University of Colorado, Boulder, CO, July 1997. Li, J. (2002) Monitoring of Component-Based Systems. Technical Report HPL-2002-25R1. HP Laboratories, Palo Alto, CA, USA. London, K., Moore, S., Mucci, P., Seymour, K., & Luczak, R. (2001) The PAPI Cross-Platform Interface to Hardware Performance Counters. Department of Defense Users’ Group Conference Proceedings, Biloxi, Mississippi, June 18-21, 2001. Luk, C., Cohn, R., Muth, R., Patil, H., Klauser, A., Lowney, G., Wallace, S., Reddi, V. J., Hazelwood, K. (2005) Pin: Building Customized Program Analysis Tools with Dynamic Instrumentation. Proceedings of the ACM SIGPLAN Conference on Programming Language Design and Implementation, pp. 190-200. Microsoft Corporation (2007a) Windows Server 2003 Performance Counters Reference, Microsoft TechNet. [Electronic media] Retrieved January 6, 2007, from http://technet2.microsoft.com/WindowsServer/en/library/3fb01419-b1ab-4f52-a9f809d5ebeb9ef21033.mspx?mfr=true Microsoft Corporation (2007b) Using the Registry Functions to Consume Counter Data. Microsoft Developer Network. [Electronic media] Retrieved on January 6, 2007 http://msdn2.microsoft.com/enus/library/aa373219.aspx Microsoft Corporation (2007c) Using the PDH Functions to Consume Counter Data. Microsoft Developer Network. [Electronic media] Retrieved on January 6, 2007 http://msdn2.microsoft.com/en-us/library/aa373214.aspx Miller, B.P., Callaghan, M.D., Cargille, J.M., Hollingsworth, J.K., Irvin, R.B., & Karavanic, K.L. (1995, December) The Paradyn Parallel Performance Measurement Tool. IEEE Computer, Vol. 28., Issue 11, pp. 37-46. Murayama J. (2001) Performance Profiling Using TNF. Sun Developer Network, July 2001. Retrieved on 4th January, 2007 from http://developers.sun.com/solaris/articles/tnf.html Nethercote, N. (2004) Dynamic Binary Analysis and Instrumentation. Unpublished doctoral dissertation, University of Cambridge, U.K. Nimmer, J. & Ernst, M. D. (2001) Static Verification of Dynamically Detected Program Invariants: Integrating Daikon and ESC/Java. Proceedings of the 1st International Workshop on Runtime Verification. Object Computing Incorporated (2006) A Window into your Systems. [Electronic media] Retrieved 4 January 2007 from http://www.ociweb.com/products/OVATION. Pietrik, M. (1998) Under the Hood. Microsoft Systems Journal, May 1998. Retrieved on 4th January 4, 2007, from http://www.microsoft.com/msj/0598/hood0598.aspx Reiss, S. P. (2005) Efficient monitoring and display of thread state in java. Proceedings of IEEE International Workshop on Program Comprehension, pp. 247.256, St. Louis, MO, 2005. Reiss, S. P. (2003) Visualizing Java in Action. Proceedings of the 2003 ACM Symposium on Software Visualization, pp.57. Rinard, M. (2001) Analysis of Multithreaded Programs. Lecture Notes in Computer Science, Vol. 2126, Springer Verlag, pp. 1-19. Romer, T., Voelker, G., Lee, D., Wolman, A., Wong, W., Levy, H., Bershad, B., & Chen, B. (1997) Instrumentation and Optimization of Win32/Intel Executables using Etch. Proceedings of USENIX Windows NT Workshop. Schmidt, D. C., Stal, M., Rohnert, H.,& Buschmann, F. (2000) Pattern-Oriented Software Architecture Patterns for Concurrent and Networked Objects. Wiley & Sons Publishing. Schmidt, D. C., Natarajan, B., Gokhale, G., Wang, N., & Gill, C. (2002) TAO: A Pattern-Oriented Object Request Broker for Distributed Real-time and Embedded Systems. IEEE Distributed Systems Online, Vol. 3, No. 2., February 2002. Soloman, D. A. (1998) Inside Windows NT. (2nd ed.) Microsoft Press, Redmond. Spinczyk, O., Lohmann, D., & Urban, M. (2005) Aspect C++: an AOP Extension for C++. Software Developer’s Journal, pp. 68-76. Srivastava, A., & Eustace A. (1994) ATOM: A System for Building Customized Program Analysis Tools. Technical Report 94/2, Western Research Lab, Compaq Corporation. Subramaniam, K., & Thazhuthaveetil, M. (1994), Effectiveness of Sampling Based Software Profilers. 1st International Conference on Reliability and Quality Assurance, pp. 1–5. Sun Microsystems Corporation (2004) JVM Tool Interface [Computer software] Retrieved on 5th January 2007 http://java.sun.com/j2se/1.5.0/docs/guide/jvmti/ Sun Microsystems Corporation (2002) The Java Native InterfaceProgrammer's Guide and Specification. [Electronic media] Retrieved on 14 January 14, 2007 http://java.sun.com/docs/books/jni/html/jniTOC.html Sutter, H. (2005) The Free Lunch is over: A Fundamental Turn Towards Concurrency in Software. Dr. Dobb’s Journal, Vol. 30, Issue 3. Sutter, H., & Larus J. (2005) Software and the Concurrency Revolution. ACM Queue Magazine, Vol. 3, No. 7. Vaswani, K. & Srikant Y. N. (2003) Dynamic recompilation and profile-guided optimizations for a .NET JIT compiler. In the Proceedings of the IEEE Software Special on Rotor .NET, volume 150, pp. 296-302. IEEE Publishing, 2003. Visser, E., (2001) Stratego: A Language for Program Transformation Based on Rewriting Strategies. Lecture Notes in Computer Science, 2051, Springer Verlag, pp. 357. Waddington, D. G., & Yao, B. (2005) High Fidelity C++ Code Transformation. Proceedings of the 5th Workshop on Language Descriptions, Tools and Applications, Edinburgh, Scotland, UK. Waddington, D. G., Amduka, M., DaCosta, D., Foster, P. & Sprinkle, J (2006) EASEL: Model Centric Design Tools for Effective Design and Implementation of Multi-threaded Concurrent Applications. Technical Document, Lockheed Martin ATL, February 2006. Wolf, F., & Mohr, B. (2003) Hardware-Counter Based Automatic Performance Analysis of Parallel Programs. Proceedings of the Mini-symposium on Performance Analysis, Conference on Parallel Computing (PARCO), Elsevier, Dreseden, Germany.