1
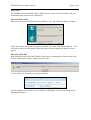
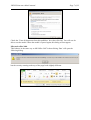
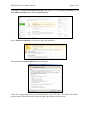
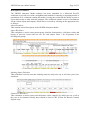
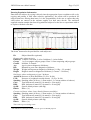
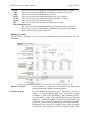
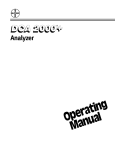
UKPDS Outcomes Model
User Manual
©
ISIS Innovation Ltd 2010
Version 1.3
21st January 2011
Produced by the University of Oxford
Diabetes Trials Unit (DTU) and
Health Economics Research Centre (HERC)
www.dtu.ox.ac.uk/outcomesmodel
UKPDS Outcomes Model manual
Page 2 of 32
Conditions of use and copyright
Software for the UKPDS Outcomes Model© ISIS Innovation Ltd 2010 is available to third
parties under license from Isis Innovation Ltd, the technology transfer company of the
University of Oxford, subject to the following copyright and conditions. No charge is made
to academic organisations but commercial organisations must pay an appropriate fee.
The University is a charitable foundation devoted to education and research, and in order to
protect its assets for the benefit of those objects, the University must make it clear that no
condition is made or to be implied, nor is any warranty given or to be implied, as to the
accuracy of this Tool, or that it will be suitable for any particular purpose or for use under
any specific conditions. Furthermore, the University disclaims all responsibility for the use
which is made of the Tool. However, nothing in this statement will operate to exclude or
restrict any liability which the University may have for death or personal injury resulting
from negligence. It is a further condition that the software obtained from this site is not
distributed further without the same conditions and copyright statements being imposed.
Those seeking to incorporate any part of the UKPDS Outcomes Model into other software
projects must seek the permission of the copyright holders before distribution or publication
of their software.
Licensing the software
To obtain a copy of the UKPDS Outcomes Model software and a license to use it, please
contact:
Brendan Spillane
Project Manager
Isis Innovation
Ewert House, Ewert Place
Summertown
Oxford. OX2 7SG
United Kingdom
Tel: +44 (0)1865 614423
Fax: +44 (0)1865 280831
Email: [email protected]
For all queries concerning the UKPDS Outcomes Model and its appropriate use please read
this manual and the web site FAQ (www.dtu.ox.ac.uk/outcomesmodel). If your question
remains unanswered, email [email protected]. For technical enquiries concerning
software installation, email [email protected].
Background
The UKPDS Outcomes Model is a computerised simulation designed to estimate Life
Expectancy, Quality Adjusted Life Expectancy and costs of complications in people with
type 2 diabetes. It uses the equations and algorithms published in the UK Prospective
Diabetes Study (UKPDS) paper 681 which should be read prior to using this software.
Caution should be applied if model results are extrapolated to populations that differ
1
A model to estimate the lifetime health outcomes of patients with Type 2 diabetes: the United Kingdom
Prospective Diabetes Study (UKPDS) Outcomes Model (UKPDS no. 68). PM Clarke, AM Gray, A Briggs,
AJ Farmer, P Fenn, RJ Stevens, DR Matthews, IM Stratton, RR Holman. Diabetologia 2004; 47:1747–1759
UKPDS Outcomes Model manual
Page 3 of 32
significantly from that included in the UKPDS or that include ethnic groups other than White
Caucasian, Afro-Caribbean or Asian-Indian.
The model was developed using data from patients with newly-diagnosed type 2 diabetes
who participated in the UKPDS 2 and were followed up for between six and twenty years. It
predicts likely outcomes using risk factors that include; age, sex, ethnicity, duration of
diabetes, height, weight, smoking status, total cholesterol, HDL cholesterol, systolic blood
pressure and HbA1c. By default, the model is able to forecast changes over time in smoking
status, total cholesterol, HDL cholesterol, systolic blood pressure and HbA1c risk factor
levels. However, if any or all of these risk factors have values available at any time points
simulated, the model can incorporate them.
The main outputs for the UKPDS Outcomes Model are estimates of Life Expectancy, Quality
Adjusted Life Expectancy and costs of complications, all with 95% confidence intervals and
with discounting applied if requested. Quality Adjusted Life Expectancy values can also be
listed for each year simulated for each subject. The model also outputs cumulative event rates
and long term history rates, intermediate outputs which the user may find useful.
Changes in Version 1.3
Corrections
a) The Smoking status check in the Standalone version has been corrected
b) The Amputation output in the Standalone version was being written to the IHD file
and this has been corrected
c) The Standalone version now produces cohort outputs
d) The smoking status for a patient is now estimated once per loop instead of once per
patient
New Features
a) Cumulative Event rate output for events has been replaced with Event rate and Long
term history rate
b) Diabetes Related death has been separated into a separate output sheet from Other
death
c) A new group column has been added to the Inputs sheet after the ID column. This
allows outputs of 2 patient groups to be compared. Enter 1 for all patients if not
dividing into groups. Please note that any input files previously used for the
Standalone model will need this column added.
d) The Input Checks have been combined into a single sheet
Changes in Version 1.2.1
Corrections
a) Corrected an issue on page 17 of this manual where the example incorrectly stated
that the age entered should be 60. The correct value is 59.
New Features
a) There is now an option to run the Standalone Implementation of the model without
user intervention from the command line and other suitable applications.
2
UKPDS 8. Study design, progress and performance. Turner RC, Holman RR, Matthews DR, Oakes SF,
Bassett PA, Stratton IM, Cull CA, Manley SE, Frighi V. Diabetologia 1991; 34: 877-890
UKPDS Outcomes Model manual
Page 4 of 32
Changes in Version 1.2
Bug Fixes
a) Incorrect handling of updated smoking status risk factor values has been fixed.
In version 1.1 past smokers (value 1) were treated as current smokers (value 2), and
current smokers were treated as a doubling of the smoking effect.
b) Updated risk factor values are now applied correctly at the end of the year stated,
rather than at the start as in version 1.1.
New Features
a) There is now an option to use any of 100 random number sequences. This allows
different random number sequences to be selected and exactly the same sequence to
be used repeatedly, as desired.
b) The 1000 bootstrap parameter sets are always used in the same sequence, with wrap
round to the first set if necessary. In version 1.2 the option to choose which bootstrap
parameter set is to be used at the start of a model run has been added.
c) Updated estimated annual risk factor levels generated by the model for each subject
are now provided on output worksheets for inspection or can to be copied to input
sheets for use in further model runs if desired.
d) A “pre-flight check” option ensures that all of the input data are present and within
acceptable ranges BEFORE the model is run.
e) Worksheet tabs have been coloured for ease of identification (PC version only) as
follows:
• Input worksheets -------------------Yellow
• Run worksheet----------------------Red
• Check worksheets ------------------Salmon
• Output worksheets -----------------Green
• Risk Factor Output worksheets --Pink
f) Input worksheets have been amended so that:
• Age is no longer checked against duration of diabetes
• Alphanumeric data can be used in the “ID” column.
g) Windows Users can now choose a desired location for the install and the shared core
dll is placed in the system folder.
h) In addition to the Microsoft Excel implementation of the UKPDS Outcomes Model a
standalone implementation that runs on Windows, Macintosh and Linux platforms has
now been provided. This implementation of the UKPDS Outcomes Model can handle
an unlimited number of subjects (See Standalone Implementation of the UKPDS
Outcomes Model on page 17) and does not require Microsoft Excel.
Installation
The UKPDS Outcomes Model is supplied on a CD containing 6 items, namely:
• ReadMe.txt
• UKPDS Outcomes Manual.pdf
UKPDS Outcomes Model manual
•
•
•
•
Page 5 of 32
UKPDS Outcomes Model Windows setup.exe
UKPDS Outcomes Model Macintosh.dmg
outcomes.tar.gz
Standalone Sample
The UKPDS Outcomes Model software is installed as follows. The first time the software is
used it will request a licence key to be entered. This can be found on the installation CD.
Once accepted this will not be asked for again.
Windows Installation
Double click or run the file “UKPDS Outcomes Model Windows setup.exe” to install the
UKPDS Outcomes Model software. A minimum of 3MB free space needs to be available on
windows system drive and a further 5MB in the installation folder. The setup program will
allow you to select a folder to install into. The following files are installed in the folder:
• UKPDSOutcomesModel1.3.xls is the Microsoft Excel™ workbook in which the
UKPDS Outcomes Model is embodied
• UKPDSOutcomesModel.exe is the standalone implementation of the UKPDS
Outcomes Model
• OutcomesCore13.dll which is installed in the windows system folder and must not be
renamed, moved or amended in any way
A link to the UKPDS Outcomes Model website is provided along with an uninstaller.
Macintosh Installation
Double click or run the file “UKPDS Outcomes Model Macintosh.dmg” to mount the disk
image. Install the Application by dragging it to the applications folder. The Microsoft Excel
implementation of UKPDS Outcomes Model is not currently available for the Macintosh
platform.
Linux Installation
Copy the “outcomes.tar.gz” and extract the installation files from the archive using the
following commands:
gunzip outcomes.tar.gz
tar xf outcomes.tar
Alternatively you may be able to double-click the archive and drag the outcomes folder to a
location of your choice. This folder contains five items, the application
“UKPDSOutcomesModel”, two folders “UKPDSOutcomesModel Libs” and “Resources”
which must be kept in the same folder as the application, and two example input files
“Sample.outcomes” and “Sample_inputs.csv”.
Test the application has been installed correctly by running it and selecting the example input
file "Sample.outcomes" using the "File->Open" menu option. The Microsoft Excel
implementation of UKPDS Outcomes Model is not currently available for the Linux
platform.
UKPDS Outcomes Model manual
Page 6 of 32
Excel Issues
The UKPDS Outcomes Model requires VBA macros in order to run the model. If they are
disabled then the software will not function.
Microsoft Office 2003
Start Excel, and open UKPDS Outcomes Model v1.3.xls. The following dialog will show
Check the ‘Always trust macros from this publisher’ box, then click ‘Enable Macros’. You
will now be able to run the model. When the model is opened again, this dialog will not
appear.
Microsoft office 2007
By default Microsoft office 2007 disables VBA macros. Attempting to run the model with
macros disabled will result in a dialog similar to this:
In office 2007 you will also see a message like this:
It will be displayed at the top of your worksheet. Clicking the ‘Options’ button opens the
following dialog box:
UKPDS Outcomes Model manual
Page 7 of 32
Check the ‘Trust all documents from this publisher’ box, then click OK. You will now be
able to run the model. When the model is opened again, this dialog will not appear
Microsoft office 2010
This behaves in the same way as MS Office 2007 in that clicking ‘Run’ will open the
following dialog:
but the security warning at the top of the page looks slightly different:
UKPDS Outcomes Model manual
Page 8 of 32
Click File. The Microsoft Office Backstage view appears. In the Security Warning area, on
the Enable Content button, click the down-arrow.
Select Advanced Options to learn more about the publisher.
The following Security Options dialog will appear
Check the ‘Always trust macros from this publisher’ box Click OK. You will now be able to
run the model. When the model is opened again, this dialog will not appear.
UKPDS Outcomes Model manual
Page 9 of 32
Description of software
The UKPDS Outcomes Model software has been embodied in a Microsoft Excel™
workbook to provide users with a straightforward method for entering or importing details of
populations to be evaluated, running the model, viewing the results and the ability to print or
export them easily to other software packages. The workbook contains a series of worksheets
for the various inputs and outputs, which can be accessed by clicking on the appropriate tab,
as follows:
About Worksheet
This contains a brief description of the UKPDS Outcomes Model.
Inputs Worksheet
This worksheet is used to enter patient group, baseline characteristics, risk factor values and
history of previous events with one row for each subject. Enter 1 for all patients if not
dividing into groups.
Smoking Status Worksheet
This worksheet is used to enter the smoking status by subject for any or all of the years to be
simulated.
Cholesterol Worksheet
This worksheet is used to enter total cholesterol values (mmol/l) by subject for any or all of
the years to be simulated. Ideally these should be from a CDC (Centre for Disease Control)
aligned assay.
UKPDS Outcomes Model manual
Page 10 of 32
HDL Worksheet
This worksheet is used to enter HDL cholesterol values (mmol/l) by subject for any or all of
the years to be simulated. Ideally these should be from a CDC aligned assay.
SysBP Worksheet
This worksheet is used to enter systolic blood pressure values (mmHg) by subject for any or
all of the years to be simulated.
HbA1c Worksheet
This worksheet is used to enter HbA1c values (%) by subject for any or all of the years to be
simulated. Ideally these should be from a DCCT (Diabetes Control and Complications Trial)
or NGSP (National Glycohemoglobin Standardization Programme) aligned assay.
Run Model Worksheet
This worksheet is used to set run time parameters, including initial and subsequent discount
rates, and to run the model. If desired, the default complication-associated costs and utility
values can be replaced with user-defined values.
Inputs Check Worksheet: Subject Characteristics
This worksheet provides the means and standard deviation (SD) or counts by column for
Inputs Worksheets parametric or categorical data respectively.
UKPDS Outcomes Model manual
Page 11 of 32
Inputs Check Worksheet: Smoking Status Check
This section provides counts of the number of “0”, “1” or “2” smoking status values by
simulated year.
Inputs Check Worksheet: Cholesterol Check
This section provides the means, standard deviations and count (n) for total cholesterol
values by simulated year.
Inputs Check Worksheet: HDL Check
This section provides the means, standard deviations and count (n) for HDL cholesterol
values by simulated year.
UKPDS Outcomes Model manual
Page 12 of 32
Inputs Check Worksheet: SysBP Check
This section provides the means, standard deviations and count (n) for systolic blood pressure
values by simulated year.
Inputs Check Worksheet: HbA1c Check
This worksheet provides the means, standard deviations and count (n) for HbA1c values by
simulated year.
Outputs Worksheet
This worksheet tabulates Life Expectancy, Quality Adjusted Life Expectancy and cumulative
complication costs, together with their respective 95% confidence intervals, for each subject
specified. Overall values for the population are provided as well as Quality Adjusted Life
Expectancy values and costs by subject for each year simulated.
Bootstraps Worksheet
This worksheet tabulates estimated mean Life Expectancy, QALYS and complication costs
by bootstrap replication. The number of results reported depends on the number of bootstrap
replications requested with each result showing the mean value for that bootstrap averaged
across the total number of loops (Monte Carlo trials) requested.
UKPDS Outcomes Model manual
Page 13 of 32
IHD (Ischaemic Heart Disease), MI (Myocardial Infarction), Heart failure, Stroke,
Amputation, Blindness, Renal failure, Diabetes related death, Other death, All death
Worksheets
These worksheets show the expectation by year that a subject experienced an event of these
types (IHD example shown). This value is calculated by dividing the total simulated
instances where a subject has previously had an event and is still alive by the total number of
loops (Monte Carlo trials). Note that a subject may have events such as a myocardial
infarction in a particular year as well as a diabetes related death, as these events are not
mutually exclusive.
Also shown is the expectation of the subject being still alive with a long term history of the
event (see IHD example below). This value is calculated by dividing the total simulated
number of events by the total number of loops (Monte Carlo trials) where the subject is alive.
Estimated Smoking Status Worksheet
This worksheet shows smoking status values by simulated year, as estimated by the UKPDS
Outcomes Model. If updated smoking status values are provided as inputs, they are
reproduced in this worksheet.
Estimated Lipid Ratio Worksheet
This worksheet shows lipid ratio (total to HDL cholesterol) values by simulated year, as
estimated by the UKPDS Outcomes Model. If updated risk total and HDL cholesterol values
are provided as inputs, their ratios are reproduced in this worksheet.
UKPDS Outcomes Model manual
Page 14 of 32
Estimated SysBP
This worksheet shows systolic blood pressure values by simulated year, as estimated by the
UKPDS Outcomes Model. If updated systolic blood pressure values are provided as inputs
they are reproduced in this sheet.
Estimated HbA1c
This worksheet shows HbA1c values by simulated year, as estimated by the UKPDS
Outcomes Model. If updated HbA1c values are provided as inputs they are reproduced in this
sheet.
It is essential that:
• Workbook worksheets are not rearranged in any way.
• Columns are not reordered.
Note: All output sheets are cleared each time the model is run.
UKPDS Outcomes Model manual
Page 15 of 32
Entering Population Information
Enter data for subjects by typing it directly into the appropriate Inputs worksheet cells or by
copying and pasting it from other software applications. No results will be produced for
subjects that have missing data items. It is the responsibility of the user to ensure that only
valid values are entered as the software applies few data entry checks. The workbook
supplied contains sample data from 8 hypothetical subjects for the user to experiment with or
to replace with their own data.
The items3 that need to be provided for each subject are:
ID
Subject identifier (optional)
Demographic characteristics
Ethnicity 1=White-Caucasian, 2=Afro-Caribbean, 3=Asian-Indian
Group
1 or 2 to compare subject groups. Enter 1 if not comparing subject groups
Gender M=Male, F=Female
Age
Age in years at diagnosis of diabetes
Dur
Duration in years since diagnosis of diabetes
Weight Weight in kilograms at diagnosis of diabetes [1.0 Kg = 2.2 pounds]
Height
Height in metres at diagnosis of diabetes [1.0 metre = 39 inches]
Risk factor values at diagnosis of type 2 diabetes
Atrial Fib Presence of atrial fibrillation (Y=Yes, N=No)
PVD
Presence of peripheral vascular disease (Y=Yes, N=No)
Smoking Smoking status (0=Never, 1=Past smoker, 2=Current smoker of tobacco)
Chol
Total cholesterol (mmol/l) [1.0 mmol/l = 38.6 mg/dl]
HDL
HDL cholesterol (mmol/l) [1.0 mmol/l = 38.6 mg/dl]
SysBP
Systolic blood pressure (mm Hg)
HbA1c HbA1c (%)
Current risk factor values (leave blank if data not available)
Smoking Smoking status (0=Never, 1=Past smoker, 2=Current smoker of tobacco)
Chol
Total cholesterol (mmol/l) [1.0 mmol/l = 38.6 mg/dl]
HDL
HDL cholesterol (mmol/l) [1.0 mmol/l = 38.6 mg/dl]
SysBP
Systolic blood pressure (mm Hg)
HbA1c HbA1c (%)
Years since pre-existing event
3
Full definitions of the input variables used are given in UKPDS paper 68.
UKPDS Outcomes Model manual
Page 16 of 32
IHD
Time in years since first diagnosis of ischaemic heart disease (0 if none)
CHF
Time in years since first diagnosis of chronic heart failure (0 if none)
Amp
Time in years since first amputation (0 if none)
Blind
Time in years since first diagnosed blind in one eye (0 if none)
Renal
Time in years since first diagnosed with renal failure (0 if none)
Stroke
Time in years since first stroke (0 if none)
MI
Time in years since first myocardial infarction (0 if none)
Discounting start year
The year of the simulation discounting of costs and outcomes commences.
The ability to set this is useful when a simulation is run that contains actual
follow-up data for the subjects specified.
Running the Model
The Run Model worksheet is used to set the following parameters and then to start the
simulation.
Number of subjects
Sets the number of subjects to be included in the simulation.
(number with data available shown alongside).
Number of loops
Sets the number of internal loops or Monte-Carlo trials per
subject, to reduce Monte-Carlo error (sometimes termed
variability or first order uncertainty). The predicted outcome
for each subject varies with each Monte-Carlo trial but will
stabilise if a sufficient number of Monte-Carlo simulations are
performed. This is done by running the simulation repeatedly
on the same patient but with different sets of random numbers.
Performing more loops will produce more stable predicted
outcomes for each subject but will take longer. At least 1,000
UKPDS Outcomes Model manual
Page 17 of 32
loops are required to obtain stable estimates for subjects. A
minimum of 100 may be appropriate when looking at overall
values for a cohort.
Number of bootstraps
Sets the number of bootstraps to address parameter uncertainty
(sometimes termed second order uncertainty) and estimate
confidence intervals around Life Expectancy, Quality Adjusted
Life Expectancy and complication costs estimates. The
software contains full sets of model equation parameters
derived from bootstrap samples of the UKPDS trial population
which were generated by sampling with replacement from the
original data set. When the desired number of bootstraps has
been chosen, each bootstrap run will use a different set of
model equation parameters, drawing from those available. The
current version of the software is limited to a maximum of
1,000 bootstraps. Ideally 1,000 bootstraps should be specified
although 100 may be sufficient to obtain approximate
confidence intervals estimates. If the number of bootstraps is
set to 0 or 1 then no confidence intervals will be generated.
Start at bootstrap
Sets which of the 1000 bootstrap parameters sets supplied
should be used first. Parameter sets are used in order, with wrap
round to the first set if necessary.
Number of years simulated Sets the maximum possible number of years simulated per
subject. The time taken to run the model can be reduced by not
specifying more years to be simulated than required. The
current version of the software is limited to a maximum of 40
years.
Discount rates
Sets the annual discount rate to be applied to Life Expectancy,
Quality Adjusted Life Expectancy and complication costs
estimates. Two different discount rates can be applied, for
example, a discount rate of 3% can be specified for the first 10
years and then 1.5% for all subsequent years. If discounting is
not required enter “0”.
Initial Utility value
Sets the utility value for a subject without any complications.
Used in the calculation of QALYs.
Cost in the absence of complications
Sets the annual cost incurred by a subject without any of the
complications simulated in the model.
Utility Decrements
4
Sets utility decrements for each of seven diabetes-related
complications (IHD, MI, Heart Failure, stroke, amputation,
blindness) in the year in which they occur (At time of event)
and thereafter (In subsequent years). The default values are
taken from UKPDS paper 624 except for renal failure5. If the
Philip Clarke, Alastair Gray & Rury Holman Estimating utility values for health states of type 2 diabetic
patients using the EQ-5D (UKPDS 62) Medical Decision Making (2002); 22: 340-349
5
Kiberd BA & Jindal KK. Screening to prevent renal failure in insulin dependent diabetic patients: an economic
evaluation BMJ 1995; 311 (702) 1595-1599
UKPDS Outcomes Model manual
Page 18 of 32
user has utility decrements for subsequent years they can be
entered in the next column.
Cost
The health care costs associated with each fatal or non-fatal
diabetes-related complication are listed in columns C & D, i.e.
the acute costs. The costs that accrue in all subsequent years are
listed in column F. The default costs are derived from UKPDS
paper 656 updated to 2004 prices using the Hospital and Health
Services Price Index and reflect health care resource use in the
United Kingdom in year 2000. Other costs can be entered by
the user.
Reset Costs
Click this button to revert to default Costs as supplied with this
version of the Outcomes Model.
ResetQALES
Click this button to revert to the default QALE decrements as
supplied with this version of the Outcomes Model.
Use risk factor sheets
Allows user to specify incorporation of data for risk factor
entry worksheets. The model will forecast values for any
missing data.
Random number sequence Sets which of the 100 random number sequences available is to
be used.
Pre-flight check
This option ensures that all of the input data are present and
within acceptable ranges BEFORE the simulation is run.
Run Model
Click this button to start the simulation.
Percent Complete
Provides an indication of progress.
Time taken
Provides an indication of elapsed time taken.
Estimated time remaining Provides an indication of the estimated time to completing all
simulations. The model can be stopped at any time by holding
down the control key and pressing the break key.
Outputs Worksheet
This worksheet displays the Life Expectancy, Quality Adjusted Life Expectancy and
complication cost estimates for each subject, together with their respective 95% confidence
intervals. The overall results for the population simulated are shown in the first row of the
table.
6
Clarke P, Gray A, Legood R, Briggs A & Holman R. The impact of diabetes-related complications on
healthcare costs: results from the United Kingdom Prospective Diabetes Study (UKPDS 65). Diabetic Medicine
2003; 20 (6): 442-50
UKPDS Outcomes Model manual
Page 19 of 32
Annual Risk Factor Values
Input worksheets are provided where values for each year to be simulated can be entered for
smoking status, total cholesterol, HDL cholesterol, systolic blood pressure and HbA1c if
desired. If no values are entered the software will forecast values by default. The use of these
annual risk factor values can be selected or deselected for any run on the Run Model sheet.
Annual Estimated Risk Factor Values
These output sheets display the updated estimated annual risk factor levels for individual
subjects. Data from these sheets can be used to populate the annual risk factor values sheets
by copying and pasting. To use the estimated annual lipid ratio data in this fashion, copy the
values to the Cholesterol worksheet and set all values in the HDL worksheet to 1.
UKPDS Outcomes Model manual
Page 20 of 32
Worked Examples
Example #1
To determine the likely impact of a fixed difference in HbA1c values over time, say 11.0%
versus 7.0%, on Life Expectancy and Quality Adjusted Life Expectancy for a sixty-year old
patient with type 2 diabetes of one year’s duration, proceed as follows:
Step 1
Using the Inputs sheet, enter characteristics for two patients that have identical risk-factor
levels e.g.:
Demographic characteristics
Group
1
Ethnicity
1 (White)
Gender
M (Male)
Age at diagnosis
59 (years)
Duration of diabetes
1 (year)
Weight
100 (Kg)
Height
1.74 (metres)
Risk factor values at diagnosis of type 2 diabetes
Atrial Fib
N (No)
PVD
N (No)
Smoking
0 (Never smoked)
Chol
4.0 (mmol/l)
HDL
1.0 (mmol/l)
SysBP
120 (mm Hg)
HbA1c
11.0 (%) for subject one
HbA1c
7.0 (%) for subject two
Current risk factor values
Smoking
0 (Never smoked)
Chol
4.0 (mmol/l)
HDL
1.0 (mmol/l)
SysBP
130 (mm Hg) Note, the value is higher than at diagnosis
HbA1c
11.0 (%) for subject one
HbA1c
7.0 (%) for subject two
Start of discounting
0 for both subjects
Step 2
Go to the Run Model sheet. To obtaining point estimates in an initial simulation we will deal
only with Monte Carlo error. Set the “Number of subjects” to 2, the “Number of loops” to
10,000 to reduce Monte Carlo error, the “Maximum years simulated” to 40 and the “Discount
rate” to 0. At this stage we will not estimate confidence intervals so set the “Number of
bootstraps” to 0. Set the ‘Use risk factor sheets’ to N.
Step 3
Run the model and then look at the Outputs sheet. The Life Expectancy for subject one
should be approximately 16.6 years (12.3 QALEs) and for subject two, with the lower HbA1c,
somewhat greater at approximately 17.5 years (13.1 QALEs). Estimates may differ slightly
between simulations as the Outcomes model may have used a different set of random
UKPDS Outcomes Model manual
Page 21 of 32
numbers. To produce these estimates the model has forecast values for smoking status, total
& HDL cholesterol, systolic blood pressure and HbA1c for each year simulated, based on the
current risk factor values entered. The time paths for the risk factor equations used are those
plotted below from figure 3 of UKPDS paper 682. It can be seen that subjects with high
initial HbA1c levels will tend to have lower values over time whereas those with low levels
initially will tend to have higher values over time.
It is also possible to examine cumulative event rates (adjusted for death as competing risk)
over the years specified in the simulation. For example, the MI sheet contains the expected
incidence of myocardial infarction for both groups. The cumulative incidence up to year X is
estimated by adding the ‘event rate by simulated year’ up to year X. For example, the
expected cumulative number of events plateau at around 0.47 for patient one and 0.42 for
patient two around 30th year of the simulation as almost all patients are dead and therefore
cannot have an MI.
Example #2
We may also want to undertake a simulation based on a different assumed future time path
for HbA1c values instead of following the default paths. To undertake this type of simulation
proceed as follows:
Step 1
Go to the HbA1c sheet. For the first subject, enter 11.0 for year 1 and copy this value across
the row to year 40. Repeat this for process for the second subject, entering 7.0 instead of
11.0.
Step 2
Go to the Run Model sheet. Change “Use risk factor sheets” from N to Y to indicate the
model is to use the values specified for each year simulated.
Step 3
Run the model and then look at the Outputs sheet. Subject one’s Life Expectancy will now be
somewhat less, at around 16.0 years, as his HbA1c has remained elevated at its initial value of
11.0%. Subject two will have an extended Life Expectancy, of around 17.7 years, as his
HbA1c has remained low rather than tending to rise over time.
Example #3
UKPDS Outcomes Model manual
Page 22 of 32
To obtain confidence intervals for Life Expectancy and Quality of Life Expectancy estimates
proceed as follows:
Step 1
Go to the Run Model sheet. Set the “Number of loops” to 1,000 and the “Number of
bootstraps” to 1,000. Run the model. The simulation will take a little longer to run
(approximately 20 minutes on PC with a Pentium IV processor). Go to the Outputs sheet. The
Life Expectancy and Quality of Life Expectancy estimates will now have 95% confidence
intervals around them.
Example #4
To compare the impact of different risk factor profiles on two groups of subjects, enter the
population characteristics for group one and group two. Run the model. Go to the Outputs
sheet. The average life years, quality adjusted life expectancy and costs are provided for all
patients (‘All’ row) and for each of the two groups. The incremental life-years, quality
adjusted life years and costs are provided in the ‘Difference’ row.
UKPDS Outcomes Model manual
Page 23 of 32
Standalone Implementation of the UKPDS Outcomes Model
This implementation of the UKPDS Outcomes Model is a standalone program that does not
require Microsoft Excel and can handle an unlimited number of subjects.
When the program is started the user is presented with a dialog box, which is the equivalent
of the Run Model worksheet in the Excel implementation. This is used to set the program
parameters and to start a simulation.
The standalone implementation of the UKPDS Outcomes Model reads inputs required from
individual data files rather than worksheets in a Microsoft Excel workbook. Similarly, each
set of program outputs are written to separate data files. This implementation of the UKPDS
Outcomes Model uses a comma separated values (CSV) format for both input and output data
files.
Once the parameters for running a particular simulation have been entered they must be
saved to a file before the model can be run. By convention, the parameter set filename
{name} is used as prefix identifier for files related to this particular simulation. For example,
if the parameter set file is ‘Sample’ it will be saved as ‘Sample.outcomes’ and the program
will look to read patient characteristics from a file called ‘Sample_Inputs.csv’, smoking
status data from ‘Sample_SmokingStatus.csv’ etc.
UKPDS Outcomes Model manual
Page 24 of 32
Previously saved parameter set files can be loaded, amended and saved under a different
filename in order to run different simulations. Parameter set files must only be modified
using the standalone implementation of the UKPDS Outcomes Model to preserve their
integrity.
CSV File Format
Each row in UKPDS Outcomes Model CSV files contains data for one subject. Data items
within each row must be separated by a comma, and rows by a carriage return (line feed is
optional). Each row within the file must contain a complete set of the data items required for
the file in question. Missing values are indicated simply by leaving nothing between
concomitant delimiters.
Input files
An “Inputs” file is essential but files for risk factor value changes over time are optional. No
heading rows should be used in input files.
{name}_Inputs.csv
This file contains the following items.
ID
Group
Ethnicity
Gender
Age
Duration of diabetes
Weight
Height
Diagnosis Atrial Fib.
Diagnosis PVD
Diagnosis Smoking
Diagnosis Chol
Diagnosis HDL
Diagnosis Sys BP
Diagnosis HbA1c
Current Smoking
Current Chol
Current HDL
Current Sys BP
Current HbA1c
Pre-existing IHD
Pre-existing CHF
Pre-existing Amp
Pre-existing Blind
Pre-existing Renal
Pre-existing Stroke
Pre-existing MI
Discounting start year
An identifier for the subject
1 or 2 to identify groups of patients for comparision
Ethnic group (1=White, 2= Afro-Caribbean, 3= Asian-Indian)
Gender (M=Male, F=Female)
Age in years
Duration of Diabetes in years
Weight in kg
Height in metres
(Y=Yes, N=No)
(Y=Yes, N=No)
Smoking status at diagnosis (0=Never, 1=Past smoker or 2=Current smoker of
tobacco)
Cholesterol in mmol/l
HDL Cholesterol in mmol/l
Sys BP (mmHg)
HbA1c (%)
Current smoking status (0=Never, 1=Past smoker or 2=Current smoker of tobacco)
Cholesterol in mmol/l
HDL Cholesterol in mmol/l
Sys BP (mmHg)
HbA1c (%)
Number of years since pre-existing IHD
Number of years since pre-existing CHF
Number of years since pre-existing amputation
Number of years since pre-existing blindness
Number of years since pre-existing renal failure
Number of years since pre-existing stroke
Number of years since pre-existing MI
e.g.
001A,1,1,M,60,10,85,1.80,N,N,0,4.00,1.15,125,7.0,0,4.00,1.15,125,7.0,0,0,0,0,0,0,0,0
002B,1,1,M,60,10,85,1.80,N,N,0,4.00,1.10,130,7.5,0,4.00,1.10,130,7.5,0,0,0,0,0,0,0,0
003C,1,1,M,60,10,85,1.80,N,N,0,4.00,1.05,135,8.0,0,4.00,1.05,135,8.0,0,0,0,0,0,0,0,0
{name}_SmokingStatus.csv
UKPDS Outcomes Model manual
Page 25 of 32
This file contains the updated risk factors for Smoking status. It is only required if you select
the ‘Use updated risk factor files’ option. The format is as follows:
ID
Smoking: Year 1
…
Smoking: Year 40
An identifier for the subject
smoking status (0=Never, 1=Past smoker or 2=Current smoker of tobacco)
smoking status (0=Never, 1=Past smoker or 2=Current smoker of tobacco)
e.g.
001A,1,,,,2,,,1,,,,,,,,,,,,,,,,,,,,,,,,,,,,,,,,,,,,,,,,,,,,,,,,,,,,,,,,
002B,,,2,,,2,,,,,,2,,,,,,,,,,,,,,,,,,,,,,,,,,,,,,,,,,,,,,,,,,,,,,,,,,,,
003C,,,,,,,,,,,,,,,,,,,,,,,,,,,,,,,,,,,,,,,,,,,,,,,,,,,,,,,,,,,,,,,,
{name}_Cholesterol.csv
This file contains the updated risk factors for cholesterol. It is only required if you select the
‘Use updated risk factor files’ option. The format is as follows:
ID
Cholesterol: Year 1
…
Cholesterol: Year 40
An identifier for the subject
Cholesterol in mmol/l
Cholesterol in mmol/l
e.g.
001A,6.5,6.5,6.5,6.5,6.5,6.5,6.5,,,,,,,,,,,,,,,,,,,,,,,,,,,,,,,,,,,,,,,,,,,,,,,,,,,,,,,,,
002B,4.1,,,,,5.1,,,,,,,,,,,,,,,,,,,,,,,,,,,,,,,,,,,,,,,,,,,,,,,,,,,,,,,,,,
003C,,,,,,,,,,,,,,,,,,,,,,,,,,,,,,,,,,,,,,,,,,,,,,,,,,,,,,,,,,,,,,,,
{name}_HDL.csv
This file contains the updated risk factors for HDL cholesterol. It is only required if you
select the ‘Use updated risk factor files’ option. The format is as follows:
ID
HDL: Year 1
…
HDL: Year 40
An identifier for the subject
HDL in mmol/l
HDL in mmol/l
e.g.
001A,0.9,0.9,0.9,0.9,0.9,0.9,0.9,,,,,,,,,,,,,,,,,,,,,,,,,,,,,,,,,,,,,,,,,,,,,,,,,,,,,,,,,
002B,1.1,,,,,1.1,,,,,,,,,,,,,,,,,,,,,,,,,,,,,,,,,,,,,,,,,,,,,,,,,,,,,,,,,,
003C,,,,,,,,,,,,,,,,,,,,,,,,,,,,,,,,,,,,,,,,,,,,,,,,,,,,,,,,,,,,,,,,
{name}_SysBP.csv
This file contains the updated risk factors for Systolic blood pressure. It is only required if
you select the ‘Use updated risk factor files’ option. The format is as follows:
ID
SysBP: Year 1
…
SysBP: Year 40
An identifier for the subject
Sys BP (mmHg)
Sys BP (mmHg)
e.g.
001A,120,,,,120,,,,,120,,,,,,,,,,,,,,,,,,,,,,,,,,,,,,,,,,,,,,,,,,,,,,,,,,,,,,
002B,,,130,,,,154,,,,,,,,,,,,,,,,,,,,,,,,,,,,,,,,,,,,,,,,,,,,,,,,,,,,,,,,,
003C,,,,,,,,,,,,,,,,,,,,,,,,,,,,,,,,,,,,,,,,,,,,,,,,,,,,,,,,,,,,,,,,
{name}_HbA1c.csv
This file contains the updated risk factors for HbA1c. It is only required if you select the ‘Use
updated risk factor files’ option. The format is as follows:
ID
HbA1c: Year 1
…
HbA1c: Year 40
An identifier for the subject
HbA1c (%)
HbA1c (%)
UKPDS Outcomes Model manual
Page 26 of 32
e.g.
001A,5.6,5.6,5.6,5.6,5.6,5.6,5.6,,,,,,,,,,,,,,,,,,,,,,,,,,,,,,,,,,,,,,,,,,,,,,,,,,,,,,,,,
002B,4.7,,,,,,,,,,,,,,,,,,,,,,,,,,,,,,,,,,,,,,,,,,,,,,,,,,,,,,,,,,,,,,,
003C,,,,,,,,,,,,,,,,,,,,,,,,,,,,,,,,,,,,,,,,,,,,,,,,,,,,,,,,,,,,,,,,
Output files
Each time the program is run a complete set of output files, using the parameter set filename
as their prefix, will be produced. Successive program runs using the same name will
overwrite previously saved files. Header rows are provided for each output file.
{name}_Outputs.csv
ID
Life expectancy
95% CI Lower
95% CI Upper
Total QALE
95% CI Lower
95% CI Upper
Total cost of complications
95% CI Lower
95% CI Upper
Utility: Year 1
…
Utility: Year 40
Total cost: Year 1
…
Total cost: Year 40
The identifier for the subject as provided in the _Inputs file
Life expectancy (point estimate)
Life expectancy (lower CI)
Life expectancy (upper CI)
Total quality adjusted life expectancy (point estimate)
Total quality adjusted life expectancy (lower CI)
Total quality adjusted life expectancy (upper CI)
Total cost of complications (point estimate)
Total cost of complications (lower CI)
Total cost of complications (upper CI)
Utility for year 1
Utility for year 40
Cost for year 1
Cost for year 40
e.g.
,,,,,,,,,,Expected utility by simulated year,,,,,,,,,,,,,,,,,,,,,,,,,,,,,,,,,,,,,,,,Total cost by simulated year
Id,Life expectancy,95% CI Lower,95% CI Upper,Total QALE,95% CI Lower,95% CI Upper,Total cost of
complications,95% CI Lower,95% CI Upper,Year 1,Year 2,Year 3,Year 4,Year 5,Year 6,Year 7,Year 8,Year
9,Year 10,Year 11,Year 12,Year 13,Year 14,Year 15,Year 16,Year 17,Year 18,Year 19,Year 20,Year 21,Year
22,Year 23,Year 24,Year 25,Year 26,Year 27,Year 28,Year 29,Year 30,Year 31,Year 32,Year 33,Year 34,Year
35,Year 36,Year 37,Year 38,Year 39,Year 40,Year 1,Year 2,Year 3,Year 4,Year 5,Year 6,Year 7,Year 8,Year
9,Year 10,Year 11,Year 12,Year 13,Year 14,Year 15,Year 16,Year 17,Year 18,Year 19,Year 20,Year 21,Year
22,Year 23,Year 24,Year 25,Year 26,Year 27,Year 28,Year 29,Year 30,Year 31,Year 32,Year 33,Year 34,Year
35,Year 36,Year 37,Year 38,Year 39,Year 40
001A,8.3597820337959075,7.4544194001062234,9.2651446674855915,6.3940489786605417,5.71017857889
12593,7.0779193784298240,5387.2546766092182224,4175.3904489306460164,6599.1189042877904285,0.77
26364999999970,0.7175888888888760,0.6590692898317443,0.6026370775342688,0.5483205998113291,0.48
56939052486692,0.4249759905889489,0.3790787243920463,0.3346897595845152,0.2892488557981878,0.24
73733209905486,0.2109978695871526,0.1762716066573453,0.1412459758940239,0.1112532337019749,0.08
67413384797937,0.0657029511098423,0.0482259871100626,0.0347657473087408,0.0237508289787507,0.01
53888186642400,0.0087703816469612,0.0047712619147892,0.0027693485783616,0.0015046017334943,0.00
05761146258911,0.0000000000000000,0.0000000000000000,0.0000000000000000,0.0000000000000000,0.00
00000000000000,0.0000000000000000,0.0000000000000000,0.0000000000000000,0.0000000000000000,0.00
00000000000000,0.0000000000000000,0.0000000000000000,0.0000000000000000,0.0000000000000000,444.
5269999999999868,479.2144927536298269,490.5365352750278589,463.5133171276767712,443.2882824335
097212,390.7765862023767340,385.8636931112786783,317.9785380768437903,288.9636912558475501,236.
2419291742924372,216.5438596199406902,207.7899263368996969,182.5079215687728436,158.4277245896
527404,145.1086024818217481,131.3233972301899257,108.9700237832884397,111.3538320973237177,72.0
663680430542257,51.7877408462884858,29.4682019165932267,14.5962613391459168,9.1261526447824455
,4.1205930520657503,2.2819756461569716,0.8780300027352269,0.0000000000000000,0.0000000000000000
,0.0000000000000000,0.0000000000000000,0.0000000000000000,0.0000000000000000,0.0000000000000000
,0.0000000000000000,0.0000000000000000,0.0000000000000000,0.0000000000000000,0.0000000000000000
,0.0000000000000000,0.0000000000000000,
UKPDS Outcomes Model manual
Page 27 of 32
{name}_Bootstraps.csv
Bootstrap Number
Life expectancy (All)
Total QALE (All)
Total cost of complications (All)
Life expectancy (Group 1)
Total QALE (Group 1)
Total cost of complications (Group 1)
Life expectancy (Group 2)
Total QALE (Group 2)
Total cost of complications (Group 2)
e.g.
Bootstrap Number,Life expectancy,Total QALE,Total cost of complications
1,5.527663982,4.272755081,5509.484561,9.134222203,7.100436072,5226.466521,1.921105761,1.445074089,
5792.502601
2,8.883901823,6.782036675,7071.075513,9.606008875,7.328607168,5532.870861,8.161794771,6.235466182,
8609.280166
3,7.938116905,6.077276854,6578.451473,7.383042576,5.715983362,4583.544646,8.493191234,6.438570345,
8573.3583
{name}_IHD.csv
{name}_MI.csv
{name}_HeartFailure.csv
{name}_Stroke.csv
{name}_Amputation.csv
{name}_Blindness.csv
{name}_RenalFailure.csv
{name}_DiabDeath.csv
{name}_OtherDeath.csv
{name}_AllDeath.csv
Contain the cumulative event rates for each type of event. Each of these files has the
following format:
ID
Event: Year 1
…
Event: Year 40
Lower CI: Year 1
…
Lower CI: Year 40
Upper CI: Year 1
…
Upper CI: Year 40
Long term history: Year 1
…
Long term history: Year 40
Long term history Lower CI:
…
Long term history Lower CI:
40
Long term history Upper CI:
…
Long term history Upper CI:
40
The identifier for the subject as provided in the _Inputs file
Event rate for year 1 (point estimate)
Event rate for year 40 (point estimate)
Event rate for year 1 (lower CI)
Event rate for year 40 (lower CI)
Event rate for year 1 (upper CI)
Event rate for year 40 (upper CI)
Long term history rate for year 1 (point estimate)
Year 1
Long term history rate for year 40 (point estimate)
Long term history rate for year 1 (lower CI)
Year
Long term history rate for year 40 (lower CI)
Year 1
Long term history rate for year 1 (upper CI)
Year
Long term history rate for year 40 (upper CI)
UKPDS Outcomes Model manual
Page 28 of 32
e.g.
,Event rate by simulated year (Point estimate),,,,,,,,,,,,,,,,,,,,,,,,,,,,,,,,,,,,,,,,Event rate by simulated year (Lower
CI),,,,,,,,,,,,,,,,,,,,,,,,,,,,,,,,,,,,,,,,Event rate by simulated year (upper CI),,,,,,,,,,,,,,,,,,,,,,,,,,,,,,,,,,,,,,,,Long term history
rate by simulated year (Point estimate),,,,,,,,,,,,,,,,,,,,,,,,,,,,,,,,,,,,,,,,Long term history rate by simulated year (Lower
CI),,,,,,,,,,,,,,,,,,,,,,,,,,,,,,,,,,,,,,,,Long term history rate by simulated year (upper CI),,,,,,,,,,,,,,,,,,,,,,,,,,,,,,,,,,,,,,,,
Id,Year 1,Year 2,Year 3,Year 4,Year 5,Year 6,Year 7,Year 8,Year 9,Year 10,Year 11,Year 12,Year 13,Year
14,Year 15,Year 16,Year 17,Year 18,Year 19,Year 20,Year 21,Year 22,Year 23,Year 24,Year 25,Year 26,Year
27,Year 28,Year 29,Year 30,Year 31,Year 32,Year 33,Year 34,Year 35,Year 36,Year 37,Year 38,Year 39,Year
40,Year 1,Year 2,Year 3,Year 4,Year 5,Year 6,Year 7,Year 8,Year 9,Year 10,Year 11,Year 12,Year 13,Year
14,Year 15,Year 16,Year 17,Year 18,Year 19,Year 20,Year 21,Year 22,Year 23,Year 24,Year 25,Year 26,Year
27,Year 28,Year 29,Year 30,Year 31,Year 32,Year 33,Year 34,Year 35,Year 36,Year 37,Year 38,Year 39,Year
40
001A,0.0080,0.0100,0.0130,0.0130,0.0120,0.0140,0.0130,0.0180,0.0170,0.0160,0.0170,0.0110,0.0170,0.0140,0
.0180,0.0160,0.0090,0.0050,0.0060,0.0090,0.0030,0.0040,0.0070,0.0080,0.0020,0.0040,0.00,0.0030,0.00,0.00,0
.00,0.00,0.00,0.00,0.00,0.00,0.00,0.00,0.00,0.00,0.0017556528598737,0.0027598374665755,0.0065230780564
837,0.0059216044303806,0.0046217977014449,0.0060554268005382,0.0050837630875268,0.0096350873932
594,0.0085915095389478,0.0079060172615943,0.0088339907699290,0.0026239992221582,0.0089305640766
158,0.0058183120141619,0.0094460929183439,0.0083808630813191,0.0012046189676190,0.00,0.00,0.00197
83848700172,0.00,0.00,0.0007731506393681,0.0022933914189248,0.00,0.00,0.00,0.00,0.00,0.00,0.00,0.00,0.0
0,0.00,0.00,0.00,0.00,0.00,0.00,0.00,0.0142443471401263,0.0172401625334245,0.0194769219435163,0.02007
83955696194,0.0193782022985551,0.0219445731994618,0.0209162369124732,0.0263649126067406,0.02540
84904610522,0.0240939827384057,0.0251660092300710,0.0193760007778418,0.0250694359233842,0.02218
16879858381,0.0265539070816561,0.0236191369186809,0.0167953810323810,0.0130302077857054,0.01304
96423802634,0.0160216151299828,0.0102026050558394,0.0107345326192693,0.0132268493606319,0.01370
66085810752,0.0070602569269159,0.0086281423182958,0.0040370214731161,0.0064618283261883,0.00314
28133984696,0.0027248117098985,0.0022850473199477,0.0016508925372658,0.0011877729372233,0.00089
08323981535,0.0007152362004261,0.0004764211313533,0.0004979943067948,0.0003492101808367,0.00021
34151109926,0.00875661669825,0.0040,0.0090,0.0130,0.0190,0.0240,0.0270,0.0290,0.0380,0.0440,0.0530,0.0
530,0.0510,0.0550,0.0570,0.0590,0.0560,0.0530,0.0490,0.0420,0.0370,0.0380,0.0330,0.0270,0.0290,0.0220,0.0
160,0.0110,0.0030,0.0020,0.0020,0.0020,0.0010,0.0010,0.0010,0.0010,0.00,0.00,0.00,0.00,0.00,0.00,0.00,0.00,
0.00,0.00,0.00,0.00,0.00,0.00,0.00,0.00,0.00,0.00,0.00,0.00,0.00,0.00,0.00,0.00,0.00,0.00,0.00,0.00,0.00,0.00,0.
00,0.00,0.00,0.00,0.00,0.00,0.00,0.00,0.00,0.00,0.00,0.00,0.00,0.00,0.00,0.1387907047768261,0.205632175898
7614,0.2600173254000258,0.3085226316798767,0.3513561558953182,0.3872479996587594,0.418147463931
9138,0.4525939094500950,0.4798051709549118,0.5069768337986315,0.5219795466740100,0.531029857457
8877,0.5429256970310395,0.5487837238289270,0.5524959583152282,0.5445124442181591,0.533608492109
8486,0.5177780993761616,0.4952035586139475,0.4699512070178809,0.4474930647829551,0.415502640052
4543,0.3812803861886661,0.3523016758245114,0.3140333131927079,0.2763140229828763,0.238161802185
0538,0.2007580577890224,0.1704081017079923,0.1443916240231226,0.1219905429723924,0.099344929687
4953,0.0806460725548624,0.0645985747096144,0.0522431174343482,0.0395819821623122,0.031110114802
6426,0.0258519262670773,0.0195990199754988,0.00,
{name}_InputsCheck.csv
Each section contains 3 rows. For parametric columns the first row will contain the mean
value and the second row the standard deviation of the data the equivalent column in the
UKPDS Outcomes Model manual
Page 29 of 32
inputs sheet. For non-parametric columns the first row contains the number of values that
match the first category value, the second row the second value etc.
These 3 rows are repeated for All subjects, Group 1 and Group 2
Subject characteristics rows
Group
Count
Ethnicity
Gender
Age
Duration of diabetes
Weight
Height
Diagnosis Atrial Fib.
Diagnosis PVD
Diagnosis Smoking
Diagnosis Chol
Diagnosis HDL
Diagnosis Sys BP
Diagnosis HbA1c
Current Smoking
Current Chol
Current HDL
Current Sys BP
Current HbA1c
Pre-existing IHD
Pre-existing CHF
Pre-existing Amp
Pre-existing Blind
Pre-existing Renal
Pre-existing Stroke
Pre-existing MI
Discounting start year
Name of group
Number of subjects in group
Row 1 # White, row 2 # Afro-Caribbean and row 3 # Asian-Indian
Row 1 # Male and row 2 # Female
Row 1 mean, Row 2 standard deviation, Row 3 number of values
Row 1 mean, Row 2 standard deviation, Row 3 number of values
Row 1 mean, Row 2 standard deviation, Row 3 number of values
Row 1 mean, Row 2 standard deviation, Row 3 number of values
Row 1 # Yes, row 2 # No
Row 1 # Yes, row 2 # No
Row 1 # Never, row 2 # Past smoker and row 3 # Current smoker of tobacco
Row 1 mean, Row 2 standard deviation, Row 3 number of values
Row 1 mean, Row 2 standard deviation, Row 3 number of values
Row 1 mean, Row 2 standard deviation, Row 3 number of values
Row 1 mean, Row 2 standard deviation, Row 3 number of values
Row 1 mean, Row 2 standard deviation, Row 3 number of values
Row 1 mean, Row 2 standard deviation, Row 3 number of values
Row 1 mean, Row 2 standard deviation, Row 3 number of values
Row 1 mean, Row 2 standard deviation, Row 3 number of values
Row 1 mean, Row 2 standard deviation, Row 3 number of values
Row 1 mean, Row 2 standard deviation, Row 3 number of values
Row 1 mean, Row 2 standard deviation, Row 3 number of values
Row 1 mean, Row 2 standard deviation, Row 3 number of values
e.g.
Group,Count,Ethnicity (1/2/3),Gender (M/F),Age (y) (Mean/SD/N),Duration of diabetes (y)
(Mean/SD/N),Weight (kg) (Mean/SD/N),Height (m) (Mean/SD/N),Atrial Fib. (Y/N),PVD (Y/N),Smoking
(0/1/2),Chol (mmol/l) (Mean/SD/N),HDL (mmol/l) (Mean/SD/N),Sys BP (mmHg) (Mean/SD/N),HbA1c (%)
(Mean/SD/N),Smoking (0/1/2),Chol (mmol/l) (Mean/SD/N),HDL (mmol/l) (Mean/SD/N),Sys BP (mmHg)
(Mean/SD/N),HbA1c (%) (Mean/SD/N),IHD (Mean/SD/N),CHF (Mean/SD/N),Amp (Mean/SD/N),Blind
(Mean/SD/N),Renal (Mean/SD/N),Stroke (Mean/SD/N),MI (Mean/SD/N),Discounting offset (y) (Mean/SD/N)
All,8,8,4,60.0,10.0,82.5,1.7,0,0,8,4.0,1.1,132.5,7.8,8,4.0,1.1,132.5,7.8,0.0,0.0,0.0,0.0,0.0,0.0,0.0,0.0
,,0,4,0.0,0.0,4.9,0.1,8,8,0,0.0,0.1,11.0,1.1,0,0.0,0.1,11.0,1.1,0.0,0.0,0.0,0.0,0.0,0.0,0.0,0.0
,,0,,8,8,8,8,,,0,8,8,8,8,0,8,8,8,8,8,8,8,8,8,8,8,8
Smoking status rows
Contains three rows for each group, the first row contains the number of values that match
the first category value, the second row the second value etc
Label
Year 1
…
Year 40
Row 1 0s, Row 2 1s, Row 3 2s
Row 1 # Never, Row 2 # Past smoker, Row 3 # Current smoker of tobacco
Row 1 # Never, Row 2 # Past smoker, Row 3 # Current smoker of tobacco
e.g.
Id,Year 1,Year 2,Year 3,Year 4,Year 5,Year 6,Year 7,Year 8,Year 9,Year 10,Year 11,Year 12,Year 13,Year
14,Year 15,Year 16,Year 17,Year 18,Year 19,Year 20,Year 21,Year 22,Year 23,Year 24,Year 25,Year 26,Year
27,Year 28,Year 29,Year 30,Year 31,Year 32,Year 33,Year 34,Year 35,Year 36,Year 37,Year 38,Year 39,Year
40
UKPDS Outcomes Model manual
Page 30 of 32
,0,0,0,0,0,0,0,0,0,0,0,0,0,0,0,0,0,0,0,0,0,0,0,0,0,0,0,0,0,0,0,0,0,0,0,0,0,0,0,0
,1,0,0,0,0,0,0,1,0,0,0,0,0,0,0,0,0,0,0,0,0,0,0,0,0,0,0,0,0,0,0,0,0,0,0,0,0,0,0,0
,0,0,1,0,1,1,0,0,0,0,0,1,0,0,0,0,0,0,0,0,0,0,0,0,0,0,0,0,0,0,0,0,0,0,0,0,0,0,0,0
Cholesterol check rows
Contains three rows for each group, the first row will contain the mean value, the second row
the standard deviation and the third the number of observations for each year.
Label
Year 1
…
Year 40
Row 1 Mean, Row 2 SD, Row 3 N
Row 1 mean, Row 2 standard deviation, Row 3 number of values
Row 1 mean, Row 2 standard deviation, Row 3 number of values
e.g.
Id,Year 1,Year 2,Year 3,Year 4,Year 5,Year 6,Year 7,Year 8,Year 9,Year 10,Year 11,Year 12,Year 13,Year
14,Year 15,Year 16,Year 17,Year 18,Year 19,Year 20,Year 21,Year 22,Year 23,Year 24,Year 25,Year 26,Year
27,Year 28,Year 29,Year 30,Year 31,Year 32,Year 33,Year 34,Year 35,Year 36,Year 37,Year 38,Year 39,Year
40
Mean,0.5,0.0,0.0,0.0,2.0,1.0,0.0,,,,,,,,,,,,,,,,,,,,,,,,,,,,,,,,,
SD,1.0,,,,,2.0,,,,,,,,,,,,,,,,,,,,,,,,,,,,,,,,,,
N,2,1,1,1,1,2,1,0,0,0,0,0,0,0,0,0,0,0,0,0,0,0,0,0,0,0,0,0,0,0,0,0,0,0,0,0,0,0,0,0
HDL check rows
Contains three rows, the first row will contain the mean value, the second row the standard
deviation and the third the number of observations for each year.
Label
Year 1
…
Year 40
Row 1 Mean, Row 2 SD, Row 3 N
Row 1 mean, Row 2 standard deviation, Row 3 number of values
Row 1 mean, Row 2 standard deviation, Row 3 number of values
e.g.
Id,Year 1,Year 2,Year 3,Year 4,Year 5,Year 6,Year 7,Year 8,Year 9,Year 10,Year 11,Year 12,Year 13,Year
14,Year 15,Year 16,Year 17,Year 18,Year 19,Year 20,Year 21,Year 22,Year 23,Year 24,Year 25,Year 26,Year
27,Year 28,Year 29,Year 30,Year 31,Year 32,Year 33,Year 34,Year 35,Year 36,Year 37,Year 38,Year 39,Year
40
Mean,0.5,0.0,0.0,0.0,2.0,1.0,0.0,,,,,,,,,,,,,,,,,,,,,,,,,,,,,,,,,
SD,1.0,,,,,2.0,,,,,,,,,,,,,,,,,,,,,,,,,,,,,,,,,,
N,2,1,1,1,1,2,1,0,0,0,0,0,0,0,0,0,0,0,0,0,0,0,0,0,0,0,0,0,0,0,0,0,0,0,0,0,0,0,0,0
SysBP check rows
Contains three rows, the first row will contain the mean value, the second row the standard
deviation and the third the number of observations for each year.
Label
Year 1
…
Year 40
Row 1 Mean, Row 2 SD, Row 3 N
Row 1 mean, Row 2 standard deviation, Row 3 number of values
Row 1 mean, Row 2 standard deviation, Row 3 number of values
e.g.
Id,Year 1,Year 2,Year 3,Year 4,Year 5,Year 6,Year 7,Year 8,Year 9,Year 10,Year 11,Year 12,Year 13,Year
14,Year 15,Year 16,Year 17,Year 18,Year 19,Year 20,Year 21,Year 22,Year 23,Year 24,Year 25,Year 26,Year
27,Year 28,Year 29,Year 30,Year 31,Year 32,Year 33,Year 34,Year 35,Year 36,Year 37,Year 38,Year 39,Year
40
Mean,120.0,,130.0,,120.0,,154.0,,,120.0,,,,,,,,,,,,,,,,,,,,,,,,,,,,,,
SD,-,-,-,-,-,-,-,-,-,-,-,-,-,-,-,-,-,-,-,-,-,-,-,-,-,-,-,-,-,-,-,-,-,-,-,-,-,-,-,N,1,0,1,0,1,0,1,0,0,1,0,0,0,0,0,0,0,0,0,0,0,0,0,0,0,0,0,0,0,0,0,0,0,0,0,0,0,0,0,0
HbA1c check rows
Contains three rows, the first row will contain the mean value, the second row the standard
deviation and the third the number of observations for each year.
UKPDS Outcomes Model manual
Label
Year 1
…
Year 40
Page 31 of 32
Row 1 Mean, Row 2 SD, Row 3 N
Row 1 mean, Row 2 standard deviation, Row 3 number of values
Row 1 mean, Row 2 standard deviation, Row 3 number of values
e.g.
Id,Year 1,Year 2,Year 3,Year 4,Year 5,Year 6,Year 7,Year 8,Year 9,Year 10,Year 11,Year 12,Year 13,Year
14,Year 15,Year 16,Year 17,Year 18,Year 19,Year 20,Year 21,Year 22,Year 23,Year 24,Year 25,Year 26,Year
27,Year 28,Year 29,Year 30,Year 31,Year 32,Year 33,Year 34,Year 35,Year 36,Year 37,Year 38,Year 39,Year
40
Mean,120.0,,130.0,,120.0,,154.0,,,120.0,,,,,,,,,,,,,,,,,,,,,,,,,,,,,,
SD,,,,,,,,,,,,,,,,,,,,,,,,,,,,,,,,,,,,,,,,
N,1,0,1,0,1,0,1,0,0,1,0,0,0,0,0,0,0,0,0,0,0,0,0,0,0,0,0,0,0,0,0,0,0,0,0,0,0,0,0,0
{name}_EstimatedSmokingStatus.csv
Smoking status values as estimated by the UKPDS Outcomes Model. If updated risk factors
are provided they are reproduced in this sheet.
ID
Year 1
…
Year 40
The identifier for the subject as provided in the _Inputs file
Estimated value for year 1, or updated risk factor value if provided
Estimated value for year 40, or updated risk factor value if provided
{name}_EstimatedLipidRatio.csv
Lipid values as estimated by the UKPDS Outcomes Model. Lipid values provided by the
model are a ratio of Total Cholesterol to HDL. If updated risk factors for Cholesterol and
HDL are provided the ratio is reproduced in this sheet.
ID
Year 1
…
Year 40
The identifier for the subject as provided in the _Inputs file
Estimated value for year 1, or updated risk factor value if provided
Estimated value for year 40, or updated risk factor value if provided
{name}_EstimatedSysBP.csv
Systolic blood pressure values as estimated by the UKPDS Outcomes Model. If updated risk
factors are provided they are reproduced in this sheet.
ID
Year 1
…
Year 40
The identifier for the subject as provided in the _Inputs file
Estimated value for year 1, or updated risk factor value if provided
Estimated value for year 40, or updated risk factor value if provided
{name}_EstimatedHbA1c.csv
HbA1c values as estimated by the UKPDS Outcomes Model. If updated risk factors are
provided they are reproduced in this sheet.
ID
Year 1
…
Year 40
The identifier for the subject as provided in the _Inputs file
Estimated value for year 1, or updated risk factor value if provided
Estimated value for year 40, or updated risk factor value if provided
Automating runs of the model
As of version 1.2.1 of the Standalone Implementation of the UKPDS Outcomes Model it is
possible to start a simulation of the model without user intervention. This feature, called
batch mode, allows the model to be run from the command line or even from other suitable
applications.
To run the model in batch mode you need to issue the following command:
UKPDS Outcomes Model manual
Page 32 of 32
"UKPDS Outcomes Model.exe" /run <name of .outcomes file>
For example:
"UKPDS Outcomes Model.exe" /run c:\Sample.outcomes
This would start the Standalone Implementation of the software, load the specified parameter
set file and start the simulation. Once the simulation is complete the program will quit
leaving the output files in the same directory as the .outcomes file.
In order to use this facility the application wishing to start the simulation must be able to
issue commands to the operating system. For example applications written in Visual Basic
are able to do this using the Shell function. From SAS you can use the X statement, see the
‘Running DOS or Windows Commands from within SAS’ section of ‘SAS Companion for
the Microsoft Windows Environment’.
Please note that the full path to the .outcomes file must be specified in order for the system to
work. That is you cannot simply use samples.outcomes or ..\samples.outcomes. If the folder
containing the UKPDS Outcomes Model software has not been placed on the system path
you will need to use the full path to the executable in order for it to work correctly.