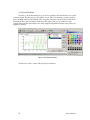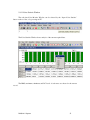
1
DAQLink II System
24 bit Acquisition System
User’s Manual
DAQLink II System User’s Manual
Printed in U.S.A.
©2009 Seismic Source Co. • All rights reserved.
This document may not be reproduced in any form without prior
express written consent from Seismic Source Co.
Seismic Source reserves the right to make changes and
improvements to its products without providing notice.
Trademarks
DAQLink II and VScope are trademarks of Seismic Source Co.
Seismic Source Co.
2391 East Coleman Rd.
Ponca City, OK 74604
USA
Telephone: (580) 762-8233
Fax: (580) 762-1785
Email: [email protected]
www.seismicsource.com
2
User’s Manual
Table Of Contents
TABLE OF CONTENTS ................................................................................................. 3
1 INTRODUCTION ......................................................................................................... 6
1.1 System Description ..................................................................................................................................6
1.2 DAQLink Software Installation and Setup ...........................................................................................6
2 ETHERNET SETUP .................................................................................................... 7
2.1 Windows 2000 Ethernet setup ................................................................................................................7
2.2 Windows XP Ethernet setup...................................................................................................................9
2.3 Firewall...................................................................................................................................................11
2.4 TCP/IP Verification ..............................................................................................................................12
3 CABLE CONNECTIONS............................................................................................13
3.1 DAQLink Cable Connections...............................................................................................................13
4 CONFIGURING THE PROGRAM ..............................................................................14
4.1 DAQLink Setup .....................................................................................................................................14
4.1.1 DAQLink Order...............................................................................................................................15
4.1.2 Copy to All ......................................................................................................................................15
4.1.3 IP settings ........................................................................................................................................15
4.2 DAQLink Configuration Standard menus..........................................................................................16
4.2.1 Device Acquisition Menu – Standard Menu....................................................................................17
4.3 DAQLink Configuration Advance Mode ............................................................................................19
4.3.1 Device Acquisition Menu – Advance Mode....................................................................................20
4.3.2 Trigger Menu – Advance Mode.......................................................................................................21
4.3.3 Order Menu – Advance Mode .........................................................................................................22
4.3.4 Device Analog Output – Advance Mode.........................................................................................23
4.3.5 GPS..................................................................................................................................................24
4.3.6 DAQlink Calibration .......................................................................................................................26
4.3.7 Device Advanced Menu ..................................................................................................................27
5 PROGRAM OPERATION...........................................................................................28
5.1 Acquisition .............................................................................................................................................28
5.2 Projects...................................................................................................................................................28
DAQLink II System
3
5.3 Database .................................................................................................................................................28
5.3.1 Loading Data From Database ..........................................................................................................28
5.3.2 DAQLink and Channel Configuration.............................................................................................30
5.3.3 Import and Export Data ...................................................................................................................31
5.3.4 Storing Data to Database .................................................................................................................33
5.3.5 Stacking Data in Database ...............................................................................................................33
5.3.6 Inverting Data before Stack – Shear Wave......................................................................................34
5.3.7 Near Trace Gather ...........................................................................................................................36
5.4 Data View and Analysis ........................................................................................................................38
5.4.1 Graph plot types...............................................................................................................................38
5.4.2 Plot Popup Menu ............................................................................................................................41
5.4.3 Store Plot Menu ...............................................................................................................................42
5.4.4 Seismic Plots ...................................................................................................................................43
5.4.5 Setting Zoom Level .........................................................................................................................45
5.4.6 Additional Plot Functions ................................................................................................................46
5.4.7 Filters...............................................................................................................................................47
5.4.8 Display Settings...............................................................................................................................48
5.4.9 Auto Operation ................................................................................................................................49
5.4.10 Lock and Unlock Menu Option ..................................................................................................50
5.4.11 Noise Statistic Window .................................................................................................................51
5.4.12 Real Time Noise Monitor ..............................................................................................................52
5.5 Status information Tabs .......................................................................................................................53
5.5.1 Comment .........................................................................................................................................53
5.5.2 Record Information.........................................................................................................................53
5.5.3 Plot Information...............................................................................................................................54
5.5.4 Status ...............................................................................................................................................54
5.5.5 Errors ...............................................................................................................................................54
5.5.6 Communication Tab ........................................................................................................................55
5.5.7 Network Tab ....................................................................................................................................55
5.6 Memory Window – Stacking Operation..............................................................................................56
5.6.1 Auto Stack Operation ........................................................................................................................56
5.6.2 Memory Window................................................................................................................................57
5.7 First Break Pick Feature.......................................................................................................................58
6.0 ADVANCED FEATURES ........................................................................................61
6.1 DAQlink Continuous Recording ..........................................................................................................61
6.1.1. Vscope Auto Start Function............................................................................................................61
6.1.2 DAQlink Auto Start Feature............................................................................................................62
6.1.3 GPS Trigger on PPS ........................................................................................................................63
6.1.4 Synchronize A/D converters............................................................................................................64
6.1.5 Continuous Recording Examples ....................................................................................................65
6.2 Continuous Monitoring of data............................................................................................................67
6.3 DAQlink Flash Card Download ...........................................................................................................68
6.3.1 Downloading single records ............................................................................................................69
6.3.2 Downloading Multiple Records.......................................................................................................70
6.3.3 Compact Flash Storage ....................................................................................................................71
4
User’s Manual
6.4 Vibrator Quality Control - DAQLink Configuration ........................................................................72
6.4.1 Vibrator QC Hardware Setup ..........................................................................................................72
6.4.2 Vibrator QC Software Setup............................................................................................................73
6.4.3 Vibrator QC plots ............................................................................................................................79
6.4.3.1Vscope Graph Options...................................................................................................................80
6.4.4 Vibrator QC example.......................................................................................................................87
7 SPECIFICATIONS AND OPTIONS ............................................................................93
7.1 Options ...................................................................................................................................................93
7.2 Specification...........................................................................................................................................94
7.2.2 DAQLink II .....................................................................................................................................94
8 SCHEMATICS............................................................................................................97
8.1 DAQlink Connector wiring ..................................................................................................................97
8.2 DAQlink panel wiring ...........................................................................................................................99
DAQLink II System
5
1 Introduction
1.1 System Description
The DAQLink II system is a multiple channel 24 bit analog to digital acquisition system. Each
DAQLink II unit can have 6 to 24 independent analog channels. Multiple DAQlink units can be
connected together for increased number of channels. The DAQLink II uses standard 10/100 Base RJ45
network connection and standard TCP/IP network protocol. The DAQLink II can be connected to any
standard network configuration.
The DAQLink II has provisions for the following options
• Two – RS232 inputs and outputs
• GPS receiver for position information
• GPS receiver for timing reference, and adjustment of internal oscillator
• One 16bit D/A analog output
• Four pre-amp gain settings
• Compact Flash for storage of acquired signals
The DAQLink II System consists of the following:
•
•
•
•
DAQLink Unit – Digital to Analog converter unit with Ethernet interface. DAQLink-II is a 24
bit acquisition unit, with each box containing up to 24 channels. The DAQLink II is also capable
of outputting an analog signal using a 16 bit D/A converter.
Computer – The DAQ Link unit connects to a computer with Windows XP, Windows 98,
Windows NT or Windows 2000 operating system and an Ethernet Network Interface Card (NIC).
VScope software operates on the computer and communicates to the DAQ Link units. The
Software package allows viewing, analysis, and storage of the acquired signals.
Connection cables are included to connect:
o Power (11-18 VDC)
o Ethernet cable to connect DAQLink II to computer
o Analog Input connector – Custom cables are available upon request
1.2 DAQLink Software Installation and Setup
•
Create a new directory on the hard drive and copy all files from installation CD to that directory
Vscope.exe – Program used to acquire analyze and store the analog data.
6
User’s Manual
2 Ethernet Setup
Normally, it is necessary to set up a fixed TCP/IP address for the computer to
communicate with the DAQLink II unit.
2.1 Windows 2000 Ethernet setup
With Windows 2000 computer this can be done by the following procedure:
Right Click on My Network Places and select Properties.
Figure 2.1 Network Properties
Right Click on an icon that corresponds to your network card and select Properties.
DAQLink II System
7
Figure 2.2 IP configuration
Select Internet Protocol (TCP/IP) and click on Properties button.
Use following IP address:
IP address
192.168.0.101
Subnet Mask 255.255.255.0
Press OK to accept entries.
It is sometimes necessary to reboot the computer to have the new address take affect.
If the DAQLink II unit was previously communicating with a computer with a different
address, then the DAQLink II unit must be reset (power off then on) for the unit to communicate
to the new address.
8
User’s Manual
2.2 Windows XP Ethernet setup
With Windows XP computer the Ethernet setup is done by the following procedure:
Go to the Control Panel and open the Network Connections.
DAQLink II System
9
Right Click on the Local Area Connection Icon and select properties.
Scroll Down to the Internet Protocol TCP/IP selection and click on this icon.
Click on Properties button.
Use following IP address:
IP address
192.168.0.101
Subnet Mask 255.255.255.0
Press OK to accept entries.
10
User’s Manual
It is sometimes necessary to reboot the computer to have the new address take affect.
If the DAQLink II unit was previously communicating with a computer with a different
address, then the DAQLink II unit must be reset (power off then on) for the unit to communicate
to the new address.
With Windows XP there is an additional Authentication Tab. The Authentication must
be disabled to operate with the DAQlink unit.
2.3 Firewall
It is important to disable all Firewalls on the computer. Third party firewall from Norton,
McAfee or other companies can completely disable the operation of the DAQlink unit. Typically
the Firewall will allow the “ping” command to operate, but will block all other commands and
messages.
There is a built in Firewall with Windows XP. This should be disabled. Go to the
Advanced Menu of the Local Area Properties and disable the Firewall.
DAQLink II System
11
2.4 TCP/IP Verification
To verify that the IP address is correct, select “Start”, then “Run”, then type in “CMD”.
This starts the command prompt in Windows ( This is similar to the old DOS command prompt).
Type the command “ipconfig”. The current ip address 192.168.0.101 should be shown.
Viewing the Network Tab at the bottom of the Vscope program can also check the IP
address.
The Network Tab shows the current IP address detected by the Vscope program.
12
User’s Manual
3 Cable Connections
3.1 DAQLink Cable Connections
•
•
•
•
Connect DAQ Link to computer with patch cable provided
Connect 11-18 VDC supply to DAQ Link cable (polarity does not matter). Note: Make sure
voltage to box is at least 11 volts, the power LED will operate with lower voltage but the
unit will not perform properly.
Connect the Trigger cable to the trigger source
Connect the Analog input cable
DAQLink II System
13
4 Configuring The Program
4.1 DAQLink Setup
Connect and power up DAQLink unit. Start the VScope program by double clicking on
Vscope.exe file in Windows Explorer. Select the DAQ setup menu by selecting menu Options>Device.
If no unit serial numbers are displayed in the window click Auto Detect. All DAQLink
units connected to computer should be automatically found and displayed.
Make sure the unit is enabled. A check mark by the serial number shows that the unit is
enabled. Just left click the small box next to the serial number to enable it. Multiple DAQLink
units can be connected to one computer using standard network equipment (hubs, switches,
wireless access points, etc).
Figure 4.1 Device setup
Figure 4.1 shows five DAQLink units connected to the computer.
The first column shows that DAQ1, DAQ2, and DAQ5 have been selected for
acquisition.
The user can change the second column, DAQLink name field.
The Serial # field is hardware programmed into the DAQLink unit and cannot be
changed.
In figure 4.1, DAQ unit 5 is highlighted. Clicking DAQ Settings or IP Settings will show
the configuration of the highlighted unit. To highlight a different unit simply left click on a
different DAQ link name.
Remove Button will remove the highlighted unit from the list.
Add button can be used to add a new DAQLink unit. However, it is recommended to use
the auto detect feature to add new units.
14
User’s Manual
4.1.1 DAQLink Order
The order in which the DAQLink units are shown is the same order that they will appear
when the data is displayed. The up and down arrows can be used to change the order of the
DAQLink units.
4.1.2 Copy to All
After setting up one DAQLink unit, the DAQ settings can be copied to the other units.
Highlight the DAQLink unit that has been “setup”, and then click the “copy to all” button to copy
the “setup” parameters to the other units.
4.1.3 IP settings
Each DAQLink unit should have a unique IP address. The IP settings selection allows
viewing and editing of the current IP setting for the unit.
For the IP address shown, the 192 defines a class C network. With class C networks the
first 3 octets must be the same for all units. This means that the first three entries (192.168.0)
must be the same for the units to communicate. The last octet is a number between 0-255. The
number 0 and the number 255 are reserved and should not be used for a DAQLink IP address.
Only the numbers 1-254 should be used. The computer’s IP address should also be unique; it
cannot have the same IP address as a DAQLink unit.
The Net Mask should be the same for all units. All bits that are not 0 in the net mask have
to match. 255.255.255.0 mask is shown which means the first 3 bytes (octet) have to match.
Use DHCP server to configure IP configuration – When checked, the DHCP server does
the IP configuration automatically. The DHCP server supplies an IP address to any host that asks
for it. Recommend always using manual address when possible, because it's easier to
troubleshoot in case of a problem.
Figure 4.1.3Device IP selections
DAQLink II System
15
4.2 DAQLink Configuration Standard menus
When first installed, the Vscope program uses Standard menus. These menus provide all
of the necessary options for normal seismic operation. The Advance menus are selected in the
Option – Preferences –Menu.
It is important on new installations to check the DAQ settings. Click the DAQ Settings
button and the DAQLink Configuration Menu should appear. This will also check that
communication to the DAQLink unit is working properly. If the configuration window does not
appear, it means that the DAQLink unit selected is not responding. This is usually caused by
improper TCP/IP settings, or Ethernet cable not plugged in properly. The computer or DAQLink
unit may need to be reset if the TCP/IP configuration has changed.
An additional check of communication can be performed by first removing all DAQ units
from the DAQ setup table. Highlight the DAQ unit to be removed then press the Remove button.
After all units have been removed, press the Auto Detect button and all units connected to the
computer will be added.
16
User’s Manual
4.2.1 Device Acquisition Menu – Standard Menu
The Acquisition Menu allows the following selections
1. Gain – This entry sets the pre-amp gain on the DAQlink analog card. Standard
setting for Seismic acquisition is 10.
a. Gain =1 maximum input is +or – 1.2 volts.
b. Gain =10 maximum input is +or – 0.12 volts.
c. Gain =100 maximum input is 0.012 volts
2. Sample Rate – This entry allows for different sample rate selection.
a. 8 msec- 125 samples per second
b. 4 msec – 250 samples per second
c. 2 msec – 500 samples per second
d. 1 msec – 1000 samples per second
e. 0.5 msec- 2000 samples per second
f. 0.25 msec- 4000 samples per second
g. 0.125 msec – 8000 samples per second
3. Acquisition Time – This entry selects the acquisition time for each acquisition.
Trigger Settings allows for two different trigger inputs
1. Auto Trigger (ReMi) - When this selection is enabled, the DAQlink unit will
trigger immediately and will record and transmit data to the Vscope program
without an external trigger
2. Trigger on Time Break (Hammer Switch) – When this selection is enabled, the
DAQlink unit waits for a switch closure on the trigger input connector. This
selection is used when trigger input is connected to a standard Hammer switch.
Pins A and C of the 3-pin connector must be connected to the “+” side of the
Hammer switch, and Pin B must be connected to the “–“ side of the Hammer
switch.
DAQLink II System
17
GPS Menu
The GPS menu is used to setup the DAQlink for GPS position and timing.
Normally an external GPS unit is used. The baud rate selection is made with the Baud
rate software switch.
To use the standard Garmin GPS unit sold from Seismic Source, select External and 4800
baud rate.
The GGA string should appear when the correct baud rate has been selected.
Press the “Get Position” button to verify that the GPS unit has a valid position and the
GPS PPS pulse is wired correctly to the DAQlink.
18
User’s Manual
4.3 DAQLink Configuration Advance Mode
When first installed, the Vscope program uses Standard menus. These menus provide all
of the necessary options for normal seismic operation. The Advance menus can be selected in the
Option – Preferences –Menu.
Selecting Advanced Mode selects the advance menus
DAQLink II System
19
4.3.1 Device Acquisition Menu – Advance Mode
This menu allows the user to setup the acquisition parameters for the selected DAQLink
unit. Up to 24 channels per DAQLink unit are shown. The DAQLink unit automatically checks
the number of operating channels when the unit is reset.
The channels must be enabled to acquire data. A check mark shows that the channel is
enabled.
The end user can change the name field.
The type field should be set to generic unless acquiring data from a servo hydraulic
vibrator. When performing quality control tests on a servo hydraulic vibrator it is very important
to select the correct “type’ for each channel.
Gain – 4 preamp gains can be selected (x1, x10, x100)
DC-removal – Should normally be set to auto, for automatic removal of DC
Units and Scale used to display the Y axis in different units than volts. These settings are
used for quality control of “servo hydraulic vibrator”. These entries are used to compute pounds
or Kilograms in the quality control plots.
Same Settings in all Channels – clicking this will copy all of the highlighted settings to
all of the other channels
Standalone button should be checked, when DAQlink is acquiring data in standalone
mode. In this mode, the DAQlink stores the data to the internal compact flash memory. It does
not require a computer to be connected to acquire data. After the data is acquired, the DAQlink is
reconnected to a computer running the Vscope program, and the data from the internal compact
flash memory can be downloaded to the computer.
Figure 4.3.1 Device Acquisition Menu
20
User’s Manual
4.3.2 Trigger Menu – Advance Mode
The trigger menu is used for all acquisition. The trigger can be set to one of the
following selections
• Auto Trigger – When auto trigger is selected the DAQLink unit starts acquiring
as soon as the start command is processed
• Trigger on Time Break – When trigger on Time Break is selected, the DAQLink
unit receives and processes the start command from the computer, it then waits
for a signal on the Time break line before it starts to acquire data. The time break
circuit uses a differential input circuit. At least 3 volts should be applied for
reliable triggering. The unit can either trigger on a low going high voltage or a
high going low voltage.
• Trigger on input channel – When trigger on input channel is selected, the
DAQLink unit receives and processes the start command from the computer, it
then waits for the threshold voltage on the selected channel to be exceeded.
• Trigger on PPS Pulse- In this mode; the DAQlink uses the GPS time to trigger
the unit. The Timer data determines when the DAQlink will trigger.
o Timer Start At time – enter time when first trigger should occur.
o Repeat Every – Enter Time for unit to repeat trigger. An entry of
00:10:00, will cause the DAQlink to trigger every 10 minutes.
• Pre Trigger Delay – The DAQlink will record and display data before the trigger
event. Enter the time for the pre trigger acquisition
• Auto Start –When the auto start is enabled, the DAQlink will automatically start
a new record after it has finished with the previous recording. This allows the
DAQlink to record continuous data, when auto trigger is also enabled.
Figure 4.2.2 Device Trigger
DAQLink II System
21
4.3.3 Order Menu – Advance Mode
The order menu appears when a 24 channel DAQlink is connected, this menu is not
active with 6, 12, or 18 Channel DAQlink units. The order menu is used to arrange the channel
numbers in each DAQlink unit. This selection allows compensating for different spread cable
configurations.
22
User’s Manual
4.3.4 Device Analog Output – Advance Mode
The DAQLink unit can output a 16 bit Analog signal. The signal file must first be
selected then the program DAQ button must be clicked. When the program DAQ button is
pressed the selected file is downloaded to the DAQLink Flash memory card. To enable D/A
output select signal number from the Enable Output list.
For normal Seismic acquisition, the output should be disabled. Select “None” to disable
output in the enable output drop box.
Figure 4.3.4 Device Analog Output
DAQLink II System
23
4.3.5 GPS
The GPS menu can be used to check the status of the GPS receiver. Press the Get
Position button and the screen will be updated with the latest serial message from the GPS
receiver. The GGA string will show the data from the receiver. If valid GPS data is received,
then the Latitude, Longitude, Altitude and time will be displayed.
The GPS receiver can be connected internally to the unit or can be connected to the
external connection. Select the correct GPS configuration.
The DAQlink is designed to have an external GPS receiver connected to the 4 pin connector on
the DAQlink unit.
The GPS receiver can be connected to the 4 pin GPS connector using the PT06A-08-4P.
The normal Seismic Source GPS receiver is setup for 4800 baud.
To operate another brand of GPS receiver, the receiver must be setup with third party software
for the following:
• RS232 serial at 4800, 9600, or 19.2 K baud
• $GPGGA and $GPRMC messages – do no enable any other message
• PPS pulse – TTL level pulse per second
You will need a 4 pin mating connector (PT06A -08 -4P)
Wiring of 4 pin GPS Connector (PT06-08-4S)
A - +Battery - NO Connection
B- RS232 Receive - This is output of the GPS receiver
C – PPS pulse - This should be a 3 or 5 volt logic input to the DAQlink
D– GND
24
User’s Manual
On the Vscope software, go to options-Device -DAQ settings-GPS menu.
Select External GPS. (NOTE: When returning to this menu the Vscope program will show
Internal GPS selection even though the external GPS is selected)
Press "Get Position" will update serial string.
The data in the top window will show the serial data from the GPS receiver
The following is required for position data to appear on the screen:
• The GPGGA and the GPRMC messages are enabled
• A valid position with a PPS pulse is received.
Figure 4.3.5 Device GPS
DAQLink II System
25
4.3.6 DAQlink Calibration
The DAQlink preamplifiers can be set for different fixed gain settings. In addition to this
fixed gain setting, there is a software gain setting that is set by the user in the acquisition menu.
The geophone amplifier boards are set up with a fixed gain of x10. This allows a maximum input
signal of + or –1.25 volts. The accelerometer amplifier boards are set up with a fixed gain of x1
this allows an input voltage of +12.5 to –12.5 volts. To compensate for the different gains on the
amplifier boards, a software calibration number is entered at the factory. These entries are
normal set once by the manufacturer. If you need different gain settings, please consult the
factory to adjust calibration numbers and amplifier gain settings.
Figure 4.3.6 Device Calibration with gain = x10
26
User’s Manual
4.3.7 Device Advanced Menu
The Reset DAQ button performs a reset on the DAQlink hardware. The DAQlink must
have hardware version 3.03 date 12-2003 or newer and firmware version 4.9 or newer to perform
the hardware reset.
Reset Memory button is used to reset the storage of data to the internal Compact Flash
Card. The next acquisition after a reset will be stored in the first memory location on the compact
flash card.
Erase Memory button is used to erase all of the memory on the Compact Flash Card.
Normally there is no reason to erase the memory. This process may take a several minutes.
Set Oscillator is used to set the internal oscillator on the DAQlink unit. Normally there is
no reason for the end user to set the oscillator. It is set to 2047 manual value at the factory. If a
GPS unit is connected, then the automatic correction option should be selected.
Figure 4.3.7 Device Advanced Menu
DAQLink II System
27
•
5 Program Operation
5.1 Acquisition
Select menu Acquisition->Start or click
Acquire button or Press Ctrl A to start
acquisition.
Text at the bottom of the screen will display the status of the acquisition, next to the Rx
and Tx lights.
• Waiting- will be displayed when acquisition is started, but waiting for trigger
• Acquired N sec- will be displayed after trigger has occurred and program started
receiving data
• Processing – will be displayed at the end of acquisition
• Also the Status Tab at the bottom of the display can be used to monitor status of the
DAQlink units
To stop acquisition in progress select menu Acquisition->Stop or click
or Press Ctrl T.
Stop button
5.2 Projects
The VScope uses projects to save program settings and to store acquired data. The
projects are like folders used to sort and store different data. Each project saves its own
configuration for acquisition parameters, plot selection, scaling options, and other VScope
selections. Plus each project has its own database where the program keeps the saved data. This
allows the user to have different settings for different jobs and quickly switch between them. The
program remembers last project and loads it automatically on startup.
To create a new project click menu File->New Project. VScope will reset all its
settings to default values and will create an empty database. The program will create a separate
folder with the same name as a project and store new database and project file with extension
*.vsp to that folder.
To create a new project with the same settings as the current one select menu File->Save
Project. Create a new folder for this project and type a new name for VSP file. All settings from
the current project will be copied to a new one. Command Save Project does not store acquired
data, only program configuration.
When VScope is started for the first time it creates a default project – Project1. To
change the current project use File->Load Project menu and select a VSP file to load.
5.3 Database
5.3.1 Loading Data From Database
The VScope program has a built in database support. For this reason all of the data that
acquired by the program is stored as records in a database rather than in separate files. This
allows for greater flexibility with data manipulation, record searching and analysis.
The user can see all of the records in the current project database and select any record
for analysis by clicking
28
Open button or selecting menu File->Open (Ctrl O).
User’s Manual
Figure 6.3 Database Explorer
All records in a Database window are arranged into a table. It shows the following
columns:
• Index - Number used to index the database. It is incremented every time a data
record is stored;
• Start ID – Identifies the Start ID of the record. The start ID is incremented for each
new start command.
• Date - Date when data was stored to database;
• Time - Time when data was stored to database;
• Comment - Comment for data record. When recording and saving data to database
automatically, comment from previous record is copied to current record.
Toolbar buttons at the top of Database window help to find particular record.
Sort Records– Allows to select a column in the table, which will be used to sort
records.
Search – Allows to search a record using Index, Date, Device or Record #.
Search in Comment – Helps the user to find a record, which has some word
combination in the Comment column.
Range – Shows only records that lie withing some range (eg. betweet two dates).
Filter – Allows to set complex criteria for records to be shown in the table (Not
implemented yet).
Show All Records – Cancels all ranges and filters and allows the user to see all
records in the database.
Additional buttons
Edit Comment (Ctrl E) – Use this button to view or edit the comment
Delete (Del) – Use this button to delete data record from database
DAQLink II System
29
5.3.2 DAQLink and Channel Configuration
Clicking the “DAQ Configuration” and the “Channel Configuration” buttons can show
the DAQLink Configuration and the Channel Configuration for the saved data. The DAQLink
Configuration shows the acquisition parameters for each DAQLink used in the selected record,
also the GPS data will be shown if available. The Channel Configuration shows each channels
setup for the DAQLink unit selected in the DAQLink Configuration.
The DAQ Configuration includes the following information
• Serial # - Each DAQ Link has a unique device serial number. This number is stored
to database to provide a unique identification for each record;
• Record# - Each DAQ Link unit increments a counter every time it acquires data.
This record number along with the device # provides a unique identification for each
record.
• Acquisition Time - Length of record in seconds;
• GPS Data – Latitude, Longitude, Altitude and Time from the GPS receiver
Figure 5.3.2 DAQLink and Channel Configuration
30
User’s Manual
5.3.3 Import and Export Data
The import and export functions located in File menu allow for data to be exported or
imported to different projects or to different applications. The VScope currently offers the option
for the following import and export files
• VScope data files (*.vs2) – use this selection when moving data from one project to
another, or from one computer running the VScope program to another.
• Space delimited files (*.csv) – use this selection when importing or exporting file to
third party software such as spreadsheet software (e.g. Microsoft Excel and so on).
• Sercel VQC88 files (*.dat) – use this selection when importing or exporting data to
be used on Sercel VQC88 analysis program.
• Pelton Force Meter Files (*.fmr) – use this selection when importing or exporting
data to be used with the Pelton Vibrator Quality Control System
• SEG Y Tape format – (*.sgy) – use this to import or export data to the standard SEGY Tape Format
• SEG II format – (*.sg2) – use this to export data to the standard SEG-II Format
While in the Database Explorer multiple records can be exported to SEG-Y, or SEG-2
format. First select the records to be exported by highlighting them using the left button and the
“ctrl” left button. After the desired records are selected use the pull down menu Record – Export
to select the export function.
Figure 5.3.3 Exporting data with Database Explorer
DAQLink II System
31
While in the database explorer, all records can be selected by pressing ctrl A (or go to Edit- Select
All Menu).
After selecting all of the records, you can eliminate records that you do not want to
export. Move the mouse to the record that you would like to omit from the list. Hold the ctrl
button and press the left mouse button once. Then go to the next record to omit and hold the ctrl
key and press the left mouse button. Continue until all of the records to be omitted have been
selected.
After selecting all the records, go to the Record – Export menu, to export the selected
records.
Pressing the left mouse button once will unselect the record from the list. The record will
show highlighted until another record has been selected.
Doing a double click of the left mouse button will select the stack function.
Holding the ctrl button and pressing left mouse once will unselect record, holding ctrl
button and pressing left mouse button again will reselect the record.
When storing multiple records to the VScope data files (*.vs2), all of the selected
records will be stored to one *.vs2 file. The multiple record *.vs2 file can only be loaded while in
the database explorer menu. Use the Records –Import menu to load the *.vs2 file.
When storing multiple records to SEG-Y or SEG-2 file format, each selected record will
be saved to a different file name. The name that is entered in the “save as” window will be used
along with the record # to create the file name.
32
User’s Manual
5.3.4 Storing Data to Database
After acquisition is finished you can save new data to database. Select menu File->Save
(Ctrl S). A window will appear where you can enter a comment for current record. By default
this window displays a comment from the last record in the database.
5.3.5 Stacking Data in Database
While in the Database menu, multiple records can be stacked together. Select the records
to be stacked by pressing the “Ctrl” key and clicking the left mouse button. After the records to
be stacked have been selected, press the “Show Stacked” button in the bottom right hand corner
of the screen. The selected records will be added together and can now be viewed. Press the File
– Save button to save the stacked data to the database.
Figure 5.3.5 Stacking data with Database Explorer
DAQLink II System
33
5.3.6 Inverting Data before Stack – Shear Wave
One method of Shear Wave acquisition is done by hitting one side of a plate and storing
the data, then hitting the opposite side of the plate and storing the data. The second record is
inverted and then the two records are summed to show only the Shear wave energy.
Vscope allows this operation. Store both of the records to the database. Then go to the
database and select the second record. Press “Ctrl I” to invert all of the traces in the selected
record.
After the traces have been inverted, the values in the Calibration column will show
negative numbers.
34
User’s Manual
After the one record has been inverted, then select the two records to stack, then press
“Load Stack” button to view the two stacked traces
The stacked data can then be stored to the database.
.
DAQLink II System
35
5.3.7 Near Trace Gather
While in the Database menu, select the records to use for the Near Trace Gather by
highlighting each record.
After highlighting the desired records, select the “Near Trace Gather” option in the File
menu.
Enter the channel # for the near trace gather. This one channel from each record will be
plotted
36
User’s Manual
DAQLink II System
37
5.4 Data View and Analysis
5.4.1 Graph plot types
Buttons on the toolbar and the View menu allow you to select different ways of signal
representation on the graph plot
Shows time domain plot of acquired signal
38
User’s Manual
Shows signal spectrum in frequency domain
The time window allows performing a spectrum analysis on a time window. An entry of
1 to 2 performs the spectrum on the data between 1 and 2 seconds. An entry of –1 to –1 performs
analysis on the whole trace.
DAQLink II System
39
Select correlation to display correlation, phase of
correlation, envelope of correlation, or spectrum of
correlation. Also, correlated Seismic Plots can be displayed.
The correlation will be performed using the channel defined in the DAQ units type field
= Reference. Other channels can be selected with the assigned reference pull down menu.
Seismic Plot can be shown in Vertical or Horizontal display. Also peaks of signals can
be clipped.
40
User’s Manual
5.4.2 Plot Popup Menu
The same selections are available in the plot popup menu. On any plot press the right
mouse button to bring up the plot menu.
Figure 5.4.2 Plot Popup Menu
Axis allows changing of the x and y axis of the plot.
Full view or ctrl +F zooms out completely to show all of plot.
Show Legend –enables and disables the text legend at the bottom of the plot.
DAQLink II System
41
5.4.3 Store Plot Menu
Store Plot – allows the current plot to be saved to memory and viewed later as an overlay
to another signal. The first trace in a plot will be stored. The color and name of each stored plot
can be changed in the Store Plot Menu. The stored plot data can be saved and later loaded from
disk with the Save and Load buttons in the Save Plot menu. The store plot menu is used to
compare data using the same sample rate. Data acquired using different sample rates will not be
displayed correctly.
Figure 5.4.3 Store Plot Menu
View Stored – used to retrieve the saved plots in memory.
42
User’s Manual
5.4.4 Seismic Plots
There is an additional option for a Seismic Plot. When the signal traces plot is selected,
the Seismic Plot option can be selected. The plot can be either Horizontal or Vertical. Also, the
peak of the signals can be clipped to allow better viewing of multiple channels with large gains .
Figure 5.4.4 Vertical Seismic Plot – The x-axis shows “Trace #”
The Seismic Plots use special keys to control the gain and traces separation. The normal
Zoom and axis control used in the other plots do not work well with the Seismic plot
The “+” key on the numeric keypad – increases gain of each trace
The “-” key on the numeric keypad – decreases gain for each trace
The “Ins” (Insert) key increases separation between traces
The “Del” (Delete) key decreases separation between traces
DAQLink II System
43
Pressing the right mouse button when it is on the graph, will pull up the plot popup menu.
Select the Scale feature. The scale window allows the user to select different scaling options for
the Seismic Plot.
Absolute Max – Applies the same gain to every trace
Equalize – Applies a different fixed gain to each trace. The gain is different for each
trace to equalize the amplitude of the traces.
AGC – Applies an AGC (automatic gain control) to the data. The AGC algorithm
equalizes the energy in the entered time window .
Individual Scale – The user can enter a fixed scale for each trace. Highlight the channels
under the individual scale selection, and use the up down arrows to increase or decrease the scale.
Clip Channels- When selected the amplitude of each channel will be clipped, so that it
will not overlap to the next channel.
Figure 5.4.4.1 Vertical Seismic Plot – Scale Feature
44
User’s Manual
5.4.5 Setting Zoom Level
Zoom buttons on the toolbar and the View menu help to adjust a view of a selected plot
Axis allows changing of the x and y axis of the plot.
Full view or ctrl +F zooms out completely to show all of plot.
To adjust zoom with the mouse press the left mouse button and make a box to zoom in on
an area of the plot. Start at the top left corner and move to the bottom right corner.
Figure 5.4.5 Zooming In With The Mouse
After releasing mouse button the plot will zoom in. After zooming in, making a box with
the mouse from bottom right to top left will zoom out.
The plot position can be changed by clicking and holding right mouse button and
dragging plot in desired direction.
DAQLink II System
45
5.4.6 Additional Plot Functions
Opens a new plot window
Toggles selection of the remove DC feature. When enabled
this feature removes the DC component from the input signal
before plotting or analyzing data. Status of selection is
shown in the Plot info window at the bottom of the screen.
46
User’s Manual
5.4.7 Filters
High Cut, Low Cut and Notch filters can be setup and selected. The Tool
bar can be used to select or unselect each filter. If the Toolbar button appears pressed in then the
filter is selected.
The setup for each filter can be found under the pull down menu Option – Preference.
The pass band, and stop band frequencies for the Highpass and Lowpass filters can be set. The
Notch Filters Center Frequency and the width can also be set.
Figure 5.4.7 Filter Selection
There are two additional options for exporting the data.
Normally the remove DC offset when exporting is always enabled
The “Export filtered data if filter is enabled” selection is normally not enabled. When
enabled the exported SEG-Y or SEG-2 data will have the filters applied. Normally the raw data
is exported and filtering is done by the processing center.
DAQLink II System
47
5.4.8 Display Settings
The Display Settings menu allows the user to select either the A/D units (Volts), or some
other display unit which was setup in the DAQLink configuration.
For normal Seismic operation A/D units should be used
Figure 5.4.8 Display Settings
48
User’s Manual
5.4.9 Auto Operation
Auto Operation menu allows the user to setup the following automatic operations
• Auto Start Acquisition – After the data is acquired from all of the selected
DAQLink units, the Vscope program automatically sends a new start command
out to the selected units.
• Auto Stack Records- When selected the program will automatically stack the
records. See Memory Function
• Auto Save to Database – After the data is acquired from all of the selected
DAQLink units, the data is automatically saved to the database with the comment
that is in memory. The number of stacked records determines when the stacked
record will be saved.
• Confirm before stacking – When selected, the user must confirm that each new
record should be added to the stack.
Figure 5.4.9 Auto Operation
DAQLink II System
49
5.4.10 Lock and Unlock Menu Option
The Lock menu option is normally not used. It is designed to lock the menu when
operating in an automatic acquisition mode, and accidental keyboard entries should be ignored.
To unlock the keyboard, type “ssc” as the password.
50
User’s Manual
5.4.11 Noise Statistic Window
The real time Noise Monitor Window can be selected by the “Open Noise Statistic”
button on the tool bar, or by pressing ctrl F7.
The Noise Statistic Window shows analysis of the current acquired data.
The RMS, maximum, minimum, and DC levels of each trace are shown for the current
record.
DAQLink II System
51
5.4.12 Real Time Noise Monitor
The Real Time noise can by shown by checking the “Real Time” box on the Noise
Analysis Window. In this mode the graph will continue to update between records. The Y-axis
needs to be selected to a fixed scale. This allows the bar graphs to show the noise levels related
to a fixed scale. If auto scale is selected, then the bar graphs show full scale even when the noise
level is very small.
Default scaling of the x and y axis is autoscale.
The scale should be changed to a fixed scale by right clicking the graph and selecting the
Axis menu.
Select the fixed y-scale so that the bar graphs are small for acceptable noise levels and the
bar graphs are large for high noise levels. This allows the operator to monitor the noise level on
the spread in real time. On some jobs with large cultural noise, the real time monitor is used to
time the trigger event for minimal noise levels.
52
User’s Manual
5.5 Status information Tabs
The Status information tabs at the bottom of the main window provide useful information
about the current operation of the system.
5.5.1 Comment
The Comment tab shows the current comment for the record
Figure 6.5.1 Comment
5.5.2 Record Information
The Sweep information tab shows important information about the record.
Figure 5.5.2 Record Information
DAQLink II System
53
5.5.3 Plot Information
The plot information tab shows the status of the plot selections for the current record.
Figure 5.5.3 Plot Information
5.5.4 Status
The Status tab shows the status of the DAQLinks connected to the system. This is very
useful in troubleshooting wireless Ethernet connections.
Figure 5.5.413 Status
5.5.5 Errors
The Error tab shows any communications error or error detected by the DAQLink unit. If
an error occurs this tab is automatically displayed.
54
User’s Manual
5.5.6 Communication Tab
The communication tab shows the current status of the DAQLink units that have been
selected in the DAQLink setup menu. This is useful when using the wireless Ethernet option.
Figure 5.14 Communication
5.5.7 Network Tab
The Network Tab is used to show the current IP address that was detected when VSCope
started. The IP address of the computer should show 192.168.0.101.
Figure 5.15 Network Tab
DAQLink II System
55
5.6 Memory Window – Stacking Operation
The memory window is used to stack multiple records in real time. Go to the Option –
Memory selection to open the memory window. The Option – Preferences – Auto operation
settings are also used to set up automatic stacking and storing of multiple records. Each record is
stored in memory and can be saved to the database.
5.6.1 Auto Stack Operation
The “Auto Operation” menu can be used to automate the stacking and saving process.
When Auto Stack is enabled the following “Hot Keys” can be used
“ESC” Stops Acquisition
“Clear” button on Tool Bar will reset Stack number to “1”
“F2” Ends Stack – Saves current Stack and Clears Stack number
56
User’s Manual
5.6.2 Memory Window
Opening the Memory Window shows details of the stacking process
Figure 5.6.1 Memory Window
The memory window tool bar is used to control the operations of the memory window.
The memory clear button is used to clear all records from memory. Press this button
before starting a new stack
The load from database button allows a record from memory to be loaded into the
memory buffer
The save to database button saves all of the selected records in the memory buffer to
the database
The stack button allows the selected records in memory to be stacked
The memory delete button allows the selected record in the memory buffer to be
deleted.
The show record button allows the selected record in the memory buffer to be
viewed.
Figure 5.6.2 Memory Window Tool Bar
DAQLink II System
57
5.7 First Break Pick Feature
The Edit -Picker menu or the
button on the tool bar is used to enable the first break
pick feature. With this feature enabled go to the point on the screen and left click the mouse.
Figure 5.7.1 Picks on Seismic Plots
58
User’s Manual
Right click on the screen and select pick table. The pick table will appear on the left side
of the seismic plot. The time of each pick is shown in the table.
The geophone spacing is entered at the bottom of the screen. The velocity will be
computed using the picks and the geophone spacing.
DAQLink II System
59
on the toolbar is used to select the geometry
The Edit – Geometry selection or the
window.
The X (distance) and Z (elevation) of each geophone is entered in the table.
Figure 5.7.2 Edit Geometry Screen
The File –Save pick selection is used to save the picks to a File. This pick file is in a
standard format to be used by other processing software.
60
User’s Manual
6.0 Advanced Features
6.1 DAQlink Continuous Recording
The DAQlink has the ability to perform almost continuous recording. Typical this type
of recording is done using a GPS receiver. This allows the recorded events to be referenced to a
GPS time.
6.1.1. Vscope Auto Start Function
The Auto Start function allows the DAQlink to perform continuous recording. There are
two basic auto start features with the Vscope and DAQlink system. The Vscope auto start allows
the software program to restart the DAQlink unit. The DAQlink auto start allows the DAQlink to
auto start itself without being commanded from the Vscope program.
Vscope auto start allows the Vscope program to restart the DAQlink unit. This function
is enabled by pressing the “Auto Start” button on the tool bar, or by pressing the (Ctrl + R) Hot
Key. This function toggles the auto start “on” and “off”. After auto start is enabled, a manual
start is required to start the cycle.
When the Vscope auto start is enabled, the Vscope program first completes acquisition of
the current record, and then automatically restarts the DAQlink unit. There will be a delay
between records depending on the acquisition parameters.
DAQLink II System
61
6.1.2 DAQlink Auto Start Feature
The DAQlink also has an auto start feature. This feature is enabled in the OptionsDevice-DAQ setting menu. Advance Mode must be selected in the Option-Preference menu to
enable this screen. There are three selections in this menu
1. Disabled – This selection disables the DAQlink auto start
2. Without Start Command – When this selection is enabled, the DAQlink will start
acquisition as soon as the unit is powered up. This selection is used when the
DAQlink will not be connected to a computer running Vscope during acquisition.
3. After Start Command – This selection enables the auto start feature after a
“Start” Command has been sent from the Vscope program. This mode is used
when the unit is connected to a computer running Vscope.
62
User’s Manual
6.1.3 GPS Trigger on PPS
The DAQlink unit can be set to trigger on the GPS PPS clock. First the trigger on PPS
pulse must be selected in the trigger selection, and then the Timer values must also be selected.
Timer Value:
Start At: The Start At time is used when the exact time of an event is to be used to
trigger the DAQlink. Example: 01:00:00 will delay the start of acquisition until 01:00 GMT.
(This time is referenced to GPS time). An entry of 00:00:00 is used to allow the repeat every
entry to be used without an exact start time.
Repeat Every: The repeat every entry is used to determine when the next auto start will
occur. Example an entry of 00:10:00 will cause an auto start to occur the next time the GPS time
is on an even 10 minute boundary (10:00).
Example 1: It is 1:13 GST. The DAQlink is set with the following:
Start Time = 00:00:00
Repeat Every = 00:10:00
The DAQlink will start acquisition at the following times:
01:20 GST
01:30 GST
01:40 GST
etc..
Example 2: It is 1:13 GST. The DAQlink is set with the following:
Start Time = 02:00:00
Repeat Every = 00:10:00
The DAQlink will start acquisition at the following times:
02:00 GST
02:20 GST
etc..
DAQLink II System
63
6.1.4 Synchronize A/D converters
The DAQlink units use a 24 bit Sigma Delta Analog to Digital converter for each
channel. These converters can be synchronized to a trigger event. The synchronizing allows the
timing to be precise when triggering on an event. If the converters are not synchronized, then the
trigger input will use the next available sample from the converter. This will cause up to 1
sample of timing error. When the converters are synchronized the samples will be reset and the
data will be synchronized with the trigger event.
Synchronizing the converters cause a delay in obtaining a valid result. The following
delays are required depending on sample rate:
•
0.125 msec – 1msec
•
0.250 msec – 3msec
•
0.500 msec – 6msec
•
1.000 msec –21msec
•
2.000 msec –36msec
•
4.000 msec –100msec
•
8.000 msec -160msec
64
User’s Manual
6.1.5 Continuous Recording Examples
Example 1: Setup DAQlink for Autonomous continuous recording using GPS time.
With the following setup the DAQlink will record the data to the internal Flash memory.
The data must be downloaded to the Vscope computer after recording is completed. Each record
will have 599.5 seconds. There will be a 0.5 second delay between records to allow for the A-D
synchronization.
Sample Rate = 1.00 msec
Sample Length = 599.5 seconds
Standalone Mode enabled – this selection disables the output to the Vscope computer.
Trigger on PPS pulse
Start Time 00:00:00
Repeat Every 00:10:00
Synchronize A-D
Auto Start – Without Start command
DAQLink II System
65
The internal GPS oscillator should also be adjusted to GPS time. This allows for the long
records to have correct timing. This selection is found in the Device- Options-Advanced settings
tab.
66
User’s Manual
6.2 Continuous Monitoring of data
The Vscope DAQlink system allows continuous monitoring of a small number of
channels. Larger number of channels slows the computer program system too much for
continuous monitoring. First set up the DAQlink for short records.
Example 1 msec sample rate
1 second record
Set up the DAQlink to record. Setup system for appropriate trigger method. Either setup
for auto trigger for continuous monitoring, or use actual trigger to monitor actual event.
Select signal graph and go to axis setup.
Select Scope Mode, and set x –axis to larger than acquisition time.
Start acquisition. Each time the 1 second record is received; the graph is updated in real
time. Example shows result of 6 one-second records.
DAQLink II System
67
6.3 DAQlink Flash Card Download
The DAQlink unit stores all data to an internal compact Flash card. The records can be
downloaded to the Vscope program after data has been acquired.
Before using the Flash Card option, it is best to reset memory in the Flash Card.
Reset Memory – pressing this button will cause the next record to be recorded at the first
of the memory card.
Erase Memory – This function erases all data from the Flash card. This is not usually
required. It may take over an hour to erase all memory from a Large Flash Card.
68
User’s Manual
6.3.1 Downloading single records
To download a single record from the DAQlink Flash card memory, go to OptionsDownload Menu.
After pressing the “Get List of Records” button, a list of all of the stored data will appear.
Select record to be downloaded from the list by highlighting the record. Press Download
selected.
Record will be downloaded.
Press Close to view the record.
Press File – Save to save the record.
DAQLink II System
69
6.3.2 Downloading Multiple Records
To download a multiple record from the DAQlink Flash card memory, go to File – Open
Menu, and open the database explorer.
From the database explorer, go to the DAQ- Download Records menu.
There is also an option to download all of the data stored in the Compact flash.
After pressing the “Get List of Records” button, a list of all of the stored data will appear.
Select the records to be downloaded from the list by highlighting the record. Press
Download selected.
The selected records will be stored to the database.
70
User’s Manual
6.3.3 Compact Flash Storage
The compact flash card stores all recorded data. Different size Compact Flash cards are
available. The cards must have a very fast read and write time to be able to record at the fast
sample rates.
The number of records that can be stored depends on the sample rate, number of
channels, and record length.
When the memory is full, the DAQlink starts over at the beginning and overwrites the
stored data at the beginning of the Flash Card memory.
To estimate number of records, the following guidelines can be used.
•
Each sample of data = 3 bytes
•
Header information = about 5% of record length ( normally ignored when estimating)
Example: 24 channels at 2msec, 1 second record.
24 channels * 500 samples/sec* 1second* 3 bytes/sample
Equals = 36 K bytes
Or a 32 Megabyte Compact Flash can hold about 800 records
A 1 Gigabyte Compact Flash Card can hold about 27,000 records
DAQLink II System
71
6.4 Vibrator Quality Control - DAQLink Configuration
The Vscope DAQlink system can be setup to analyze Servo Hydraulic Vibrator
Equipment. Usually independent accelerometers are mounted on the Reaction Mass and
Baseplate assemblies. These signals are compared with the Pilot (True Reference) signal from
the recorder. Start Time accuracy; Phase error, Force output, Distortion, and correlation noise are
some of the analysis that can be performed.
6.4.1 Vibrator QC Hardware Setup
•
•
•
•
•
•
•
•
•
•
•
•
72
Connect the accelerometer interface box to the 55-pin connector on the DAQlink
II unit.
Some accelerometer interface boxes have a 3 pin connector which must be
connected to the 3 pin trigger connector on the front of the DAQlink unit.
Connect the battery cable to the DAQlink unit
Connect the Ethernet cable from the Computer to the DAQlink II unit
Connect the True Reference Signal from the Vibrator to Channel 1 on the
accelerometer interface box.
Connect the Reaction Mass accelerometer to Channel 2 (LRM) on the
accelerometer interface box
Connect the Baseplate accelerometer to Channel 3 (LBP) on the accelerometer
interface box.
Channel 4 and Channel 5 are optional inputs for additional accelerometers.
When connected to the independent accelerometers the Switch should be turned
“on”. The switch enables the internal current regulator and powers the
independent accelerometers. One switch controls the current regulators on
Channels 2 and 3, and the other switch controls the current regulators on
Channels 4 and 5.
When connected to any other accelerometer or signal, the current regulators
should be turned off. The accelerometers directly from the Pelton or Sercel
Vibrator controller can be input into the DAQlink unit. In this case the current
regulators should be off, because the Sercel or the Pelton controller will power
the accelerometers.
The TB (Time Break) on the interface box can be connected to the Time Break
signal on the control electronics.
Make sure the independent accelerometers are attached securely to the vibrator
assembly. The magnets will work OK if the there is a clean flat surface to mount
the accelerometers. To insure good results, it is best to mount the accelerometers
directly to the vibrator assembly.
User’s Manual
6.4.2 Vibrator QC Software Setup
Start a new project for Vibrator QC. Go to File – New project and select Project Mode as
“VibratorQC”.
. Go to the Options – Preferences Menu – Display Options and select “Display Units” to
allow “lbs” to be displayed on the graphs. Use A/D units to display voltage levels.
DAQLink II System
73
Setup the Weights for the Vibrator to be tested. Go to the Option – Vibrator Menu
This opens up the Vibrator Setup Menu
The proper weights of the Reaction Mass and Baseplate must be entered for each
vibrator to be tested. Also the sensitivity of the accelerometers to be used must also be entered.
The Vibrator QC option includes independent accelerometers. These accelerometers
have a sensitivity of 10 mV/G. The control accelerometers from Seismic Source Co. have a
sensitivity of 25 Mv/G.
The Sercel scaling is used when connected directly to the accelerometer signals on the
Sercel VE432 vibrator control electronics.
After entering the correct weights press close button.
74
User’s Manual
Go to the Options- Device – DAQ Settings menu.
Standard Menu Display
First Select the QC mode of the operation.
Vibrator QC – This mode is used when testing a single Vibrator using the Force Two test
cable or the VibQC accelerometer I/F box
Wireline – Is used when testing multiple vibrators using the SSC Wireline adapter box
Zero Time is used when comparing the True Reference from the Encoder to the True
Reference in the Vibrator units.
After selecting the QC mode, then select the signals to be recorded. Typically in Vibrator
QC Mode only the first three channels are used.
Ch1 – Reference
Ch2 – Baseplate
Ch3 – Reaction Mass
Select Sample interval and Acquisition Time to match the sweep.
Display units should match the weights used in the Vibrator Parameters. If the Vibrator’s
weights were entered in pounds then select “lbs”. If the vibrator weights were entered in Kg, then
select Kg.
Select Trigger Source – Auto, Time Break on Reference Amplitude
DAQLink II System
75
Advance Menu Display
Figure 6.0.1 Vibrator QC DAQ settings
The advance menus allow more flexibility in the setup, and additional information
must be entered for proper operation.
Signal type is very important when doing vibrator quality control.
•
•
•
•
•
76
Channel 1 type should be selected to REF. This selects channels number one as
the reference channel this signal will be used for the reference signal in the
Vibrator analysis. Only one signal can be selected as the reference signal.
Channel 2 type is selected to be LRM – Loop Reaction Mass. This is the signal
connected to the Reaction Mass accelerometer. Only one signal per DAQlink
unit should be selected for LRM. If a second accelerometer is to be placed on
the reaction mass, then select the second signal’s type to be SRM – Similarity
Reaction Mass.
Channel 3 type is selected to be LBP - Loop Baseplate. This is the signal
connected to the Baseplate accelerometer. Only one signal per DAQlink unit
should be selected for LBP. If a second accelerometer is to be placed on the
baseplate, then select the second signal’s type to be SBP – Similarity Baseplate.
Select Auto for DC removal – This will remove most of the DC bias from the
accelerometer signal. The remaining DC must be removed by the Vscope
software. Be sure to have DC removal selected in the Vscope parameters. This
setting can be verified by looking at the Plot Info Tab at the bottom of the screen.
The units can be set to either pounds (lbs) or Kilograms. This entry is used on
the graphs for display. Any texts can be entered here. Normally it is either lbs of
Kg.
User’s Manual
Select Vibrator from the list.
Figure 6.0.2 Vibrator QC Weight settings
The weights must be entered correctly for the Vibrator Analysis to be correct
•
•
•
•
Reaction Mass Weight – enter the weight of the Reaction Mass in either pounds
or Kilograms.
Baseplate Weight –enter the weight of the Baseplate in either pounds or
Kilograms
Hold Down Weight – enter the hold down weight of the vibrator. This entry is
only used to scale the reference signal when the y- axis is selected for weight.
Enter the accelerometer sensitivity (milivolts per G) of each accelerometer used.
The independent accelerometers supplied by Seismic Source Co. are typically 10
mv/G. The Pelton M4 and M5 accelerometers are 25 mv/G. The Seismic Source
M6 accelerometers are 25 mv/G
The Sercel scaling is used when connected directly to the accelerometer signals on the
Sercel VE432 vibrator control electronics.
DAQLink II System
77
Figure 6.0.3 Vibrator QC Trigger settings
The trigger is normally done using either the Vibrator’s Reference signal or the
Time Break signal from the Vibrator controller.
•
•
•
When using the Reference for trigger. Select channel one as shown above and
select a level that allows the system to trigger reliably. A pretrigger time is also
provided. This allows viewing of the signals before the triggered event.
The Time Break signal can also be used to trigger the DAQlink unit. The time
break from the Vibrator control system provides a signal at the start of the sweep.
This allows consistent triggering when changing sweep parameters.
The Time Break from the Pelton Advance II series vibrator electronics does not
work well when starting locally. It should work when the Encoder starts the
Vibrator Electronics.
It is often a good idea to use the auto trigger function first when getting setup to do the
test. This allows the operator to look at the signal levels and determine if everything is setup
correctly.
78
User’s Manual
6.4.3 Vibrator QC plots
Vibrator QC plots includes the following: requires Options – Preferences – Display
Settings to be set to VibQC
Select Vib Analysis to do one of the following
• Phase
• Fundamental Output
• Peak Output
• Frequency versus Time of Sweep
The Vib Analysis routines use the channel defined in the DAQ unit type field
=Reference. Other channels can be selected with the assigned reference pull down menu.
Select to display distortion analysis of signals
Harmonic Distortion uses the channel defined in the DAQ unit type field =Reference.
The energy of the signal selected is computed for the 1st, 2nd, 3rd, 4th and 5th harmonics of the
Reference Signal.
Time Variant Spectral Analysis – Performs spectral analysis on small time windows of
the selected signal. The resulting plots shows time in the x-axis, frequency in the y-axis, and
amplitude in the z-axis. The z-axis can be changed by the user. Press the right mouse button on
the display to access the axis menu. If the default z-axis is max =0 and min=-170, then the graph
is displaying distortion that is 170 dB below the maximum. After changing the minimum to –60,
the graph will then show the distortion that is between 0 and –60 dB. This is very useful in
examining distortion levels.
Select to compare two signals. Used to compare
accelerometer amplitude and phase.
Toggles inversion of accelerometer signals –status of
inversion can be shown in the Plot info window at the
bottom of the screen.
Toggles selection of the smooth plot feature. Status of this bit
can be shown in the Plot info window at the bottom of the
screen.
DAQLink II System
79
6.4.3.1Vscope Graph Options
Signal Graphs
80
User’s Manual
Spectrum Plot
DAQLink II System
81
Correlation
82
User’s Manual
Vibrator QC Analysis
DAQLink II System
83
Distortion Analysis
84
User’s Manual
Compare Plots
DAQLink II System
85
Overlay Plot menu
86
User’s Manual
6.4.4 Vibrator QC example
Setup
Bird Dog II
• Connect BirdDogII to power – (9-18 volts DC)
• Connect Bird Dog Ethernet Cable to Computer
• Connect Vibrator QC interface to the 55-pin connector on the Bird Dog II unit
Vibrator QC interface
• Connect Channel 1 to True Reference Signal (Pilot) from either the Encoder or
Vibrator Electronics
• Connect Channel 2 to one of the Magnetic Accelerometer using the coax cable
provided with the accelerometer.
• Connect Channel 3 to the Magnetic Accelerometer using the coax cable provided
with the accelerometer.
• Turn the Current Regulator to the “on” position
• Place Channel 2 accelerometer on the Baseplate of the Vibrator
• Place Channel 3 accelerometer on the Reaction Mass of the Vibrator
Setup Vscope as follows:
Go to the Options –Vibrator Menu and setup the Vibrator’s parameters.
•
Make sure Weights match the Vibrator’s weight
•
Use Sensitivity = 10 mv/g when using the magnetic accelerometers
DAQLink II System
87
Options – Device –DAQsettings Menu
Select Acquisition time to match Sweep length
88
User’s Manual
Select Vibrator Type to match Weights of the vibrator to be tested
M18 shown
Select OK when finished.
DAQLink II System
89
Acquire Data
Start Vscope by Clicking the “Start” button or pressing “A” on the keyboard
Start a sweep in the Vibrator.
The Vscope should trigger when the vibrator starts shaking. If not check the True
reference signal.
Display Results
Select “New Plot” and select signal plot as shown
90
User’s Manual
The display should look similar to
Channel 1 is reference sweep
Channel 2 is Baseplate signal
Channel 3 is Reaction Mass Signal
Channel 4 is the computed Weighted Sum signal or Ground Force
This plot provides a quick check that all of the signals are working correctly.
DAQLink II System
91
Open “New Plots” and select the QC analysis that is required.
Normal QC plots include:
• Vibrator Analysis – Phase – Loop Ground Force compared to Reference
• Vibrator Analysis – Fundamental Force – Loop Ground Force
• Vibrator Analysis – Peak Force – Loop Ground Force
After selecting these plots, Press “Tile H” the screen should appear as shown.
Note: Press Invert to change phase of Ground Force from 180 degrees to 0 degrees
Right Click on any graph to change scale or axis
Press File – Save to save data
92
User’s Manual
7 Specifications and Options
7.1 Options
The DAQLink unit has several options
• Compact Flash – 32 Mbyte standard. Up to 2 Gbyte optional. The Flash card is
used for
o Buffering of data- Temporary storage of data until data can be sent over
network. Amount of storage required depends on the speed of
acquisition and the speed of the network
o Storage of data while not connected to network. The Flash card can be
used to store data while the unit is not connected to the network, later
this data can be downloaded to the computer.
o Storage of D/A output data
• GPS option – The GPS option is used for
o Position information – When valid position data is available form the
GPS receiver the position information is stored along with the data.
o Timing – The GPS receiver can be used to stored precise time of the data
collection
o Oscillator adjustment- The internal oscillator of the DAQLink unit can
be adjusted to match the GPS clock.
• A/D boards
o Version 1 A/D boards – maximum voltage is plus and minus 10 volts,
and are made to compensate for the accelerometer’s 10 volt DC bias
o Version 2 A/D boards – maximum of plus and minus 12.5 volts and are
made for small DC offsets found when using geophone inputs.
• Analog Cables
o The DAQLink II unit has a 55 pin connector for the analog inputs.
Various analog cable options are available for the end user.
• Power and Ethernet Switch Box
o This option allows multiple boxes to be connected over the Ethernet
cable
o This option can also be used between boxes to increase the maximum
distance between boxes. The standard specification for transmission of
data over CAT5 cable is 100 meters.
• Wireless Ethernet Option
o Wireless Work group bridges and Wireless access points can be used to
transmit the data from the DAQLink unit to the host computer
o High Gain antenna are available to increase the range of the Wireless
network
DAQLink II System
93
7.2 Specification
7.2.2 DAQLink II
Specifications:
Configuration: 6, 12, 18, or 24 channels in each DAQLink II unit. Multiple units can be
connected to achieve many channels.
Maximum Channels per box:
24 channels at 0.125 msec sampling
24 channels at 0.250 msec sampling @ 2 times over sampling
24 channels at 0.5 msec sampling @ 4 times over sampling
24 channels at 1.0 msec sampling @ 8 times over sampling
24 channels at 2.0 msec sampling @ 16 times over sampling
A/D conversion: Uses Burr-Brown ADS1254 24 bit A/D converters with oversampling,
digital filtering, and decimation to maximize signal quality.
Dynamic Range: 144 dB system; 117 dB measured @ 8 millisecond sampling @ G= x1
Bandwidth: DC to 4 KHz with version 1 analog cards
Common Mode Rejection: > 100 dB
Cross-feed Isolation: >100 dB
Noise Floor: 0.2 uvolt RMS at X100 gain typical
Distortion (THD): 0.001 %
Maximum Input Signal:
Input Impedance:
± 1.25 volt at X1 gain (Geophone amplifiers)
-12.5 to +24 volt at X1 gain (Accelerometer amplifiers)
20 Kohm, 20 picofarad (Geophone amplifiers)
200 Kohm, 20 picofarad (Accelerometer amplifiers)
Preamplifier Gain: x1, x10, x100
Filter: Digitally selectable filter depending on sample rate.
Analog Filter version 2 card: –3 dB @ 800 Hz; -47 dB @ 2000 Hz; -120 dB @ 8000 Hz
Display Filters: *User selectable, Notch, High Cut, Low Cut
Sample Interval: 0.125, 0.250, 0.5, 1.0, 2.0, 4.0, 8.0 msec
94
User’s Manual
Correlation: Performed by Host Computer Program
Record Length: User Selectable
Data Storage: Data stored on Compact Flash Card in the DAQLink unit. Compact Flash
is currently available up to 2 Gigabyte per unit.
Pre-trigger data length: User selectable (up to 32000 samples)
Delay: User selectable
Transmission: Uses standard Ethernet transmission of data to host computer. This can
be done via standard CAT 5 copper (250 meters maximum), or multimode fiber optic cable (1500
meters maximum), or using wireless access point radios (distance depends on terrain and antenna
type used). Fiber optic and wireless mode are options and require additional hardware.
Instrument Tests: Built in noise test and external lab quality test available
Data Format: Host computer allows storage of data in SEG-Y, SEG-2 or ASCII format.
Auxiliary Channels: Any Channel can be set to Aux or Data
Roll Along: No roll box required
Line Testing: Real time noise monitor
System Software: Unit comes with Host Computer Operating Software. Software
provides full support to setup unit for autonomous or real-time operation. Software also provides
viewing of data in the time and frequency domain. Software includes the following features; built
in stacking, amplitude spectrum, database storage, correlation, and trace comparison.
Data from multiple units are downloaded and sorted by the host software.
Data Storage: Stores Data internally in DAQLink II unit on compact Flash card. Also,
stores data on Laptop PC
Plotters/Printers: Uses Windows compatible plotters and printers
Hardware Triggering: Positive, Negative, with software adjustable level. Also contact
closure is available.
Software Triggering: User selectable event triggering allows DAQLink to continuously
monitor analog channels and record data when a set trigger level is exceeded. Unit automatically
stores the data recorded before and after the trigger event. The user selects both the pretrigger
and post trigger times.
Timing: Each DAQLink unit has internal real time clock. When connected to optional
GPS unit. The real time clock provides time stamp for each triggered event.
Continuous Recording: Each DAQlink can be set for continuous recording for vibration
monitoring.
DAQLink II System
95
Power: 11-18 VDC inputs, reversed voltage protected
Dimensions: 3x5.6x11in (76x144x280mm)
Weight: 3 lbs (1.4 Kg)
96
User’s Manual
8 Schematics
8.1 DAQlink Connector wiring
Power LED – Illuminates when power is applied to box.
Caution if Battery voltage drops below 11 volts, LED will light but DAQlink will not
perform properly
3 pin trigger Connector
A– TB active – A
B– TB return (GND)– B
C- +12 volt through 5 Kohm resistor
When DAQlink trigger option is set to trigger on Time Break, then this input is used to
trigger the box. This input drives an optoisolated input and requires about 3 volts minimum to
trigger. Positive Voltage should be applied to pin A, and negative voltage to pin B. Maximum
voltage should be less than 60 volts.
When using the ST-01 trigger switch, connect Pin A to Pin C and to the High voltage side
of the ST-01 switch. Connect pin B to the Low voltage side of the ST-01 switch.
4 pin GPS Connector (PT06-08-4S)
A - +Battery
B- RS232 Receive
C – PPS pulse
D– GND (jumper JP1 on DAQlink needs to be installed
An external GPS receiver can be connected to the 4 pin GPS connector using a PT06A08-4P. The GPS receiver must be setup for
• 4800 baud
• $GPGGA and $GPRMC messages only
Power 2pin MS to X9 connector
A – positive battery – A
B – negative battery - B
The DAQlink unit has a bridge rectifier built into the power circuit, so the unit will power
with either polarity on the battery connection. There are two internal fuses on the board to
prevent damage to the unit. However, we still recommend using an external fast blow fuse of 2
amps.
The unit can be powered from any DC source supplying a minimum of 11 VDC to a
maximum of 37 VDC.
Ethernet – 10 base T
Standard Patch cable to Computer
DAQLink II System
97
PT 22-55 connector
ABCDEFGHJKLMNPRSTUVWXYZ-
Ch 1 pos
Ch 1 neg
Ch 2 pos
Ch 2 neg
Ch 3 pos
Ch 3 neg
Ch 4 pos
Ch 4 neg
Ch 5 pos
Ch 5 neg
Ch 6 pos
Ch 6 neg
Ch 7 pos
Ch 7 neg
Ch 8 pos
6 – Ch 8 neg
7 – Ch 9 pos
8 – Ch 9 neg
9 – Ch 10 pos
10 – Ch 10 neg
11 – Ch 11 pos
12 – Ch 11 neg
13 – Ch 12 pos
a - Ch 12 neg
b- Ch 13 pos
c– Ch 13 neg
d– Ch 14 pos
e – Ch 14 neg
f– Ch 15 pos
g– Ch 15 neg
h – Ch 16 pos
i – Ch 16 neg
j – Ch 17 pos
k – Ch 17 neg
m – Ch 18 pos
n – Ch 18 neg
p – Ch 19 pos
q – Ch 19 neg
r – Ch 20 pos
s – Ch 20 neg
t – Ch 21 pos
u – Ch 21 neg
98
v- Ch 22 pos
w- Ch 22 neg
x- Ch 23 pos
y- Ch 23 neg
z- Ch 24 pos
AA- Ch 24 neg
D/A wiring
CC – Aout
GG – Aout FB
HH - GND
DD – TB (A)
EE – TB (R)
FF - + 24 volts
User’s Manual
8.2 DAQlink panel wiring
20 pin header
1 – Ch 3 neg
2 – Ch 1 neg
3 – Ch 3 pos
4 – Ch 1 pos
5 – Ch 2 neg
6 – Ch 2 pos
7 – Ch 5 neg
8 – Ch 5 pos
9 – Ch 6 neg
10 – Ch 4 neg
11 – Ch 6 pos
12 – Ch 4 pos
F
B
E
A
D
C
K
J
M
H
L
G
17 – Aout
18 – AoutFB
19 – GND
CC
GG
HH
Power LED
X8 pin 3 is positive
X8 pin 4 is negative
3 pin trigger Connector
X7 pin 1 – TB active – A
X7 pin 2 – TB return & X8 pin 4 (GND)– B
+12 volt through series 5 K – C
4 pin GPS Connector
X4 pin 1 - +Battery - A
X4 pin 7 – RS232 Receive – B
X4 pin 9 – PPS pulse – C
X4 pin 10 – GND - D- (jumper JP1 on DAQlink needs to be installed)
Power 2pin MS to X9 connector
X9 pin 1 - +battery –
A
X9 pin 2 – negative battery B
Ethernet – 10 base T crossover
1–3
2–6
3–1
6–2
DAQLink II System
99
40 pin header
3 – Ch 7 pos
4 –Ch 7 neg
5 – Ch 8 pos
6 – Ch 8 neg
7 – Ch 9 pos
8 – Ch 9 neg
9 – Ch 10 pos
10 – Ch 10 neg
11 – Ch 11 pos
12 – Ch 11 neg
13 – Ch 12 pos
14 – Ch 12 neg
15 – Ch 13 pos
16 – Ch 13 neg
17 – Ch 14 pos
18 – Ch 14 neg
19 – Ch 15 pos
20 – Ch 15 neg
21 – Ch 16 pos
22 – Ch 16 neg
23 – Ch 17 pos
24 – Ch 17 neg
25 – Ch 18 pos
26 – Ch 18 neg
27 – Ch 19 pos
28 – Ch 19 neg
29 – Ch 20 pos
30 – Ch 20 neg
31 – Ch 21 pos
32 – Ch 21 neg
33 – Ch 22 pos
34 – Ch 22 neg
35 – Ch 23 pos
36 – Ch 23 neg
37 – Ch 24 pos
38 – Ch 24 neg
100
N
P
R
S
T
U
V
W
X
Y
Z
a
b
c
d
e
f
g
h
i
j
k
m
n
p
q
r
s
t
u
v
w
x
y
z
AA
User’s Manual