1
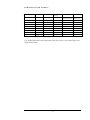
Demonstration Manual Version 1.5 User manual designed by: NIC, Environmental Division 9640 W. Augusta Dr., Ste. 432 • Carmel, Indiana 46032 Phone (317) 802-6040 i WQSTAT PLUS™ DEMONSTRATION MANUAL Information in this document is subject to change without notice and does not represent a commitment on the part of NIC (formerly known as Intelligent Decision Technologies, Inc.). The software described in this document is furnished under a license agreement and may be used only in accordance with the terms of the agreement. No part of this manual may be reproduced or transmitted in any form or by any means, electronic or mechanical, including photocopying, recording, or information storage or retrieval systems, for any purpose other than the purchaser’s personal use without the permission of NIC. © 1992-2004 NIC. All rights reserved. Windows™ and Windows® 95, 98, 2000, NT, ME and XP are registered trademarks of Microsoft Corporation. No investigation has been made of common-law trademark rights in any word. NIC makes no warranties, either express or implied, regarding the enclosed computer software package or its fitness for any particular purpose. Table of Contents INTRODUCTION .........................................................1 SYSTEM REQUIREMENTS ......................................3 INSTALLING WQSTAT PLUS..................................3 BASIC CONCEPTS ......................................................5 DATA FILE MANAGEMENT....................................6 WQSTAT PLUS™ FUNCTIONALITY ....................8 ANALYSIS DIRECTORY .........................................12 TECHNICAL SUPPORT...........................................14 WQSTAT PLUS™ LICENSE PRICES...................15 D E M O N S T R A T I O N M A N U A L INTRODUCTION 1 Chapter Demonstration Version W elcome to the Demonstration Version of WQStat Plus™. We hope this demonstration manual and the online help will aid you in rapidly installing WQStat Plus and exploring its features. Online help can be accessed through the WQStat Plus Main Menu (Help/Contents…). If you have any questions or comments, please contact the NIC Environmental Division at (317) 802-6040 or [email protected]. The purpose of this demonstration manual is to get you up and running rapidly so you can explore the features that WQStat Plus has to offer. We have included a section that will walk you through several exercises (page 8) to get you started. This demonstration manual is not the standard WQStat Plus User Manual. If you have questions that cannot be answered by this manual or online help, please feel free to contact us. WQStat PlusTM automates the statistical analysis of various types of environmental media. The package provides a wide range of statistical tests and estimation procedures including summary statistics, trend analyses, mean/median analyses, and excursion analyses. Its data format and built-in data translator simplify data entry and management requirements, and it provides screen and hard copy plots and reports. 1 D E M O N S T R A T I O N M A N U A L WQSTAT PLUS V.1.5 Upon purchase of WQStat Plus Version 1.5, you will receive a customized installation CD (or a selfextracting installer program via electronic delivery if 1 Valuable information preferred) as well as a complete user manual that provides detailed descriptions and examples of the statistical methodologies offered. A number of other topics are covered in the manual, including: • • • • • the installation of WQStat Plus; the data file structure requirements; the data file translator; troubleshooting solutions; a description of statistical procedures incorporated into WQStat Plus; and, • examples of various statistical procedures. The license also includes 90 days of unlimited software support by NIC’s staff of technical experts. 2 D E M O N S T R A T I O N 2 Chapter M A N U A L SYSTEM REQUIREMENTS • Pentium® processor (Pentium® II or better recommended). • Microsoft® Windows® 95 Service Release 2. Windows 98, Windows NT® 4.0, Windows 2000, Windows Millennium Edition or Windows XP. • 16 megabytes (MB) of random access memory (RAM) (64 MB or more recommended). • 40 MB or more free hard disk space. • Video graphics adapter (VGA) or better. INSTALLING WQSTAT PLUS This section describes how to install the software included in the WQStat Plus demonstration package. Please read the following instructions before beginning installation. 1. In WindowsTM, close all applications. 2. Insert the WQStat Plus CD, or download the installer program. 3. From the Windows Start menu, choose Run, and type the CD drive name followed by :setup, or run the downloaded installer program. Press ENTER. 3 D E M O N S T R A T I O N M A N U A L 4. The Setup Wizard will appear. The default path chosen for installation is C:\WQSTPLUS. Either click Next to accept the default or type the new path and then continue. 5. When the Setup Wizard is complete, you will be see the WQStat Plus program group. Double-click the WQStat Plus v1.5 icon to start the application. 6. To start the WQStat Plus program through the Windows Start Menu, go to Start->Programs->WQStat Plus and click WQStat Plus v1.5. 4 D E M O N S T R A T I O N ¥ 3 Chapter M A N U A L BASIC CONCEPTS Only a few basic concepts need to be understood in order to begin operating WQStat Plus. The general sequence of operations is: Select or Add a data file. The demo version is restricted in terms of the data that may be analyzed. Four example data files are shipped with the demo. Select or Create a View. The WQStat Plus View window allows you to select a constituent for analysis, and to choose stations (i.e. monitoring points), dates etc. Once such selections have been made, the matching data is "read into" the View, and the data can be examined and/or edited. The selected View contains the data that will be analyzed. Run Reports. An analysis directory is included in this manual. Helpful Tips: •To select or deselect wells, constituents, and/or dates, click on that line of the scrolling list. The letter to the left of the item indicates whether it is selected (Y) or deselected (N). •Global selection/deselection of scrolling lists is available, with a right click providing a pop-up menu. 5 D E M O N S T R A T I O N 4 Chapter M A N U A L DATA FILE MANAGEMENT Data files are prepared independently of WQStat Plus, through a spreadsheet or other program such as Excel, Files are prepared in a Access, etc. All WQStat Plus data files are text files, spreadsheet and translated typically tab-delimited, though some flexibility is available. into WQStat Plus-readable format. Data may be entered directly in the “WQStat Plusreadable” format, or WQStat Plus has a built-in translator that can translate many data files into the WQStat Plus-readable format. Data File Translation The translator converts an ASCII flat file (a type of data file that would typically be exported from a database) into a WQStat Plus-readable text file. The following is an example of a flat file. Flat file formats are highly variable, and the translator is very flexible, so it’s not required that your data match this format. For detailed information about particular fields, please refer to the Online Help in the WQStat Plus Demo. Well#1 1/1/1991 3.4 ND Dissolved Iron (mg/I) n/a Well#1 4/1/1991 Well#1 1/1/1991 Well#1 4/1/1991 Well#1 7/1/1991 16 Benzene (ug/I) 71-43-2 Well#2 1/1/1991 15 Dissolved Iron (mg/I) n/a Well#2 7/1/1991 5.2 Dissolved Iron (mg/I) n/a Well#2 1/1/1991 21 Benzene (ug/I) 71-43-2 Well#2 7/1/1991 20 Benzene (ug/I) 71-43-2 12.5 ND 2 Dissolved Iron (mg/I) n/a 30 Benzene (ug/I) 71-43-2 5 Benzene (ug/I) 71-43-2 Example of Flat File Translatable Format If you wish to prepare a data file in WQStat Plus-readable format that may be directly added to the program rather than translating a flat file, the following is an example of that format: 6 D E M O N S T R A T I O N [XYZ Landfill] [] M A N U A L [] [22-oG9] Dissolved Iron (mg/I) Benzene (ug/I) Well#1 1/1/1991 71-43-2 n/a n/a n/a 3.4 12.5 n/a <2 <5 n/a n/a n/a 16 1/1/1991 n/a n/a 15 21 7/1/1991 n/a n/a 5.2 20 4/1/1991 7/1/1991 Well#2 n/a u d Example of WQStat Plus-Readable Format For detailed information about particular fields, please refer to the Online Help in the WQStat Plus Demo. 7 D E M O N S T R A T I O N 5 Chapter M A N U A L WQStat Plus™ Functionality The purpose of this section is to guide you through the first exploration of WQStat Plus™. Understanding data file selection and how to analyze Understanding the data are keys to a successful first statistical evaluation. the Mechanics Selecting a data file, and analyzing the data.. • Open WQStat PlusTM • Select a Data File - Click on menu “Data”, then “Select” - Highlight “GroundW”, click on “OK” • Select a View (“Example View”) - Click on menu “View”, then “Select” - Highlight “Example View” and then “Open” - Optionally, click on the “constituent” box and select a constituent for the analysis; click Continue, then “Read Datafile” • Create a Box and Whiskers Plot - Choose “Summary Statistics” from the Menu bar and select “Box & Whiskers/Box & Whiskers” - Return to View by clicking on “Exit” • Alter the View & Examine Individual Observations - Click on “Examine Observations” - Sort the data by clicking “Data” from the Menu bar - Choose to “Sort by Date” and examine the changes - Click on a line to deselect the observation • De-select a Station’s Observations - Click on the “Selection Palette” (a selection palette will appear in the lower right corner) - The options on the Selection Palette can be changed by toggling any of the three buttons (1st button: Select/De-select; 2nd button: Date/Station ID/ Value/Alt. Value/Flags/All; 3rd button: =/</>, 8 <>, or = ) - Change the buttons to “De-select”, “Station-ID”, and “=” - Type “MW-1” in the blank below the buttons - Click on “Execute” - All of the data for station MW-1 should now be deselected; note that the “Y”s on the far left of each line have changed to “N”s - De-select station MW-3, MW-5, and PW-2 in the same manner • Plot a Time Series - Choose “Summary Statistics” from the Menu bar and select “Time Series” (Click continue if the message appears that you have more than 5 stations selected.) - Exit the Time Series and return to the view • Re-select all of the stations - Right-click over the observations and choose “Select All” - Click on “Hide” • Plot A Seasonality Graph (MW-1) - Select the constituent “Alkln-Bicarb” from the view - Select “Summary Statistics” from the Menu bar and select “Seasonality” - Choose station “MW-1” and click on “OK” - Exit - Click on “NO” to not analyze another well • Create A New View - Exit current view by clicking “Done” - Select data file “land1” - Under the View menu, click on “Select” - Click on the button “New” - Type “Fluoride” in the box that appears and click “OK” - Click on the “none” button and highlight “fluoride” - Click on the “Read Datafile” button • Plot An Outlier Graph - Select “Summary Statistics” from the Menu bar and select “Outlier” - Choose station “C-VS-2”, Okay, then Exit - Click “NO” when asked if you would like to analyze another station • Run A Tolerance Limit Analysis - Select “Excursion Analysis”, then “Tolerance 9 Limit”, then “Parametric”, then “Interstation” - Click “Exit” - Click “Done” • Save The View Under A New Name - Choose Select from the View Menu and Click on “Open” - Click on “Save View As...” button - Type “Example 2” - Click OK • Change The Beginning Date - Click on the first “Date Range” button - Choose 10/15/1992 - Click on Continue - Click on “Read Datafile” • Re-Run the Tolerance Limit Analysis - Select Excursion Analysis from the Menu bar and select Tolerance Limit\Parametric\Interstation. - Note the data changes in the x-axis. - Exit, then Done • Run the Multi-Test False Positive Rate Calculator -From the opening screen, click on the menu item Options, and select “False Positives” - Click on the button to the right of “Statistical Test” and choose a test - Experiment with different numbers of stations, constituents, and numbers of retests - The multi-test false positive rate is displayed in the bottom left corner, then Close • Change WQStat PlusTM Options - Select “Configure WQStat Plus” from the Options Menu - Select the “3-D Graphs” option by clicking on the toggle box to the left of the 3-D Graphs option - ”OK” (WQStat PlusTM will now create 3-D graphs) - Select a data set and a view and plot a graph -Return to “Configure WQStat Plus”, and click on toggle box next to 3-D Graph option to turn this option off, then click OK • Power Transform Data - Select and open a view - Click on the “Examine Observations” button - Select the menu item “Data”; click on “Power Transform Alt Values”; then select the desired transformation (note the values in the Alternate Column) 10 • Explore WQStat PlusTM Now that we have gotten you started, we encourage you to explore WQStat Plus and all the features it has to offer. Please feel free to contact the NIC Environmental Division at 317-802-6040 x 319 or [email protected] if you have any problems or questions. We’d love to hear what you think. Thank you for trying WQStat Plus! 11 6 Chapter ANALYSIS DIRECTORY This section describes how to go directly to the analysis you want to perform. The analyses are listed in alphabetical order with instructions to access them. Remember, a data file and a view must be selected before the system will perform an analysis. ANOVA – From the Mean/Median Analysis menu select ANOVA/Parametric/Interstation... or, for Non-Parametric ANOVA, ANOVA/Non-Parametric/Interstation. Box and Whiskers Plot – From the main menu click on the Summary Statistics button. Select Box & Whiskers/Box & Whiskers to analyze by station, Box & Whiskers/ Annual to analyze the data by year or, Box & Whiskers/Seasonal to analyze by season. Chi Squared Goodness of Fit Normality Test – From the main menu click on the Summary Statistics button and select Normality/ Chi Squared Goodness of Fit. Confidence Intervals – From the Excursion Analysis menu, select Confidence Intervals and either Para- or Non-Parametric. Control Chart – See Shewhart-Cusum Control Chart. Histogram – From the Summary Statistics menu in the View window, select Histogram. Intrastation Rank Sum Test – See Mann-Whitney Test. Mann-Kendall Trend Test – From the Trend Analysis menu, select Sen's Slope/Mann-Kendall and select the station to be analyzed. Mann-Whitney Test – From the main menu click on the Mean/Median Analysis button and select Mann-Whitney (Wilcoxon Rank Sum). Means Test – See Parametric ANOVA. Median Test – See Nonparametric ANOVA. Multi-Test False Positive Rate Calculator – From the main menu click on Options and select False Positives. Multiple Constituent Time Series - From the Summary Statistics menu in the View window, select Multiple Constituent Time Series. 12 Outlier Test – From the Summary Statistics menu in the View window, select Outliers. Parametric ANOVA – From the Mean/Median Analysis menu, select ANOVA/Parametric/Intra or Interstation. Power Curves – From the main menu click on Options and select Power Curves. Prediction Limit – From the Excursion Analysis menu, select Prediction Limit/Para- or Non-Parametric. Proportion Estimate - From the main menu, click on the Excursion Analysis button and select Proportion Estimate. Rank Von Neumann – From the main menu click on the Summary Statistics button and select Rank Von Neumann. Seasonality - From the Summary Statistics menu in the View window, select Seasonality. Sen's Slope – From the Trend Analysis menu, select Sen's Slope/Mann-Kendall... Shapiro Wilk/Shapiro Francia Normality Test - From the main menu click on the Summary Statistics button and select Normality/ Shapiro Wilk (Shapiro Francia if N>=50). Shewhart-Cusum Control Chart – From the Trend Analysis menu, select Shewhart-Cusum Control Chart... Time Series – From the Summary Statistics menu in the View window, select Time Series. Time Series - Multiple Constituent Time Series – see Multiple Constituent Time Series. Tolerance Intervals – From the Excursion Analysis menu, select Tolerance Intervals, and either Parametric or NonParametric. Tolerance Limit – From the Excursion Analysis menu, select Tolerance Limit/Para- or Non-Parametric. 13 7 Chapter Technical Support Troubleshooting Installation If you are having trouble installing WQStat Plus: • Check System Requirements on page 3 • Close down all other applications during installation • Contact NIC’s Environmental Division at (317) 802-6040 or [email protected]. Technical Support If you have any questions about this demo version or would like additional information, contact NIC’s Environmental Division at (317) 802-6040. We encourage you to visit our Web page at http://idt.nicusa.com and also to pass along any comments or suggestions you may have. 14 8 Chapter WQSTAT PLUS™ LICENSE PRICES WQStat Plus™ is offered as both a single-user and multi-user license, or as a service performed by NIC. WQStat™ License: The user license includes 90 days of software support by NIC’s technical support. A user license permits a single user to use WQStat Plus™ to review and analyze data.1 WQStat Plus™ License Pricing : • License: $450 per copy Please call NIC for multi-user license prices. WQStat Plus™ Service: Optionally, as a fully integrated service, NIC will prepare statistical analysis plans, perform the statistical analysis and related QA/QC of the analysis, and prepare WQStat Plus™ statistical reports. NIC’s statisticians and environmental compliance experts can advise you on the appropriate statistical analyses for your sites as well as provide advice on longer term monitoring plans. Please call for pricing. ________________ The 90 days of free telephone software support covers explanations of the functionality of WQStat PlusTM and the statistical tests used in the program. It does not cover reviews of licensee’s data, analysis proposals or summary reports; however, these services are available at our regular consulting fees. 1 15