1
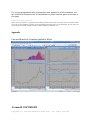
ALVentures
NEW
[email protected]
760, 630630-5555
MARKET REACTIVITY SYSTEM 2.1 for MetaStock
In Version 2.1 the methodology has been streamlined and adapted for application
to a wide variety of trading instruments and time frames. Back-testing has shown
it to be equally effective as the version 2.0 tailored for each commodity.
Installation and Setup Guide
Components
The setup file, setup.exe is needed to install the Market Reactivity System in
MetaStock. The setup file is a self-extracting, self-installing program that contains
the following files:
1)
2)
3)
4)
5)
MS11FORM.DTA (custom formula file)
Forum.dll Copyright © 2005 The MetaStock Forum Crew.
MS11EXPT.DTA (expert adviser)
MS11PRFT.DTA (system test for back-testing)
Universal reactivity sv.mwt (template)
These files are further described as:
The Custom Indicator file MS11Form.DTA contains all of the necessary
Indicators for the market Reactivity System. All the Indicators have a prefix
of “+ag” or “+” which automatically groups them together at or near the
top of the ‘Custom Indicator’ List in MetaStock.
The Forum.dll file extends the capability of the MetaStock function set, and
is necessary to successfully execute the Market Reactivity System in
MetaStock. Many of the custom indicators will not work without the
Forum.dll file.
The MS11EXPT.DTA contains the ‘Expert’ and is called upon and plotted by
the Template. The Expert is what generates the trade signals and stop
penetration alerts. The Expert will be found listed in the Expert Adviser as
“Universal Reactivity System”
The MS11PRFT.DTA contains a Back-testing System you will find listed as
Universal reactivity System in the Systems window of the Enhanced System
Tester. The Back-tester, due to limitations of MetaStock will only work with
this system as a Non-Points Only test. Trade signal quantity, price and time
of execution are calculated and plotted correctly, but for commodities, the
statistics are not useable due to the Non-Points Only nature of the test.
Testing stocks should not be a problem.
The Template Universal reactivity sv.mwt is located in the C:\Program
Files\Equis\MetaStock\Charts\Templates folder. The Template calls upon the
appropriate ‘Custom Indicators’ and ‘Expert’ to create a layout displaying all
the necessary indicators and trade signals.
Installation
To start the installation:
With or without MetaStock running, double click setup.exe. This will initiate an
auto-install process that installs Templates, Experts, and DLLs in the following
locations:
C:\Program Files\Equis\MetaStock\Charts\Templates
C:\Program Files\Equis\MetaStock\\EXPERTS
C:\Program Files\Equis\MetaStock\External Function DLLs
Since the template is the master key that puts together all the pieces of the
trading system, it is suggested you make a backup copy of it at this point.
The custom indicators are also installed and can be viewed in the MetaStock
Formula Builder or Indicator Quicklist.
Once the install is complete, you are ready to apply the Market Reactivity System
in MetaStock.
Setup
Since the Market Reactivity System for MetaStock makes extensive use of
templates and layouts, it might be helpful to study the chapters covering them in
the MetaStock user manual.
This description here will use Wheat as an example. The procedure is the same for
any other instrument.
Start MetaStock and open a Wheat chart.
Right click on an empty part of the chart and select Apply Template from the
menu which opens an Apply Template dialog box. Check the Replace existing chart
box. Select Wheat 1.mwt and click Open. This plots a Market Reactivity System 2page layout showing all the indicators and trade signals as shown in Wheat
Template in the Appendix.
If necessary, to scale the layout to fit your screen, go to Window menu and select
Column. If the page with the price plot flips over to the right side, save the layout
and then open the layout and go to Window Column command to flip the price plot
back to the left side. Save the layout this time as a Template, replacing the
original Template with the new scaled one and then save the layout. To save the
layout, go to File, Save As, and in the Save As dialog box, choose {Layout} for the
{Save as type}, and give the file a name and location. The Template is used only
once to initially create the layout. In the future, you will open the Wheat Layout
listed as Wheat.mwl to view the Wheat Market Reactivity Chart. The essential
information for trading is displayed on the price chart, including the ‘buy’ and ‘sell’
signals and the stop-loss points.
ALVentures
[email protected]
760, 630630-5555
Note: See appendix for a screen capture of the Universal Reactivity Template
applied to a Wheat Contract.
Data - Continuous Contracts
A word about the data - the recommended data (that which comes with the
software) is the combined session data (floor + electronic). The HIGH, LOW and
CLOSE are self explanatory. The volume and open interest (OI) are the TOTAL for
all contracts. The Volume is in thousands. When entering data during the session
(or end-of-day if you don’t yet have the actual volume), always enter an
estimated value for VOL.
Although you can apply the Reactivity Indicator to any individual contract data,
there are cases where price variations early in the contracts life may be small
compared to more recent data as it becomes the lead contract. This can lead to
some distortions in the indicators; particularly those for the longer cycle lengths.
For these cycles, the exponential averages used in the analysis may not react fast
enough to reach equilibrium.
The way to avoid this problem is to use “continuous contract” data. Typically, data
services provide such data. A “back-adjusted” continuous contract in which the
back contract has been adjusted up or down to match the new contract will work
just fine.
Keep in mind that we always use the Total Volume and Total Open Interest in the
data series.
If you wish to generate your own continuous contract using MetaStock, see the
procedure given below under ‘CONTRACT ROLLOVERS AND CYCLE LENGTHS’.
STRATEGY AND USE OF THE CHARTS
All that is essential for profitable trading at the first level is displayed on the PRICE
chart. There are occasions where a trade may be made based on information
given on the other charts as discussed further below.
The model is set up to be quite aggressive in building a position in the direction of
a trend. Intermediate and longer term trend information is determined by a
unique method which can be called ‘inverse detrending’. The method uses an
intermediate and a long term trend, computing trades in the direction of the
intermediate term; but filtering by the long term to take full advantage of a strong
longer term trend; and avoiding trading against a trend. Trades are triggered in
the appropriate direction based on the short-term cyclic behavior.
With some exceptions, the strategy is to be in the market all the time; either long
or short. The basic trade unit (#of contracts) is taken at each signal, adding if
going in the same direction; and closing and reversing to one unit in the other
direction with a signal in the other direction.
Note: The Expert Adviser has an option to highlight a bar in yellow when a
stop is penetrated. You can enable that option in the Highlights tab in the
Expert Adviser. If you prefer, under the Alerts tab, you can enable a stop
penetration alert in addition to or in place of the bar highlight.
The signals for the trades appear on the PRICE chart; a red arrow above the prices
indicating “Sell” and a green arrow below the prices indicating “Buy”. The signals
are generated in the Expert Adviser under the Symbols tab.
The most recent additions to a position in one direction prior to a trend change are
likely to have a lower probability of being profitable. As there is no way of
knowing in advance how strong or how long a trend may be, making these trades
is a tradeoff between the potential profit of a continuing trend vs. the potential of
some loss as the market changes direction. The most aggressive approach, which
pays off nicely in any substantial trend, is to take all the indicated trades. A more
conservative approach is to take just the first 2 or three in a given direction - if
there are at least that many. These have the highest probability of being
profitable.
The second chart plotted in a pane above the price chart is a depiction of
intermediate and longer term trends. On this chart it is all about crossing the zero
line. Trends below zero indicate a down trend, values above zero indicate an up
trend, and the magnitude is indicative of the strength of the trend. The indicated
trends do lag a bit, so there will be trade signals in an opposite direction prior to
the trends crossing zero.
The chart in the lower right hand corner is the Short Term Reactivity which acts as
a trigger for generating trade signals. A trade signal trigger is generated when the
blue data point crosses over the smoothed red indicator line. The trade signal
trigger is further tested by the intermediate and longer term trends before being
plotted as a trade arrow.
In a choppy market it is likely that wins and losses will roughly offset, possibly
with net loss; but in any substantial move, the profits will accumulate.
Back-testing of data for the previous years 2007 and 2008 showed exceptional,
even phenomenal, profit potential. However; it can be argued that the kinds of
huge trends that occurred in those two years are not representative. Nonetheless;
handling the trends with such success is certainly a positive testimonial. Trading
12 different commodities for 2009, during which there were some periods of
whipsaw, still showed excellent profit overall. Further details are given at
www.marketreactivity.com.
SUMMARY OF BASIC TRADING RULES
1.) Enter the trade on the day, and in the direction indicated on the chart. Buy
and Buy Stop signals are plotted as green arrows below the price bar. Sell and Sell
Stop Signals are plotted as red arrows above the price bar. If you place the mouse
over the arrow, a tool tip will identify the signal type. Penetration of a stop
generates a trade reversal arrow only when there is a prior trade in the opposite
direction.
ADDITIONAL TIPS:
Note that for end-of-day data, the day generally begins the previous
evening (Eastern Time), and continues until the following afternoon. If
entering data during a session, there is generally questionable validity to
any signal generated prior to about two hours into the day’s floor
session. Only a HIGH, LOW, and VOL are needed for the analysis, but
entering the current price as CLOSE is a good idea to verify a signal
ALVentures
[email protected]
760, 630630-5555
before entering a trade. If you enter a trade somewhere mid-session,
and the signal disappears when the final data is entered, it’s advisable to
close the trade. Back trading history indicates that executing the trade
at the closing price reduces the overall profitability by 15-20% over
getting the trade at the daily midpoint. The use of limit orders to get a
good fill during the session can be helpful.
Following a period of relative strong trend, the logic may miss the most
optimal reversing point, and pick up the trade at the next short cycle
turn. In this case it can be helpful to watch for divergence of the short
cycle with price; either top or bottom depending on market direction,
accompanied by a corresponding divergence in the Midpoint/Money Flow
indicator. If the trends are heading toward zero, then the trigger for the
trade is the data point crossing the smoothed line on the Short Cycle
Reactivity chart.
CONTRACT ROLLOVERS AND CYCLE LENGTHS
If you wish to maintain your own back adjusted continuous contract, you can use
features built into MetaStock. Basically, you will join two contracts by copying data
between two data sheets. Refer to the section in your manual on moving and
copying data, or look in the “Data: Move” section in the online manual.
Open data sheets for both the new and old contracts. Choose a rollover date and
calculate the difference in the midpoint price between the two data sets on that
day. Note the date in the “first date” window of the new contract. Highlight
(select) the price data columns in the old contract from that date down through,
and including, the selected rollover date. {Copy} the highlighted data from the
old contract and {paste} it into the new data sheet (be sure to place the cursor
in the “open” price column on the date you started with in the old contract.
Select the new data sheet window, and from the {adjust} menu select
{manual}. In the Manual Adjust box under the field column select open, high,
low, and close boxes. Now select either add or subtract in the operation boxes;
selecting add if the new contract prices on the rollover date are higher than the
old, or subtract if they are lower. Enter the value that you calculated as the
difference between the midpoints in the “Factor” boxes, and enter your selected
rollover date in the Last dates to adjust box (leaving the existing date in the
First Dates to adjust box. Click OK. When you close the window, choose yes to
save the changes.
Further information on the analytical methods and trader psychology can be found
in Advance Cycle Trading.
TECHNICAL SUPPORT
Limited technical support is provided for getting the templates loaded and
working, or for reporting problems with the materials sent. Please first use the Email address given below, and then we can determine if a direct phone
consultation is in order. Fee consulting help is available to those who may need
extra help getting familiar with the use and application of the system. Please
contact the developer of the MetaStock plug-in version, Dennis Lipter, at
[email protected] or telephone (347) 565-9273.
For on-going assistance with interpretation and application of the indicators you
can contact Al Gietzen at the e-mail address or phone number given at the top of
the page.
____________________
There can be no assurance or guarantee that trading with this system will be successful. Past or simulated results
are not necessarily indicative of future results and although potential gains can be substantial, the risk of loss can
also be high. You should carefully consider whether trading is suitable for you.
Appendix
Universal Reactivity Template Applied to Wheat
Forum.dll COPYRIGHT
Copyright (c) 2005 The MetaStock Forum Crew.
All rights reserved.
ALVentures
[email protected]
760, 630630-5555
Redistribution and use in source and binary forms, with or without
modification, are permitted provided that the following conditions
are met:
1. Redistributions of source code must retain the above copyright
notice, this list of conditions and the following disclaimer.
2. Redistributions in binary form must reproduce the above copyright
notice, this list of conditions and the following disclaimer in
the documentation and/or other materials provided with the
distribution.
3. Redistributions of any form whatsoever must retain the following
acknowledgment:
"This product includes software developed by MetaStock Forum Crew
(http://forum.equis.com)"
THIS SOFTWARE IS PROVIDED BY THE METASTOCK FORUM CREW "AS IS" AND ANY
EXPRESSED OR IMPLIED WARRANTIES, INCLUDING, BUT NOT LIMITED TO, THE
IMPLIED WARRANTIES OF MERCHANTABILITY AND FITNESS FOR A PARTICULAR
PURPOSE ARE DISCLAIMED.
IN NO EVENT SHALL THE METASTOCK FORUM CREW
ITS CONTRIBUTORS BE LIABLE FOR ANY DIRECT, INDIRECT, INCIDENTAL,
SPECIAL, EXEMPLARY, OR CONSEQUENTIAL DAMAGES (INCLUDING, BUT
NOT LIMITED TO, PROCUREMENT OF SUBSTITUTE GOODS OR SERVICES;
LOSS OF USE, DATA, OR PROFITS; OR BUSINESS INTERRUPTION)
HOWEVER CAUSED AND ON ANY THEORY OF LIABILITY, WHETHER IN CONTRACT,
STRICT LIABILITY, OR TORT (INCLUDING NEGLIGENCE OR OTHERWISE)
ARISING IN ANY WAY OUT OF THE USE OF THIS SOFTWARE, EVEN IF ADVISED
OF THE POSSIBILITY OF SUCH DAMAGE
OR