1
ReDAQ
Remote Data Acquisition and Control System
for isoLynx
User Guide
Rev 1.004
Redefining Data Acquisition
User Guide
ReDAQ™
Table of Contents
1.
Getting started quickly.......................................................................................6
2.
2.1
2.2
2.3
2.4
2.5
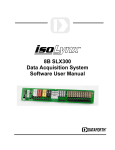
Overview of ReDAQ...........................................................................................7
Architecture...........................................................................................................7
isoLynx networks...................................................................................................9
Intranet / Internet connections................................................................................9
ReDAQ Console....................................................................................................9
ReDAQ Designer................................................................................................11
3.
3.1
3.2
Hardware requirements....................................................................................12
isoLynx systems..................................................................................................12
Server PC............................................................................................................12
4.
4.1
4.2
4.3
4.4
4.5
4.6
4.7
4.8
4.9
4.10
4.11
Installing the software and making the connections.....................................14
Overview.............................................................................................................14
Software installation.............................................................................................14
Procedure for connecting the server to a single isoLynx via Ethernet..................16
Procedure for connecting the server to an isoLynx Ethernet network...................19
Procedure for connecting the server to an isoLynx serial network.......................22
Procedure for connecting to an intranet...............................................................23
Mapping the ReDAQ server host name...............................................................25
ReDAQ client machine screen resolution and aspect ratio.................................25
Running ReDAQ Designer..................................................................................25
Unlock code installation.......................................................................................26
User names and passwords................................................................................26
5.
5.1
5.2
5.3
Exploring the demo...........................................................................................27
Simulation demonstration....................................................................................27
isoLynx demonstration.........................................................................................28
Demonstration data points...................................................................................29
6.
The Historian.....................................................................................................30
7.
7.1
7.2
7.3
The Alarm Processor........................................................................................32
Alarm conditions..................................................................................................32
SMTP server.......................................................................................................32
Configuring alarms..............................................................................................33
Rev 1.004
2
User Guide
ReDAQ™
8.
8.1
8.2
8.3
8.3.1
8.3.2
8.3.3
8.3.4
8.3.5
8.3.6
8.3.7
8.3.8
8.3.9
8.3.10
8.4
8.5
8.5.1
8.5.2
8.5.3
8.5.4
8.5.5
ReDAQ URIs......................................................................................................34
Generating tabular data in HTML format...............................................................35
Generating tabular data in Excel format...............................................................40
Query string field syntax for use with HTML and Excel downloads.......................40
Heading...............................................................................................................40
Data point............................................................................................................40
Parameter...........................................................................................................41
Calculation...........................................................................................................41
Start time.............................................................................................................41
End time..............................................................................................................42
Interval time.........................................................................................................42
Rounding time.....................................................................................................42
File name for Excel download..............................................................................42
Table orientation..................................................................................................43
Requesting XML downloads................................................................................43
Query string field syntax for use with XML downloads..........................................44
Calculation...........................................................................................................45
Start time.............................................................................................................45
End time..............................................................................................................45
Interval time.........................................................................................................45
Rounding time.....................................................................................................46
9.
9.1
9.2
9.3
Designing custom pages..................................................................................47
File organization..................................................................................................47
Creating pages to retrieve tabular data................................................................47
Real-time graphical displays - the ReDAQ agent.................................................47
10.
10.1
10.2
10.3
10.4
10.5
10.6
10.7
10.8
10.9
10.10
10.11
ReDAQ Designer...............................................................................................50
Introduction..........................................................................................................50
Drawing Lines......................................................................................................50
Drawing Rectangles............................................................................................51
Drawing Polygons...............................................................................................51
Drawing Circles...................................................................................................51
Drawing Text Strings...........................................................................................51
Editing Text Strings..............................................................................................52
Inserting Images..................................................................................................52
Adding an Hyperlink.............................................................................................52
Adding a Smart Level...........................................................................................52
Adding a Smart Fill...............................................................................................53
Rev 1.004
3
User Guide
ReDAQ™
10.12
10.13
10.14
10.15
10.16
10.17
10.18
10.19
10.20
10.21
10.22
10.23
10.24
10.25
10.26
10.27
10.28
10.29
Moving an Object.................................................................................................53
Copying an Object...............................................................................................53
Moving a Point.....................................................................................................53
Moving Multiple Points..........................................................................................53
Deleting Objects..................................................................................................54
Deleting Multiple Objects.....................................................................................54
Changing the Default Line-color and Default Fill-color of Objects........................54
Changing the Order of Objects............................................................................54
Drawing Frames..................................................................................................55
Drawing Tables...................................................................................................55
Drawing Graphs..................................................................................................56
Drawing Histograms............................................................................................56
Drawing Pie Charts.............................................................................................57
Setting the Timespan...........................................................................................57
Selecting Objects................................................................................................58
Expressions........................................................................................................58
Saving files..........................................................................................................58
Opening files.......................................................................................................58
11.
11.1
11.2
11.3
11.3.1
11.3.2
11.3.3
11.3.4
11.3.5
11.3.6
System configuration........................................................................................59
Note regarding Extensible Markup Language.......................................................59
Data point naming...............................................................................................60
Config XML parameters.......................................................................................61
The redaq element...............................................................................................61
Elements within the redaq element......................................................................61
Elements within the point element.......................................................................62
Elements within the history element....................................................................63
Elements within the alarms element....................................................................63
Elements within the high and low elements.........................................................64
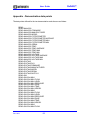
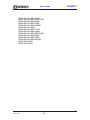
Appendix - Demonstration data points.......................................................................68
Rev 1.004
4
User Guide
ReDAQ™
List of Figures
Figure 1 - System Architecture.........................................................................................7
Figure 2 - Example of ReDAQ Display.............................................................................8
Figure 3 - ReDAQ Console.............................................................................................10
Figure 4 - ReDAQ Designer...........................................................................................11
Figure 5 - isoLynx System..............................................................................................12
Figure 6 - Internet Protocol (TCP/IP) Properties window.................................................17
Figure 7 - ReDAQ System Configuration Menu..............................................................18
Figure 8 - Port specification table...................................................................................21
Figure 9 - Internet Protocol (TCP/IP) Properties window.................................................24
Figure 10 - The ReDAQ Root Page................................................................................28
Figure 11 - Module configuration for isoLynx demonstration............................................29
Figure 12 - Example of graph and table using history data..............................................31
Figure 13 - HTML tabular data.........................................................................................35
Figure 14 - HTML tabular data.........................................................................................36
Figure 15 - HTML page source using <form> to request tabular data.............................38
Figure 16 - HTML page as displayed in the browser.......................................................39
Figure 17 - HTML tabular data showing history...............................................................39
Figure 18 - HTML source of page containing ReDAQ graphic.........................................49
Figure 19 - Example of simple config.xml file..................................................................65
Figure 20 - Example of alarm elements..........................................................................66
Figure 21 - Example of history elements.........................................................................67
Rev 1.004
5
User Guide
ReDAQ™
1. Getting started quickly
In order to gain a comprehensive understanding of the functionality of ReDAQ, users
should read through this manual. However, the manual has been organized so that the
product may be quickly installed and the built-in demonstration web-sites explored. To
get started quickly in this way, please read the following sections and follow the
procedures provided:
Section 2.
Overview of ReDAQ
Section 3.
Hardware requirements
Section 4.
Installing the software and making the connections
Section 5.
Exploring the demo
Rev 1.004
6
ReDAQ™
User Guide
2. Overview of ReDAQ
ReDAQ is a Remote Data Monitoring and Control System for use with Dataforth isoLynx
Data Acquisition Systems. ReDAQ operates as a service running under Windows XP
Professional. One of the key advantages of ReDAQ is that users do not require any
application software in order to access fully-featured real-time graphical displays. All that
is required by each user is a Java-enabled browser. (Dataforth recommends Firefox for
the browser).
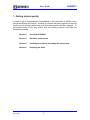
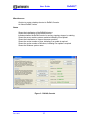
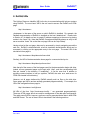
2.1 Architecture
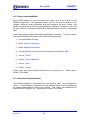
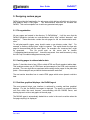
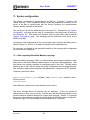
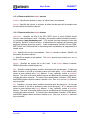
A typical ReDAQ system is illustrated in Figure 1. The ReDAQ software is installed on
the server PC. The server connects to one or more networks of isoLynx systems on the
one hand, and an intranet and/or the Internet on the other.
Server platform
isoLynx
Windows XP / Vista
config.xml
isolynx.xml
isoLynx
User PC / Op Station
User PC / Op Station
User PC / Op Station
ReDAQ
Real-time
Web pages
ReDAQ
Real-time
Web pages
ReDAQ
Real-time
Web pages
isoLynx
isoLynx
ReDAQ
Service
isoLynx
Internet / intranet
ReDAQ
Console
isoLynx
HMI Development System
isoLynx
HTML
XML
isoLynx
ReDAQ
Designer
History
Alarm
E-mails
Figure 1 - System Architecture
Rev 1.004
7
User Guide
ReDAQ™
ReDAQ essentially creates a web-server which delivers a flexible set of mimics and
graphics within HTML pages. Unlike a conventional web-server, however, ReDAQ pages
change in real-time, reflecting the signals connected to the isoLynx systems.
A lossless historian allows signals from the isoLynx systems to be automatically
recorded. The data thereby created can be used to plot graphs and perform reruns of
mimic displays.
Additionally, an alarm monitor will trigger an alarm condition for each signal. These
alarms can then be shown in tables and mimics. Also, ReDAQ can transmit e-mails
when alarms are triggered.
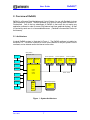
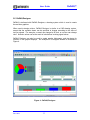
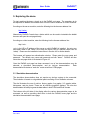
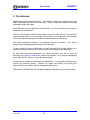
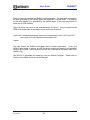
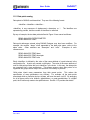
An example of a ReDAQ display is given in Figure 2.
Figure 2 - Example of ReDAQ Display
Rev 1.004
8
User Guide
ReDAQ™
2.2 isoLynx networks
The server connects to one or more networks of isoLynx systems. isoLynx networks
can use EIA-232/485, or Ethernet TP for the physical layer protocol.
ReDAQ can
support up to eight EIA-485 networks or EIA-232 point-to-point links, plus up to eight
Ethernet networks.
2.3 Intranet / Internet connections
The ReDAQ server communicates with users via an intranet, or the Internet, or both.
To test or try out the ReDAQ server, a single user PC can be connected directly by a
crossover Ethernet TP RJ45 cable. Alternatively, a browser (e.g. FireFox, Internet
Explorer or Chrome) can be run on the server PC itself.
2.4 ReDAQ Console
ReDAQ Console is a Windows program for the ReDAQ server machine. It serves two
purposes. Firstly, it is an installer/remover of the ReDAQ service and associated files.
Secondly, it serves as a console from which to manage the ReDAQ service.
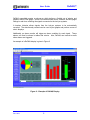
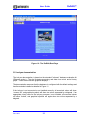
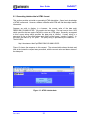
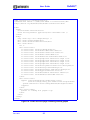
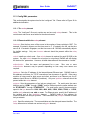
The Console window is illustrated in Figure 3. The window is divided into 5 areas:
Install ReDAQ
Creates the ReDAQ directory containing the files representing the user web site.
Installs ReDAQ as a Windows service.
Starts the ReDAQ service.
Maintenance
A button to open the home page of the user web site.
A button to open the User Guide.
A button to start ReDAQ Designer in order to create graphical pages.
Remove ReDAQ
Stops the ReDAQ service.
Deletes the ReDAQ service.
Removes the ReDAQ directory.
Rev 1.004
9
User Guide
ReDAQ™
Miscellaneous
A button to create a desktop shortcut to ReDAQ Console.
An “About ReDAQ” button.
Status
Shows the install status of the ReDAQ directory.
Shows the install status of the ReDAQ service.
Indicates whether the ReDAQ service is running, stopping, stopped, or starting.
Shows the server machine screen resolution indicating if non-optimal.
Shows the install status of Java on the server machine.
Shows the version number of Java, indicating if an update is required.
Shows the version number of Windows, indicating if an update is required.
Shows the Windows system name.
Figure 3 - ReDAQ Console
Rev 1.004
10
User Guide
ReDAQ™
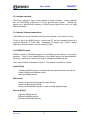
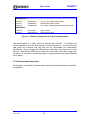
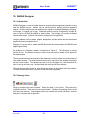
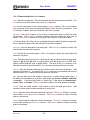
2.5 ReDAQ Designer
ReDAQ is delivered with ReDAQ Designer, a drawing system which is used to create
the real-time graphics.
When used to design mimics, ReDAQ Designer is similar to a CAD drawing system,
except that the symbols drawn can be specified to change according to the value of
isoLynx signals. For example, a vessel can change its fill level, or a motor can change
color. Numeric values can be the result of calculations involving signal values.
ReDAQ Designer can also be used to create graphs, histograms, and pie charts for
inclusion in the graphic displays. An example of a Designer window is illustrated in
Figure 4.
Figure 4 - ReDAQ Designer
Rev 1.004
11
User Guide
ReDAQ™
3. Hardware requirements
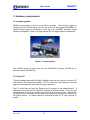
3.1 isoLynx systems
ReDAQ communicates to one or more isoLynx systems. Each isoLynx system is
comprised of one SLX200 analog I/O base unit, plus up to three optional SCMPB02 16channel analog expansion backpanels, and/or up to six SCMPB06 8-channel analog
expansion backpanels, and/or up to eight optional SLX101 digital expansion backpanels.
Figure 5 - isoLynx System
The SLX200 analog I/O base units may be EIA-232/485 versions (SLX200-1X) or
Ethernet versions (SLX200-2X).
3.2 Server PC
The only hardware required by ReDAQ in addition to the isoLynx systems is a server PC
with Windows XP Professional installed. The PC must have Java installed so that web
pages can be displayed in a browser running on the server.
The PC should have at least one Ethernet port to connect to the intranet/Internet. A
dedicated intranet can easily be realized by installing an Ethernet switch. The up-link port
should connect to the server, and the down-link ports to each user station. Alternatively,
the ReDAQ server can easily be connected to an existing intranet via an unused port on
an Ethernet switch. The switch should be configured to allow HTTP (web) access on
port 80.
Rev 1.004
12
User Guide
ReDAQ™
The ReDAQ server can be connected to the Internet via a DSL modem or ISDN
connection. Note that a static IP address should be used and the modem/router should
be configured to pass port 80 accesses directly to the ReDAQ server PC. This is often
referred to as “port forwarding” in router documentation.
If any Ethernet-based isoLynx networks are in the system, then the PC should have at
least one additional Ethernet port to connect to these networks. Hubs and/or switches
can also be used to construct the isoLynx Ethernet networks.
If any EIA-485-based isoLynx networks are in the system, then the PC should have at
least one EIA-485 port to connect to these networks. Ideally, these should be built-in
ports. However, EIA-232 ports can be used with external 232-485 converters. Another
option is to use USB serial converters.
The SLX200-1X can also connect directly to the server using a point-to-point EIA-232 link.
If this mode is deployed, an EIA-232 port will be required for each such isoLynx.
Rev 1.004
13
User Guide
ReDAQ™
4. Installing the software and making the connections
4.1 Overview
ReDAQ is a web-server which also communicates with isoLynx systems, thereby
providing a graphical control/monitoring system, accessed via browsers. The system
usually runs on a server machine which connects to one or more isoLynx networks on
the one hand, and to an intranet and/or the Internet on the other.
For evaluation purposes, however, a single PC can be used for both server and client.
Also, the supplied demonstration includes a simulated hypothetical plant which does not
require any actual isoLynx systems to be connected.
To commence installation, commission the server PC with Windows XP Professional.
Then follow the ReDAQ software installation procedure outlined in Section 4.2. After
these procedures are complete, it is possible to run the simulation demonstration from a
browser running on the server machine.
The supplied demonstration also includes some web pages designed to work with a
“suitcase” isoLynx evaluation system (Ethernet version). In order to run this isoLynx
demonstration, please follow the procedure outlined in Section 4.3 to connect to the
isoLynx.
To connect to other isoLynx networks please follow the procedure outlined in Section
4.3, 4.4, or 4.5 as appropriate.
In order to access ReDAQ from a remote workstation, the server machine must be
connected to an intranet or the Internet. Please follow the procedure outlined in Section
4.6 to achieve this.
4.2 Software installation
ReDAQ runs as a service under Windows. ReDAQ is supplied in the form of a file called
“ReDAQ Console.exe”. This program serves two purposes. Firstly, it is an installer of
the ReDAQ system for the server machine. Secondly, it serves as a console from which
to manage the ReDAQ service.
Obtain “ReDAQ Console.exe” via download or otherwise and place it somewhere
convenient on the server disk. It may be placed on the desktop if desired. Start ReDAQ
Console by double-clicking on the file. If the program was received over the Internet, a
pop-up window may appear entitled “Open File – Security Warning”. If this happens,
please un-check the box “Always ask before running this program”, and then click “Run”.
The Console window is illustrated in Figure 3.
Rev 1.004
14
User Guide
ReDAQ™
Installation of the software requires three steps. Refer to the upper-left section of the
Console:
1. Press button 1 to install the ReDAQ directory on the C drive. The status area will
then show that the directory is installed.
2. Press button 2 to install the ReDAQ server (“redaq.exe”) as a Windows service.
The status area will then show that the service is installed.
3. Press button 3 to start the ReDAQ service. The status area will then show that
the service is running.
At this point ReDAQ is installed and running. It is now possible to view ReDAQ web
pages on the server machine itself, providing the machine has a Java-enabled browser.
Most modern PC's supplied with Windows-XP systems have Microsoft Internet Explorer
and Java pre-installed. Although ReDAQ will function well with Internet Explorer, the
recommended browser is Firefox. This can be downloaded and installed in a couple of
minutes from http://www.firefoxdownload.com. If Java is not installed, it may also be
downloaded and installed a couple of minutes from http://java.com. The status area of
ReDAQ Console will indicate if Java is not installed or is out of date.
Once it has been established that the desired browser and Java have been installed, the
next step is to open the ReDAQ home page:
1. Press the “Open ReDAQ Home Page” button in the Console “Maintenance”
section to open the home page.
2. When the browser attempts to open the first page from ReDAQ, it will be
challenged to provide authentication information. Enter “demo” for both the user
name and password. (Note that “demo” is the default in the software distribution;
the system administrator may change this after installation).
3. Select "Simulation Demonstration Home".
At this stage, the supplied simulation demonstration can be fully explored. However, so
far no isoLynx systems have been installed, and so the isoLynx “suitcase” demonstration
will not display any data. Please refer to Section 4.3 to install the “suitcase” evaluation
hardware.
Rev 1.004
15
User Guide
ReDAQ™
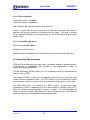
4.3 Procedure for connecting the server to a single isoLynx via Ethernet
This is the configuration usually deployed for the isoLynx “suitcase” evaluation hardware,
and is the easiest to set up. This procedure assumes that the IP address of the isoLynx
is set to the factory default of 192.168.0.215. The isoLynx demonstration attempts to
bind to the server Ethernet port with an IP address of 192.168.0.1. Note that this
Ethernet port must be additional to any port used to connect to an intranet or the Internet.
1. Stop the ReDAQ service, if it is running, using ReDAQ Console.
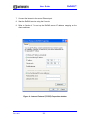
2. Configure the server Ethernet port to be used to connect to the isoLynx network
to a fixed IP address of 192.168.0.1 and subnet mask 255.255.255.0. This
requires opening the “Internet (TCP/IP) Properties” window provided as part of the
Windows operating system:
Select: Start → Settings → Network Connections
Double-click on the name of the Ethernet port which will connect to the isoLynx.
Select “Internet Protocol (TCP/IP)”.
Click on “Properties”.
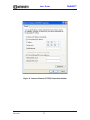
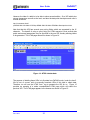
Set the address to 192.168.0.1 and the subnet mask to 255.255.255.0 as shown
in Figure 6.
3. Ensure that all other Ethernet ports on the server, both wired and wireless, are
set to use different IP segments from that used by the isoLynx Ethernet port. If
necessary, disable any conflicting ports.
4. Connect the isoLynx to the server Ethernet port using a crossover RJ-45 cable.
5. Start the ReDAQ service using the Console.
6. Check that the host communication LEDs on the isoLynx are flashing. If they are
not, check the previous procedures.
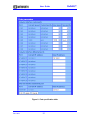
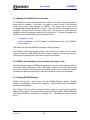
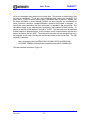
7. Obtain an unlock code for the required isoLynx. Enter this via the ReDAQ
“System configuration” section, under “Maintain unlock codes”. Then select
“Save configuration” and “Save” in order to write the unlock code permanently to
the configuration file. The configuration menu page is shown in Figure 7.
The ReDAQ isoLynx demonstration should now allow data from the isoLynx to be
displayed.
Rev 1.004
16
User Guide
Figure 6 - Internet Protocol (TCP/IP) Properties window
Rev 1.004
17
ReDAQ™
User Guide
Figure 7 - ReDAQ System Configuration Menu
Rev 1.004
18
ReDAQ™
User Guide
ReDAQ™
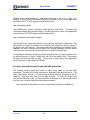
4.4 Procedure for connecting the server to an isoLynx Ethernet network
An isoLynx network can be set up using an Ethernet switch. Each isoLynx system
should be configured with a unique IP address. Connect each isoLynx system to one of
the down-link ports of the switch; connect the up-link port of the switch to the ReDAQ
server. Please follow the procedures as described in the “isoLynx SLX200 Hardware
User Manual” to set up the network.
This procedure assumes that the IP address of the server port connecting to the switch
is 192.168.0.1. If this is not the case, please modify the following instructions
accordingly.
1. Start the ReDAQ service, if it is not already running, using ReDAQ Console.
2. Select “Configure ports” under “System Configuration”. The ports specification
table is shown in Figure 8.
3. Choose an Ethernet logical port name for the port which will connect to the
switch. Set the IP address to 192.168.0.1.
4. Ensure that each data point associated with isoLynx systems on the network
specifies or inherits the port specification with the name chosen above.
5. Stop the ReDAQ service, using the Console.
6. Configure the server Ethernet port to be used to connect to the switch to a
specific IP address of 192.168.0.1 and subnet mask 255.255.255.0. This
requires opening the “Internet (TCP/IP) Properties” window provided as part of the
Windows operating system:
Start → Settings → Network Connections
Double-click on the name of the Ethernet port which will connect to the switch.
Select “Internet Protocol (TCP/IP)”.
Click on “Properties”.
Enter the address and subnet mask as shown in Figure 6.
7. Ensure that all other Ethernet ports on the server, both wired and wireless, are
set to use different IP segments from that used by the isoLynx network Ethernet
port. If necessary, disable any conflicting ports.
8. Connect the switch to the server Ethernet port.
Rev 1.004
19
User Guide
ReDAQ™
9. Start the ReDAQ service using the Console.
10. Check that the communication LEDs on the isoLynx systems are flashing. If they
are not, check the previous procedures.
11. Obtain unlock codes for each isoLynx system on the network. Enter these via the
ReDAQ “System Configuration” section, under “Maintain unlock codes”. Then
select “Save configuration” and “Save” in order to write the unlock codes
permanently to the configuration file.
Rev 1.004
20
User Guide
Figure 8 - Port specification table
Rev 1.004
21
ReDAQ™
User Guide
ReDAQ™
4.5 Procedure for connecting the server to an isoLynx serial network
Please follow the procedures as described in the “isoLynx SLX200 Hardware User
Manual” to set up the isoLynx network.
1. Start the ReDAQ service, if it is not already running, using the Console.
2. Select “System Configuration” and then “Configure ports”.
specification table is shown in Figure 8.
The ports
3. Choose the COM port which will connect to the serial network. Set the
transmission speed and parity parameters as required.
The supplied
configuration already includes an entry for COM5 and set at 19200 bps with even
parity.
4. Ensure that each data point associated with isoLynx systems on the network
specifies or inherits the port specification with the name chosen in the previous
step.
5. Obtain unlock codes for each isoLynx system on the network. Enter these via the
“System Configuration” section, under “Maintain unlock codes”.
6. Select “Save configuration” and then “Save” in order to write the parameters
entered above permanently to the configuration file.
7. Stop the ReDAQ service, using the Console.
8. Connect the isoLynx serial network to the server COM port.
9. Start the ReDAQ service using the Console.
10. Check that the communication LEDs on the isoLynx systems are flashing. If they
are not, check the previous procedures.
Rev 1.004
22
User Guide
ReDAQ™
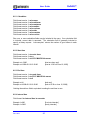
4.6 Procedure for connecting to an intranet
A small private intranet can be set up using an Ethernet hub or switch. Connect the uplink port of the hub/switch to the server, using a straight RJ-45 cable. Connect the downlink ports of the hub/switch to the client machines using straight RJ-45 cables.
Alternatively, a single user-station can be connected directly using a crossover RJ-45
cable.
If connecting to an existing corporate Ethernet switch, please request the network
administrator to provide a static IP address for use by the server, and request port 80 to
be opened. The network administrator will also arrange to connect the server to the
switch. For the purpose of illustration, this procedure assumes the server Internet port IP
address to be 192.168.1.1:
1. Start the ReDAQ service, if it is not already running, using the Console.
2. From the ReDAQ root page select “System Configuration” and then “Configure
ports”.
3. Set the Internet Interface IP address to 192.168.1.1. The supplied ReDAQ
configuration has this address set to 127.0.0.1 (localhost) to provide for the
browser being run on the server machine.
4. Stop the ReDAQ service, using the Console.
5. Configure the server Ethernet port to be used to connect to the intranet to a
specific IP address of 192.168.1.1 and subnet mask 255.255.255.0. This
requires opening the “Internet (TCP/IP) Properties” window provided as part of the
Windows operating system:
Select: Start → Settings → Network Connections
Double-click on the name of the Ethernet port which will connect to the switch.
Select “Internet Protocol (TCP/IP)”.
Click on “Properties”.
Enter the address and subnet mask as shown in Figure 9.
6. Ensure that all other Ethernet ports on the server, both wired and wireless, are
set to use different IP segments from that used by the isoLynx network Ethernet
port. If necessary, disable any conflicting ports.
Rev 1.004
23
User Guide
ReDAQ™
7. Connect the intranet to the server Ethernet port.
8. Start the ReDAQ service using the Console.
9. Refer to Section 4.7 to set up the ReDAQ server IP address mapping on the
client machines.
Figure 9 - Internet Protocol (TCP/IP) Properties window
Rev 1.004
24
User Guide
ReDAQ™
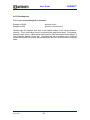
4.7 Mapping the ReDAQ server host name
If it is intended to set up a small private client network, it may be the case that no domain
name server is available. In this case, it is helpful to insert an entry in the Windows
"hosts" file of each client machine for ReDAQ. The "hosts" file is found in the
"C:\WINDOWS\system32\drivers\etc" directory. Open the file with a text editor such as
“Notepad”. As the file does not have a type suffix, it is necessary to direct Windows
towards the correct the program with which to open the file. To create a mapping to the
ReDAQ server, add the following line at the end of the file:
<ip address> redaq
where <ip address> is the IP address, in dotted-quad format, of the ReDAQ
server machine.
This allows the URI of the ReDAQ home page to be "http://redaq".
The ReDAQ console automatically makes such an entry in the hosts file of the server
machine, when the “Install ReDAQ directory” button is pressed. Accordingly, the same
URI may be used when running a browser on the server machine.
4.8 ReDAQ client machine screen resolution and aspect ratio
The demonstration pages in ReDAQ are optimized for monitors with an aspect ration of
16:10 and a screen resolution of 1280 x 800 pixels. Please use monitors with at least
this screen resolution and maximize the browser window when accessing ReDAQ.
Scrollbars will appear in the browser if the screen resolution is less than the optimal.
4.9 Running ReDAQ Designer
ReDAQ Console has a button which will start ReDAQ Designer directly. ReDAQ
Designer is supplied as a Java archive, “redaq.jar”. This file will be found in the ReDAQ
directory after installation.
The “redaq.jar” file may also be copied to another machine in order to allow graphical
applets to be designed. The target machine must have Java installed. ReDAQ Designer
may then be started by clicking on the “redaq.jar” file. Alternatively a shortcut be may
set up.
Rev 1.004
25
User Guide
ReDAQ™
4.10 Unlock code installation
Each SLX200 analog I/O base unit requires an unlock code to be entered into the
ReDAQ configuration. If an appropriate unlock code for the isoLynx processor is not
installed, numerical values associated with that processor will show “locked”, and
graphical symbols will show two colors separated by a diagonal. Exceptions to this rule
are the “device info” parameters which will be displayed even if there is no valid unlock
code.
Unlock codes may be obtained by contacting Dataforth Corporation. To enter an unlock
code into the ReDAQ configuration, perform the following procedure:
1. Go to the ReDAQ root page.
2. Select “System configuration”.
3. Select “Maintain unlock codes”.
4. Cut and paste the new unlock code into the text box and click on “Add”.
5. Click on “Return”.
6. Click on “Save configuration”.
7. Click on “Save”.
8. Click on “Return”.
Unlock codes may also be entered directly into the "config.xml" file. Please refer to
Section 11 for details.
4.11 User names and passwords
The ReDAQ distribution is configured with a user name of “demo” and a password of
“demo”. If the installation is expanded to include real data, these should be changed by
the system administrator to more secure values. User names and passwords are
specified in the "config.xml" file. Please refer to Section 11 for details.
Rev 1.004
26
User Guide
ReDAQ™
5. Exploring the demo
To start exploring the demo, simply go to the ReDAQ root page. The procedure to do
this depends on whether the browser it be run on the server machine or a client machine.
If working on the server machine, enter the following into the browser address line:
http://redaq
Alternatively, ReDAQ Console has a button which can be used to instantiate the default
browser and open the root page directly.
If working on a client machine, enter the following into the browser address line:
http://<uri>
<uri> is the URI or IP address of the server on which ReDAQ is installed. An entry may
have been made in the “hosts” file to map the server URI to a familiar name such as
“redaq”. Please see the installation instructions in Section 4.6 for further details.
The browser will present an authentication window. Please enter the user name and
password. The default user name and password are both "demo". ReDAQ will then
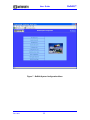
return the root page which is illustrated in Figure 10.
Once the ReDAQ root page has been accessed, one of two demonstrations may be
selected; a simulation demonstration, and an isoLynx demonstration.
Each
demonstration illustrates a “web site” constructed from HTML pages.
5.1 Simulation demonstration
The simulation demonstration does not require any isoLynx system to be connected.
The simulation is based on a hypothetical plant consisting of four distillation columns.
The site illustrates the use of mimics, history graphs, live graphs, X-Y graphs, tables,
histograms, and pie charts. These are all real-time graphical displays. The site also
demonstrates the ability to generate data tables in both HTML and Excel formats.
The buttons at the left side of the display allow the various demonstration pages to be
accessed, as well as providing direct links to both the ReDAQ home page and the
simulation demonstration home page.
Rev 1.004
27
User Guide
ReDAQ™
Figure 10 - The ReDAQ Root Page
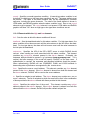
5.2 isoLynx demonstration
The isoLynx demonstration is based on the standard "suitcase" hardware evaluation kit
(Ethernet version). The site illustrates accessing real data via a mimic and a history
graph. These are all real-time graphical displays.
The demonstration assumes that the hardware is configured with the default settings and
has the modules installed as detailed in Figure 11.
If the isoLynx is not connected or not installed correctly, all numerical values will show
“comms fail”, and graphical symbols will show two colors separated by a diagonal. If an
appropriate unlock code for the isoLynx processor is not installed, all numerical values
will show “locked”, and graphical symbols will again show two colors separated by a
diagonal.
Rev 1.004
28
User Guide
ReDAQ™
Analog Panel
Channel 0:
Channel 1:
Channel 2:
SCM5B49-07
SCM5B36-03
SCM5B47J-03
-10V to +10V Voltage output module
1000Ω Potentiometer module
0ºC to 500ºC Linearized thermocouple input module
1781-SW5S
SCMD-MOAC5
Switch module
Digital output module
Digital Panel
Channel 0:
Channel 1:
Figure 11 - Module configuration for isoLynx demonstration
The demonstration is a useful vehicle for learning about ReDAQ. Try checking the
"Show expressions" box and then pointing at smart components. This will show how
data points are accessed and how they can be incorporated into mathematical
expressions. Also, try viewing the HTML source by selecting “view page source” in the
browser. Note that the HTML source tends to be very similar from page to page, and,
therefore, it is very easy to create new pages by copying existing ones and undertaking
minor editing.
5.3 Demonstration data points
For reference, a schedule of the data points used by the demonstrations is provided in
the appendix.
Rev 1.004
29
User Guide
ReDAQ™
6. The Historian
ReDAQ has a built-in lossless historian. The historian is said to be lossless because the
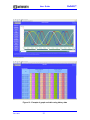
data is recorded without any loss of accuracy. Figure 12 shows an example of a graph
and a table using history data.
Each data point may be specified to be historized. It is only necessary to provide two
parameters for the historian.
The first is the duration in days for which history will be recorded. History is recorded in a
circular storage mode. So, for example, if the duration is set at 90 days, data recorded
on the 91st day after starting will overwrite the data recorded on the first day.
The second parameter required is the sampling interval in seconds.
process plant, the sampling interval might be 60 seconds.
For a typical
To give an idea of how much disk space is used, sampling at 60 second intervals for a
duration of 90 days creates a file of size just under half a megabyte per data point.
As with other data point parameters, the history specifiers may be set either by
accessing the “System Configuration” section via a browser, or by directly manipulating
the "config.xml" file. Section 11 provides further details.
History files are located in the directory C:\redaq\history. It is generally unnecessary to
access this directory directly. ReDAQ will create and access the history files
automatically in accordance with the configuration parameters.
The sections "ReDAQ URIs" and "Graphical Displays" describe how to use history data.
Rev 1.004
30
User Guide
Figure 12 - Example of graph and table using history data
Rev 1.004
31
ReDAQ™
User Guide
ReDAQ™
7. The Alarm Processor
ReDAQ has a built-in alarm processor which continuously monitors data-point values
and sets alarm conditions accordingly.
Each data point may be specified to be alarmed with an unlimited number of alarm
conditions. An alarm condition typically is set when the data point value is greater than or
less than the alarm condition value. A dead-band may be applied in determining the
alarm condition. At any time, the data point is then either in one of the alarm conditions
or none.
The alarm value of a data-point may be referenced by appending the modifier “:alarm” to
the data point name. Alarmed data points can also be configured to send e-mails when
the set alarm condition changes.
7.1 Alarm conditions
An unlimited number of alarm conditions may be associated with each data point. Alarm
conditions are of type “high”, “normal”, or “low”. High type alarms are set when the data
point value becomes greater than or equal to the alarm condition limit value. They are
reset when the data point value falls below the limit value minus the dead-band. Low
type alarms are set when the data point value becomes less than or equal to the alarm
condition limit value. They are reset when the data point value climbs above the limit
value plus the dead-band. The normal type alarm does not contain limit or dead-band
values; it is set when none of the other alarm conditions is satisfied. Only one normal
type alarm is permitted.
Each alarm condition also has a user-defined name string. This is usually set to an
expression meaningful of the condition. For example, a data point associated with a
tank level might have two high-type alarm conditions called “high level” and “overflow”.
For compatibility with many process control systems, a data-point could be configured
with two high-type alarm conditions named “high-high”, and “high”, and two low-type
alarm conditions named “low” and “low-low”. The alarm value returned when the data
point is referenced with the “:alarm” modifier is the name of the alarm condition set.
7.2 SMTP server
ReDAQ has a built-in SMTP (Simple Mail Transfer Protocol) server. The SMTP Server
allows e-mails to be transmitted on entering or leaving alarm conditions. Each alarm
condition may have a number of parameters specified for controlling the transmitted email. These include the name of the ISP's SMTP server to which ReDAQ will connect,
the recipient e-mail addresses, the subject line of the e-mail, and the name of a file
containing the content of the e-mail.
Rev 1.004
32
User Guide
ReDAQ™
The content of each e-mail is provided in a .txt file located in the “C:\redaq\mail” directory.
The file may contain references to data points so that values may be dynamically
embedded in the e-mails. This is achieved by specifying the data point name in braces
as shown in the following example:
The ambient temperature is {DEMO.ANALOGS.TEMP} {DEMO.ANALOGS.TEMP:units}.
This might produce the following text in the transmitted e-mail:
The ambient temperature is 67.55 ºF.
By using data point references, the e-mail can present data from any data point in
addition to that causing the alarm condition.
The ReDAQ SMTP server will connect to ISP servers which require authentication in
accordance with the RFC 4954 specification. The PLAIN, LOGIN, and CRAM-MD5
authentications methods are supported. CRAM-MD5 is the most secure. ReDAQ
authenticates using CRAM-MD5 if the ISP server supports it, otherwise it will use PLAIN
or LOGIN.
7.3 Configuring alarms
As with other data point parameters, the alarm parameters may be set either by
accessing the “System Configuration” section via a browser, or by directly manipulating
the “config.xml” file. Section 11 provides further details.
Rev 1.004
33
User Guide
ReDAQ™
8. ReDAQ URIs
The Uniform Resource Identifier (URI) is the key to communicating with isoLynx systems
using ReDAQ. The most basic URI is the one used to access the ReDAQ root HTML
page:
http://<hostname>
<hostname> is the name of the server on which ReDAQ is installed. For example, the
Dataforth demonstration of ReDAQ is installed on the host “dataforth.net”. Please refer
to Section 4.7 for details on how to create IP address mappings to the server by placing
entries in the “hosts” file. Note that ReDAQ Console automatically places an entry in the
server machine “hosts” file so that the root page URI can be “http://redaq”.
Having arrived at the root page, data can be accessed by simply navigating around the
web site. ReDAQ is distributed with a built-in simulation demonstration which can be
accessed by clicking on the appropriate entry in the root page. The actual URI of the
simulation home page is:
http://<hostname>/disp/demosim/home.html
Similarly, the URI of the demonstration home page for a connected isoLynx is:
http://<hostname>/disp/demolynx/home.html
Note that all of the names of the html pages used for the demonstration begin with /disp.
Indeed, all user generated pages must begin with “/disp”, and the corresponding html
files are located in the directory “C:\redaq\disp”. It can be seen that in addition to
providing communications to isoLynx systems, ReDAQ also acts as a web server for
HTML files located in this directory.
However, not all pages delivered by ReDAQ actually exist as files on the disk drive.
Some pages are built-in and are actually generated programmatically. For example, the
URI of the configuration home page is:
http://<hostname>/config/home
All URIs of the form “http://<hostname>/config/....” are generated programmatically.
These are HTML pages which are used for management of the data point configuration.
The really powerful URIs, however, are those used to generate tabular data in both HTML
and XML format. The use of these URIs is described in the following sections.
Rev 1.004
34
User Guide
ReDAQ™
8.1 Generating tabular data in HTML format
This section provides a tutorial on generating HTML data tables. Some basic knowledge
of HTML is assumed. However, readers unfamiliar with HTML will find the subject matter
informative.
Suppose we wish to display, in a browser, the current value of the data point
DEMO.SIM.COLUMN1.LEVEL. We need to do two things. First we have to form a URI
which specifies that we require ReDAQ to return an HTML page. Secondly, we append
to this a query string which specifies the data point of interest. A query string is a
sequence of one or more fields where each field is of the format, “<name>=<value>”. In
this case, the name is ‘p’ for “point”. The query string is preceded by the character ‘?’.
The full URI is:
http://<hostname>/html?p=DEMO.SIM.COLUMN1.LEVEL
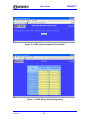
Figure 13 shows the response to this request. The returned table shows the date and
time at the instant the request was processed, with the current value and alarm status of
the data point.
Figure 13 - HTML tabular data
Rev 1.004
35
User Guide
ReDAQ™
However, the idea of a table is to be able to show several entities. So a URI which also
returns temperature as well as the level, and also the data point descriptors and units is
formed as follows:
http://<hostname>/html?
p=DEMO.SIM.COLUMN1.LEVEL&p=DEMO.SIM.COLUMN1.TEMP&m=Descriptor&m=Units
Note that that this URI has several query string fields, which are separated by the ‘&’
character. The benefit of using a query string for HTML requests is that several data
points and several parameters may be specified in the one URI, thereby allowing tables
to be generated. The HTML page returned is shown in Figure 14.
Figure 14 - HTML tabular data
The purpose of detailing these URIs is to illustrate how ReDAQ works “under the hood”.
We do not, of course, wish to manually formulate URIs of this kind to obtain data.
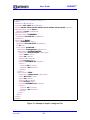
Therefore, we will use the HTML “form” tag to generate the URI for us. Figure 15
provides an example of a rather unembellished HTML page which will submit the
previous URI. The HTML page appears in the browser as shown in Figure 12.
Rev 1.004
36
User Guide
ReDAQ™
So far, the examples have returned only current data. The process to obtain history data
will now be considered. To do this, some additional fields need to be included in the
query string. Firstly, to specify history data, a calculation type is required. Usually, just
the mean calculation is used, although ReDAQ can also calculate any combination of
mean, maximum, minimum, standard deviation, variance, and number of samples. To
specify the mean calculation, the field “calc=mean” is included in the query string. The
calculations apply to the data samples recorded by the historian in each interval. To
specify an interval of 300 seconds, the field is “it=300”. The start time must be specified
in either relative or absolute format. In this example, we will request data for the last hour
and so the field will be “st=-3600”. The end time for the table can also be specified, but in
this example we will omit it, so that the end time will default to the current time. The URI
required is, therefore:
http://<hostname>/html?p=DEMO.SIM.COLUMN1.LEVEL&p=DEMO.SIM.
COLUMN1.TEMP&m=Descriptor&m=Units&calc=mean&st=-3600&it=300
The table returned is shown in Figure 16.
Rev 1.004
37
User Guide
ReDAQ™
<?xml version='1.0' encoding='UTF-8'?>
<!DOCTYPE html PUBLIC '-//W3C//DTD HTML 1.0 Transitional//EN' 'http://
www.w3.org/TR/xhtml1/DTD/xhtml1-transitional.dtd'>
<html>
<head>
<title>Simple Table</title>
<link rel="stylesheet" type="text/css" href="demo.css" />
</head>
<body>
<img class='top' src='/image/dflogo' />
<div class='redaq'>ReDAQ</div>
<div class='head'>HTML simple data table request example</div>
<div class='main'>
<hr />
<p>Pressing the button submits a form to query the Column 1
Level and Temperature</p>
<form name="form1" method="get" action="/html">
<input type="hidden" name="p" value="DEMO.SIM.COLUMN1.LEVEL">
<input type="hidden" name="p" value="DEMO.SIM.COLUMN1.TEMP">
<input type="hidden" name="m" value="Descriptor">
<input type="hidden" name="m" value="Units">
<input type="Submit" value="Get Data">
</form>
</div>
</body>
</html>
Figure 15 - HTML page source using <form> to request tabular data
Rev 1.004
38
User Guide
Figure 16 - HTML page as displayed in the browser
Figure 17 - HTML tabular data showing history
Rev 1.004
39
ReDAQ™
User Guide
ReDAQ™
8.2 Generating tabular data in Excel format
Tabular data can also be downloaded in Excel format. Excel downloads may be saved
as files or opened immediately in the browser.
An Excel download is achieved by a process very similar to that used for HTML
downloads.
The difference is that the base URI for Excel downloads is
http://<hostname>/xl. Also, an additional field is included with Excel downloads to specify
the file name. The following sections provide the details.
With Firefox, a pop-up window appears after submitting the request. Select the
appropriate radio button. If “open with” is selected, ensure that the value in the select box
is set to “excel.exe”.
8.3 Query string field syntax for use with HTML and Excel downloads
The following sections detail the syntax for query string fields for use with HTML and
Excel downloads. The base URI for HTML downloads is http://<hostname>/html. The
base URI for Excel downloads is http://<hostname>/xl. The query string begins with the
‘?’ character and the fields must be separated by the ‘&’ character. Note that each field
must be URL encoded.
8.3.1 Heading
Field format: h=<heading text>
Example: h=Summary
Example: h=Plant+Data
The heading field is optional.
8.3.2 Data point
Field format: p=<name of data point>
Example: p=DEMO.SIM.COLUMN1.LEVEL
Example: p=DEMO.SIM.COLUMN1.TEMP
One or more point fields may be included in the query.
Rev 1.004
40
User Guide
ReDAQ™
8.3.3 Parameter
Field format version 1: m=Descriptor
Field format version 2: m=Units
Field format version 3: m=Module
Field format version 4: m=Panel
Field format version 5: m=Channel
Zero, one, or more parameter fields may be included in the query. As far as accessing
data is concerned, the parameter value is case insensitive. However, the parameter
value is reproduced in the same case in the table headings.
8.3.4 Calculation
Field format version 1: calc=mean
Field format version 2: calc=minimum
Field format version 3: calc=maximum
Field format version 4: calc=median
Field format version 5: calc=variance
Field format version 6: calc=stdv
Field format version 7: calc=samples
Field format version 8: calc=current
Zero, one, or more calculation fields may be included in the query. If no calculation field
is included, current data is assumed. The calculation field is generally included to
specify a history request. “calc=samples” returns the number of good values in each
interval.
8.3.5 Start time
Field format version 1: st=<unix time>
Field format version 2: st=-n
Field format version 3: st=YYYY-MM-DD-hh-mm-ss
Example: st=-3600
Example: st=2008-06-12-15-30-00
Rev 1.004
[start one hour ago]
[start at 15:30 on June 12, 2008]
41
User Guide
ReDAQ™
8.3.6 End time
Field format version 1: et=<unix time>
Field format version 2: et=YYYY-MM-DD-hh-mm-ss
Field format version 3: et=0
Example: et=0
Example: et=2008-06-12-16-30-00
[end now]
[end at 16:30 on June 12, 2008]
Omitting the end time field is equivalent to setting the end time to now.
8.3.7 Interval time
Field format: it=<interval time in seconds>
Example: it=600
Example: it=3600
[5-minute intervals]
[hourly intervals]
8.3.8 Rounding time
Field format: rt=<rounding time in seconds>
Example: rt=3600
Example: rt=600
[round to hours]
[round to 5-minute times]
Rounds down the absolute start time to the highest multiple of the value provided in
seconds. This is useful when used in conjunction with relative start times. For example,
setting the start time to -14400 and the interval time to 3600 will request history data for 4
hourly intervals starting 4 hours ago. Combining this with a rounding time of 3600 will
request history data for 4 hourly intervals starting on the hour for the 4 previous complete
hours.
8.3.9 File name for Excel download
Field format: filename=<name of excel file>
Example: filename=summary.xls
If the file name field is omitted, Excel files will be named “redaq.xls”.
Rev 1.004
42
User Guide
ReDAQ™
8.3.10 Table orientation
Field format version 1: or=down
Field format version 2: or=across
This field allows the orientation of tables to be specified.
Version 1 means that the point names will be listed down the page and version 2
specifies that the point names will be listed across the page. If the field is omitted,
current data tables default to point names down, and history data tables default to point
names across.
8.3.11 Cascadable style sheet
Field format: css=<file name>
Example: css=summary.css
Specifies that the cascadable style sheet file will be used by the returned HTML page.
8.4 Requesting XML downloads
HTML and Excel downloads are mainly used for immediate viewing by human operators.
A third format for downloading, XML, provides for user applications to import or
automatically interrogate ReDAQ.
For XML downloads, ReDAQ makes use of a philosophy known as Representational
State Transfer or REST.
The principle of REST is that a set of distributed resources may be accessed using
Uniform Resource Identifiers (URIs). The HTTP protocol is used to deliver the request
for the resource to the server and to return a representation of the resource to the client.
The World Wide Web is an example of a REST system. A typical web page,
represented in HTML, is addressed by a URI, and returned to a browser using HTTP.
When the browser receives the page, its state is changed. The received page may
contain a hyperlink (another URI) which will cause, should the user select the link,
another resource to be received and the state changed again.
Rev 1.004
43
User Guide
ReDAQ™
ReDAQ returns representations of data point resources in the form of XML. For
example, to obtain a list of data points configured in a ReDAQ server, a client application
would issue an HTTP GET request with the following URI:
http://<hostname>/points
The ReDAQ server returns a schedule of data points in XML format. To request data
concerning the data point “panel2.voltage1”, including the current value, client application
would issue an HTTP GET request with the following URI:
http://<hostname>/point/panel2.voltage1
The ReDAQ server returns data specific to this particular data point in XML format. The
URI required to access the data point was included in the response to the first request in
the format of an xlink element. This means that a client application, for example a SQL
database, can start by issuing the first simple GET request, determine from this details
of the entire set of data points, and then drill down to obtain all required data.
It is possible to experiment with the procedure described here, by using a browser such
as Internet Explorer or Firefox. Simply enter the URI in the address field. The browser
will format the received XML file neatly. The browser is doing what a client application
would usually do to obtain data from ReDAQ.
8.5 Query string field syntax for use with XML downloads
The following sections detail the syntax for query string fields for use with XML
downloads. The base URI for XML downloads is described in the previous section. The
query string begins with the ‘?’ character and the fields must be separated by the ‘&’
character. Note that each field must be URL encoded. For XML, the query string
specifies just the history data. The following URI is an example of an XML request for the
last 4 hours at 1-minute intervals with the mean calculation:
http://<hostname>/point/demo.sim.column1.level?calc=mean&st=-14400&it=60
Rev 1.004
44
User Guide
ReDAQ™
8.5.1 Calculation
Field format version 1: calc=mean
Field format version 2: calc=minimum
Field format version 3: calc=maximum
Field format version 4: calc=median
Field format version 5: calc=variance
Field format version 6: calc=stdv
Field format version 7: calc=samples
Field format version 8: calc=current
Zero, one, or more calculation fields may be included in the query. If no calculation field
is included, current data is assumed. The calculation field is generally included to
specify a history request. “calc=samples” returns the number of good values in each
interval.
8.5.2 Start time
Field format version 1: st=<unix time>
Field format version 2: st=-n
Field format version 3: st=YYYY-MM-DD-hh-mm-ss
Example: st=-3600
Example: st=2008-06-12-15-30-00
[start one hour ago]
[start at 15:30 on June 12, 2008]
8.5.3 End time
Field format version 1: et=<unix time>
Field format version 2: et=YYYY-MM-DD-hh-mm-ss
Field format version 3: et=0
Example: et=0
Example: et=2008-06-12-16-30-00
[end now]
[end at 16:30 on June 12, 2008]
Omitting the end time field is equivalent to setting the end time to now.
8.5.4 Interval time
Field format: it=<interval time in seconds>
Example: it=600
Example: it=3600
Rev 1.004
[5-minute intervals]
[hourly intervals]
45
User Guide
ReDAQ™
8.5.5 Rounding time
Field format: rt=<rounding time in seconds>
Example: rt=3600
Example: rt=600
[round to hours]
[round to 5-minute times]
Rounds down the absolute start time to the highest multiple of the value provided in
seconds. This is useful when used in conjunction with relative start times. For example,
setting the start time to -14400 and the interval time to 3600 will request history data for 4
hourly intervals starting 4 hours ago. Combining this with a rounding time of 3600 will
request history data for 4 hourly intervals starting on the hour for the 4 previous complete
hours.
Rev 1.004
46
User Guide
ReDAQ™
9. Designing custom pages
ReDAQ provides the functionality of a web-server which delivers a flexible set of mimics
and graphics within HTML pages.
Two demonstration web-sites are included with
ReDAQ. This section explains how to add user-generated web pages.
9.1 File organization
All user pages are located in the directory “C:/ReDAQ/disp”. It will be seen that the
ReDAQ distribution includes two sub-directories within “disp” entitled “demosim” and
demolynx”. These directories contain the web pages for the two demonstration websites.
To add plant-specific pages, users should create a new directory under “disp”. For
example, a directory entitled “plant” might be created. This would contain the new web
pages to be associated with the user's plant. For example a file “summary.html” might
be generated.
This file would exist on the server disk at location
“C:\redaq\disp\plant\summary.html”. It would be accessed from web browsers by using
the URI: “http://<localhist>/disp/plant/summary.html”.
9.2 Creating pages to retrieve tabular data
Section 7 describes how to form URIs to obtain HTML and Excel snapshot tabular data.
This technique makes use of HTML forms and an example of the HTML code required is
provided. The user might like to experiment with creating similar pages for the plant data
points. Other examples are provided in the demonstration web-sites.
The next section describes how to create HTML pages which return dynamic real-time
data.
9.3 Real-time graphical displays - the ReDAQ agent
The most powerful direct user interface is achieved by creating real-time graphical
displays. For this, the ReDAQ Java agent is deployed. The agent is a program which
runs from within the user's browser, communicating with the ReDAQ server, and
drawing dynamic mimics and graphs in the web page.
The ReDAQ agent is automatically loaded into a cache in the user's machine when the
first page requiring it is displayed.
Rev 1.004
47
User Guide
ReDAQ™
Figure 2 shows an example of a ReDAQ graphical display. The large white rectangle is
the area generated by the ReDAQ agent; the remainder is regular HTML. It is possible
for the entire display to be generated by the ReDAQ agent, or the user may choose to
make use of HTML facilities.
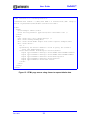
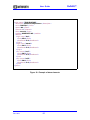
Figure 18 shows the source of the example shown in Figure 2. It may be seen that the
HTML code responsible for the graphic is just three lines as follows:
<applet code="com/dataforth/redaq/agent.class"archive="/image/redaq.jar" width="1120" height="516">
<param name="file" value="/disp/demosim/montagehist.xml">
</applet>
The code invokes the ReDAQ Java applet which is called “agent.class”. In turn, the
ReDAQ agent needs to access an XML file which contains the details of the graphical
image to be included. In this example, the XML file is identified by its relative URL in the
<param> tag.
The XML file is generated and edited by using the ReDAQ Designer. Please refer to
Section 10 for details of how to use the Designer.
Rev 1.004
48
User Guide
ReDAQ™
<?xml version='1.0' encoding='UTF-8'?>
<!DOCTYPE html PUBLIC '-//W3C//DTD XHTML 1.0 Transitional//EN'
'http://www.w3.org/TR/xhtml1/DTD/xhtml1-transitional.dtd'>
<html>
<head>
<title>Column Overview</title>
<link rel="stylesheet" type="text/css" href="demo.css" />
</head>
<body>
<img class='top' src='/image/dflogo' />
<div class='redaq'>ReDAQ</div>
<div class='head'>Column Overview</div>
<div class='main'>
<hr />
<div class='navi'>
<a class='navi' href="/">ReDAQ Home</a>
<a class='navi' href="home.html">Demo Home</a>
<a class='navi' href="table.html">Live Table</a>
<a class='navi' href="mimic.html">Mimic</a>
<a class='navi' href="mimichist.html">Hist Mimic</a>
<a class='navi' href="graphlive1.html">Live Graph 1</a>
<a class='navi' href="graphlive2.html">Live Graph 2</a>
<a class='navi' href="graphhist1.html">Hist Graph 1</a>
<a class='navi' href="graphhist2.html">Hist Graph 2</a>
<a class='navi' href="histogramlive.html">Live Histogram</a>
<a class='navi' href="montage.html">Montage</a>
<a class='navi' href="montagehist.html">Hist Montage</a>
<a class='navi' href="xyplot.html">X-Y Plot</a>
<a class='navi' href="datatables.html">Data Tables</a>
<a class='navi' href="xmldata.html">XML Data</a>
</div>
<div class='cent'>
<applet code="com/dataforth/redaq/agent.class”
archive="/image/redaq.jar" width="1120" height="516">
<param name="file" value="/disp/demosim/montagehist.xml">
</applet>
</div>
<div class='comm'>
<p>This is a ReDAQ live graphic.</p>
</div>
</div>
</body>
</html>
Figure 18 - HTML source of page containing ReDAQ graphic
Rev 1.004
49
User Guide
ReDAQ™
10. ReDAQ Designer
10.1 Introduction
ReDAQ Designer is used to design dynamic operator and management screens for use
with the ReDAQ server. Mimics can be constructed by drawing primitive graphical
objects. Primitive objects can be multiple-lines, regular or rounded rectangles, polygons,
text strings, or images (gif or jpg). Graphical symbols can be configured to change fillcolor or have a fill-level according to system data. Text strings can include formatted
system data values. Symbols can also be configured to be hyperlinks.
Complex objects such as tables, graphs, histograms, and pie charts can also be entered
graphically and mixed with mimics.
Designer is used to edit or create the XML files which are accessed by the ReDAQ Java
applet (agent.class).
An example of a Designer window is illustrated in Figure 2. The Designer is entirely
intuitive to use. The buttons at the top of the screen are used to create or edit objects in
the drawing area.
The two small buttons at the top-left of the window are used to select one of two banks of
main object buttons. The small colored buttons at the top right of the window are used to
set the current colors. The default line-color is set by the upper row, and the default fillcolor is set by the lower row. Note the blank line-color and fill-color buttons.
The step-by-step instructions for each object are shown at the bottom-left of the window.
To learn what a button does, just press it and the function appears.
10.2 Drawing Lines
Single or multiple lines can be drawn. Select the bank 1 set of tools. Then select the
required line-color. Then press the line-draw button. Position the drawing cursor at the
first point and left-click. Intermediate points are entered with further left-clicks, and the
final point is entered with a right-click.
Rev 1.004
50
User Guide
ReDAQ™
10.3 Drawing Rectangles
Standard or rounded rectangles may be drawn according to the button chosen. Select
the bank 1 set of tools. Then select the required line-color and fill-color. Then press the
appropriate "Rectangle" button. The first corner is entered with a left-click. The opposite
corner is entered with another left-click.
10.4 Drawing Polygons
Select the bank 1 set of tools. Then select the required line-color and fill-color. Then
press the "Polygon" button. Position the drawing cursor at the first vertex and left-click.
Intermediate vertices are entered with further left-clicks, and the final vertex is entered
with a right-click.
10.5 Drawing Circles
Select the bank 1 set of tools. Select the required line-color and fill-color, and then press
the "Circle" button. Enter the center with a left-click and then a point on the
circumference with another left-click.
10.6 Drawing Text Strings
Select the bank 1 set of tools. Select the required line-color, and then press the "ABC"
button. Enter the text and expression (see below), and the required justification, weight,
and point-size. Click on "OK" and then set the position with a left-click.
Rev 1.004
51
User Guide
ReDAQ™
10.7 Editing Text Strings
Select the bank 1 set of tools. Press the "ABC edit" button, and select the required text
string object with a left-click. Modify the text and expression (see Section 10.27), and the
required justification, weight, and point-size. Click on "OK".
10.8 Inserting Images
Select the bank 1 set of tools. Press the "Img" button, select the required image path,
and click "OK". Enter the URL. (This will be used by the applet to locate the image).
Note that the filename is provided; add the first part of the URL. Click on "OK". Ensure
that the URL is correct. Designer does not check the URL.
10.9 Adding an Hyperlink
Select the bank 1 set of tools. Press the "Link" button and select the object (see Section
10.26). Select whether the new page should open in the same window or a new window.
Enter the URL of the page and click on "OK". Ensure that the URL is correct. Designer
does not check the URL.
10.10 Adding a Smart Level
Select the bank 1 set of tools. Press the "Lvl" button and select the object (see Section
10.26). Select the required color and enter the expression. The value of the expression
should be between 0.0 and 1.0 corresponding to zero and full fill respectively.
Rev 1.004
52
User Guide
ReDAQ™
10.11 Adding a Smart Fill
Select the bank 1 set of tools. Press the "Fill" button and select the object (see Section
10.26). Select the required color and enter a boolean expression. The smart fill-color is
applied if the value of the expression is true.
10.12 Moving an Object
Press the "Move" button and select the object (see Section 10.26). Position the drawing
cursor at the new position and left-click.
10.13 Copying an Object
Press the "Copy" button and select the object (see Section 10.26). Position the drawing
cursor at the new position and left-click.
10.14 Moving a Point
Press the "Move Point" button and select the vertex of the symbol (see Section 10.26).
Position the drawing cursor at the new position and left-click.
10.15 Moving Multiple Points
Press the "Move Multiple Points" button and draw the selection rectangle; the first corner
is entered with a left-click and the opposite corner is entered with another left-click. Leftclick on a reference point, and then left-click again on the target location. Note that when
moving multiple points, rectangular objects are constrained to remain rectangular.
Rev 1.004
53
User Guide
ReDAQ™
10.16 Deleting Objects
Press the "Delete" button and select the object (see Section 10.26).
something by mistake, select the "edit" menu and "undo".
If you delete
10.17 Deleting Multiple Objects
Press the "Multiple-delete" button and draw the selection rectangle; the first corner is
entered with a left-click and the opposite corner is entered with another left-click. If you
delete something by mistake, select the "edit" menu and "undo".
10.18 Changing the Default Line-color and Default Fill-color of Objects
Set the desired line-color and fill-color with the color buttons. Press the "Col" button, and
then select the object (see Section 10.26).
10.19 Changing the Order of Objects
Press either the "Above" or "Below" order button as required. Then select the object (see
Section 10.26).
Rev 1.004
54
User Guide
ReDAQ™
10.20 Drawing Frames
Frames are used for mimic displays. To create a mimic display, draw a frame, and then
draw the primitive symbols on top. To draw a frame, select the bank 2 set of tools,
press the "Frame" button, enter the first corner with a left-click, and the opposite corner
with another left-click. The standard frame is achieved when the fill-color button is set to
blank and has a dark-green background. This coordinates with the standard ReDAQ
style. A different background color can be achieved by setting the fill-color button
otherwise.
10.21 Drawing Tables
Select the bank 2 set of tools. Press the "Table" button and enter the required number of
rows and columns. Enter the first corner with a left-click, and the opposite corner with
another left-click.
To enter data, press the "Edit ABC" button, left-click inside the desired table-cell, and
proceed as for editing a text string. Note that the "ABC" button does not operate on
tables.
To add a cell, press the "Divide table-cell" button, and left-click in the appropriate cell. A
new cell is created to the right of the original cell. If there is insufficient space, the
operation will be ignored. Use the "Move Multiple Points" button to adjust the cell sizes
(see Section 10.15).
To add a row, press the "Divide table-row" button and left-click in the appropriate row. A
new row is created to the bottom of the original row. If there is insufficient space, the
operation will be ignored. Use the "Move Multiple Points" button to adjust the row sizes
(see Section 10.15).
To delete a cell, press the "Delete" button, and left-click in the appropriate cell. Unless
the cell is the left-most one, the cell to the left will be extended to fill the space.
To delete multiple cells, press the "Multiple-delete" button and draw the selection
rectangle. Cells which are entirely contained by the selection rectangle are deleted.
To adjust the shape of a table, use the "Move Multiple Points" button. Table dividers and
edges contained by the selection rectangle can be moved. Note that a row divider can
only be moved if the selection rectangle spans the width of the table. Movement of
dividers and edges will block if the action would result in a cell becoming too small.
Rev 1.004
55
User Guide
ReDAQ™
10.22 Drawing Graphs
To draw a graph, select the bank 2 set of tools, press the "Draw graph" button, enter the
first corner with a left-click, and the opposite corner with another left-click. Ensure that
the graph is large enough for the text on the axes not to overlap. The graph is drawn
initially with a left axis, a bottom axis, and three functions.
To edit the left scale, press the "Scale" button and left-click to the left of the graph paper
but within the outer frame. Enter the required parameters and click on "OK".
To add a right scale, press the "Scale" button and left-click to the right of the graph paper
but within the outer frame. Enter the required parameters and click on "OK".
To edit the functions, press the "f(x)" button and left-click on the function curve
representation on the graph paper. Enter the required parameters and click on "OK". To
add a new function, press the "f(x)" button and left-click outside the graph paper but
within the outer frame.
To edit the title, press the "Edit ABC" button, left-click on the title, and proceed as for
editing a text string.
The time axis is determined by the timespan parameters (see Section 10.25).
10.23 Drawing Histograms
To draw an histogram, select the bank 2 set of tools, press the "Draw histogram” button,
enter the first corner with a left-click, and the opposite corner with another left-click.
Ensure that the graph is large enough for the text on the axes not to overlap. The
histogram is drawn initially with a left axis and three functions.
To edit the left scale, press the "Scale" button and left-click to the left of the graph paper
but within the outer frame. Enter the required parameters and click on "OK".
To add a right scale, press the "Scale" button and left-click to the right of the graph paper
but within the outer frame. Enter the required parameters and click on "OK".
To edit the functions, press the "f(x)" button and left-click on the function bar
representation on the graph paper. Enter the required parameters and click on "OK". To
add a new function, press the "f(x)" button and left-click outside the graph paper but
within the outer frame.
Rev 1.004
56
User Guide
ReDAQ™
To edit the title, press the "Edit ABC" button, left-click on the title, and proceed as for
editing a text string.
The time axis is determined by the timespan parameters (see Section 10.25).
10.24 Drawing Pie Charts
To draw a pie chart, select the bank 2 set of tools, press the "Draw pie chart" button,
enter the first corner with a left-click, and the opposite corner with another left-click.
Ensure that the pie chart is large enough for the text to fit. The pie chart is drawn initially
with three functions.
To edit the functions, press the "f(x)" button and left-click on the appropriate row in the
table. Enter the required parameters and click on "OK". To add a new function, press
the "f(x)" button and left-click outside the table rows.
To edit the title, press the "Edit ABC" button, left-click on the title, and proceed as for
editing a text string.
The time axis is determined by the timespan parameters (see below).
10.25 Setting the Timespan
The timespan applies to all objects. To set the timespan, select the bank 2 set of tools,
press the "timespan" button and enter the required parameters.
For live data, select the "live" mode. Specify the "interval" in milliseconds. If the design
includes a live graph, enter a negative number for the "start" parameter where the
magnitude of the number is the span of the time axis in milliseconds.
For history data, select the "history" mode. Specify the "interval" in milliseconds.
Usually, history ends with the current time and so the end parameter can be left blank
and the "start" parameter set to a negative number where the magnitude of the number is
the span of the history data in milliseconds. For example, enter -3600 to display a trend
over the last hour. The number in the "round" parameter, if entered, causes the start and
end times to be rounded down to multiples of that number. This allows graphs to display,
for example, daily or hourly data.
Rev 1.004
57
User Guide
ReDAQ™
10.26 Selecting Objects
Lines, rectangles, polygons, frames, tables, and graphs are selected by left-clicking on
one of the vertices. Note that the "vertices" of a rounded rectangle are where the corners
would be on the equivalent non-rounded rectangle. Circles are selected by left-clicking
on the North, South, East, or West compass points. Images are selected by clicking in
the image.
10.27 Expressions
Expressions are entered using the following operators:
+, -, *, /, ^, %, cos, sin, tan, acos, asin, atan, sqrt, sqr, exp, log, min, max, ceil, floor, abs,
neg, rand
Data point names should be enclosed in braces, e.g. {DEMO.COLUMN1.FLOW}.
An example of an expression would be:
sqrt (20 * {DEMO.COLUMN1.VOLTAGE}) + cos ({DEMO.COLUMN1.PRESSURE} / 100.0)
10.28 Saving files
When Designer is closed, a window will appear requesting the details for saving the XML
file. Alternatively, the Designer XML file can be saved at any time by selecting File->save
from the menu.
The saved file should subsequently be moved to the appropriate directory within
C:\redaq\disp. It is usual to put the XML file in the same directory as the HTML file which
will refer to it. Note that designer files have the filetype “xml”. Please refer to Section 8.3
for details.
10.29 Opening files
An existing Designer XML file can be opened at any time by selecting File->open from the
menu.
Rev 1.004
58
User Guide
ReDAQ™
11. System configuration
The system configuration is represented by an XML file, “config.xml”, located in the
“redaq” directory. The configuration details include the parameters necessary for the
server to be able to communicate with the isoLynx networks, the intranet/Internet
interface, and the schedule of data points.
The “config.xml” file can be edited directly on the server PC. Alternatively, the “System
Configuration” web-page can be used; it is essentially a user-friendly way of setting up
the “config.xml” file. This section will, therefore, also be useful when working with the
“System Configuration” page. This web-page may be accessed via the menu on the
ReDAQ root page.
An example of the configuration file for a very simple system with just two data points is
shown in Figure 19. Section 11.2 details the syntax for the configuration file.
For reference, a schedule of the data points defined in the demonstration configuration
file is provided in the Appendix.
11.1 Note regarding Extensible Markup Language
Extensible Markup Language (XML) is a data exchange and storage mechanism which
allows data to be shared between different types of computers and applications. XML
has become the industry standard for exchanging data of any kind. ReDAQ makes
extensive use of XML, both for storing the system configuration and for transmitting realtime and history data to other computers and applications in response to HTTP requests.
The basic syntax is as follows:
<element_name attribute1_name=”attribute1_value“ attribute2_name=”attribute2_value“>
Element content
</element_name>
where Element content may be other elements or text values.
The above example shows an element with two attributes. In fact, the number of
attributes may be zero, one, or several. It can be seen that XML represents data in a tree
structure because elements themselves contain other elements. Section 11.3 specifies
the names of the elements and attributes which define the ReDAQ system configuration.
Please see Figure 19 for an example of the configuration file, “config.xml”.
Rev 1.004
59
ReDAQ™
User Guide
11.2 Data point naming
Data points in ReDAQ are hierarchical. They are of the following format:
<identifier>.<identifier>.<identifier>…
<identifier> is any sequence of alphanumeric characters or ‘-‘.
separated by periods, and the number of identifiers is unlimited.
The identifiers are
By way of example, the two data points defined in Figure 19 are named as follows:
DEMO.ANALOGS.POTENTIOMETER
DEMO.ANALOGS.TEMP
Data point references entered using ReDAQ Designer may also have modifiers. For
example, the modifier “:alarm” when appended to the data point name, refers to the
alarm value. Other modifiers are “:descriptor” and “:units”. Examples of such
references are:
DEMO.ANALOGS.TEMP:alarm
DEMO.ANALOGS.TEMP:descriptor
DEMO.ANALOGS.TEMP:units
Each <identifier> is defined by the value of the name attribute of a point element in the
configuration file. A point may contain a child point. The value of the name attribute of
such a child point provides the next <identifier> in the chain. In this way, the data points
are organized into a tree architecture. This allows process plant data points to be
organized into groups which map to the structure of the facility or process.
Child points inherit many parameters from their parent points. This makes the
specification of many parameters very efficient. For example, all the data points
associated which a particular isoLynx system will have the same unit ID. By arranging
for all of these points to be children, grandchildren, or great grandchildren, of a higher
point, the ID value only needs to be specified once. Section 11.3 provides the details.
Rev 1.004
60
User Guide
ReDAQ™
11.3 Config XML parameters
This section details the syntax rules for the “config.xml” file. Please refer to Figure 19 for
additional clarification.
11.3.1 The redaq element
redaq: The "config.xml" file must contain one and one only redaq element. This is the
root element and serves as a holder for the other elements.
11.3.2 Elements within the redaq element
timezone: Sets the time zone of the server to the number of hours relative to GMT. For
example, if located in Arizona, set the time zone to -7. If located in the UK, set the time
zone to 0. If located in Singapore, set the time zone to 8. ReDAQ automatically adjusts
for daylight savings. Only one timezone element should be present within the redaq
element.
unlock: Installs an unlock code. One unlock element is required for each SLX200 in the
system. If a valid unlock element for an isoLynx is not present, ReDAQ will still display
the “device info” parameters. However, all other data values will be returned as “locked”.
authentication: Sets the name and password for a user. Zero, one, or more
authentication elements may be present depending on how many user names are
required.
ipaddress: Sets the IP address of the Internet/intranet Ethernet port. ReDAQ binds to
this address and listens for TCP/IP connections from browsers on port 80. If the same
machine is being used for both server and client, and there is no Ethernet port, the IP
address should be set to 127.0.0.1 (localhost). Only one ipaddress element should be
present within the redaq element.
portspec: Sets the parameters of an isoLynx network port. For serial ports the name
attribute can be “COM1” through “COM8”, and for Ethernet ports the name attribute can
be “ETHERNET1” through “ETHERNET8”. For serial ports, specify the transmission
speed in the bps element to 1200, 2400, 4800, 9600, 19200, 38400, 57600, or 115200,
and the parity element to no, odd, or even. For Ethernet ports, specify the IP address of
the network port in the ipaddress element.
ReDAQ binds to this address for
communications with isoLynx systems. There should be one portspec element for each
isoLynx network.
point: Specifies a data point. The name attribute sets the data point name identifier. The
redaq element must contain one and one only point element.
Rev 1.004
61
User Guide
ReDAQ™
11.3.3 Elements within the point element
point: Specifies a data point. The name attribute sets the data point name identifier. The
point element may itself contain one or more point elements.
port: Links the data point to the corresponding portspec element. That is, the interface
port connecting to the isoLynx containing the data to which the point corresponds. If the
port element is absent, the point inherits the value from its parent.
ipaddress: Sets the IP address of the isoLynx containing the data to which the point
corresponds. If the ipaddress element is absent, the point inherits the value from its
parent. The ipaddress element is not required if the isoLynx is on a serial network.
id: Sets the device ID of the isoLynx containing the data to which the point corresponds.
If the id element is absent, the point inherits the value from its parent.
descriptor: Sets the descriptor of the data point. If the descriptor element is absent, the
point inherits the value from its parent.
units: Sets the units of the data point. If the units element is absent, the point inherits the
value from its parent.
panel: Sets the panel of the isoLynx containing the data to which the point corresponds.
Values of A0 through A3 refer to analog panels with A0 meaning the SLX200 itself.
Values of D0 through D7 refer to digital panels. The value of the panel element is not
inherited and must be specified within a point element accessing data from a module.
channel: Sets the channel containing the module to which the point corresponds. Valid
values are 0 through 15. The value of the channel element is not inherited and must be
specified within a point element accessing data from a module.
item: Sets the item type in the module or the isoLynx to which the data point refers. If
the data point corresponds to a module, valid values are current, minimum, maximum,
or average. If the data point refers to “device info”, valid values are manufacturer,
model, serial, or firmware. If the item element is absent, the value defaults to current.
module: Sets the model number of the module to which the data point refers. Valid
values are those model numbers as defined in isoLynx.xml.
history: Specifies that a data point should be historized. The history element, if present,
must contain interval and duration elements. If the history element is absent, the data
point is not historized.
alarms: Specifies that a data point should be alarmed. The alarms element, if present,
must contain at least one high or low element. If the alarms element is absent, the data
point is not alarmed.
Rev 1.004
62
ReDAQ™
User Guide
11.3.4 Elements within the history element
duration: Specifies the duration, in days, for which history is maintained.
interval: Specifies the interval, in seconds, at which the data point will be sampled and
the value stored in the history data set.
11.3.5 Elements within the alarms element
smtpserver: Specifies the URI of the ISP's SMTP server to which ReDAQ should
connect when sending an e-mail. Preferably, the hostname attribute should be present.
e.g. hostname='www.mycompany.com'. If it is omitted, the hello message in the e-mail
will specify “ReDAQ” as the host name. If authentication is required, the username and
password attributes should be present. When authenticating, ReDAQ will use CRAMMD5, PLAIN, and LOGIN methods in descending order of preference as supported by the
remote server.
from: Specifies the source e-mail address. If the from element is absent, “ReDAQ” will
be used as the source address.
to: Specifies a recipient e-mail address. The alarms element may contain zero, one, or
more to elements.
subject: Specifies the subject line of the e-mail.
ReDAQ will provide a default subject line.
If the subject element is absent,
high: Specifies a high-type alarm condition associated with the data point. (A high-type
alarm condition is set with an increasing value of the data point). A high element must
contain a name attribute and a limit element. It may, optionally, contain a deadband
element. The value of the name attribute may be any alphanumeric character sequence,
including the space character. The value of the name attribute is shown in HTML tables,
and ReDAQ graphics when the alarm condition is set. Zero, one, or more high elements
may be present.
low: Specifies a low-type alarm condition associated with the data point. (A low-type
alarm condition is set with a decreasing value of the data point). A low element must
contain a name attribute and a limit element. It may, optionally, contain a deadband
element. The value of the name attribute may be any alphanumeric character sequence,
including the space character. The value of the name attribute is shown in HTML tables,
and ReDAQ graphics when the alarm condition is set. Zero, one, or more low elements
may be present.
Rev 1.004
63
User Guide
ReDAQ™
normal: Specifies a normal-type alarm condition. (A normal-type alarm condition is set
by default if no high-type or low-type alarm conditions are set). The name attribute must
be present. The value of the name attribute may be any alphanumeric character
sequence, including the space character. The value of the name attribute is shown in
HTML tables, and ReDAQ graphics when the alarm condition is set. Zero or one normal
elements may be present. If a normal element is not present, HTML tables and ReDAQ
graphics will show “OK” when no high-type or low-type alarm conditions are set.
11.3.6 Elements within the high and low elements
limit: Sets the value at which the alarm condition will be set.
deadband: Sets the dead-band value for this alarm condition. For high-type alarms, the
alarm condition will not become reset until the value reduces to the limit minus the deadband. For low-type alarms, the alarm will not become reset until the value increases to
the limit plus the dead-band.
smtpserver: Specifies the URI of the ISP's SMTP server to which ReDAQ should
connect when sending an e-mail associated with this alarm condition. This element
overrides any smtpserver element present in the alarms element. Preferably, the
hostname attribute should be present. e.g. hostname='www.mycompany.com'. If it is
omitted, the hello message in the e-mail will specify “ReDAQ” as the host name. If
authentication is required, the username and password attributes should be present.
When authenticating, ReDAQ will use CRAM-MD5, PLAIN, and LOGIN methods in
descending order of preference as supported by the remote server.
from: Specifies the source e-mail address. This element overrides any from element
present in the alarms element. If the from element is absent from both this element and
the alarms element, “ReDAQ” will be used as the source address.
to: Specifies a recipient e-mail address. The alarms element may contain zero, one, or
more to elements. The list of recipients to which the email will be sent is the combination
of those provided in the alarms element with those provided in this element.
subject: Specifies the subject line of the e-mail. This element overrides any subject
element present in the alarms element. If the subject element is absent from both this
element and the alarms element, ReDAQ will provide a default subject line.
Rev 1.004
64
User Guide
ReDAQ™
<?xml version="1.0" encoding="us-ascii" ?>
<redaq>
<timezone>-7</timezone>
<ipaddress>192.168.1.1</ipaddress>
<unlock>abcde-abcde-abcde-abcde-abcde-abcde-abcde-abcde </unlock>
<authentication name="demo">
<password>demo</password>
</authentication>
<portspec name="ETHERNET1">
<ipaddress>192.168.0.1</ipaddress>
</portspec>
<point name="DEMO">
<port>ETHERNET1</port>
<ipaddress>192.168.0.215</ipaddress>
<id>31</id>
<point name="ANALOGS">
<descriptor>Analog Panel</descriptor>
<point name="POTENTIOMETER">
<descriptor>Potentiometer</descriptor>
<units>ohms</units>
<panel>A0</panel>
<channel>1</channel>
<item>current</item>
<module>SCM5B36-03</module>
<history>
<interval>60</interval>
<duration>90</duration>
</history>
</point>
<point name="TEMP">
<descriptor>Temperature</descriptor>
<units>°C</units>
<panel>A0</panel>
<channel>2</channel>
<item>current</item>
<module>SCM5B47J-03</module>
<history>
<interval>60</interval>
<duration>90</duration>
</history>
</point>
</point>
</point>
</redaq>
Figure 19 - Example of simple "config.xml" file
Rev 1.004
65
User Guide
<point name="TEMPERATURE">
<descriptor>Ambient temperature</descriptor>
<units>°C</units>
<panel>A0</panel>
<channel>1</channel>
<item>current</item>
<module>SCM5B47J-03</module>
<alarms>
<high name="hot">
<limit>25.0</limit>
<deadband>0.2</deadband>
</high>
<high name="warm">
<limit>24.5</limit>
<deadband>0.2</deadband>
</high>
<low name="cool">
<limit>20.5</limit>
<deadband>0.2</deadband>
</low>
<low name="cold">
<limit>20.0</limit>
<deadband>0.2</deadband>
</low>
</point>
Figure 20 - Example of alarm elements
Rev 1.004
66
ReDAQ™
User Guide
<point name="TEMPERATURE">
<descriptor>Ambient temperature</descriptor>
<units>°C</units>
<panel>A0</panel>
<channel>1</channel>
<item>current</item>
<module>SCM5B47J-03</module>
<history>
<interval>60</interval>
<duration>90</duration>
</history>
</point>
Figure 21 - Example of history elements
Rev 1.004
67
ReDAQ™
User Guide
Appendix - Demonstration data points
The data points defined for the two demonstration web-sites are as follows:.
DEMO
DEMO.ANALOGS
DEMO.ANALOGS.FIRMWARE
DEMO.ANALOGS.MANUFACTURER
DEMO.ANALOGS.MODEL
DEMO.ANALOGS.POTENTIOMETER
DEMO.ANALOGS.POTENTIOMETER.AVERAGE
DEMO.ANALOGS.POTENTIOMETER.MAX
DEMO.ANALOGS.POTENTIOMETER.MIN
DEMO.ANALOGS.SERIAL
DEMO.ANALOGS.TEMP
DEMO.ANALOGS.TEMP.AVERAGE
DEMO.ANALOGS.TEMP.MAX
DEMO.ANALOGS.TEMP.MIN
DEMO.ANALOGS.VOLTAGE
DEMO.ANALOGS.VOLTAGE.AVERAGE
DEMO.ANALOGS.VOLTAGE.MAX
DEMO.ANALOGS.VOLTAGE.MIN
DEMO.DIGITALS
DEMO.DIGITALS.DO1
DEMO.DIGITALS.FIRMWARE
DEMO.DIGITALS.MANUFACTURER
DEMO.DIGITALS.MODEL
DEMO.DIGITALS.SERIAL
DEMO.DIGITALS.SWITCH1
DEMO.SIM
DEMO.SIM.COLUMN1
DEMO.SIM.COLUMN1.FLOW
DEMO.SIM.COLUMN1.LEVEL
DEMO.SIM.COLUMN1.PRESSURE
DEMO.SIM.COLUMN1.PUMP
DEMO.SIM.COLUMN1.TEMP
DEMO.SIM.COLUMN1.VESSEL
DEMO.SIM.COLUMN2
DEMO.SIM.COLUMN2.FLOW
DEMO.SIM.COLUMN2.LEVEL
DEMO.SIM.COLUMN2.PRESSURE
DEMO.SIM.COLUMN2.PUMP
DEMO.SIM.COLUMN2.TEMP
DEMO.SIM.COLUMN2.VESSEL
DEMO.SIM.COLUMN3
DEMO.SIM.COLUMN3.FLOW
Rev 1.004
68
ReDAQ™
User Guide
DEMO.SIM.COLUMN3.LEVEL
DEMO.SIM.COLUMN3.PRESSURE
DEMO.SIM.COLUMN3.PUMP
DEMO.SIM.COLUMN3.TEMP
DEMO.SIM.COLUMN3.VESSEL
DEMO.SIM.COLUMN4
DEMO.SIM.COLUMN4.FLOW
DEMO.SIM.COLUMN4.LEVEL
DEMO.SIM.COLUMN4.PRESSURE
DEMO.SIM.COLUMN4.PUMP
DEMO.SIM.COLUMN4.TEMP
DEMO.SIM.COLUMN4.VESSEL
DEMO.SIM.VALVE1
DEMO.SIM.VALVE2
Rev 1.004
69
ReDAQ™
User Guide
Dataforth Corporation
3331 E Hemisphere Loop
Tucson 85706
Arizona
USA
Telephone:
Web:
Rev 1.004
520 741 1404
http://www.dataforth.com
70
ReDAQ™