1
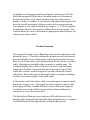
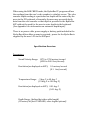
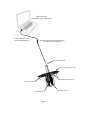
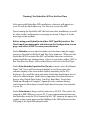
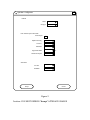
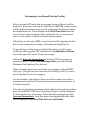
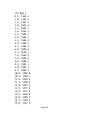
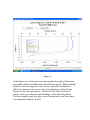
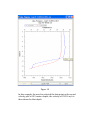
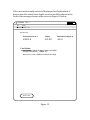
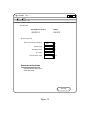
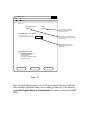
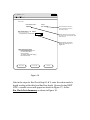
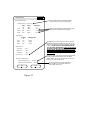
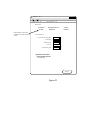
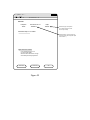
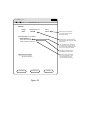
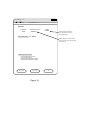
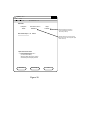
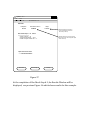
TM USER’S MANUAL ENGLISH EDITION October 2012 UNABARA C O R P O R A T I O N P.O. Box 1843, Gretna, Louisiana 70054 USA (504) 324-1803 Email: [email protected] www.hydrobar.info © 2012 Unabara Corporation; All Rights Reserved US & Foreign Patents Pending Introduction The total error in depth measurements during hydrographic surveys is mainly the result of variations in sound velocity in the water column, errors in transducer draft, tide values, and index errors. Using the HydroBar, the hydrographer can quantify and correct for these errors. Depths shown on many of the world’s hydrographic charts have been “normalized” to reflect a sound velocity of 1500 meters per second. However, this “normal” condition for sound velocity only occurs with a 0 degree Celsius water temperature, 35 parts per thousand salinity and 760 mmHg pressure. In the true, dynamic world, surface sound velocity as well as velocities at various depths will vary widely. Any variation in bulk properties (i.e. elasticity and density) of the water will result in a shift in sound velocity in that medium. From freshwater lakes and rivers, to the oceans, to hypersaline estuaries, sound velocities range from about 1375 meters per second to almost 1900 meters per second. An increase in salinity results in an increase in water density. At the same time this increase in salinity decreases the compressibility of seawater. The effect of this compression overtakes the effect of the increased density and thus we find sound velocity increases with increasing salinity. For each one part-‐per-‐thousand increase in salinity, sound velocity will increase about 1.3 m/s. Increasing temperature decreases water density thus resulting in an increase in sound velocity. For each one degree Celsius temperature increase, sound velocity will increase about 4.5 m/s. Pressure (depth) has a much smaller effect on sound velocity than salinity and temperature and is thus not a major factor in shallow water surveys. For each meter of increasing depth, sound velocity will increase only about 0.017 m/s. The HydroBar contains a real-‐time sound velocimeter and temperature sensor which is depth referenced during cast profiles via an internal pressure sensor. In CAST mode, the user can generate a complete sound velocity and temperature profile vs. depth, at user selected depth intervals. The HydroBar software APP can run standalone on your Windows PC or in the background of Hypack, HydroPro or other hydrographic mapping software; profile data points can be put directly into tabular form and used by your mapping software to correct for sound velocity. Draft errors, of course, occur when the user does not properly measure or calculate the depth of the transducer face upwards to the water surface. Index errors refer the sum of inaccuracies due to electronic and mechanical components of the survey echo sounder, transducer characteristics and bottom reflectivity during a specific survey. The velocimeter can only help the user compensate for sound velocity variations, not draft or index errors. Therefore, in combination with velocity casts, a bar check must periodically be performed. The bar check calibration procedure is a sequential process accomplished in the past by trial and error so that the sound velocity, draft and index errors are simultaneously minimized. Using a smart, patent pending, algorithm, the software computes the three (3) bar depths and positions a user selectable gate window width around each bar to prevent unwanted echoes from entering the calibration at that bar depth. The HydroBar has a 35.5 cm (14.0 inch) sonar target which can replace the less portable metal bar; or, the HydroBar can be attached to the user’s existing bar if desired. The tether cable from the surface to the HydroBar target is precisely marked with depth in either metric or english units as ordered by the user. The BAR CHECK mode of the HydroBar eliminates the time-‐consuming trial and error method; While logging velocity from the integral velocimeter, the user’s echo sounder together with the sonar target (“bar”) of the HydroBar is used to calculate sound velocity, draft and index; this is accomplished rapidly by solving a series of simultaneous equations using a three range solution of sonar transit times with common baselines. These calculations are automatic using the HydroBar program APP running on the user’s PC. In addition to storing cast profiles and tabular results in your PC, the HydroBar program APP provides a detailed analysis of velocimeter measured velocity vs. bar check calculated velocity at the various depths; Finally, a “residual” is calculated and displayed which gives the user the overall uncertainty of the procedure he has just performed. For example, a very small residual in the range of +/-‐ 1.00 cm would be an indication the user has properly calibrated his survey system. This residual allows the user to determine an appropriate index value to use in his survey echo sounder. Product Overview The major deliverable of your HydroBar system is the underwater unit shown in Figure 1. This unit contains the precision sound velocimeter, pressure (depth) sensor, temperature sensor and internal electronics. Data is sent to the surface via a depth marked, Kevlar reinforced, tether cable. Markings are available either in metric or english units. The standard length tether cable is 20 meters (66 feet); optional longer lengths are available. Integral to this unit is the sonar target (“bar”) which has a surface texture designed to provide enhanced acoustic reflectivity. Below the target is an integral cable reel (patent pending) to allow convenient storage of the tether cable. At the surface end of the tether cable is a weatherproof connector with protective storage cover. This connector mates with an adapter cable which plugs into any available USB port on your Windows computer. A stainless steel strain relief loop is provided at the weatherproof connector to secure the surface end. The HydroBar’s Windows-‐based software APP with drivers for the adapter cable along with this HydroBar Operation Manual are contained on a USB-‐Memory Pod supplied with each HydroBar system. When using the BAR CHECK mode, the HydroBar PC program will use the readings from the user’s echo sounder to calculate errors. The echo sounder depth reading at a particular bar depth will be entered by the user via the PC keyboard; alternately, the user may use serial depth data from the echo sounder so that depth is provided to the HydroBar APP without the need for the user to enter depth via the keyboard. (See Appendix A for information on automatic depth input). There is no power cable, power supply or battery pack included in the HydroBar deliverables as none is required; power for the HydroBar is supplied by the user’s PC via the USB port. Specification Overview Parameters: Sound Velocity Range: 1375 to 1700 meters/second (4538 to 5610 feet/second) Resolution (as displayed on APP): 0.1 meters/second (0.1 feet/second) Temperature Range: -‐ 5 deg. C to 40 deg. C (23 deg. F to 104 deg. F) Resolution (as displayed on APP): 0.01 deg. C (0.01 deg. F) Depth Range: (defined by tether cable length) (20 meters/ 66 feet STANDARD; other lengths optional) Resolution (as displayed on APP): 0.1 meters ( 1 foot) Depth Measurement Note: Although the HydroBar has an integral pressure sensor for determining the HydroBar’s depth during the CAST, this sensor is not used during the Bar Check Mode; when performing bar checks, the depth of the target needs to be known with millimeter certainty. The tether cable is of “no stretch” design and has a Kevlar jacket for extreme durability. This cable is precisely marked to insure accuracy when performing a bar check. Cable Note: Specify English or Metric markings on tether cable for Bar Check when ordering. Windows-Based PC (with HydroBar software APP installed) 2 meter USB Adapter Cable (Part No. USB-RS485-WE) Waterproof Quick-Disconnect Plug/Receptacle (with Safety Strap for Tether Cable) 20 meter Tether Cable 35.5 cm (14 inch) Sonar Target Depth (below surface) Sensor Integral Cable Reel Temperature Sensor Sound Velocimeter Figure 1 Installing the HydroBar PC APP Software Your HydroBar is supplied with a USB-‐Memory Pod which contains required software and this user manual (in PDF format). The HydroBar APP may be loaded onto your Windows PC directly from this memory Pod. This pod also has a minimum of 4GB of unused storage as to allow the user to save velocity casts and bar check data thereon. This is only one storage option available as the user may elect to store HydroBar generated data on his PC’s hard-‐drive or other media. Upgrade to the most recent version of the HydroBar PC APP is available for downloading under the SUPPORT tab at: www.hydrobar.info After inserting the memory pod into your PC’s USB port, simply select the HydroBar APP file. This will initiate the HydroBar Setup installer. You will be instructed through a six screen page APP installation process. Simply follow the on-‐screen directions. The second screen page will allow you to review the SOFTWARE LICENSE AGREEMENT. Before proceeding you must select the “box” indicating you accept the terms of the License Agreement; then select NEXT. (If you do not want to accept these terms, select CANCEL to exit the APP installation). The third screen page denotes a default destination folder the installer has automatically selected for the HydroBar APP. Should you wish to change this destination folder for any reason, select CHANGE; otherwise enter NEXT to continue. The fifth screen page allows you to monitor the installation process then the sixth screen page will confirm when the installation process is complete. The memory pod also contains a driver file to allow your echo sounder’s serial depth data to be automatically fed to the HydroBar APP; without the need for the user to enter depth via the PC keyboard. Your HydroBar is provided with a RS-‐232 serial interface cable (from echo sounder to PC). Details for using this automatic depth entry function are provided in Appendix A to this manual. “Running” the HydroBar APP for the First Time After successful HydroBar APP installation, a shortcut will appear on your PC with the HydroBar icon. Use this icon to start the APP. Upon running the HydroBar APP the first time after installation, you will be taken to the Configuration screen page as shown in Figure 2 on the next page of this manual. Before using your HydroBar in either CAST (profile) mode or Bar Check mode you must make selections on the Configuration screen page and select ACCEPT to save your selections. Under Defaults you are asked to make two selections using the toggle arrows to the right of the Mode and Unit Type windows. Whenever the HydroBar APP is restarted the APP will assume these two selections unless/until the user changes them. Select, as you desire, either CAST or Bar Check for the Mode; select either Meters or Feet for the Unit Type. Under Echo Sounder Input for Bar Check you must select the Manual Input “box” if you will be entering depths (as read from your echo sounder display at the various bar depths) manually via the PC’s keyboard. If you will be using automatic serial data depth input, do not select the Manual Input; then refer to Appendix A for instructions on how to select Depth Data String, Com Port, Baud Rate, Target Gate Width and Number of Samples; Appendix A also contains wiring connections to allow input of serial depth data from your echo sounder to your PC. Under Velocimeter, always select baud rate as 19,200. Then select the respective USB COM port on your PC. Proper communication between the HydroBar and your PC is denoted by the “OK” status in the upper left corner on the screen pages and by blinking of the LED indicators on the USB plug of the HydroBar adapter cable. HydroBar Configuration X Defaults Mode Unit Type Cast Meters Echo Sounder Input for Bar Check Manual Input X X Depth Data String Com Port Baud Rate Target Gate Width m Number of Samples Velocimeter Com Port BaudRate Accept 19200 Cancel Figure 2 Caution: YOU MUST DEPRESS “Accept” AFTER ANY CHANGE The user may return to the Configuration screen from any of the CAST or Bar Check screen pages via the pull-‐down menu under File located at the top left of the screen; see Figure 3. Also, the user may change from CAST to Bar Check mode or vice-‐versa by the pull –down menu under Mode. HydroBar File Click here to open HydroBar Configuration screen Ver. -.-.- X Mode File Mode Configuration Cast Open Bar Check Data Bar Check Open Cast Data Exit Figure 3 Performing a Cast (Sound Velocity Profile) After selecting CAST mode, the screen page shown in Figure 4 will be displayed. If you have selected the Unit Type as METERS, sound velocity will be displayed in meters per second, temperature in degrees Celsius, and depth in meters. These displays under Real Time Data allow the user to observe the measured values during the cast; or at any other time the user wishes to obtain real-‐time measurements. If Unit Type is selected as FEET, sound velocity will be displayed in feet per second, temperature in degrees Farenheit, and depth in feet. Proper delivery of data from your HydroBar unit to your PC can be verified by observing the “OK” indication on the HydroBar SV Status line in the upper left corner of any screen page. Follow the Operator Instructions on the first CAST screen page as shown in Figure 4. Under Cast Mode Input Data, enter the desired Maximum Cast Depth and Log Interval. (Note: Examples herein and on all other screen pages use the METERS Unit Type; if English units are selected as the Unit Type, FEET, of course, will be displayed on all screen pages). For this example, input data on Figure 4 has been entered to reflect a maximum cast depth of 15.0 meters with parameter measurements at 0.5 meter intervals. After entering the above maximum depth and interval as denoted above and selecting NEXT STEP, the screen page in Figure 5 will be displayed. As with the previous screen page, follow the instructions given under Operator Instructions. Once you begin lowering the HydroBar, data will be displayed under Real Time Data and Cast Status. HydroBar File Ver. -.-.- X Mode HydroBar SV Status OK Real Time Data Velocimeter SV m/s Temp C Velocimeter Depth m ####.# ##.## ##.# Cast Mode Input Data Max Cast Depth 15.0 m .5 m Log Interval Operator Instructions Enter maximum depth of cast and enter desired log interval then select Next Step Next Step Figure 4 HydroBar File Ver. -.-.- X Mode HydroBar SV Status OK Real Time Data Velocimeter SV m/s Temp C Velocimeter Depth m ####.# ##.## ##.# Cast Status HydroBar Depth = #.# m Operator Instructions Place HydroBar target at water surface for about one minute to allow sensor stabilization then begin lowering HydroBar to maximum cast depth Cancel Figure 5 Once the HydroBar reaches the selected Maximum Cast Depth, a graphical presentation of sound velocity and temperature vs. depth will be displayed as shown in Figure 6. This profile can be saved aboard the USB memory pod or other storage location in the user’s PC. At the same time all of the data is also saved in tabular form. The data is saved in two file formats for each cast profile; one file is simple CSV (comma separated values) while the other is saved as a sound velocity correction file in the .VEL format. Files in .VEL format can be directly loaded into the SINGLE BEAM EDITOR in the HYPACK hydrographic mapping software. HYPACK is a registered trademark of Hypack, Inc. (formerly Coastal Oceanographics, Inc.) Figure 7 is a table of data points which generated the profile shown in Figure 6. You may view this table by selecting DISPLAY TABLE on the graph screen. Figure 8 shows the .VEL file generated from the same profile as above. Before the cast is begun, the user will select where on his PC he wishes to save this file for then importing into HYPACK. Figure 9 demonstrates how the user can apply standard Windows controls to adjust the graph to full screen and use interactive functions as explained under this figure. Figure 6 Figure 7 Figure 8 Figure 9 In this figure we see how the user can expand the graph to full-‐screen and enable utilities available in the HydroBar program. “Right-‐clicking” with the cursor on any part of the screen, causes the utility menu (block) to appear on the screen. Use of such features as Print, Page Setup, etc. are self-‐explanatory. The Show Point Values feature is always active even without right-‐clicking to show the utility block. The user simply brings his cursor over a data point to view the values; see examples in Figures 10 & 11. Figure 10 In this example, the user has selected the data point on the sound velocity plot at 10.5 meters depth; the velocity of 1502.4 m/s is then shown for that depth. Figure 11 Here the user selects the data point on the temperature plot at 13.0 meters to view the temperature as 23.4 degrees C. If the user inadvertently entered a Maximum Cast Depth which is deeper than the actual water depth, an error would be shown in the form of the message shown on the screen in Figure 12 below. HydroBar File Ver. -.-.- X Mode HydroBar SV Status OK Real Time Data Velocimeter SV m/s Temp C Velocimeter Depth m ####.# ##.## ##.# Cast Status Cast Complete, FAILED TO REACH MAX CAST DEPTH Average Sound Velocity ####.# m/s Reset to Start, enter a shallower maximum cast depth Reset to Start Figure 12 Overview of Bar Check Mode To perform a Bar Check, the HydroBar is lowered precisely to three user selected depths using the depth markings on the tether cable. At each bar depth the user reads the displayed bar depth from his echo sounder and enters that depth into the HydroBar APP via the keypad on his PC. There are acually two methods by which echo sounder bar depths can be inputted into the HydroBar APP; 1) MANUAL INPUT as described above; and, 2) AUTO DEPTH ENTRY which uses bar depth obtained from the user’s echo sounder via serial data (RS-‐232) depth sentence. Setup of your PC and echo sounder for AUTO DEPTH ENTRY, as well as step by step instructions for performing a Bar Check in AUTO DEPTH ENTRY, is detailed in Appendix A to this manual. At the end of the Bar Check procedure, the user will be presented with the average sound velocity determined via the Bar Check, average sound velocity (from the three bar depths) as determined by the HydroBar’s precision sound velocimeter, transducer draft, and “Residual” sometimes referred to as “Index”. Performing a Bar Check (with Manual Input of Depth) It is assumed the user has selected “Manual Input” (check the box on Configuration Screen Page) of depth data as shown in Figure 2. For this example, we have selected the values for Transducer Draft, First Bar Depth, and Bar depth Spacing as shown on Figure 13. The Echo Sounder Sound Velocity used is whatever velocity (in this case 1500 m/s) your echo sounder is presently set to. After completing the entries and selecting NEXT STEP on the first screen of the Bar Check mode, follow the Operator Instructions on the screen Page shown on Figure 14 for Bar Check Step # 1. HydroBar File Ver. -.-.- X Mode HydroBar SV Status OK Real Time Data Velocimeter SV m/s Temp C ####.# ##.## Bar Check Input Data Measured Transducer Draft Offset 0.00 m First Bar Depth 5.00 m Bar Depth Spacing 5.00 m No. of Bars ES Sound Velocity Used 3 1500.0 m/s Operator Instructions Enter parameters above then select Next Step Next Step Figure 13 HydroBar File Ver. -.-.- X Mode HydroBar SV Status OK Real Time Data Velocimeter SV m/s Temp C 1474.0 ##.## Real-Time display of temperature at 5.0 meter depth (not used for Bar Check procedure) Bar Check Step # 1 at 5.0 m Bar Depth Shown on Echosounder 4.58 m Real-Time display of sound velocity from velocimeter at 5.0 meter depth (bar depth of Bar Check # 1) Depth read from echo sounder display and entered by user on keypad of PC Operator Instructions Lower HydroBar target to 5.0 m (as read on tether cable) Input target depth (as read from echosounder display) Then select Next Step Reset to Start Previous Step Next Step Figure 14 The HydroBar (target) is placed directly below the echo sounder’s transducer at a depth (as measured on the tether cable) of 5.0 meters from the water surface. The user then reads the depth from the echo sounder’s display (4.58 meters). After entering 4.58 meters in the Bar Depth Shown on Echosounder box, the user selects NEXT STEP. HydroBar File Ver. -.-.- X Mode HydroBar SV Status OK Real Time Data Velocimeter SV m/s Temp C 1475.0 ##.## Real-Time display of temperature at 10.0 meter depth (not used for Bar Check procedure) Bar Check Step # 2 at 10.0 m Bar Depth Shown on Echosounder 9.66 m Real-Time display of sound velocity from velocimeter at 10.0 meter depth (bar depth of Bar Check # 2) Depth read from echo sounder display and entered by user on keypad of PC Operator Instructions Lower HydroBar target to 10.0 m (as read on tether cable) Input target depth (as read from echosounder display) Then select Next Step Reset to Start Previous Step Next Step Figure 15 Once the HydroBar (target) is at a 10.0 meter depth, the user reads the echo sounder depth and enters that reading (in this case, 9.66 meters) in the Bar Depth Shown on Echosounder box above; then select NEXT STEP. HydroBar File Ver. -.-.- X Mode HydroBar SV Status OK Real Time Data Velocimeter SV m/s Temp C 1476.0 ##.## Real-Time display of temperature at 15.0 meter depth (not used for Bar Check procedure) Bar Check Step # 3 at 15.0 m Bar Depth Shown on Echosounder 14.74 m Real-Time display of sound velocity from velocimeter at 15.0 meter depth (bar depth of Bar Check # 3) Depth read from echo sounder display and entered by user on keypad of PC Operator Instructions Lower HydroBar target to 15.0 m (as read on tether cable) Input target depth (as read from echosounder display) Then select Next Step Reset to Start Previous Step Next Step Figure 16 Like in the steps for Bar Check Step # 1 & 2, enter the echosounder’s depth reading at the third and final bar depth. Upon selecting NEXT STEP, a results screen will appear as shown in Figure 17; then a Bar Check Data Summary as shown in Figure 18. Result Window X Average of Sound Velocity at all three Bar Depths (as measured by precision sound velocimeter) Real Time Derived Data HydroBar Velocity Depth m 1475.0 m/s Avg SV m/s Echo Sounder m 1st Bar 5.00 1474.00 4.58 2nd Bar 10.00 1475.00 9.66 3rd Bar 15.00 1476.00 14.74 Depth at each bar depth (as read from echo sounder display by user and entered into PC keypad) Calculated Data Bar Depth m 2 Way Travel Time s 1st Bar 4.50 .006101 2nd Bar 9.50 .012880 3rd Bar 14.50 . 019659 Average Bar Error is the sum of error in the user entered Measured Transducer Draft Offset (see Figure 13) plus any otherwise unexplained error denoted “Residual”; sometimes “Index”. You will recall, at the start of this Bar Check, the user enter 0.00 as the Draft Offset, however for this example the transducer had been placed at exactly 0.5 meters below the water surface. This means the Average Bar Error consists of 0.500 m of error due to transducer position plus 0.005 m of Residual error. Calibration Error 1st Bar Error - .500 m 2nd Bar Error - .505 m 3rd Bar Error - .509 m Average Bar Error - .505 m Both the averages of the precision velocimeter measurements and the average of the data from the three bar depths confirms 1475.0 is the correct sound velocity for your echo sounder to use for this specific survey New Echo Sounder Settings Set Echo Sounder Velocity To: 1475.0 m/s Add to Echo Sounder Draft Offset: Save By entering 0.505, the user has calibrated his echo sounder to correct for both draft errors and residual (index) errors. .505 m Close Figure 17 HydroBar File Ver. -.-.- X Mode HydroBar SV Status OK Bar Check Data Summary Successful Enter Sound Velocity = 1475.0 m/s into Echo Sounder Add 0.505 m to Echo Sounder Draft Offset Reset to Start Figure 18 Appendix A AUTO DEPTH ENTRY to HydroBar (allows use of your echo sounder serial depth output to automatically enter measured bar depths in Bar Check Mode) Auto Depth Setup Your HydroBar deliverables include a Part Number UC232R-‐10 RS-‐232 to USB Adaptor cable. This cable allows you to input serial depth data directly from the RS-‐232 output of your echo sounder (Unabara Hydro-‐ Book or other hydrographic echo sounder) into your Windows PC via a USB port. Once this is accomplished, the HydroBar PC APP can use this depth data at each bar check depth; in short, there will be no need for the user to visually read the depth from the echo sounder’s display and then enter that depth via the PC keypad at each bar depth. The adaptor cable has a USB A plug on the PC end and a D-‐SUB 9 Pin male connector on the echo sounder end. Figure 19 shows the D-‐SUB end; typical connection to echo sounders use Pins 2, 3 & 5. You will recall when setting up the Configuration screen page (Figure 2), for manual input of depth when performing bar checks, the Manual Input “box” was selected (checked). When using AUTO DEPTH ENTRY, de-‐select this “box”. Upon de-‐selecting, the five windows below the Echo Sounder Input for Bar Check heading will become active. First select the serial data string to match what your echo sounder outputs. Then select the applicable Com Port and baud rate, typically 9600 baud. Using the Target Gate Width, the user selects the “window”, above and below the HydroBar’s target, outside of which he wants echo returns ignored. Lastly, he selects the number of samples (returned echoes) which he wants averaged to determine the bar depth(s). Figure 20 shows the setup of the Configuration screen page for the AUTO DEPTH ENTRY Bar Check example to follow herein. Figure 19 HydroBar Configuration X Defaults Mode Unit Type Cast Meters Echo Sounder Input for Bar Check Manual Input Depth Data String X DESO-25 Com Port Baud Rate 9600 Target Gate Width Number of Samples 0.5 m 20 Velocimeter Com Port BaudRate 19200 Accept Figure 20 Cancel Performing a Bar Check (with Auto Depth Entry) Figure 13, earlier in this manual, showed the setup parameters for our example of a Bar Check performed with manual input of depth. Figure 21 on the next page is the initial page for the bar check in auto depth mode; it uses the same setup parameters as did the manual input of depth example. Figures 22 thru 27 take you through the three bar depth steps while demonstrating how the auto depth entry functions. Otherwise, the procedures for both manual depth entry and auto depth entry are the same; and the results are the same. See Figures 17 & 18 to review how bar check results is presented. HydroBar File Ver. -.-.- X Mode HydroBar SV Status OK Echo Sounder Status: OK Real Time Data ES Depth m #.## Real-Time display of Depth of bar as derived from serial input from echo sounder Velocimeter SV m/s Temp C ####.# ##.## Bar Check Input Data Measured Transducer Draft Offset 0.00 m First Bar Depth 5.00 m Bar Depth Spacing 5.00 m No. of Bars ES Sound Velocity Used 3 1500.0 m/s Operator Instructions Enter parameters above then select Next Step Next Step Figure 21 HydroBar File Ver. -.-.- X Mode HydroBar SV Status OK Echo Sounder Status: OK Real Time Data ES Depth m #.## Velocimeter SV m/s ####.# Temp C ##.## Real-Time display of temperature at 5.0 meter depth (not used for Bar Check procedure) Bar Check Step # 1 at 5.0 m Real-Time display of sound velocity from velocimeter at 5.0 meter depth (bar depth of Bar Check # 1) Operator Instructions Lower HydroBar target to 5.0 m (as read on tether cable) Select Start below then wait for average measured depth to be displayed above Reset to Start Previous Step Figure 22 Start HydroBar File Ver. -.-.- X Mode HydroBar SV Status OK Echo Sounder Status: OK Real Time Data ES Depth 4.58 Velocimeter SV m/s 1474.0 Temp C ##.## Real-Time display of temperature at 5.0 meter depth (not used for Bar Check procedure) Bar Check Step # 1 at 5.0 m Samples Collected = 20 Average Measured Depth = 4.58 Number of Samples Outside Gate = 0 Real-Time display of sound velocity from velocimeter at 5.0 meter depth (bar depth of Bar Check # 1) This count will begin at 0 and advance to the number of echo samples the user has selected on the Configuration Screen; in this case, 20 samples was selected. Average of the 20 depth readings collected from the echo sounder. Operator Instructions Number of echoes which resulted from a return other than a return from the HydroBar target, thus the gate rejected these readings. Wait for Data Collection Reset to Start Previous Step Figure 23 Next Step HydroBar File Ver. -.-.- X Mode HydroBar SV Status OK Echo Sounder Status: OK Real Time Data ES Depth m #.## Velocimeter SV m/s ####.# Temp C ##.## Real-Time display of temperature at 10.0 meter depth (not used for Bar Check procedure) Bar Check Step # 2 at 10.0 m Real-Time display of sound velocity from velocimeter at 10.0 meter depth (bar depth of Bar Check # 2) Operator Instructions Lower HydroBar target to 10.0 m (as read on tether cable) Select Start below then wait for average measured depth to be displayed above Reset to Start Previous Step Figure 24 Start HydroBar File Ver. -.-.- X Mode HydroBar SV Status OK Echo Sounder Status: OK Real Time Data ES Depth m 9.66 Velocimeter SV m/s 1475.0 Temp C ##.## Real-Time display of temperature at 10.0 meter depth (not used for Bar Check procedure) Bar Check Step # 2 at 10.0 m Samples Collected = 20 Average Measured Depth = 9.66 Number of Samples Outside Gate = 0 Real-Time display of sound velocity from velocimeter at 10.0 meter depth (bar depth of Bar Check # 2) Operator Instructions Wait for Data Collection Reset to Start Previous Step Figure 25 Next Step HydroBar File Ver. -.-.- X Mode HydroBar SV Status OK Echo Sounder Status: OK Real Time Data ES Depth m #.## Velocimeter SV m/s ####.# Temp C ##.## Real-Time display of temperature at 15.0 meter depth (not used for Bar Check procedure) Bar Check Step # 3 at 15.0 m Real-Time display of sound velocity from velocimeter at 15.0 meter depth (bar depth of Bar Check # 3) Operator Instructions Lower HydroBar target to 15.0 m (as read on tether cable) Select Start below then wait for average measured depth to be displayed above Reset to Start Previous Step Figure 26 Start HydroBar File Ver. -.-.- X Mode HydroBar SV Status OK Echo Sounder Status: OK Real Time Data ES Depth m 14.74 Velocimeter SV m/s 1476.0 Temp C ##.## Real-Time display of temperature at 15.0 meter depth (not used for Bar Check procedure) Bar Check Step # 3 at 15.0 m Samples Collected = 20 Average Measured Depth = 14.74 Number of Samples Outside Gate = 0 Real-Time display of sound velocity from velocimeter at 15.0 meter depth (bar depth of Bar Check # 3) Operator Instructions Wait for Data Collection Reset to Start Previous Step Next Step Figure 27 At the completion of Bar Check Step # 3, the Results Window will be displayed; see previous Figure 16 which shows results for this example.