1
User’s Manual
Fast — Easy — Reliable
Microsoft, Windows, Windows NT, Windows 2000, Windows XP, Visual Basic, Microsoft
.NET, Visual C++, Visual C#, and ActiveX are either trademarks or registered trademarks of
Microsoft Corporation.
All other nationally and internationally recognized trademarks and tradenames are hereby recognized.
c 2005-2008
Copyright Edition 1
Edition 2
by MVTec Software GmbH, München, Germany
February 2006
May 2008
MVTec Software GmbH
(ActivVisionTools 3.1)
(ActivVisionTools 3.2)
All rights reserved. No part of this publication may be reproduced, stored in a retrieval system,
or transmitted in any form or by any means, electronic, mechanical, photocopying, recording,
or otherwise, without prior written permission of the publisher.
More information about ActivVisionTools can be found at:
http://www.activ-vision-tools.com
How to Read This Manual
This manual explains how to use ActivDataCode to read 2D data codes. It describes the functionality of ActivDataCode and its cooperation with other ActivVisionTools with Visual Basic
examples. Before reading this manual, we recommend to read the manual Getting Started with
ActivVisionTools, which introduces the basic concepts of ActivVisionTools and the User’s Manual for ActivView to learn how to load and display images.
To follow the examples actively, first install and configure ActivVisionTools as described in
the manual Getting Started with ActivVisionTools. For each example in this manual, there is
a corresponding Visual Basic project; these projects can be found in the subdirectory examples\manuals\activdatacode of the ActivVisionTools base directory you selected during
the installation (default: C:\Program Files\MVTec\ActivVisionTools ). Of course, you
can also create your own Visual Basic projects from scratch.
We recommend to create a private copy of the example projects because by experimenting
with the projects, you also change their state, which is then automatically stored in the so-called
description files (extension .dsc) by ActivVisionTools. Of course, you can restore the state of
a project by retrieving the corresponding description file from the CD.
!
Contents
1
About ActivDataCode
1
1.1
Introducing ActivDataCode . . . . . . . . . . . . . . . . . . . . . . . . . . . .
2
1.2
The Sub-Tools of ActivDataCode . . . . . . . . . . . . . . . . . . . . . . . . .
5
2 Using ActivDataCode
7
2.1
Specifying Regions of Interest . . . . . . . . . . . . . . . . . . . . . . . . . .
8
2.2
Reading Data Codes . . . . . . . . . . . . . . . . . . . . . . . . . . . . . . .
10
2.3
Teaching Data Codes . . . . . . . . . . . . . . . . . . . . . . . . . . . . . . .
12
2.4
Tuning Image Processing . . . . . . . . . . . . . . . . . . . . . . . . . . . . .
14
2.5
Preprocessing Images . . . . . . . . . . . . . . . . . . . . . . . . . . . . . . .
22
3 Combining ActivDataCode with other ActivVisionTools
27
3.1
Converting Results to Other Units . . . . . . . . . . . . . . . . . . . . . . . .
28
3.2
Evaluating Results . . . . . . . . . . . . . . . . . . . . . . . . . . . . . . . .
30
3.3
Output of Results . . . . . . . . . . . . . . . . . . . . . . . . . . . . . . . . .
32
4 Tips & Tricks
35
4.1
Adapting the Display of Results . . . . . . . . . . . . . . . . . . . . . . . . .
36
4.2
Configuring the Two Execution Modes . . . . . . . . . . . . . . . . . . . . . .
38
4.3
Accessing Results Via the Programming Interface . . . . . . . . . . . . . . . .
40
A Process Control Features
A.1 Introduction . . . . . . . . . . . . . . . . . . . . . . . . . . . . . . . . . . . .
51
52
A.2 Data Code Production . . . . . . . . . . . . . . . . . . . . . . . . . . . . . . .
52
A.3 International Standards . . . . . . . . . . . . . . . . . . . . . . . . . . . . . .
53
A.4 Quality Grades . . . . . . . . . . . . . . . . . . . . . . . . . . . . . . . . . .
53
A.5 Available Features . . . . . . . . . . . . . . . . . . . . . . . . . . . . . . . . .
53
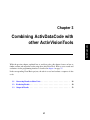
Chapter 1
This chapter will introduce you to the features and the basic concepts of ActivDataCode. It gives
an overview about ActivDataCode’s master tool and its support tools, which are described in
more detail in chapter 2 on page 7 and chapter 3 on page 27.
1.1
Introducing ActivDataCode . . . . . . . . . . . . . . . . . . . . . . . . . . .
2
1.2
The Sub-Tools of ActivDataCode . . . . . . . . . . . . . . . . . . . . . . . .
5
1
ActivDataCode
About ActivDataCode
2
About ActivDataCode
1.1
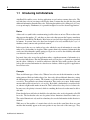
Introducing ActivDataCode
ActivDataCode enables you to develop applications to read various common data codes. The
tool finds data codes in your images and decodes them. It returns the decoded data along with
additional information about the data codes. Following the tradition of its sibling tools, it is easy
to set up and employ. Furthermore, it is powerful enough to be used for advanced applications.
Basics
A data code is a symbol with a certain meaning, just like a letter or an icon. There are data codes
that represent the number ‘42’, and there are data codes that represent the Japanese translation
of The Fool on the Hill by The Beatles. Most letters or icons have been designed to be perceived
by humans. In contrast, data codes have been designed to be easily readable by the ‘eyes’ of
machines, namely cameras and specialized scanners.
In this regard, they are very similar to bar codes which also encode information in a way that
makes it easy for machines to decipher. What separates them is the amount of information that
can be encoded without the symbol getting too big in size as well as the reliability with which
even defective data codes can be decoded.
In general, data codes are used in applications where a significant amount of information is to
be associated with objects. Plus, the information needs to be in place, i.e. printed on or punched
into the object. Otherwise, it would be sufficient to label the object with a product code, and
look up the associated information in a data sheet or database, which is typical for applications
based on bar codes.
Concepts
There are different types of data codes. Whereas bar codes encode the information as an alternating pattern of black and white along a line, data codes add an additional dimension, storing
the information in a grid or matrix. The elements or cells that form this matrix are referred to
as modules. These modules carry binary information. They can be set or unset. In this manual,
unset modules will be referred to as zero modules. By default, a dark module is considered to be
set, whereas a light module marks an unset bit. This is referred to as the polarity of a data code.
In some cases, the polarity is inverted, which is something the data code reader must be able to
deal with.
From what has been said before it should be clear why data codes are also frequently called 2D
bar codes. The fact that bar codes are also printed in two dimensions should not confuse you.
The vertical dimension is only used for redundancy; the encoded information in this direction is
identical.
While most of the modules of a matrix data code do encode the actual data, there are some
modules that invariably appear at the same position in any data code of the same type. They
ActivDataCode / 2008-04-23
1.1 Introducing ActivDataCode
3
Quiet Zone
Finder Pattern
Modules
Data Matrix ECC 200
QR Code
Zero Modules
Figure 1.1: Components of the supported matrix data codes.
Apart from the finder pattern, a data code is required to be surrounded by a uniform region to
simplify its detection and to keep background noise from disturbing the decoding. This uniform
region is called quiet zone.
There are also hybrid types of data codes, which are composed of multiple bar codes with the
addition of efficient error correction and enclosed by start and stop patterns. Imagine setting
the words of this paragraph in one single line. It would make this manual appear rather bulky.
Because bar codes that encode a lot of information tend to get rather big as well, it occurred to
some people that they could just as well cut this strip of information into pieces of equal size,
and stack them up line by line. Data codes following this approach are called stacked codes.
Supported Data Code Types
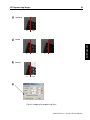
ActivDataCode supports both matrix and stacked data codes. In the former category both Data
Matrix ECC 200 and QR Code (models 1 and 2) data codes are supported. In the latter category, the PDF417 (Portable Data File) data code is supported (both conventional and compact/truncated). Example images of these data code types are shown in figure 1.1 and figure 1.2.
start pattern
data
stop pattern
Figure 1.2: Components of the PDF417 stacked data code.
ActivVisionTools 3.2 – Your Fast Track to Solutions
ActivDataCode
build a specific pattern which makes it easy to find the data code in an image. Once detected,
they uniquely determine the orientation of the data code and act as the reference anchor for the
data section. This static pattern is called finder pattern.
4
About ActivDataCode
Application
In most applications, ActivDataCode reads data codes automatically without the need to adjust
tons of parameters. Even if the detection fails in some images, a teaching facility will usually
optimize the decoding process automatically. But even seemingly hopeless images of poor
quality may be decoded by applying preprocessing filters to them. Detailed descriptions can
be found in the following chapters.
A data code can appear in any position and any orientation. Furthermore, data code extraction
with ActivDataCode is very robust. It extracts data codes even from difficult backgrounds and
in case of varying illumination. ActivDataCode can also be instructed to read several data codes
at once from the same image provided they are of the same type. To speed up the extraction,
you can specify regions of interest (ROIs). By default, ActivDataCode will offer to create an
ROI that covers the entire image. If you want to decode data codes of different type in the same
application, you will have to add multiple ActivDataCode tools.
Results
The result of ActivDataCode is, of course, the content of the extracted data code. Furthermore,
ActivDataCode lets you output additional information (also called features), e.g., the position
of the data code in the image (see figure 1.3), the appearance, or the actual (sub)type of the data
code. You can also request results concerning the print quality of the data code (see appendix A
on page 51 for more information). The results of ActivDataCode can be further evaluated using
ActivDecision, before you output them via ActivFile, ActivSerial, or ActivDigitalIO; furthermore, you can access results via the programming interface (see section 4.3 on page 40).
Column
Region
Orientation
Row
Figure 1.3: The position of a data code in the image.
ActivDataCode / 2008-04-23
1.2 The Sub-Tools of ActivDataCode
1.2
5
The Sub-Tools of ActivDataCode
Besides its master tool, ActivDataCode provides three support tools. In figure 1.4, the basic
tools are depicted together with other ActivVisionTools that you will use in a typical ActivDataCode application. In figure 1.5 on page 6, the tools for advanced data code applications can
be seen.
AVTDataCode
ActivDataCode
(ActivView)
(ActivDecision)
AVTDataCodeSettings
Figure 1.4: The basic sub-tools of ActivDataCode together with suitable other tools.
AVTDataCode is the master tool of ActivDataCode. In it, you specify the expected type of data
code and the number of symbols to be decoded. If a data code cannot be detected using the
standard settings, you can ask ActivDataCode to adjust its internal parameters until the detection
succeeds. This is referred to as teaching a data code. The taught parameters can be saved to
disk for later use. How to use AVTDataCode is described in more detail in section 2.2 on page 10.
ActivVisionTools 3.2 – Your Fast Track to Solutions
6
About ActivDataCode
AVTDataCodePreprocessing
AVTDataCodeParameters
Figure 1.5: The advanced sub-tools of ActivDataCode .
AVTDataCodeSettings is a support tool of ActivDataCode. With it, you can set up what is to
be displayed in ActivView, and what results are to be calculated for ActivDecision. How to use
AVTDataCodeSettings is described in section 2.2 on page 10.
AVTDataCodePreprocessing is a support tool of ActivDataCode. It allows to apply image
preprocessing to the ROI, in order to enable or improve the decoding of data codes under bad
conditions. How to use AVTDataCodePreprocessing is described in section 2.5 on page 22.
AVTDataCodeParameters is a support tool of ActivDataCode. It allows to manually tweak
the parameters of ActivDataCode for advanced applications. How to use AVTDataCodeParameters is described in section 2.4 on page 14.
ActivDataCode / 2008-04-23
Chapter 2
This chapter will explain how to use ActivDataCode to read various types of data codes and how
to “tune” the underlying image processing.
The corresponding Visual Basic projects show how to successfully read data codes.
2.1
Specifying Regions of Interest . . . . . . . . . . . . . . . . . . . . . . . . .
8
2.2
Reading Data Codes . . . . . . . . . . . . . . . . . . . . . . . . . . . . . . .
10
2.3
Teaching Data Codes . . . . . . . . . . . . . . . . . . . . . . . . . . . . . .
12
2.4
Tuning Image Processing . . . . . . . . . . . . . . . . . . . . . . . . . . . .
14
2.5
Preprocessing Images . . . . . . . . . . . . . . . . . . . . . . . . . . . . . .
22
7
ActivDataCode
Using ActivDataCode
8
Using ActivDataCode
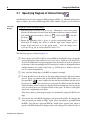
2.1
Specifying Regions of Interest Using
ActivDataCode lets you choose between different shapes of ROIs, e.g., arbitrarily oriented rectangles or ellipses. You create an ROI using AVTViewROI, which is a support tool of ActivView.
Visual Basic
Example
Preparation for the following example:
2 Open the project rois\datacode_rois.vbp. Alternatively, create a new project
and place the following tools on the form (in parentheses the icon you have to doubleclick with the left mouse button): AVTView (
), AVTViewROI (
), and AVTDataCode (
).
2 Execute the application (Run . Start or via the corresponding button). Open
AVTViewFG by clicking into AVTView with the right mouse button and selecting Image Acquisition in the popup menu.
Load the image datacode\qrcode\qr_hd_01 via the combo box Input File.
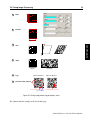
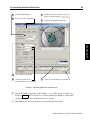
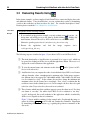
The following steps are visualized in figure 2.1.
1
First, you have to tell AVTViewROI to create an ROI for ActivDataCode by selecting the
corresponding entry in the combo box ActivVisionTool. In this box, all ActivVisionTools are listed that have been placed upon the form. By default, the tools are referenced
by the name of the corresponding ActiveX control plus a counter to distinguish between
multiple instances of a control on the form, e.g., AVTDataCode1. If there is only one
tool, it is selected automatically.
2
3
Next, select the desired shape of the ROI, for example a rectangle.
To draw the ROI, move the mouse in the image while keeping the left mouse button
pressed. Please experiment at this point with the different shapes.The creation of a
) is more complex: By the first mouse movement, the first side of
polygonal ROI (
the polygon is created. You can add a new corner point by clicking on the line with the
left mouse button; when you drag it by keeping the mouse button pressed, new polygon
sides are created, where you can again add new corner points. To delete a corner point,
drag it onto a neighboring corner point.
If the data code moves from image to image, we recommend to enlarge the ROI accordingly.
4
You can now move the ROI by dragging its pick point in the middle. By dragging the
outer pick points you modify its shape. Again, please experiment to get familiar with
the ROIs. Note that for a polygonal ROI the “middle point” appears at the center of
gravity of the ROI and therefore changes whenever the polygon is modified; besides, it
ActivDataCode / 2008-04-23
3
draw the ROI in the image by pressing
9
1
4
edit the ROI by dragging the pick−points
5
you can copy, paste, and delete the
select AVTDataCode1
in the combo box
the left mouse button and moving the mouse
2
select a shape for the ROI
7
lock the selected ROI
selected ROI or delete all ROIs
6
step through the ROIs of the selected
tool with these buttons
Figure 2.1: Creating a region of interest.
may even lie outside the ROI for concave polygons.
5
2 . You can also copy, paste, and delete the selected
To create a second ROI, repeat step ROI or delete all ROIs.
6
ROIs can be selected by clicking next to them in the image. Alternatively, use the two
arrow buttons
to step through all the ROIs of the selected tool.
7
By checking √ Locked you can lock the selected ROI in place and thus prevent it from
accidental editing or deletion.
If there are multiple data codes of the same type in an image, you can either create one ROI that
contains them all, or multiple ROIs containing one or more data codes.
ActivVisionTools 3.2 – Your Fast Track to Solutions
ActivDataCode
2.1 Specifying Regions of Interest
10
Using ActivDataCode
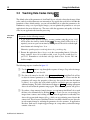
2.2
Reading Data Codes Using
While you are positioning an ROI on the image, ActivDataCode already tries to find a data
code of the currently selected type inside it. The default setting of ActivDataCode is to look for
ECC 200 data codes. Using AVTDataCode, you can setup the data code type of your application.
With AVTDataCodeSettings you can configure the output behavior of ActivDataCode.
Visual Basic
Example
Preparation for the following example:
2 If you worked on the previous example, you may continue using this project. At
design time, add AVTViewStatus, AVTDataCodeSettings, and AVTDataView by
double-clicking
,
, and
. You may delete AVTViewROI, as it can be
opened at run time by clicking into AVTView with the right mouse button and selecting Region of Interest.
Otherwise, open the project reading\datacode_reading.vbp.
2 Execute the application (Run . Start or via the corresponding button) and
open AVTViewFG by clicking into AVTView with the right mouse button and
selecting Image Acquisition in the popup menu. Select the image datacode\qrcode\qr_hd_01 in the combo box Input File.
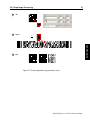
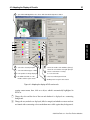
The following steps are visualized in figure 2.2.
1
Specify the data code type in the combo box Type. In the example image, a QR Code is
displayed. If you do not know the type of the data code, you can look up the supported
data codes in figure 1.1 on page 3. The supported data codes can be distinguished easily
by looking at the finder pattern.
2
If the ROI is correctly placed around the data code (including the quiet zone), the read
code should now be displayed in AVTView. If AVTDataCode fails to extract a data code,
AVTDataCode will display a corresponding message.
3
With the help of check boxes, you can specify what is to be displayed on the image:
the decoded data of the data code, the image region corresponding to the data code
(excluding the quiet zone). You can also display both the foreground and the background
(zero) modules. Especially with difficult images, it can be helpful to display all the
candidates that are evaluated by ActivDataCode. Section 4.1 on page 36 explains how
to change the appearance of the displayed results.
4
Besides the extracted data code, ActivDataCode can output additional information (also
called features), e.g., the position of the data code. The process control features are
explained in appendix A on page 51.
ActivDataCode / 2008-04-23
2.2 Reading Data Codes
11
1
select the data code type
3
visualize certain results in the image
2
extracted codes are displayed, otherwise
4
choose results for the spreadsheet
ActivDataCode
an eror message appears
5
select AVTDataCode1 in the combo box
and enable the update of results
6
select the ROI, whose results
is then displayed
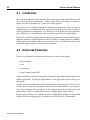
Figure 2.2: Reading data codes and selecting results.
5
To view the calculated features, select the tool whose results to display in the combo box
ActivVisionTool, and enable the update of results in AVTDataView. If there is only
one tool, it is selected automatically.
6
Automatically, a list of the ROIs of AVTDataCode1 appears below. Select the ROIs
whose results you want to examine by checking their box. Their results are then displayed in a table, the columns corresponding to the selected features.
ActivVisionTools 3.2 – Your Fast Track to Solutions
12
Using ActivDataCode
2.3
Teaching Data Codes Using
The default values of the parameters of ActivDataCode are selected so that a broad range of data
codes can be decoded without any user intervention. If a specific data code fails to fit within the
boundaries of these default settings, you can ask ActivDataCode to adjust the parameters to fit.
Furthermore, using a set of prototypical images, you can optimize the parameters to suit your
application in the most efficient way. The more stable the appearance and quality of the data
codes in your application the faster the processing.
Visual Basic
Example
Preparation for the following example:
2 If you worked on the previous example, you may continue using this project. Add
AVTViewFG to the form by double-clicking
. You may delete AVTDataView (if
required, you can re-open it at run time by clicking into AVTDataCode with the right
mouse button and selecting Data View....
Otherwise, open the project teaching\datacode_teaching.vbp.
2 Execute the application (Run . Start or via the corresponding button). Select the
image sequence datacode\ecc200\ecc200_teach.seq in the combo box Input File. Remember to set the data code type back to Data Matrix ECC 200
for this example.
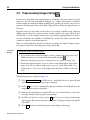
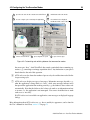
The following steps are visualized in figure 2.3.
1
Use the Single button to step through the sequence of images. Stop at the first image
where the data code is not decoded.
2
If a data code cannot be decoded, click Detect and Teach . ActivDataCode will try
to adjust its internal parameters to read the displayed data code. Please note that the
parameters will snap to the properties of that very data code the first time the button
is clicked. As a result, data codes which could be read before may now require an
additional training. The label of the button will change to Teach . Teaching subsequent
data codes will widen the parameter range again. Thus, no teaching results will get lost.
3
If you have a large amount of sample images, you can instruct ActivDataCode to teach
the data codes automatically by checking √ Auto Teach. In case you are using live
images from a camera, auto teaching will slow down the application considerably if no
data code is present in the image at all, e.g., while you are positioning a new object in the
camera view. This is because ActivDataCode tries very hard to find at least one data code
in each acquired image by widening the parameter set to the extremes. In applications
like these, make sure to acquire triggered images in a setup where you know the image
contains a data code.
ActivDataCode / 2008-04-23
2.3 Teaching Data Codes
single−click through image sequence until a
data code is displayed that cannot be decoded
2 let ActivDataCode detect the
displayed data code
ActivDataCode
1
13
4
train remaining images
3 let ActivDataCode detect subsequent data codes automatically
5 save the trained parameters
Figure 2.3: Teaching data codes.
4
Click the Run button to teach the remaining images of the sequence. If all images are
trained, click the Stop button. You can track the file names of the sequence file by
looking at the status bar.
5
The data code model is saved automatically when the application quits. You can also
explicitly save the model of the trained data codes at any time. To do this, click the
Save button and enter a file name. The default extension of these files is .dmd (data
code model description).
ActivVisionTools 3.2 – Your Fast Track to Solutions
14
Using ActivDataCode
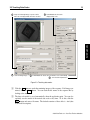
2.4
Tuning Image Processing Using
Normally, there is no need to touch the internal parameters of ActivDataCode. If, however,
auto-teaching fails simply because the properties of a data code lie outside of the search range,
you can try to adjust the parameters manually. On the other hand, if the data code could be read
but you want to know the detailed changes of a specific training step, you can also take a look at
the parameter dialog. Reversely, you can explicitly set the parameters to certain known values
and test a range of data codes for compliance. You can always return to the default settings at
the click of a button.
Visual Basic
Example
Preparation for the following example:
2 If you worked on the previous example, you may continue using this project.
Otherwise, open the project tuning\datacode_tuning.vbp.
2 Execute the application (Run . Start or via the corresponding button) and load the
image datacode\ecc200\ecc200_tune_04. Open AVTViewROI by selecting Region of Interest in the popup menu and place an ROI over the data code. Click
Detect and Teach in AVTDataCode. You will get a message saying that no data
code could be detected in the image.
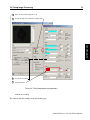
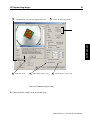
The following steps are visualized in figure 2.4
1
Click the Reset button to set all the parameters to their default values, i.e., any training
information will be lost.
2
Select all check boxes in the Display frame of AVTDataCodeSettings. This will help
you to see the changes to the decoding process while you are changing single parameter
values. Specifically, make sure to check √ Candidates because this will highlight
image areas that are considered to potentially contain data codes of the selected type.
3
Click the Details button to open the parameter dialog. Alternatively, you can add
) to the form at design time. The default settings disAVTDataCodeParameters (
played in this dialog depend on the selected data code type. Some parameters are not
available for all supported data codes. The corresponding parameters will be grayed out
in the dialog.
4
Some parameter values can be changed by moving sliders. If both a minimum and a
maximum value can be specified, two linked sliders are available. You can also specify
the values explicitly by editing the text boxes. Using the arrow buttons, the values can
be decremented or incremented. Other parameters can be specified by selecting from a
combo box. When you change a parameter value, the current image is searched again
ActivDataCode / 2008-04-23
2.4 Tuning Image Processing
make sure the default settings are used
2
visualize all data code components in image view
3
open parameter dialog
4
change parameter
ActivDataCode
1
15
Figure 2.4: Tuning image processing parameters.
with the new settings.
We continue with the example on the next double page.
ActivVisionTools 3.2 – Your Fast Track to Solutions
16
Using ActivDataCode
(Tuning Image Processing, continued)
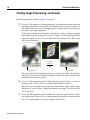
The following steps are visualized in figure 2.5 on page 17
5
Contrast: This parameter sets the minimum gray value difference between foreground
and background modules. Decrease this value if the data code is not detected because of
low contrast. If the data codes in your application are of high contrast, you can increase
the value to speed up the application.
To determine a suitable value interactively, pick the gray values of sample foreground
and background positions using the Zoom tool. To open it, click on the image with the
right mouse button and select Zoom from the menu. The example below shows a data
code with a high contrast.
Contrast
100 (f − b)
256
b (background)
f (foreground)
The image loaded in the example project has a very bad contrast. Thus, the Contrast
value has to be decreased considerably. Watch the visualization of the candidates while
pulling the slider to the lowest value.
6
Polarity: This parameter specifies if data codes appear positive (Dark on Light) or
inverted (Light on Dark). Set to Any if both variants should be detected.
The polarity can be determined by looking at the finder pattern. In the example image,
the polarity is Light on Dark. Change the parameter accordingly. The data code will
now be decoded.
7
Mirrored: This parameter specifies whether data codes may appear mirrored. Set to
Any if both variants occur or if you are uncertain about the appearance of the actual data
code. It is sometimes hard to tell just by looking at the data code.
ActivDataCode / 2008-04-23
2.4 Tuning Image Processing
Contrast
smaller
6
7
default
higher
Dark on Light
Light on Dark
Polarity
Mirrored
No
Yes
Figure 2.5: Tuning image processing parameters (cont.).
We continue with the example on the next double page.
ActivVisionTools 3.2 – Your Fast Track to Solutions
ActivDataCode
5
17
18
Using ActivDataCode
(Tuning Image Processing, continued)
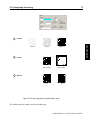
The following steps are visualized in figure 2.6 on page 19.
8
Rows: This parameter specifies the number of modules in vertical direction. Depending
on the parameter Shape, it may be bound to Columns.
9
Columns: This parameter specifies the number of modules in horizontal direction. Depending on the parameter Shape, it may be bound to Rows.
10
Slant (ECC 200 only): Using this parameter, slanted data codes up to the specified
degree can still be read by internally rectifying the image.
11
Shape (ECC 200 only): Data matrix codes are allowed in two different shapes: Rectangle and Square. The parameter refers to the shape of the data code itself, not the
shape of the modules. Using this parameter, you can restrict the data code reader to a
specific shape. Set to Any if both variants should be detected. Setting this parameter
to Square will bind both Rows and Columns together so that moving one of the sliders
will update the other one accordingly.
12
Type (QR Code only): There are two different models (variations) of QR Code data
codes. This parameter specifies the model types that will be detected.
13
All Position Patterns present (QR Code only): QR Codes boast three position
(finder) patterns. Use this parameter to control whether the data code reader needs to
find all three patterns to read the data code or if two patterns suffice to start the decoding
process.
ActivDataCode / 2008-04-23
8
Rows
9
Columns
10
Slant
11
Shape
19
ActivDataCode
2.4 Tuning Image Processing
Square
12
Type
13
Need all Position Patterns
Rectangle
QR Code Model 1
Extension Patterns (except Version 1)
QR Code Model 2
Alignment Pattern (except Version 1)
Fourth Corner is Fixed
Figure 2.6: Tuning image processing parameters (cont.).
We continue with the example on the next double page.
ActivVisionTools 3.2 – Your Fast Track to Solutions
20
Using ActivDataCode
(Tuning Image Processing, continued)
The following steps are visualized in figure 2.7 on page 21.
14
Size: This parameter specifies a valid range of pixel sizes for the modules. Data codes
with module sizes outside of this range will not be detected.
15
Aspect (PDF417 only): In PDF417 data codes the height and the width of the modules
may differ. Using this parameter, you can specify the valid range of aspect ratios.
16
Gap (ECC 200 and QR Code only): Depending on the printing or embossing method,
there may be gaps between the single modules of a data code. Using this parameter, you
can indicate if gaps are allowed and to what degree. Set to Any if both very tight and
very loose data codes should be detected.
Optimizing the Parameters of a Detected Data Code
As soon as a data code is decoded, its actual parameter values are displayed in the parameter
dialog. You can then optimize the parameters manually. If no teaching has been performed yet,
you can also click the Teach button to snap the parameters to the current values. Optimizing
the parameters will speed up your application.
value of current data code
optimizing
ActivDataCode / 2008-04-23
2.4 Tuning Image Processing
14
Size
15
Aspect
y
x
21
y
16
ActivDataCode
x
Gap
No
Small
Big
Figure 2.7: Tuning image processing parameters (cont.).
ActivVisionTools 3.2 – Your Fast Track to Solutions
22
Using ActivDataCode
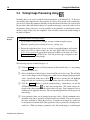
2.5
Preprocessing Images Using
In some cases, the quality of the acquired images is so bad that a data code cannot be read. In
other cases, the data code itself might be damaged, e.g., stamped, written upon, or distorted.
If both teaching and manual parameter tweaking fail to produce any results, you may try to
preprocess the image itself using various filters. Keep in mind to follow this approach only as a
last resort.
In general, images of bad quality are the result of a poor image acquisition setup. Improper
lighting causing reflections or uneven contrast, cameras oriented at an angle leading to various distortions, or even unsuitable camera lenses or positioning capturing images too small or
too noisy all influence the reliability of ActivDataCode. Some of the defects caused by these
weaknesses cannot be restored retrospectively.
Thus, it is usually much more effective to rectify the way images are acquired. Preprocessing is
not a panacea, and it slows down image processing considerably.
Visual Basic
Example
Preparation for the following example:
2 If you worked on the previous example, you may continue using this project. Add
AVTDataCodePreprocessing to the form by double-clicking
.
Otherwise, open the project preprocessing\datacode_preprocessing.vbp.
2 Execute the application (Run . Start or via the corresponding button) and load the
image datacode\ecc200\ecc200_preprocess.seq. Open AVTViewROI by selecting Region of Interest in the popup menu and place an ROI over the data
code.
The following steps are visualized in figure 2.8.
1
Click Detect and Teach in AVTDataCode. ActivDataCode tries to detect the data
code but fails. A corresponding message is displayed.
2
Check √ Auto Teach to automatically adapt the parameters of ActivDataCode to the
changes from the preprocessing filters.
3
Make sure all visualizations are enabled. This way, you can immediately see any detection improvements caused by preprocessing changes.
4
In AVTDataCodePreprocessing, check √ Apply Preprocessing to enable image
preprocessing. This activates the preprocessing filters. The preprocessing is only applied
to the ROIs.
5
Check
ActivDataCode / 2008-04-23
√
Display to visualize the preprocessing changes in the image.
2.5 Preprocessing Images
let ActivDataCode try to detect the displayed data code
2
visualize all data code properties
ActivDataCode
1
23
3
enable Auto Teach
4
enable image preprocessing
5
visualize preprocessing results
Figure 2.8: Preprocessing the image.
We continue with the example on the next double page.
ActivVisionTools 3.2 – Your Fast Track to Solutions
24
Using ActivDataCode
(Preprocessing Image Processing, continued)
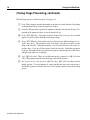
The following steps are visualized in figure 2.9
6
Smoothing: This filter is particularly useful for noisy images. Besides, it may improve
data code detection if the finder pattern of the data code is disturbed, e.g., by lines in the
background or foreground.
7
Growth: If negative, this filter enlarges bright image areas. If positive, it enlarges dark
image areas. It is most useful for data codes of bad print quality. If too much ink is used
in the printing process, the ink tends to bleed in the surrounding area causing a so-called
print growth. If too few ink is used, the modules may become frayed or full of holes. By
adjusting the Growth value accordingly, these deficiencies can be compensated.
8
Contrast: This filter enhances the contrast of the image. It may improve data code
detection in low contrast images.
9
√
Compensate for Low Resolution: The data code expects the modules to have a
specific minimum size. Enabling this filter will improve detection of data codes with
very small module sizes.
ActivDataCode / 2008-04-23
2.5 Preprocessing Images
7
8
Smoothing
off
high
off
−
off
high
Growth
off
ActivDataCode
6
25
+
Contrast
9
Figure 2.9: Applying the preprocessing filters.
ActivVisionTools 3.2 – Your Fast Track to Solutions
26
ActivDataCode / 2008-04-23
Using ActivDataCode
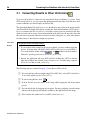
Chapter 3
ActivDataCode
Combining ActivDataCode with
other ActivVisionTools
While the previous chapter explained how to read data codes, this chapter focuses on how to
further evaluate and output the results using other ActivVisionTools. How to access results and
evaluations via the programming interface is described in chapter 4 on page 35.
In the corresponding Visual Basic projects, the task is to read and evaluate a sequence of data
codes.
3.1
Converting Results to Other Units . . . . . . . . . . . . . . . . . . . . . . .
28
3.2
Evaluating Results . . . . . . . . . . . . . . . . . . . . . . . . . . . . . . . .
30
3.3
Output of Results . . . . . . . . . . . . . . . . . . . . . . . . . . . . . . . .
32
27
28
Combining ActivDataCode with other ActivVisionTools
3.1
Converting Results to Other Units Using
Up to now, the position of a data code was measured in image coordinates, i.e., pixels. Using
AVTViewCalibration, you can convert this information into other units. Note that for a more
accurate calibration you should employ ActivGeoCalib.
The main idea behind AVTViewCalibration is that the user draws a line in the image and tells
ActivVisionTools the length of this line in a certain unit. From this information, AVTViewCalibration calculates the size of a pixel (i.e., its height as square pixels are assumed) in this unit,
which in its turn can be used to convert measurements from pixels into the new unit. Note that
this conversion only works if the observed objects lie in the same plane, i.e., at the same distance
from the camera, as the line whose length was specified.
Visual Basic
Example
Preparation for the following example:
2 If you worked on the example in the previous chapter, you may continue using this
project. At design time, add AVTViewROI, AVTViewCalibration, and AVTDataView to the form by double-clicking
,
, and
with the left mouse button.
Otherwise, open the project units\datacode_units.vbp.
2 Execute the application and open AVTViewFG by clicking into AVTView with the
right mouse button and selecting Image Acquisition. Load the image sequence
datacode\ecc200\ecc200_teach.seq.
The following steps are visualized in figure 3.1 (not shown: AVTDataCode).
1
You create the line of known length using AVTViewROI. First, select AVTViewCalibration1 in the combo box ActivVisionTool.
2
3
To start creating the line, click
4
You can edit the line by dragging its pick points. For fine positioning, zoom the image
and move the displayed part using the scrollbars to the right and below the image.
5
Select a unit in the combo box Unit ofAVTViewCalibration.
.
To draw the line, move the mouse in the image while keeping the left mouse button
pressed.
ActivDataCode / 2008-04-23
3.1 Converting Results to Other Units
select AVTViewCalibration1
2
click to create a line−shaped ROI
3
to draw the line in the image, move the mouse
while pressing the left button
4
edit the line by dragging the pick points
7
results are converted into the selected unit
ActivDataCode
1
29
5
select a unit in the combo box
6
specify the length of the line
(the computed pixel size is displayed)
Figure 3.1: Converting positions into other units.
6
Specify the length of your line (in the example: 3.1cm) in the text box Length Line
and press Enter . AVTViewCalibration now calculates the height of a pixel in the
selected unit and displays it in the text box Pixel Height.
7
Automatically, the data code position is converted into the selected unit.
ActivVisionTools 3.2 – Your Fast Track to Solutions
30
Combining ActivDataCode with other ActivVisionTools
3.2
Evaluating Results Using
In the former examples, you have employed ActivVisionTools to extract and display data codes
and additional features. Using ActivDecision, you can evaluate these results by formulating
conditions the results have to meet in order to be “okay”. For a detailed description of ActivDecision please consult the User’s Manual for ActivDecision.
Visual Basic
Example
Preparation for the following example:
2 If you worked on the previous example, you may continue using this project. At
design time, add AVTDecision to the form by double-clicking
with the left
mouse button; delete AVTDataView, AVTViewCalibration, and AVTViewROI.
Otherwise, open the project decisions\datacode_decisions.vbp.
2 Execute the application
code\qrcode\qr_hd.seq.
and
load
the
image
sequence
data-
The following steps are visualized in figure 3.2 (not shown: AVTView and AVTDataCode).
1
The main functionality of ActivDecision is presented by its support tools, which can
be opened via clicking on AVTDecision with the right mouse button. The master tool
displays the overall evaluation of the application.
2
To view the current feature and evaluation results check
DecisionViewResults.
3
ActivDecision lets you compare the value of an individual object, ROI, or tool feature
with two boundary values, a minimum and a maximum value. In the image sequence,
two different data codes appear, HD-7100-080GB and HD-7100-160GB; only the latter
is to be evaluated as “okay”. In the columns Min and Max, change the minimum and
maximum values for the feature Data accordingly. Now, select a condition that the
result has to meet in the column Operation. In our example, the Data has to be equal
to the Max value. If you select None, the result is not evaluated.
4
Those features which meet their condition appear in green, the others in red. If at least
one feature is “not okay”, the whole object, ROI, or tool is evaluated as “not okay”
as well. Analogously, the overall evaluation of the application, which is visualized by
AVTDecision, depends on the tool evaluations.
√
Enable Update in AVT-
Figure 3.2 shows suitable conditions for the example task. Step through the image sequence by clicking Single in AVTViewFG and examine the evaluations. Experiment
by formulating additional conditions, e.g., regarding the position or orientation of the
data codes.
ActivDataCode / 2008-04-23
3.2 Evaluating Results
1
open the support tools via the
31
3
context menu (right mouse click)
formulate conditions for objects,
ROIs, or tools
enable the update of results
4
the evaluations are displayed immediately
6
check this box to show the used parameters
5
specify default conditions
ActivDataCode
2
Figure 3.2: Formulating conditions to evaluate results.
5
If many similar objects are extracted that all should meet the same conditions, you can
specify default conditions using AVTDecisionViewDefaults. Defaults can be set per
tool or per ROI; ROI defaults override tool defaults, and individual conditions override
defaults.
6
If you check √ Substitute Default, the entries marked Default are substituted by
their actual content.
ActivVisionTools 3.2 – Your Fast Track to Solutions
32
Combining ActivDataCode with other ActivVisionTools
3.3
Output of Results Using
Using ActivFile, you can write the results and the evaluations to a log file. How to access results
via the programming interface is described in section 4.3 on page 40, how to output them via a
serial interface or a digital I/O board in the User’s Manual for ActivSerial and the User’s Manual
for ActivDigitalIO, respectively.
Visual Basic
Example
Preparation for the following example:
2 If you worked on the previous example, you may continue using this project. At
design time, add AVTOutputFile by double-clicking
.
Otherwise, open the project output\datacode_output.vbp.
2 Execute the application and load
code\ecc200\ecc200_capsules.seq.
the
image
sequence
data-
The following steps are visualized in figure 3.3 (not shown: AVTView, AVTDataCode, AVTDecision).
1
By clicking on Select , you can open a file selector box to choose a file name for
the log file, which will then appear in the text field beside the button. By pressing
Clear File , you can clear the content of the selected file.
2
3
By checking
√
Enable Writing you enable the writing mode.
You can open the ActivFile’s two dialogs DialogFileOptions and DialogOutputDataSelect by clicking File Options and Data Selection , respectively.
4
In DialogFileOptions, you can choose between two file formats: Standard text files
(suffix .txt) and the so-called comma-separated values (suffix .csv), which can be
used as an input to Microsoft Excel. Furthermore, you can select a delimiter.
5
In the same dialog you can limit the size of the log file in form of the number of cycles
that are to be recorded. A cycle corresponds to one processing cycle from image input
to the evaluation and output of results. If you use this option, ActivFile creates two log
files and switches between them, thus assuring that you can always access (at least) the
results of the last N cycles, N being the specified number of cycles.
6
By pressing Estimate , you can let ActivFile estimate the size of one cycle. Note that
you must first select the output data in order to get meaningful results!
7
In the left part of DialogOutputDataSelect, you can navigate through the result hierarchy similarly to ActivDecision.
ActivDataCode / 2008-04-23
3.3 Output of Results
33
select the name of the log file
4
select file format and delimiter
2
check to enable writing
5
limit the file to a number of cycles
3
click to open the dialogs
6
estimate the file size for ony cycle
7
navigate through the results
8
select the output data
ActivDataCode
1
Figure 3.3: Customizing log files.
8
In the right part of DialogOutputDataSelect, choose the output data by checking the
corresponding boxes. You may output different items depending on the evaluation of an
object. By clicking on the column labels with the right mouse button you can check or
uncheck all boxes in the column; similarly, you can check or uncheck whole rows or all
rows of a certain tool.
If you now step through the image sequence by clicking Single in AVTViewFG, the log file is
created. Figure 3.4 shows part of an example log file.
ActivVisionTools 3.2 – Your Fast Track to Solutions
34
Combining ActivDataCode with other ActivVisionTools
12/06/05;16:21:21
AVTDataCode1;yes
Rectangle1_1;yes
0;yes
Data;cla502976
Symbol Contrast;yes;0.200507;0.200000;1.000000;Number
Unused Error Correction;yes;1.000000;0.200000;1.000000;Number
12/06/05;16:21:22
AVTDataCode1;no
Rectangle1_1;no
0;no
Symbol Contrast;no;0.171800;0.200000;1.000000;Number
Unused Error Correction;no;0.166667;0.200000;1.000000;Number
12/06/05;16:21:22
AVTDataCode1;no
Rectangle1_1;no
0;no
Symbol Contrast;no;0.195253;0.200000;1.000000;Number
Unused Error Correction;yes;1.000000;0.200000;1.000000;Number
12/06/05;16:21:22
AVTDataCode1;yes
Rectangle1_1;yes
0;yes
Data;tre502971
Symbol Contrast;yes;0.228574;0.200000;1.000000;Number
Unused Error Correction;yes;0.333333;0.200000;1.000000;Number
12/06/05;16:21:23
AVTDataCode1;yes
Rectangle1_1;yes
0;yes
Data;tre502973
Symbol Contrast;yes;0.213203;0.200000;1.000000;Number
Unused Error Correction;yes;0.833333;0.200000;1.000000;Number
12/06/05;16:21:23
AVTDataCode1;yes
Rectangle1_1;yes
0;yes
Data;tre502974
Symbol Contrast;yes;0.238092;0.200000;1.000000;Number
Unused Error Correction;yes;0.500000;0.200000;1.000000;Number
Figure 3.4: Part of an example log file.
ActivDataCode / 2008-04-23
Chapter 4
This chapter contains additional information that facilitates working with ActivDataCode, e.g.,
how to modify the graphical display of results and how to customize the appearance of an ActivDataCode application in the two execution modes. Furthermore, it shows how to access data
code extraction and evaluation results directly via the programming interface of the ActivVisionTools.
4.1
Adapting the Display of Results . . . . . . . . . . . . . . . . . . . . . . . .
36
4.2
Configuring the Two Execution Modes . . . . . . . . . . . . . . . . . . . . .
38
4.3
Accessing Results Via the Programming Interface . . . . . . . . . . . . . .
40
4.3.1
Results of Data Code Extraction . . . . . . . . . . . . . . . . . . . . .
41
4.3.2
Evaluation Results . . . . . . . . . . . . . . . . . . . . . . . . . . . .
46
35
ActivDataCode
Tips & Tricks
36
Tips & Tricks
4.1
Adapting the Display of Results Using
You can adapt the way results and ROIs are displayed using AVTViewDisplayModes, which is
a support tool of ActivView.
Visual Basic
Example
Preparation for the following example:
2 If you worked on the example in the previous chapter, you may continue using this
project.
Otherwise, open the project display\datacode_display.vbp and execute it
(Run . Start or via the corresponding button).
2 Load the image sequence datacode\qrcode\qr_hd.seq and create some additional ROIs; AVTViewFG and AVTViewROI can be opened at run time via a right
mouse button click on AVTView.
The following steps are visualized in figure 4.1. Experiment by choosing different settings for
the display parameters and watching the result.
1
Open AVTViewDisplayModes by clicking on AVTView with the right mouse button and
selecting Display Modes in the popup menu.
2
Change the color of the selected pick point. Select another pick point by clicking into
its vicinity.
3
Change the color of the currently selected ROI. Select another ROI by clicking into its
vicinity. Change the color of the other, not selected ROIs of the currently selected tool.
Change the color of the ROIs of the other, not selected tools. Select another tool in
the combo box ActivVisionTool of AVTViewROI (if this box contains more than one
item). If you use ActivDecision to evaluate results, it can mark ROIs evaluated as “not
okay” in a special color.
4
5
6
Change the LUT (look-up table) that is used to display the image.
7
Change the line width of the ROIs or of the modules (or the region margin, see below).
Change the color of the modules and candidates (in the text box Group I) or the color
of the zero modules and the region (text box Group II).
ActivDecision uses a separate color to mark objects evaluated as “not okay”. Besides
this, a further color is used for highlighting objects if you click on them in ActivDataView or in the tree of ActivDecision. To test the effect, open ActivDataView by clicking
on AVTDataCode with the right mouse button and selecting Data View... in the ap-
ActivDataCode / 2008-04-23
4.1 Adapting the Display of Results
37
open AVTViewDisplayModes via a click on AVTView with the right mouse button
2
color of the selected pick point
3
color of the different types of ROIs
4
look−up tables for image display
ActivDataCode
1
5
6
color of the modules and candidates (Group I)
color of the zero modules and region (Group II)
7
color of results that are "not okay"
or of selected results
line width of the ROIs or of the
8
color, font, and background of text
modules and the region contour
9
drawing mode for regions and contours
Figure 4.1: Adapting the display of ROIs and results.
pearing context menu; then, click on a object, which is automatically highlighted in
AVTView.
8
Change the color and the font of the text and whether it is displayed on a contrasting
background.
9
Change the way modules are displayed (filled or margin) and whether contours and text
are framed with a contrasting color to make them more visible against busy backgrounds.
ActivVisionTools 3.2 – Your Fast Track to Solutions
38
Tips & Tricks
4.2
Configuring the Two Execution Modes Via
and
In an ActivVisionTools application you can switch between two execution modes: the configuration mode and the application mode. The former should be used to setup and configure an
application, the latter to run it. ActivView’s support tools AVTViewExecute and AVTViewConfigExec allow you to switch between the two modes and to customize the behavior of an
ActivVisionTools application in the two execution modes, e.g., display live images only in the
configuration mode to setup your application, but then switch it off in the application mode to
speed up the application. A third sub-tool, AVTViewExecuteSimple, provides a single button
to start/stop the application. In this section we also describe AVTViewStatus in more detail.
Visual Basic
Example
Preparation for the following example:
2 If you worked on the example in the previous chapter, you may continue using this
project. At design time, add AVTViewExecuteSimple and AVTViewStatus to the
and
with the left mouse button.
form by double-clicking the icons
Otherwise, open the project usermodes\datacode_usermodes.vbp.
2 Execute the application and load the sequence datacode\qrcode\qr_hd.seq.
The following steps are visualized in figure 4.2 (not shown: AVTDataCode).
1
Open AVTViewExecute and AVTViewConfigExec by clicking on AVTView with the
right mouse button and selecting Execution and Execution Parameters.
2
3
Switch between the two execution modes via AVTViewExecute’s combo box Mode.
4
For each of the two execution modes, you can choose what is to be displayed by checking the corresponding boxes in AVTViewConfigExec. Furthermore, you can specify if
images can be dragged to the image window and whether ROIs can be modified in the
two modes.
5
In AVTViewStatus, an icon indicates the current execution mode of the application.
, the application does not perform any processing and waits for your
In the mode
interaction. If you start the continuous mode, the cogwheels rotate; any interaction on
your part is stored in the event queue and processed after the current cycle is finished.If
To execute one cycle, press Single . With the other two buttons you can let the application run continuously and stop it again. By default, AVTViewExecuteSimple starts
and stops an application; how to change its behavior to a single-step button is described
in the User’s Manual for ActivView, section 3.4 on page 34.
ActivDataCode / 2008-04-23
39
1
open the sub−tools via the context menu of AVTView
2
switch between the two modes
3
execute a single cycle or start/stop the application
4
select what is to be displayed
and whether ROIs can be edited
5
current execution mode
6
processing time or speed
7
space for messages
Figure 4.2: Customizing and switching between the two execution modes.
the cursor gets “busy”, ActivVisionTools has started a particularly time-consuming operation, e.g., connecting to an image acquisition device. Any interaction on your part is
then deferred to the end of this operation.
6
AVTViewStatus also shows the number of processed cycles and the time needed for the
last processing cycle.
7
AVTViewStatus display two types of messages: Informative messages describe, e.g.,
what the application is doing while it is “busy”, while error messages indicate errors
that prevent the application from working correctly, e.g., the failure to detect a data code
automatically. Note that the failure to find a data code ranks as an information and not
as an error, i.e., the application is not interrupted. You can use ActivDecision to mark
such cases as “not okay”.
If AVTViewStatus is not added to an application, error messages are displayed in popup
dialogs.
More information about AVTViewStatus, e.g., how to modify its appearance, can be found in
the User’s Manual for ActivView, section 3.3 on page 32.
ActivVisionTools 3.2 – Your Fast Track to Solutions
ActivDataCode
4.2 Configuring the Two Execution Modes
40
Tips & Tricks
4.3
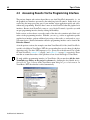
Accessing Results Via the Programming Interface
The previous chapters and sections showed how to use ActivVisionTools interactively, i.e., via
the graphical user interfaces presented by the underlying ActiveX controls. In this mode, you
can develop the image processing part of your machine vision application rapidly and easily,
without any programming. However, there is more to ActivVisionTools than the graphical user
interfaces: Because ActivVisionTools comes as a set of ActiveX controls, it provides you with
an open programming interface, thereby offering full flexibility.
In this section, we show how to access the results of the data code extraction and of their evaluation via the programming interface. With this, you can, e.g., realize an application-specific
graphical user interface, perform additional processing on the results, or send results to a special output device. Detailed information about the programming interface can be found in the
Reference Manual.
As in the previous sections, the examples stem from Visual Basic 6.0; if the (ActivVisionToolsspecific) code differs in Visual Basic .NET, the corresponding lines are also shown (for the first
appearance only). For other .NET languages or C++, please refer to the Advanced User’s Guide
for ActivVisionTools, section 1.2.3 on page 5 and section 1.3.4 on page 28, respectively. Please
note that we assume that readers of this part have at least a basic knowledge of Visual Basic.
!
To work with the programming interface, in Visual Basic 6.0 you must first add the ActivVisionTools type library to the project’s references by checking the box labeled ActivVisionTools Type Library in the Visual Basic menu dialog Project . References. In
Visual Basic .NET, the reference is added automatically.
ActivDataCode / 2008-04-23
4.3 Accessing Results Via the Programming Interface
4.3.1
41
Accessing the Results of Data Code Extraction
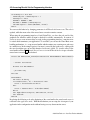
The principal idea behind accessing the results of an ActivVisionTool is quite simple: When a
tool has finished its execution, it raises an event called Finish, sending its results as a parameter.
If you want to access the results, all you have to do, therefore, is to create a corresponding event
procedure which handles the event.
Figure 4.3: Creating a procedure to handle the event Finish .
The variable atToolResults contains the result data for all ROIs of your instance of AVTDataCode. The current number of ROIs can be queried via
Dim iNumROIs As Integer
iNumROIs = atToolResults.ROINum
In Visual Basic .NET , the event handler has a different signature:
Private Sub AxAVTDataCode1_Finish(ByVal sender As Object, _
ByVal e As _
AxActivVTools.__AVTDataCode_FinishEvent) _
Handles AxAVTDataCode1.Finish
A first difference is that tool names start with the prefix Ax, i.e., AVTDataCode becomes AxAVTDataCode . The main difference, however, is that the tool results are not directly passed: instead,
they are encapsulated in the parameter e. From there, they can be extracted with the following
lines:
Dim atToolResults As AVTToolResult
atToolResults = e.atToolResults
To use classes like ACTIVVTOOLSLib.AVTToolResult without the namespace ACTIVVTOOL-
ActivVisionTools 3.2 – Your Fast Track to Solutions
ActivDataCode
Within the Visual Basic environment, you can create event procedures very easily as shown
in figure 4.3: In the header of the form’s code window corresponding to a form there are two
combo boxes. Select the instance of AVTDataCode (by default called AVTDataCode1) in the
left combo box. The right combo box then lists all events available for this object; when you
select Finish, the event procedure is created automatically. Within this procedure, the results
of the data code extraction are now accessible via the object variable atToolResults.
42
Tips & Tricks
SLib as in the code above, you must import this namespace by inserting the following line at
the very beginning of the code (more information about importing namespaces can be found in
the Advanced User’s Guide for ActivVisionTools in section 1.2.4.5 on page 12):
Imports ACTIVVTOOLSLib
The results of a certain ROI can be accessed by specifying its name in a call to the method
ROIResult, or by specifying its index in a call to the method ROIResults. The following code
uses the latter method to access the first ROI of AVTDataCode1:
Dim atROIResult As AVTROIResult
Set atROIResult = atToolResults.ROIResults(0)
Now, we can, e.g., query the number of objects extracted in the ROI via
Dim iNumObjects As Integer
iNumObjects = atROIResult.ObjectNum
Actual results for an object, i.e., the extracted code or the calculated position can be accessed by
specifying the feature of interest and the ID of the object in a call to the method ObjectValue
of ACTIVVTOOLSLib.AVTROIResult. The feature handles are available as methods of the corresponding tool, e.g., AVTDataCode.FeatureHandleCode being the handle for the extracted
code.
The following code fragment uses another method of ACTIVVTOOLSLib.AVTROIResult, ObjectValues, which returns the values of all objects for the specified feature in an array, to
calculate the mean unused error correction of the data codes:
Dim handleUEC As Integer, i As Integer
Dim vUECArray As Variant
Dim dSumUEC As Double, dMeanUEC As Double
handleUEC = AVTDataCode1.FeatureHandleUnusedErrorCorrection
vUECArray = atROIResult.ObjectValues(handleUEC)
dSumUEC = 0
For i = 0 To iNumObjects - 1
dSumUEC = dSumUEC + vUECArray(i)
Next
dMeanUEC = dSumUEC / iNumObjects
As already noted, in Visual Basic .NET tool names are prefixed with Ax, thus the feature handle
is accessed as follows:
handleUEC = AxAVTDataCode1.FeatureHandleUnusedErrorCorrection
ActivDataCode / 2008-04-23
43
Figure 4.4: Accessing and displaying the results of data code extraction.
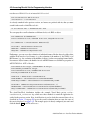
The ActivVisionTools distribution includes the example Visual Basic project resultaccess\datacode_resultaccess.vbp, which uses the methods described above to extend the
application for reading a sequence of data codes introduced in the previous chapter. The task is
to display the extracted code, which identifies hard disks of different sizes. Depending on the
hard disk size, counters for large and small hard disks are updated. To control the overall quality
of the data codes, the mean value of the Grade UEC (unused error correction) feature is also
calculated. The higher the displayed value, the better the overall quality of the data codes (see
figure 4.4). The example project is already configured, just start it and click the button Run in
AVTViewExecute.
Besides accessing the results of data code extraction, the project code contains additional functionality which is explained briefly in the following. Note that the code is only shown for Visual
Basic 6.0; a Visual Basic .NET application with result access can be found in the directory
examples\dotnet\vb\datacode_results.
First of all, the extracted code and the unused error correction is only to evaluated if exactly one
object has been extracted:
ActivVisionTools 3.2 – Your Fast Track to Solutions
ActivDataCode
4.3 Accessing Results Via the Programming Interface
44
Tips & Tricks
If iNumObjects = 1 Then
sCode = atROIResult.ObjectValue(handleCode, 0)
LabelCode.Caption = sCode
dUEC = atROIResult.ObjectValue(handleUEC, 0)
Else
LabelCode.Caption = "<multiple>"
Call SetAlarm
End If
If not exactly one object is extracted, the function SetAlarm stops the application by setting
AVTView’s property RunState to ’False’ and switches the color of the status element below
the image to red. The function ClearAlarm resets the color to green. To test this behavior step
through the images sequence to an image containing two data codes.
Private bIsError As Boolean
Private Function SetAlarm()
AVTView1.RunState = False
Light.BackColor = vbRed
bIsError = True
End Function
Private Function ClearAlarm()
Light.BackColor = vbGreen
bIsError = False
End Function
When calculating the mean unused error correction, one has to keep in mind that AVTDataCode
is executed not only when the next image is grabbed but also whenever you modify its ROI (s)
or parameters. To distinguish the two cases, an event raised by AVTView at the start of each
execution cycle can be used to set a flag called bIsNewCycle:
Private bIsNewCycle As Boolean
Private Sub AVTView1_CycleStart()
bIsNewCycle = True
End Sub
Before calculating the mean values within the handler for AVTDataCode’s event Finish, this
variable is checked (and immediately reset).
ActivDataCode / 2008-04-23
4.3 Accessing Results Via the Programming Interface
45
If bIsNewCycle = True Then
iNumGoodCycles = iNumGoodCycles + 1
bIsNewCycle = False
dSumUEC = dSumUEC + dUEC
dMeanUEC = dSumUEC / iNumGoodCycles
LabelUEC.Caption = Format(dMeanUEC, "Fixed")
End If
When using the programming interface of ActivVisionTools, you leave the safe world of the
graphical user interfaces where all input is checked for validity automatically. In contrast, if
you try to access a non-existent object or result via the programming interface, a run-time error
is caused which terminates your application! To avoid this, you can use the Visual Basic error
handling mechanisms, i.e., set up an error handler which examines any occurring error and reacts
in a suitable way. In the example project, if an error is caused by the result access, a dialog with
the error description pops up and the function SetAlarm is called. To view the effect of the
error handler, uncheck √ Unused Error Correction in AVTDataCodeSettings so that the
unused error correction is not calculated.
Private Sub AVTDataCode1_Finish(atToolResults As ACTIVVTOOLSLib.IAVTToolResult)
’ variable declarations
On Error GoTo ErrorHandler
’ procedure body
Exit Sub
ErrorHandler:
Dim sTitle As String
If Left(Err.Source, 11) = "ActivVTools" Then
sTitle = "ActivVisionTools Error"
Else
sTitle = "Runtime Error " & CStr(Err.Number)
End If
Call MsgBox(Err.Description, vbExclamation, sTitle)
Call SetAlarm
End Sub
By placing the following code at the beginning of the event handler, the actual result access is
restricted to the application mode. With this mechanism you can setup the vision part of your
application in the configuration mode without having to worry about run-time errors.
ActivVisionTools 3.2 – Your Fast Track to Solutions
ActivDataCode
You can test this behavior by changing parameters in AVTDataCodeParameters: The code is
updated, while the mean value of the unused error correction remains constant.
46
Tips & Tricks
If Not AVTView1.ExecutionMode = eApplicationMode Then
Exit Sub
End If
4.3.2
Accessing Evaluation Results
The evaluation results can be accessed similarly to the results of data code extraction; in fact,
they are even stored in the same object. However, to access the evaluation results you now have
to wait for ActivDecision to finish, i.e., create the event procedure
Private Sub AVTDecision1_Finish(atToolResults As Collection)
End Sub
!
Note that you will get a run-time error if you try to access evaluation results before ActivDecision has finished (e.g., in the handler for AVTDataCode’s event Finish!
Because ActivDecision can evaluate the results of more than one tool, the event handler provides
you with a Collection of tool results. The following code fragment searches the collection for
the results of AVTDataCode1 and “stores” them in atDataCodeResult, or exits if no results
are found:
Dim atToolResult As AVTToolResult
Dim atDataCodeResult As AVTToolResult
Dim bDataCodeResultsFound As Boolean
bDataCodeResultsFound = False
For Each atToolResult In atToolResults
If atToolResult.Name = "AVTDataCode1" Then
Set atDataCodeResult = atToolResult
bDataCodeResultsFound = True
End If
Next
If bDataCodeResultsFound = False Then
Exit Sub
End If
In Visual Basic .NET , the event procedure has the following signature:
Private Sub AxAVTDecision1_Finish(ByVal sender As Object, _
ByVal e As _
AxActivVTools.__AVTDecision_FinishEvent) _
Handles AxAVTDecision1.Finish
Again, the tool results are encapsulated in the parameter e. They can be extracted as follows;
ActivDataCode / 2008-04-23
4.3 Accessing Results Via the Programming Interface
47
note the use of VBA.Collection instead of Collection!
Dim atToolResults As VBA.Collection
atToolResults = e.atToolResults
As already remarked in the previous section, tool names are prefixed with Ax, thus you must
search for the results of AxAVTDataCode1:
If atToolResult.name = "AxAVTDataCode1" Then
You can query the overall evaluations at different levels, tool, ROI, or object:
Dim atROIResult As AVTROIResult
Dim bToolIsOK As Boolean, bROIIsOK As Boolean, bObjIsOK As Boolean
bToolIsOK = atDataCodeResult.Evaluation
bROIIsOK = atROIResult.Evaluation
bObjIsOK = atROIResult.ObjEvaluation(0)
Furthermore, you can access the evaluation of individual features like the data code of the object
with the ID 0, but also of tool features (e.g., the evaluation of the number of “bad” ROIs) or of
ROI features (e.g., the evaluation of the number of objects) via the corresponding feature handle.
In contrast to object features, the handles for tool and ROI features are available as properties of
ACTIVVTOOLSLib.AVTToolResult.
Dim
Dim
Dim
Dim
handleCode As Integer, handleBadROIs As Integer
handleObjectsInROI As Integer
bCodeIsOK As Boolean, bBadROIsIsOK As Boolean
bObjectsInROIIsOK As Boolean
handleCode = AVTDataCode1.FeatureHandleCode
handleBadROIs = atDataCodeResult.FeatureHandleBadROIs
handleObjectsInROI = atDataCodeResult.FeatureHandleObjectsROI
bCodeIsOK = atROIResult.ObjFeatureEvaluation(handleCode, 0)
bBadROIsIsOK = atDataCodeResult.FeatureEvaluation(handleBadROIs)
bObjectsInROIIsOK = atROIResult.FeatureEvaluation(handleObjectsInROI)
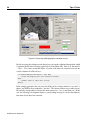
The ActivVisionTools distribution includes the example Visual Basic project evalaccess\datacode_evalaccess.vbp, which uses these methods to extend the application described in the previous section. Now, ActivDecision is used to check the extracted data code as
described in section 3.2 on page 30; in case the overall evaluation shows an error, the cause of
the error is displayed (see figure 4.5). The example project is already configured, just start it and
click the button Run in AVTViewExecute.
ActivVisionTools 3.2 – Your Fast Track to Solutions
ActivDataCode
Set atROIResult = atDataCodeResult.ROIResults(0)
48
Tips & Tricks
Figure 4.5: Accessing and displaying the evaluation results.
Besides accessing the evaluation results the project code contains additional functionality, which
is explained briefly in the following (again only for Visual Basic 6.0!). First of all, the main If
- Then - Else clause around the display of results of the data code extraction now tests the
overall evaluation of AVTDataCode1:
If atDataCodeResult.Evaluation = True Then
’ access and display data code extraction results
Else
’ examine cause of error more closely
End If
In the example application, the only cause for AVTDataCode1 being evaluated as “not okay” is
that its (one) ROI has been evaluated as “not okay”. This in turn can have two possible reasons:
First, that the wrong number of objects has been extracted (i.e., less or more than one). In this
case, the following code fragment displays a corresponding message in a list box that indicates
how many objects have been extracted:
ActivDataCode / 2008-04-23
4.3 Accessing Results Via the Programming Interface
49
If atROIResult.FeatureEvaluation(handleObjectsInROI) = False Then
sErrMsg = "Cycle " & iNumCycles & ": wrong number of objects (" & _
atROIResult.Value(handleObjectsInROI) & ")"
Call DisplayMessage(sErrMsg)
End If
The error message also contains the number of the cycle in which the error occurred. The
corresponding counter is incremented in the handler for AVTView’s event CycleStart which
was introduced already in the previous section:
Private iNumCycles As Integer
A second cause of error is that an object has been evaluated as “not okay”. Again, a corresponding error message is created, this time containing the extracted data code. The following code
shows how to access the indices of all objects evaluated as “not okay”:
Dim badObject As Variant
If atROIResult.FeatureEvaluation(handleBadObjectsInROI) = False Then
’ get all bad objects (cause: bad code)
For Each badObject In atROIResult.BadObjectIndices
sErrMsg = "Cycle " & iNumCycles & ": object " & badObject & _
" has wrong code (" & _
atROIResult.ObjectValue(handleCode, badObject) & ")"
Call DisplayMessage(sErrMsg)
Next
End If
ActivVisionTools 3.2 – Your Fast Track to Solutions
ActivDataCode
Private Sub AVTView1_CycleStart()
iNumCycles = iNumCycles + 1
End Sub
50
ActivDataCode / 2008-04-23
Tips & Tricks
Appendix A
ActivDataCode
Process Control Features
This appendix is a short introduction to the process control features of ActivDataCode.
A.1 Introduction . . . . . . . . . . . . . . . . . . . . . . . . . . . . . . . . . . .
52
A.2 Data Code Production . . . . . . . . . . . . . . . . . . . . . . . . . . . . . .
52
A.3 International Standards . . . . . . . . . . . . . . . . . . . . . . . . . . . . .
53
A.4 Quality Grades . . . . . . . . . . . . . . . . . . . . . . . . . . . . . . . . . .
53
A.5 Available Features . . . . . . . . . . . . . . . . . . . . . . . . . . . . . . . .
53
A.5.1 Symbol Contrast . . . . . . . . . . . . . . . . . . . . . . . . . . . . .
54
A.5.2 Slant . . . . . . . . . . . . . . . . . . . . . . . . . . . . . . . . . . .
54
A.5.3 Unused Error Correction . . . . . . . . . . . . . . . . . . . . . . . . .
55
A.5.4 Axial Nonuniformity . . . . . . . . . . . . . . . . . . . . . . . . . . .
55
A.5.5 Grid Nonuniformity . . . . . . . . . . . . . . . . . . . . . . . . . . .
56
A.5.6 Print Growth . . . . . . . . . . . . . . . . . . . . . . . . . . . . . . .
56
51
52
Process Control Features
A.1
Introduction
The focus of the main part of this manual is about setting up and using ActivDataCode to read
data codes in production environments. Another aspect of data code reading is to judge the
quality of the data codes themselves. It is the focus of this appendix.
Using data codes as a labeling technique in industrial production flows and for retracement
(tracking) purposes is all about automation: A proper use will result in an increase in efficiency
and lower production and maintenance costs. Data codes of bad quality will work against these
goals. Therefore, it is crucial that data codes used for these applications be of high quality.
The process of actually producing data codes and applying them to products or objects requires
immediate feedback to rank their quality in order to guarantee a certain standard of readability.
Getting this kind of feedback is known as data code verification. ActivDataCode can be set up
to calculate common features used for data code verification.
A.2
Data Code Production
There are several methods to mark parts with data codes, some of which include
• ink-jet printing,
• laser,
• dot-peening,
• electro-chemical etch (ECE).
All these methods have their own advantages and deficiencies that influence their usefulness for
different applications. Selecting the right method for your application is beyond the scope of
this manual.
Usually, data code verification should be performed right at the marking station. Not only does
it offer a way to control the overall quality of the data codes with the ability to reject bad parts,
it also allows to monitor the wear and tear of the marking station itself and detect defects and
other problems. This way, reliable labeling of parts with high quality can be achieved.
Images acquired for data code verification should be of high quality and higher resolution than
actually needed for reading purposes. A module size of at least 5 pixels is recommended.
ActivDataCode / 2008-04-23
A.3 International Standards
A.3
53
International Standards
There are several international standards that deal with data code verification. The fundamentals
incorporated in implementing the process control features of ActivDataCode are mostly derived
from the following international standards:
• ISO/IEC 15415 (Information technology — Automatic identification and data capture
techniques — Bar code print quality test specification — Two-dimensional symbols)
• ISO/IEC 16022 (Information technology — International symbology specification —
Data matrix)
• AS 9132 (Quality management systems — “Data Matrix” quality Requirements for Parts
Marking)
It is very important to note, that ActivDataCode does not fully implement these standards.
Thus, ActivDataCode cannot be used to verify that data codes are compliant with any of these
standards. The listed standards require the calculation of the process control features to be
based on a reference decoding algorithm. However, ActivDataCode implements its own decoding algorithm: Its main use is in heavy duty data code reading that is robust even under bad
conditions, something that the reference decoding algorithm is neither capable of nor intended
for. That said, the results from ActivDataCode nonetheless borrow from the listed standards and
apply the same grading system. Therefore, they are very much comparable to results of data
code verifiers actually implementing the standards.
A.4
!
Quality Grades
The quality grades derived from evaluating the process control features are expressed on a scale
from A to D plus a failing grade F, with A representing the highest quality. The overall quality
grade of a data code is the lowest grade of all its individual process control features.
A.5
Available Features
The calculation of the process control features is available from the AVTDataCodeSettings
dialog. The results can be inspected in the AVTDataView dialog (see figure A.1) . Both dialogs
are available by right-clicking on AVTDataCode in your application. In the following sections
ActivVisionTools 3.2 – Your Fast Track to Solutions
ActivDataCode
• ISO/IEC 18004 (Information technology — Automatic identification and data capture
techniques — Bar code symbology — QR Code)
54
Process Control Features
AVTDataCodeSettings
AVTDataCodeView
(Process Control)
Figure A.1: Process control features.
the distinct process control features are introduced. Make sure to check √ Grades to get the
quality grades of the features as well as the overall quality grade of the data code.
A.5.1
Symbol Contrast
This feature tests whether modules and zero modules (i.e., dark and light regions) of the data
code are sufficiently distinct. It does this by calculating the difference of the highest and the
lowest reflectance values. See ISO/IEC 15415 for more information on reflectance values.
Check
√
Symbol Contrast to calculate this feature.
Symbol Contrast
≥ 0.70 (70%)
≥ 0.55 (55%)
≥ 0.40 (40%)
≥ 0.20 (20%)
< 0.20 (20%)
Grade
A
B
C
D
F
Table A.1: Symbol Contrast grading.
A.5.2
Slant
This feature quantifies the slantedness of a data code in degrees. Even though the grading is
very strict, ActivDataCode can read data codes that are slanted up to 30◦ .
Check
√
ActivDataCode / 2008-04-23
Slant to calculate this feature.
A.5 Available Features
55
Slant in ◦
≤ 3.50
≤ 4.65
≤ 5.80
≤ 7.00
> 7.00
Grade
A
B
C
D
F
Table A.2: Slant grading.
This feature quantifies the reserve in error correction that is still available after decoding the
data code. A perfect data code requires no error correction at all, resulting in a value of 1.0 for
this feature. The more defective a data code becomes, the more the inherent error correction
needs to be applied to still be able to decode the data code. Please note that ActivDataCode only
evaluates the total error correction capacity. For large codes with multiple independent error
correction blocks, this is only an approximation.
Check
√
Unused Error Correction to calculate this feature.
Unused Error Correction
≥ 0.62
≥ 0.50
≥ 0.37
≥ 0.25
< 0.25
Grade
A
B
C
D
F
Table A.3: Unused Error Correction grading.
A.5.4 Axial Nonuniformity
This feature evaluates the squareness of the data modules. Ultimately, it judges the aspect ratio
of the data code, resulting in bad quality grades for shrinkage or enlargement in one direction
(uneven scaling).
Please note that this feature is not used for PDF417 due to the variable aspect of modules.
Check
√
Axial Nonuniformity to calculate this feature.
ActivVisionTools 3.2 – Your Fast Track to Solutions
ActivDataCode
A.5.3 Unused Error Correction
56
Process Control Features
Axial Nonuniformity
≤ 0.06
≤ 0.08
≤ 0.10
≤ 0.12
> 0.12
Grade
A
B
C
D
F
Table A.4: Axial Nonuniformity grading.
A.5.5
Grid Nonuniformity
This feature quantifies the deviation of the modules of the data code from their ideal grid. However, a bad value might also be caused by problems with the finder pattern, in which case the
“ideal grid” may not be positioned correctly.
Check
√
Grid Nonuniformity to calculate this feature.
Grid Nonuniformity
≤ 0.38
≤ 0.50
≤ 0.63
≤ 0.75
> 0.75
Grade
A
B
C
D
F
Table A.5: Grid Nonuniformity grading.
A.5.6
Print Growth
This feature quantifies the uniformity of dark and light module sizes, i.e., how appropriately
the modules fill their module boundaries. Depending on the print process of the data code, the
desired module size may be affected. For example, in ink-jet printing the ink may bleed into
the surrounding area causing the background modules to ‘shrink’. The values are calculated
for both horizontal and vertical module sizes (hence Print Growth X and Print Growth Y are
reported). The value 0.0 correlates to a module size of 100%. Negative values denote module
shrinkage, while positive values denote module growth. A quality grade is not calculated for
this feature.
Check
√
ActivDataCode / 2008-04-23
Print Growth to calculate this feature.