1
10
2) xy coordinates (in whatever coordinate system is specified for all input datasets).
3) Values for 8 habitat variables (listed in Table 1 below) for each of the square habitat
cells on a sandbar. Depending on the size of the sandbar, and the default size that is set
for each habitat “cell”, this file may range from a few hundred to >100,000 records.
Table 1. List and description of the 8 habitat variables for which SandbarCreator.py calculates values for
each of the square habitat cells at each site.
Variable
Description
CFSATPOINT
Discharge (CFS) required for the river’s water to intersect the point on the
sandbar
DIST2FE
Distance to the nearest large tree from point on the sandbar
DIST2BANK
Distance to river bank from point on the sandbar
ELEV
Datum-adjusted elevation of point on the sandbar
MXELEVDIFF
Elevation difference between each point and the highest point on the
sandbar
DIST2MXELEV
Distance of each point to the highest point on the sandbar
VEGPT
Sandbar point is vegetated? 1 = yes, 0 = no
DIST2VEG
Distance of each point to vegetated portions of the sandbar, if any
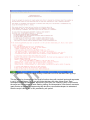
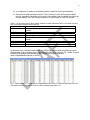
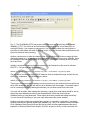
An example of the <sandbar name>data1.csv text file (which has identical information as the
attribute table of the <sandbar name>ClippedDataPts.shp file) is shown in Fig. 7 below. Figure 8
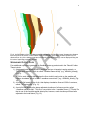
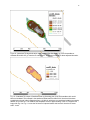
illustrates how habitat covariate data may be displayed using the <sandbar
name>ClippedDataPts.shp file in ArcGIS.
Fig. 7. Attribute table for a <sandbarname>ClippedDataPts.shp file for a sandbar at Arkansas River mile.
This attribute table is exported as a text file called <sandbar name>data1.csv.