1
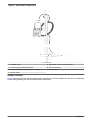
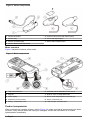
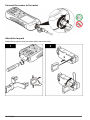
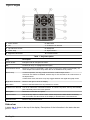
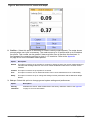
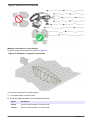
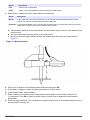
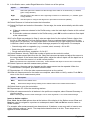
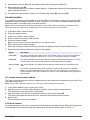
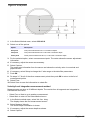
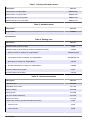
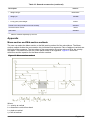
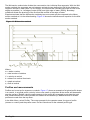
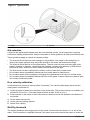
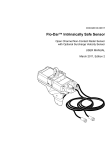
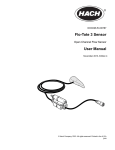
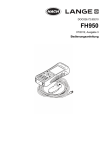
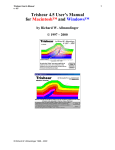
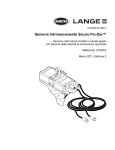
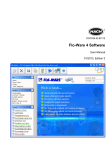
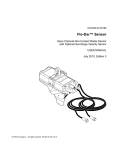
DOC026.53.80210
FH950
04/2014, Edition 4
User Manual
Table of Contents
Specifications ..............................................................................................................3
Sensor specifications ...................................................................................................3
Portable meter specifications ....................................................................................... 3
User interface specifications ........................................................................................4
General specifications .................................................................................................4
General information ..................................................................................................4
Safety information ........................................................................................................5
Use of hazard information ....................................................................................5
Precautionary labels ............................................................................................5
Certification ........................................................................................................... 5
Product overview .........................................................................................................6
System overview ..................................................................................................6
Sensor overview ...................................................................................................7
Meter overview .....................................................................................................8
Product components ....................................................................................................8
Installation .....................................................................................................................9
Installation with optional accessories ........................................................................... 9
Install the sensor on the universal sensor mount ........................................................ 9
Connect the sensor to the meter ...............................................................................10
Attach the lanyard ......................................................................................................10
Attach the velcro strap ...............................................................................................11
User interface and navigation ............................................................................11
Keypad and key functions .......................................................................................... 11
Status bar ..................................................................................................................12
Navigation and Main Menu .......................................................................................13
Startup and self-test ...............................................................................................17
Sleep mode ................................................................................................................ 17
Operation .....................................................................................................................18
Stream profiles ........................................................................................................... 18
Stations and station spacing ............................................................................... 18
Measure velocity ................................................................................................. 18
Measure velocities in a cross-section .......................................................... 19
Insert or delete a station ..............................................................................21
Conduit profiles ..........................................................................................................22
0.9 x Vmax measurement method ...................................................................... 22
0.2/0.4/0.8 method .............................................................................................. 22
Velocity/Level Integration measurement method ............................................... 23
2D measurement method ...................................................................................24
Download data ...........................................................................................................25
Delete data files ..................................................................................................25
Maintenance ...............................................................................................................25
Download the PVM utility ...........................................................................................25
Update the firmware ..................................................................................................25
Clean the sensor ........................................................................................................ 26
Clean the meter .........................................................................................................27
1
Table of Contents
Install or replace the battery ......................................................................................27
Charge the battery .....................................................................................................28
Troubleshooting .......................................................................................................28
Diagnostics ................................................................................................................28
Troubleshoot errors ...................................................................................................29
Replacement parts and accessories ............................................................... 29
Appendix ......................................................................................................................31
Mean-section and Mid-section methods ....................................................................31
Profiles and measurements .......................................................................................32
Site selection .............................................................................................................33
Do a velocity calibration .............................................................................................33
Wet/Dry threshold ......................................................................................................33
2
Specifications
Specifications are subject to change without notice.
Sensor specifications
Specification
Details
Velocity measurement
Method
Electromagnetic
Range
0 to 6.09 m/s (0 to 20 ft/s)
Minimum water depth
3.18 cm (1.25 in.)
Accuracy
±2% of reading ±0.015 m/s (±0.05 ft/s) 0 to 3.04 m/s (0 to 10 ft/s); ± 4% of reading from
3.04 to 4.87 m/s (10 to 16 ft/s)
Resolution
0.01 value < 100; 0.1 value < 1000; 1.0 value ≥ 1000
Zero stability
±0.015 m/s (±0.05 ft/s)
Material
ABS, glass filled
Enclosure rating
IP68
Dimensions (L x W x H) 11.9 x 4.3 x 6.3 cm (4.7 x 1.7 x 2.5 in.)
Cable material
Polyurethane jacketed
Cable lengths
1.5, 6.1, 12.2 and 30.5 m (5, 20, 40 and 100 ft)
Depth measurement
Method
Diaphragm type: absolute pressure with single point calibration
Accuracy (static)
The larger of ± 2% of reading or ± 0.015 m (± 0.504 inches). Steady state temperature
and static non-flowing water.
Range
3.05 m (0-10 ft)
Resolution
0.01 value < 100; 0.1 value < 1000; 1.0 value ≥ 1000
Portable meter specifications
Specification
Details
Pollution degree
2
Protection class
II
Charging temperature
0 to 40 ºC (32 to 104 ºF)
Operating temperature
–20 to 55 ºC (-4 to 131 ºF)
Storage temperature
–20 to 60 ºC (-4 to 140 ºF )
Enclosure rating
IP67
Battery life gauge
Five-segment bar graph
Battery type
Rechargeable lithium ion, 3.7 V, 4.2 Ah
Battery life
18 hours heavy typical day use1; 20 ºC (68 ºF)
Battery charger
External Class III power adapter 100–240 VAC, 50–60 Hz, 0.3 A input; 12 VDC, 1.0 A
output
Dimensions (L x W x H) 21.8 x 9.3 x 5.3 cm (8.6 x 3.7 x 2.1 in.)
English 3
Specification
Details
USB connector
Type Mini-B, 5-pin, rated to IP67 when capped
Material
Polycarbonate with a thermoplastic elastomer (TPE) overmold
1
Defined as 30 minutes of set up, six 1-hour periods of continuous use with an active sensor and the display at
maximum brightness and 30 minutes of sleep mode between use periods, data download and power off.
User interface specifications
Specification
Details
Graphics display
Color, LCD 3.5" QVGA transflective (readable in direct sunlight)
Measurement resolution
0.01 value < 100; 0.1 value < 1000; 1.0 value ≥ 1000
Keypad
Alpha-numeric
Operating modes
Real time, profiling
Profile types
Stream, conduit
Conduit shapes
Circular, rectangular, trapezoidal, 2/3 egg, inverted 2/3 egg
Stream entries
Fixed, non-fixed stations
Noise rejection
User-selectable, 50 Hz or 60 Hz
Units of measure
Velocity: ft/s, m/s, cm/s, mm/s
Flow: ft3/sec, million gal/day, gal/day, gal/min, m3/s, m3/min, m3/hour, m3/day, liters/s,
liters/min
Depth: in., ft, m, cm, mm
Stream flow calculation
Mean-section or mid-section method
Diagnostics
Self test, keypad, display, event log
Conduit profiling methods 0.9 x Vmax, 0.2/0.4/0.8, velocity and level integrator, 2D
Stream profiling methods
1, 2, 3, 5 and 6 point (velocity method - USGS and ISO)
File types
Real-time, profiling, event log
Languages
English, French, Spanish, German, Italian, Dutch, Danish, Swedish, Chinese, Polish,
Japanese, Korean, Portuguese, Slovak, Russian, Hungarian, Bulgarian, Romanian,
Czech, Turkish, Finnish, Greek
General specifications
Specification
Details
Profiles
Data storage for up to 10 profiles with 32 stations per profile
Maximum number of real-time files
Three each with up to 75 readings captured by the user.
Firmware
The sensor and portable meter are field upgradeable via USB
General information
In no event will the manufacturer be liable for direct, indirect, special, incidental or consequential
damages resulting from any defect or omission in this manual. The manufacturer reserves the right to
make changes in this manual and the products it describes at any time, without notice or obligation.
Revised editions are found on the manufacturer’s website.
4 English
Safety information
NOTICE
The manufacturer is not responsible for any damages due to misapplication or misuse of this product including,
without limitation, direct, incidental and consequential damages, and disclaims such damages to the full extent
permitted under applicable law. The user is solely responsible to identify critical application risks and install
appropriate mechanisms to protect processes during a possible equipment malfunction.
Please read this entire manual before unpacking, setting up or operating this equipment. Pay
attention to all danger and caution statements. Failure to do so could result in serious injury to the
operator or damage to the equipment.
Make sure that the protection provided by this equipment is not impaired. Do not use or install this
equipment in any manner other than that specified in this manual.
Use of hazard information
DANGER
Indicates a potentially or imminently hazardous situation which, if not avoided, will result in death or serious injury.
WARNING
Indicates a potentially or imminently hazardous situation which, if not avoided, could result in death or serious
injury.
CAUTION
Indicates a potentially hazardous situation that may result in minor or moderate injury.
NOTICE
Indicates a situation which, if not avoided, may cause damage to the instrument. Information that requires special
emphasis.
Precautionary labels
Read all labels and tags attached to the instrument. Personal injury or damage to the instrument
could occur if not observed. A symbol on the instrument is referenced in the manual with a
precautionary statement.
This is the safety alert symbol. Obey all safety messages that follow this symbol to avoid potential
injury. If on the instrument, refer to the instruction manual for operation or safety information.
This symbol indicates the presence of devices sensitive to Electro-static Discharge (ESD) and
indicates that care must be taken to prevent damage with the equipment.
Electrical equipment marked with this symbol may not be disposed of in European domestic or public
disposal systems. Return old or end-of-life equipment to the manufacturer for disposal at no charge to
the user.
Certification
Canadian Radio Interference-Causing Equipment Regulation, IECS-003, Class A:
Supporting test records reside with the manufacturer.
This Class A digital apparatus meets all requirements of the Canadian Interference-Causing
Equipment Regulations.
Cet appareil numérique de classe A répond à toutes les exigences de la réglementation canadienne
sur les équipements provoquant des interférences.
FCC Part 15, Class "A" Limits
English 5
Supporting test records reside with the manufacturer. The device complies with Part 15 of the FCC
Rules. Operation is subject to the following conditions:
1. The equipment may not cause harmful interference.
2. The equipment must accept any interference received, including interference that may cause
undesired operation.
Changes or modifications to this equipment not expressly approved by the party responsible for
compliance could void the user's authority to operate the equipment. This equipment has been tested
and found to comply with the limits for a Class A digital device, pursuant to Part 15 of the FCC rules.
These limits are designed to provide reasonable protection against harmful interference when the
equipment is operated in a commercial environment. This equipment generates, uses and can
radiate radio frequency energy and, if not installed and used in accordance with the instruction
manual, may cause harmful interference to radio communications. Operation of this equipment in a
residential area is likely to cause harmful interference, in which case the user will be required to
correct the interference at their expense. The following techniques can be used to reduce
interference problems:
1. Disconnect the equipment from its power source to verify that it is or is not the source of the
interference.
2. If the equipment is connected to the same outlet as the device experiencing interference, connect
the equipment to a different outlet.
3. Move the equipment away from the device receiving the interference.
4. Reposition the receiving antenna for the device receiving the interference.
5. Try combinations of the above.
Product overview
The portable velocity system is used in the field, laboratory and municipalities. Turbulent, noisy and
low flows can be measured with this system.
The meter and sensor get velocity information in conduits and streams. These measurements are
important for calibration in municipal wastewater industries, as well as for environmental-impact
evaluations.
Two types of sensor are available: velocity-only and velocity plus depth. This manual covers both
types of sensors. If information applies to a specified type of sensor, this fact is noted in the text.
System overview
An overview of the assembled system is shown in Figure 1. Refer to the documentation supplied with
the individual components or accessories for more information.
6 English
Figure 1 Assembled components
1 Portable meter
5 Adjustable mount for portable meter
2 Sensor height lock/release device
6 Sensor assembly
3 Top setting wading rod (optional accessory)
7 Flow direction
4 Sensor cable
Sensor overview
Figure 2 shows the main sensor components. Instructions for how to attach the sensor on a standard
or top-setting wading rod are supplied with the accessory.
English 7
Figure 2 Sensor components
1 Sensor electrodes
5 Pressure cell (sensors with depth option)
2 Sensor body
6 Sensor with depth option
3 Sensor connection plug
7 Sensor without depth option
4 Sensor attachment thumb screw
Meter overview
Figure 3 shows the features of the meter.
Figure 3 Meter components
1 USB connection port
6 Threaded hole for adjustable meter mount
2 Keypad
7 Slots for velcro or strap attachment
3 Meter display
8 Slot for neck strap attachment threads (2x)
4 Expansion port (not used)
9 Sensor connection port
5 Battery compartment cover
10 Wall-charger connection port
Product components
When purchasing a complete system, refer to Figure 4 to make sure that all components have been
received. If any of these items are missing or damaged, contact the manufacturer or a sales
representative immediately.
8 English
Figure 4 System components
1 Carrying case (with slot for sensor cable)
7 Cloth to dry the sensor
2 USB communication cable
8 Universal sensor mount
3 Adjustable portable meter mount
9 Velcro strap
4 Wall charger and universal plug kit
10 Lanyard
5 Sensor
11 Portable meter
6 Extra thumb screws (4x)
12 Sensor as connected to meter inside case
Installation
Installation with optional accessories
Mount the meter on an optional wading rod for use in low-stage stream environments where the
stream can be waded. Optional accessories let the user take measurements from a bridge or cable
over a stream. A torpedo shaped weight attached below the sensor keeps the sensor in place when
under water. For more information, refer to the documentation supplied with the accessory.
Install the sensor on the universal sensor mount
Use the universal sensor mount to attach the sensor to poles 1 inch or less in diameter. For correct
operation and accurate readings, the front of the sensor must be pointed upstream with the
electrodes in full contact with the flow.
Note: Keep the sensor electrodes free from nonconductive substances such as oil and grease. To remove sensor
contamination, refer to Clean the sensor on page 26.
1. The front part of the sensor is round and contains three electrodes. The sensor has a mounting
hole in back and a thumbscrew on top. Put the mounting shaft of the universal mount in the
mounting hole at the back of the sensor. Make sure that the mounting shaft is completely
engaged with the mounting hole and the thumbscrew is engaged with the groove.
2. Hand tighten the thumbscrew.
3. Move a pole 1 inch or less in diameter through the clamp of the universal sensor mount. Tighten
the clamp.
Note: Instructions for how to mount the sensor on a standard or top setting wading rod are supplied with the
accessory.
English 9
Connect the sensor to the meter
Attach the lanyard
Attach the lanyard to wear the meter safely around the neck.
10 English
Attach the velcro strap
Use the velcro strap to hold the extra cable. Refer to Figure 5.
Figure 5 Attach the velcro strap
1 Loop side
2 Hook side
User interface and navigation
Keypad and key functions
Figure 6 shows the meter keypad. Table 1 gives the functions of each key or key type.
English 11
Figure 6 Keypad
1 Power On/Off
6 Main Menu
2 OK
7 Underscore or decimal
3 Up and Down arrows
8 Backspace
4 Quick Jump
9 Alpha-numeric
5 Right and Left arrows
10 Previous menu
Table 1 Key description
Key
Description
Power On/Off
Energizes and de-energizes the meter.
OK
Confirms an entry or highlighted menu option.
Up and Down arrows
Moves up or down in the display. If the cursor is at the top or bottom of the display, the
cursor wraps to the bottom or top when the UP or DOWN arrow is pushed.
Quick Jump
In normal operation, this key jumps to the Select conduit shape screen.
If the auto-zero feature is disabled, hold this key for five seconds to do a manual zero of
the depth sensor.
In Real-Time mode, the Quick Jump key toggles between the digital and graph views.
Right and Left arrows
Moves to the right or left in the display.
Main Menu
Moves to the Main Menu from any submenu or screen.
Underscore or decimal Puts in an underscore or decimal character. In numeric-only fields, this key automatically
puts a decimal point in the cursor position.
Backspace
Moves the cursor back one space.
Alpha-numeric
Puts in the key alpha or numeric value. Values are put in the order shown on the key.
After 2 seconds, the value shown in the display is stored and the cursor advances.
Previous menu
Moves to the previous screen.
Status bar
A status bar is shown in the top of the display. Descriptions of the information in the status bar are
given in Table 2.
12 English
Table 2 Status bar indicators
Indicator
Description
Time and Date
Shows the current time and date.
USB
Shows when a USB cable is connected. If a USB cable is connected and this indicator
does not show in the status bar, the USB cable is not fully engaged. Make sure that the
USB cable is pushed in completely and makes full contact with the connection port.
Conductivity
If the sensor is out of the water and non-conductive, a blue ring appears next to the
battery icon. If the sensor is in the water and conductive, the indicator is a solid blue
circle.
Battery
A five-bar graph shows the level of charge in the battery.
File access
Shows while the meter gets access to a file.
Auto zero depth
indicator
If the depth sensor was zeroed in the last 30 minutes, a solid green circle shows next to
the Conductivity indicator. If the depth sensor was not zeroed in the last 30 minutes,
this indicator flashes red.
Navigation and Main Menu
Push OK to confirm a selected menu option or a value shown in the display. Select More and push
OK to see additional screens and options if available. Push the Main Menu button to go to the Main
Menu from a submenu.
Note: Some operations cannot be completed unless a sensor is connected to the meter. If these operations are
tried when there is no sensor connected, the display shows an error message. Connect a sensor and try the
operation again.
1. Real time—Select this option to get real-time velocity and depth information. (A sensor with
depth capability is necessary to read depth). An example of a Real Time screen for sensors with
velocity only is shown in Figure 7. Real time screens for sensors with both velocity and depth is
shown in . The format of the information and options shown depends on the type of sensor used.
In Real Time mode, the Quick Jump key toggles between digital and graphic views of Real Time
information. The velocity is updated in FPA filter mode according to fixed period averaging time.
In RC filter mode, the velocity is updated continuously on the screen every 250 ms.
Option
Description
Capture
Stores the depth and velocity information shown in memory. The information is saved until
power is cycled, the memory is saved to a non-volatile real-time file, or the user exits from realtime mode.
Save
Saves captured measurements in the volatile memory to a non-volatile real-time file. A
message will show if the number of files is greater than the maximum possible. Files are
stored in tab delimited (.tsv) format.
Done or OK
Exits the real-time mode and returns to the Main Menu. If there is unsaved data in volatile
memory, a confirmation message asks the user to confirm the exit without saving the data.
Clear
Clears captured measurements from the volatile memory buffer. The user can choose from
Clear Last, Clear All or Cancel options.
English 13
Option
Description
Setup
Allows the user to modify the main filter parameters and enable and program the Maximum
Depth sensor positioning feature. The Maximum depth feature allows a user to enter system
parameters for depth measurement in Real Time mode. The user can choose to enter a
maximum depth value taken directly with a ruler measurement (manual), or taken indirectly
with the depth measurement (automatic). Both methods enable the Maximum Depth sensor
positioning feature.
In automatic mode setup, the user directly enters the distance from the bottom of the channel
to the bottom of the sensor mount (offset). The setup interface will continuously show the
current depth value returned by the sensor plus the offset. The meter stores this value as the
Maximum Depth when the OK button is pushed. In all other cases, the depth values shown do
not include the offset.
The Maximum depth feature requires a sensor with velocity plus depth.
Files or
View
Shows a summary of each real-time file stored in non-volatile memory. Files can be
individually viewed and deleted.
Figure 7 Real time screen
14 English
Figure 8 Real time screen for sensor with depth
2. Profiler— Select this option to do stream or conduit velocity measurements. The meter shows
prompts when user input is necessary. The meter saves up to 10 profiles with up to 32 stations
per profile. This number can be greater if data acquisition time is less than the maximum. A
percentage of the remaining memory is given in 1% resolution. Refer to the Appendix
on page 31 for more information about profiles.
Option
Description
Stream
This option is used to set up a profile for a stream or flowing channel. Do velocity measurements to
calculate total discharge based on ISO 748 or USGS standards for Mid-section or Mean-section
methods.
Conduit This option is used to set up a profile for a conduit.
Files
This option is used to view or delete stored files. Files can be deleted all at once or individually.
Setup
This option is used to set up or change the settings for filter parameters and the Maximum Depth
feature.
3. Set up—Select this option to change general system settings and preferences.
Option
Description
Velocity
calibration
Calibrates the sensor. Adds a field offset to the factory calibration. Refer to the Appendix
on page 31 for more information.
English 15
Option
Description
Filter
parameters
Applies a data acquisition filter (Main filter or Pre-filter). The user can select the filter
parameters.
Main filter
• Fixed Period Averaging (FPA)—Fixed Period Averaging averages data over a user
selectable fixed period of time (1 to 480 seconds). The default is 10 seconds. If the FPA
value is 5, the velocity value shown in the display is updated once every 5 seconds.
• RCA time constant—The RC filter helps smooth out turbulence through the use of a
selected time constant in the filter algorithm. This mode is useful when searching for a
maximum velocity, for example in the common 0.9 x Vmax profile method. High RC filter
time constants give higher degrees of smoothing. The time constant can be set from 2 to
20 seconds, with a default value of 6. At 1 time constant, the filter settles to
approximately 60% of the final value. At 5 time constants, the filter settles to 99.9% of
the final value. Thus, if the RC value is set to 2, the final value shows after 10 seconds.
Pre-filter
• Median filter—The filtering process is done in the sensor. The feature can be disabled.
However, the recommended (default) value is 5. Enable the feature to enter or change
this value.
Wet/dry
threshold
Sets the sensor submersion threshold for wet and dry conditions. The default value is 20%.
Refer to Wet/Dry threshold on page 33 for more information.
Auto zero
depth
Sets the Auto Zero feature to On or Off.
If set to On, the instrument does an air calibration when the sensor is removed from the
water and is in the air. To do the air calibration, the instrument automatically zeroes the
sensor.
If set to Off, the user can manually zero the sensor. To do this, remove the sensor from the
flow, then push and hold the Quick Jump key for five seconds.
When the sensor has been in the flow for 30 minutes, the green circle in the upper right
corner goes from green to red. This is a prompt to the user to remove and zero the sensor
again.
EMI
Sets the local line frequency for ambient noise rejection to 50 Hz or 60 Hz (default).
Clock
Sets the date and time of the portable meter in 24-hour format. Daylight savings time is not
supported.
USB
Sets the USB mode.
• Mass Storage (default)—This mode operates like a memory stick or hard drive. Files are
read-only.
• CDC—This mode is used to update firmware.
Language
Selects the language used in the menus.
Units
Sets the units for velocity, flow and depth measurements. Options are Metric or English
(default).
Beeper
On (default) or Off. If set to On, the meter makes an audible tone when the sensor is at the
correct depth for applicable profile methods. The meter also makes an audible tone when
an inactive button is pushed in any menu. This feature is available only with the optional
depth sensor.
Flow
calculation
Selects the method of flow calculation for open water segment (stream profiles only).
Options are Mean-section or Mid-section. Refer to the Appendix on page 31 for more
information.
16 English
Option
Station entry
Restore
defaults
Description
• Fixed—The operator puts in the width of the stream and the number of stations for
measurements. The meter divides the cross-section into evenly spaced distances
between the station verticals.
• Non-fixed (default)—The operator selects the spacing between station verticals. This is
the more commonly used option as it lets the operator include obstructions and other
restrictions in the cross section.
Sets all meter options to the factory default values.
4. Diagnostics— Select this option to troubleshoot problems with the meter or an attached sensor.
For more information about the Diagnostics options, refer to Diagnostics on page 28.
Startup and self-test
DANGER
Chemical or biological hazards. If this instrument is used to monitor a treatment process and/or
chemical feed system for which there are regulatory limits and monitoring requirements related to
public health, public safety, food or beverage manufacture or processing, it is the responsibility of the
user of this instrument to know and abide by any applicable regulation and to have sufficient and
appropriate mechanisms in place for compliance with applicable regulations in the event of malfunction
of the instrument.
WARNING
Fire and explosion hazards. Do not use or store the instrument in direct sunlight, near a heat source or
in high temperature environments such as a closed vehicle in direct sunlight. Failure to take this
precaution can make the battery overheat and cause a fire or explosion.
The battery must be installed in the meter and charged before use. For more information about
battery installation and replacement, refer to Install or replace the battery on page 27. For
information on how to charge the battery, refer to Charge the battery on page 28.
Note: The meter is not operational while the battery charges.
1. Push the meter power button until an audible beep is heard.
The meter does a self test and the display shows the results. If the meter fails the self-test, the
display shows FAIL next to the failed parameter. If the sensor fails, attach a different sensor if
available.
2. When the self test is complete, push OK to go to the Main Menu.
3. To de-energize the meter, push the power button again. In the Confirmation screen, select Yes
and push OK.
If the portable meter becomes unresponsive, push and hold the power button for more than
3 seconds to force the power off. Do not force off the power in normal operation or when the file
access icon is visible.
Sleep mode
The meter backlight goes dim after 30 seconds of no activity and goes into sleep mode after
60 seconds of no activity. These actions do not occur if the meter is in real-time mode or while the
meter is measuring. After 30 minutes in sleep mode, the meter power goes off.
To cancel the sleep mode, push any key. The display brightness goes back to the normal level and
all keys go back to their normal functions.
English 17
Operation
Stream profiles
Stations and station spacing
For a well-chosen cross-section, division into 25 to 30 partial sections is typically sufficient. If the
cross-section is very smooth and the velocity distribution very consistent, it is possible to decrease
the number of stations.
Make the distance between the partial stations so that no individual station contains more than 10%
of the discharge. The ideal measurement is one in which each partial station contains 5% or less (≤
5%) of the total discharge, but this is rarely possible when 25 stations are used. Partial stations
should not have equal widths across the entire cross-section unless the discharge is well-distributed.
Distances between stations are generally smaller where water depth and flow velocities change
significantly. Places where depth and velocities frequently change significantly include bank areas,
vertical or steep slopes, ledges in divided cross-sections and transitions from the main stream bed to
the foreland. Stations should also be located at points of significant changes in the stream bed
profile.
The measurement cross-section must be set at right angles to the direction of flow. Cross-sections
must not contain still areas, counter currents or eddies. Do not put the sensor in deep pools, below
large inflows, or near ship moorings, ferries or sluices.
Use Table 3 as a guide for the number of stations necessary for an acceptable measurement. The
information is based on EN - ISO 748 standards.
Table 3 Number of stations in relation to the waterway width
Feet
Meters
Number of stations
< 1.6
< 0.5
5 to 6
> 1.6 and < 3.3
> 0.5 and < 1
6 to 7
> 3.3 and < 9.8
> 1 and < 3
7 to 12
> 9.8 and < 16.4
> 3 and < 5
13 to 16
> 16.4
≥5
≥ 22
Measure velocity
Measurement quality is dependent on the correct selection of a measurement cross-section. Select a
section of stream with the following characteristics:
• The flow directions at each measurement point across the stream are parallel to the bank and
perpendicular to the cross-section.
• The streambed is stable and free of large rocks, weeds and protruding obstructions such as piers
that cause turbulence.
It is often not possible to completely satisfy all of these conditions. Use the criteria to select the best
possible section and then select a cross-section.
The general procedure to take velocity measurements in river and stream profiles is described below.
Make the first measurement in a stream profile at the top. Make each subsequent measurement
below the last one.
• In fixed mode, divide the channel into stations of equal width.
• Conduct a velocity measurement at each station. The portable meter shows and stores the depth
and measured velocity information.
• When the stream profile is completed, the meter automatically calculates the total flow.
For accurate measurement results, stand to the side of the instrument. Refer to Figure 9.
18 English
Figure 9 Position of user in the flow
Measure velocities in a cross-section
A typical stream cross-section is shown in Figure 10.
Figure 10 Example of a typical cross section
To measure velocities in a cross-section:
1. In the Main Menu, select Profiler.
2. Enter the Operator name. A list of options will show.
Option
Description
Stream
Used for measurements in a stream profile.
Conduit
Used for measurements in a conduit profile.
English 19
Option
Description
Files
Used to view or delete files.
Setup
Used to set up filter parameters and the Maximum depth feature.
3. Select Setup > Maximum depth. Select Manual or Automatic.
Option
Description
Manual
In this mode, the instrument prompts the user to manually enter the maximum depth of each
vertical. This value is normally obtained from a wading rod.
Automatic In this mode (available only on sensors with the depth option), the instrument uses the pressure
transducer to measure the maximum depth at each vertical.
a. If Automatic is selected, enter the distance from the bottom of the channel to the bottom of the
sensor mount.
b. Put the sensor at the lowest position on the wading rod.
c. Enter the minimum depth (measured from the bottom) that the sensor can read. Refer to
Figure 11.
Figure 11 Minimum depth
4.
5.
6.
7.
Select Top or Bottom for the measurement reference then push OK.
If necessary, change or update the filter parameters in Profiler Setup.
In the Profiler menu, select Stream.
Enter a name for the stream profile. Make profile names alpha-numeric with a maximum of
11 characters. Push OK to save the profile name or select Clear to delete all current stream
profile data.
8. Enter the stage reference. This is typically an elevation value from an immovable object such as a
survey marker or bridge, etc.
20 English
9. In the Station menu, select Edge/Obstruction. Select one of the options.
Option
Description
Left
Select this option if the station is at the left edge of the water or an obstruction (i.e, sandbar,
pylon or large boulder).
Right
Use this option if the station is at the right edge of water or an obstruction (i.e., sandbar, pylon
or large boulder).
Open water Use this option to configure the edge as an open water environment (default).
10. Select Distance to Vertical and enter the information.
11. Select Set Depth and enter the information. If at an edge, the meter automatically sets this value
to 0.00.
a. If Manual mode was selected in the Profiler setup, enter the total depth of water at this vertical
position.
b. If Automatic mode was selected in the Profiler setup, push OK to set the maximum flow depth
at the value shown.
12. If Left or Right was selected in Step 9, enter an edge factor for the vertical. Select a factor from
the list or User-defined. For User-defined values, enter a roughness factor between 0.50 (very
rough) and 1.00 (smooth). The roughness factor is relevant only for right angled cross sections. It
is used as a factor in the calculation of the discharge proportion of edge areas. For example:
• Smooth edge with no vegetation (e.g., concrete, steel, cement)— 0.8 to 0.9
• Brick sides with vegetation— 0.7
• Rough walls with heavy vegetation—0.6 to 0.5
13. Select Measure Velocity. Select the number of points on the vertical to collect.
14. Select a measurement point from the list. Obey the instrument prompts and adjust the sensor to
the correct depth. If the sensor has a depth option, adjust the sensor depth until the depth box is
green. This means the sensor is in at the correct position.
Note: Red indicates more adjustment is necessary. Yellow indicates the depth is close to the correct depth.
15. Select Capture to start the measurement process.
16. If necessary, the setup can be changed and the measurement can be repeated. When the
measurement is complete, push OK to store the data.
17. Repeat steps 13–16 for the other measurement points on the vertical.
18. When all measurements for the station are complete, select Main or Verify. results. Push OK to
return to the list of measurement points.
Option
Description
Main
Returns to the station menu.
Verify
Shows the average velocity reading for the station based on the measurement method.
19. Select Next to go to the next station.
20. Repeat steps 10–19 for the remaining stations.
21. When all measurements for all stations in the profile are complete, select Channel Summary to
view the results.
Note: A warning flag will show if the discharge in one or more segments is > 5% of the total discharge.
Insert or delete a station
Prev, Next, Ins and Del options show at the bottom of the display in the Station screen. Prev and
Next are used to navigate to a previous or subsequent station. Ins and Del are used to insert or
delete a station.
For example, after measurements have been done at 10 stations, a user may wish to insert a new
station between stations 3 and 4. The steps below describe how to do this. These steps can be
applied in similar situations.
English 21
1. Select Prev and push OK until the display shows the information for Station 3.
2. Select Ins and push OK.
The instrument adds a new station named Station 4. Subsequent stations are automatically given
new sequential numbers.
3. To delete the current station (when in non-fixed mode), select Del and push OK.
Conduit profiles
It is possible to use all of the methods for conduit profiles in this section in sites with a typical profile
shape and sufficient depth to measure 3-point velocities. The 0.9 x Vmax method can also be used
when the depth is not sufficient for multi-point profiles.
Note: In typical conduit profiles, the first measurement is made at the bottom. Subsequent measurements are
made above the one made before. A different procedure may be necessary for some profiles.
1.
2.
3.
4.
5.
In the Main Menu, select Profiler.
Enter the operator name.
In the list of options, select Conduit.
Enter a name for the new Conduit profile.
Select the conduit shape.
Note: The input screens that show next depend on the shape selected.
6. Enter values at the screen prompts.
When the necessary values have been entered, the display shows the Select Method menu.
7. Select a profile method and do the steps for the method.
Option
Description
0.9 x Vmax
The meter calculates flow based on 90% of the fastest velocity. This is the recommended
method when the depth is less than 12.7 cm (5 in.) or when the velocity is not stable.
0.2/0.4/0.8
The meter calculates the flow value based on velocity measurements taken at 0.2, 0.4 and
0.8 x the depth. One and two-point versions of this method are also possible.
Vel./Lev. Integ. The meter integrates 10 separate velocity and level measurements to calculate the flow
level.
2D
The sensor collects information while constantly moved through the flow in a specified
pattern. The meter calculates the flow value when the user selects Save. This method is
recommended for flows where a difference of 30% or more exists between the right and left
side velocities.
0.9 x Vmax measurement method
The meter uses the maximum velocity measurement in the conduit and multiplies this value by 0.9 to
calculate the total flow.
Note: The RC filter mode with a value of 2 to 4 seconds is recommended for this method.
1. In the Select Method menu, select 0.9 x Vmax.
2. With the sensor in the flow, select Measure Velocity to get a velocity measurement.
The measured values are shown on the graph.
3. Move the sensor until a point of maximum velocity is found, then push OK.
The meter calculates and shows the flow, maximum and average velocity values.
4. Select Save.
The information is saved to a data file.
0.2/0.4/0.8 method
Do measurements at one, two or three points to calculate an average velocity. Each point represents
a percentage of the maximum depth as measured on the center line as shown in Figure 12.
22 English
Figure 12 2-4-8 profile
1. In the Select Method menu, select 0.2/0.4/0.8.
2. Select one of the options.
Option
Description
One point
One-point measurement at 0.4 x maximum depth
Two point
Two-point measurement at 0.2 and 0.8 x maximum depth
Three point
Three-point measurement at 0.2, 0.4 and 0.8 x maximum depth
3. For the selected option, select a measurement point. The meter shows the sensor adjustment
information.
4. If necessary, adjust the sensor as necessary.
5. Select Capture.
The meter gets information from the sensor and shows the velocity value in numerical and
graphical form.
6. If necessary, select Setup to change the Y-axis range or the data filter parameters.
7. Push OK.
8. Do steps 3–7 for all of the other measurement points then push OK to return to the list of
measurement points.
9. Select Flow.
10. Select Save to save the information to a data file.
Velocity/Level Integration measurement method
Measurements are done at 10 different depths. The results from all segments are integrated to
calculate the flow value.
• Select Prev or Next to go to another measurement.
• Select Main to return to the Select Method menu.
1. In the Select method menu, select Vel./Lev. Integ.
The display shows the first measurement screen.
2. Select Measure Velocity.
The sensor depth information is shown.
3. If necessary, adjust the sensor depth as shown.
4. Select Capture.
English 23
5.
6.
7.
8.
9.
The handheld unit gets information from the sensor and shows the average velocity value in
numeric and graphical form.
If necessary, select Setup to change the Y-axis range in FPA filtering mode, the X and Y-axis
range when in RC filtering mode or the data filter parameters.
Push OK to confirm the information.
Select Next. The next measurement screen in the series appears.
Do steps 2–7 for the other measurement depths.
Select one of the options at the bottom of the screen.
Option
Description
Save
Calculates the current flow value and saves this information to a data file.
Units
Changes the unit type (English or Metric).
2D measurement method
Velocity is measured while the sensor is moved through the flow as shown in Figure 13.
Select Cancel at any time to cancel the measurement and return to the Select Method menu.
Note: The RC filter mode with a value of 2 to 4 seconds is recommended for this method.
1. In the Select method menu, select 2D.
The sensor depth information is shown.
2. If necessary, adjust the sensor depth.
3. Select Capture. While the sensor collects data, move the sensor through the entire cross-section
in the pattern shown in Figure 13.
4. If necessary, select Setup to change the Y-axis range in FPA filtering mode, the X and Y-axis
range when in RC filtering mode or the data filter parameters.
5. Push OK.
6. Select one of the options shown at the bottom of the screen.
Option
Description
Save
Calculates the current flow value and saves this information to a data file.
Units
Changes the unit type (English or Metric).
Figure 13 Path of the sensor in the flow
1 Start
24 English
2 Finish
Download data
The meter directory is Read Only. In Windows, the meter operates as a mass storage device or
removable hard drive.
1. Set the meter to USB Mass Storage mode.
2. To edit the data in a file, drag and drop the file to a laptop or PC. File names are limited to eight
characters.
®
3. Data files are kept in the tab separated variable (.TSV) format. To see files in Microsoft Excel,
double or right-click a file and open the file with Excel.
Real time files are stored in a directory called RT. Stream and conduit profile files are stored in a
directory called P.
Delete data files
1. To delete all files from USB memory:
a. Go to Main Menu > Diagnostics > Delete Files.
b. In the confirmation window, select Yes.
c. Push OK once to delete the files, then one more time to return to the previous screen.
2. To delete Real Time files:
a. Go to Main Menu > Real-Time > Files.
b. Select Delete All or use the UP or DOWN arrow to select a file in the list.
c. Push OK once to delete the files, then one more time to return to the previous screen.
3. To delete Profiler files:
a. Go to Main Menu > Profiler > Files.
b. Select Delete All or use the UP or DOWN arrow to select a file in the list.
c. Push OK once to delete the files, then one more time to return to the previous screen.
Maintenance
Download the PVM utility
The PVM utility is used to update the firmware in the portable meter. The PVM Utility is available at
http://www.hach.com or http://www.hachflow.com. Do the steps listed for the selected URL.
1.
2.
3.
4.
5.
6.
7.
Go to http://www.hach.com.
Search for FH950.
Select the product.
Click the Downloads tab.
Click the download link.
Click PVMSetup.msi.
Select Save or Run.
1.
2.
3.
4.
5.
6.
Go to http://www.hachflow.com.
Click Data Management.
Click Software Download Center.
Click the FH950 link.
Click PVMSetup.msi.
Select Save or Run.
Update the firmware
Note: All data files in mass storage are lost when the firmware is updated. To download data, refer to Download
data on page 25.
English 25
The PVM Utility is necessary for this procedure. To download the PVM Utility, refer to Download the
PVM utility on page 25.
This is the general procedure to update firmware for the meter and sensor. To update the sensor
firmware, the sensor must be connected to the meter.
1.
2.
3.
4.
5.
6.
7.
Double-click the PVM Utility desktop icon.
Push the power button on the meter. When the meter self-test is complete, push OK.
In the Main Menu, select Setup, then push OK.
Select USB>CDC, then push OK.
Connect the USB cable to the portable meter and the PC.
In the PVM Utility window, select Connect.
In the drop-down menu, select the PVM (COM X) port, where COM X is the virtual port number
assigned to the PVM by Windows. Push OK.
8. In the left-side panel, select Firmware Update, then select the Meter or Sensor tab.
9. Select the correct firmware version, then click Start.
The firmware download starts. A "Firmware update successful" message shows when the
download is complete. For meter updates, the instrument display turns off until the instrument
completes the update. Then, the instrument automatically resets and powers up again after a few
minutes. Do not try to make the instrument power on or off before the update process is
complete.
10. In the Main Menu, select Diagnostics > About. Make sure that the firmware versions for both the
Handheld Boot and the Handheld Application are correct.
Clean the sensor
WARNING
Chemical exposure hazard. Obey laboratory safety procedures and wear all of the personal protective
equipment appropriate to the chemicals that are handled. Refer to the current safety data sheets
(MSDS/SDS) for safety protocols.
Clean the sensor when unexpected increases or decreases in flow or level trends occur and after
use in sandy or muddy waterways.
For heavy contamination, soak the sensor in clear water for a few minutes to help make the
contamination easy to remove.
Disconnect the sensor from the meter before it is cleaned. Use only solutions listed as acceptable in
Table 4 to clean the sensor. For sensors with a pressure cell (i.e., velocity plus depth sensors), make
sure the holes for the pressure cell chambers are washed out and clear of contamination. Rinse the
sensor with clean water before re-attaching the sensor to the assembly.
Table 4 Acceptable and unacceptable cleaning solutions
Acceptable
Do not use
Dish detergent and water
Concentrated bleach
Window cleaner
Kerosene
Isopropyl alcohol
Gasoline
Aromatic hydrocarbons
26 English
Clean the meter
1. Push the power button to de-energize the meter.
2. Use a clean, moist cloth to clean the meter exterior. Mix the water with a mild detergent if
necessary.
3. Dry the meter exterior with a clean cloth. Let the meter dry in air completely before it is energized
again.
Note: Do not use paper-based cloths to clean the display. This type of cloth can cause damage to the display
screen.
Install or replace the battery
WARNING
Personal injury hazard. This instrument contains one or more batteries. To prevent battery degradation,
leakage or explosion, do not use or keep the instrument in places where the temperature is higher than
the specified temperature limits of the instrument.
WARNING
Fire and explosion hazards. Battery substitution is not permitted. Use only batteries that are supplied by
the instrument manufacturer.
WARNING
Multiple hazards. Do not disassemble the instrument for maintenance. If the internal components must
be cleaned or repaired, contact the manufacturer.
NOTICE
Discard used batteries promptly. Keep used batteries away from children. Do not disassemble the battery or
discard the battery in fire.
The instrument is shipped without the battery installed. Order new batteries from the instrument
manufacturer. Refer to Replacement parts and accessories on page 29. Recycle or discard used
batteries in accordance with local regulations.
Note: If the instrument must be returned to the factory for repair or maintenance, remove the battery and put the
battery in a protective cover before shipment.
1.
2.
3.
4.
If necessary, remove the used battery as shown in Figure 14.
Install a new battery in the same location and with the same orientation.
Install the battery cover. Make sure that the cover is secure to keep the enclosure rating.
Charge the battery if necessary. Refer to Charge the battery on page 28.
English 27
Figure 14 Remove the battery
Charge the battery
Make sure that the correct plug-type for the geographic location is installed on the wall charger.
Note: Battery charger substitution is not permitted. Use only the charger specified in the list of parts and
accessories for the instrument. Refer to Replacement parts and accessories on page 29.
A lithium ion battery in the meter supplies power to both the meter and the sensor. Install and charge
the battery before the instrument is used.
A full battery charge will supply power to the system for approximately 10–11 hours with constant
use. When the level of battery charge drops to 3.4 V or less, the display shows a warning and the
meter automatically powers off. The battery must be charged before the unit becomes functional
again.
1. Connect the round end of the charger cable to the power jack of the portable meter. Refer to
Figure 3 on page 8.
2. Connect the wall charger plug to a power outlet.
A blue light shows around the charge port while the battery charges. When the charge process is
complete, the blue light goes off. A discharged battery gets a full charge in about 8 hours.
Note: The meter is not operational while the battery charges. The battery does not charge through the USB
cable connection.
Troubleshooting
Diagnostics
In the Main Menu, select Diagnostics to see information about the meter and do the diagnostic tests
in Table 5.
Table 5 Meter diagnostics
Option
Description
About
Shows information about the meter and the sensor. Includes the serial number and the firmware
version.
Delete files
Deletes all files from memory to make space for new measurements. Make sure that the data is
downloaded to a PC before this option is selected. The system automatically reformats the
memory after file deletion.
Sensor
Shows diagnostic information about the sensor.
Self test
Makes the meter do a diagnostic self test.
Key pad test Does a test of any button to make sure that the button is functional.
28 English
Table 5 Meter diagnostics (continued)
Option
Description
Display test
Does a test on the display to make sure that the display is functional.
Event log
Lets the user see, delete or export the event log. Export the event log to make the contents
available as an accessible file through USB mass storage. This option is used primarily by factory
service.
Troubleshoot errors
The meter and sensor contain no user-serviceable parts. For the errors and messages listed, try the
corrective action.
If the problem does not go away or a problem occurs that is not in the list, contact the manufacturer.
Message or problem
Solution
Sensor is not connected
Connect a sensor and try the action again.
Value is out of range
Change the measurement parameters or put in a different value, then
try the action again.
Sensor data is known to be not correct
or not accurate
Clean the sensor and test.
Sensor is not recognized
Check the sensor connection. Make sure that the lock nut on the
connection port is tight (finger-tighten only).
Display is dim or is not visible
Push a key on the keypad.
Data is not available or access to the
data is not possible
Make sure that the USB option (Main Menu) is set to Mass Storage.
Meter is unresponsive
Push and hold the power button for at least 3 seconds. This deenergizes the meter. Energize the meter again.
Note: Do not use this method to power off while in normal operation or if the file
access icon is visible in the display.
Replacement parts and accessories
WARNING
Personal injury hazard. Use of non-approved parts may cause personal injury, damage to the
instrument or equipment malfunction. The replacement parts in this section are approved by the
manufacturer.
Note: Product and Article numbers may vary for some selling regions. Contact the appropriate distributor or refer to
the company website for contact information.
Replacement parts
Table 6 Velocity only sensor
Description
Item no.
Sensor with 1.5 m (5 ft) cable
EM950.0005
Sensor with 6.1 m (20 ft) cable
EM950.0020
Sensor with 12.2 m (40 ft) cable
EM950.0040
Sensor with 30.5 m (100 ft) cable
EM950.0100
English 29
Table 7 Velocity with depth sensor
Description
Item no.
Sensor with 1.5 m (5 ft) cable
EM950.1005
Sensor with 6.1 m (20 ft) cable
EM950.1020
Sensor with 12.2 m (40 ft) cable
EM950.1040
Sensor with 30.5 m (100 ft) cable
EM950.1100
Table 8 Handheld meter
Description
Item no.
English/Metric
FH950.1
Accessories
Table 9 Wading rods
Description
Item no.
Standard wading rod kit, English
75002
Standard wading rod kit, Metric (includes the bullet items below)
75002M
• Bottom section for wading rod, English/Metric
43000M/43001M
• Intermediate section for wading rod, English/Metric
43010M/43011M
• Base plate for wading rod, English/Metric
43015M
• Double-end hanger for wading rod, English/Metric
43020M
Top set wading rod kit, English
75013
Top set wading rod kit, Metric
75013M
Table 10 General accessories
Description
Item no.
Absorbent wipe
9073500
Adjustable meter mount
9071700
Battery charger
9072600
Carrying case
9073400
Lanyard, double ended loop
9072700
Lithium ion battery
Suspension cable kit (includes bulleted items
9113100
below)1
75003
• Sensor mount
42033
• Link connector
43025
30 English
Table 10 General accessories (continued)
Description
• Weight hanger
Item no.
43030XX01
• Weight pin
43035M
• 6.8 kg (15 lb) lead weight
43040
Thumb screw kit (includes four thumb screws)
Universal sensor mount
USB cable
1
9073200
75015
9070800
Cable is ordered separately by the foot.
Appendix
Mean-section and Mid-section methods
The user can select the Mean-section or the Mid-section method for flow calculations. The Meansection method divides the cross-section into individual flow segments. Pairs of adjacent verticals are
the limits of the segments. The two edges of the cross-section are given values of 0 for the velocity
and depth. The total flow is the sum of the partial flows of all segments. Figure 15 shows the
definitions and the equation for the Mean-section method.
Figure 15 Mean-section method
Where:
V = velocity at vertical
b = distance to vertical from bank
h = depth at vertical
q = flow at vertical
English 31
The Mid-section method also divides the cross-section into individual flow segments. With the Midsection method, the segments are not between verticals but are defined by half of the distance to
neighbor verticals in each case. For this reason, the first and last verticals should be as near to the
edges as possible (i.e., left edge of water (LEW) and right edge of water (REW)). Boundary
conditions dictate the proximity of the first and last vertical to the edge of water.
Experience shows that the Mid-section method gives more exact results compared to the Meansection method so it is the default setting. Figure 16 shows the definitions and equation for the Midsection method.
Figure 16 Mid-section method
Where:
m = station number
n = total number of stations
V = velocity at vertical
b = distance to vertical from bank
h = depth at vertical
q = flow at vertical
Profiles and measurements
Profiles can be set up for streams or conduits. Figure 17 shows an example of a typical profile shape
in a conduit. In a typical profile, velocity is less near a wall or edge than at the center and decreases
near the surface. Multiple velocity measurements in the profile are averaged to calculate the total
flow. Measurements for conduit profiles are made from the bottom up. Measurements for stream
profiles are made from the top down.
In the Main Menu, select Profiler. The meter prompts for the operator name, the type of profile
(stream or conduit) and the profile name. Do the instructions for the selected profile type.
32 English
Figure 17 Typical profile
1 Depth
2 Velocity
Site selection
A site with the typical profile shape gives the most accurate results. Visual inspection is typically
sufficient to identify problem sites. Use the information in these guidelines to help select the best site.
These guidelines apply to conduit and stream profiles.
• The channel should have as much straight run as possible. If the length of the straight run is
limited, the length upstream from the profile should be two times the downstream length.
• The channel should be free of flow disturbances. The site must not have protruding pipe joints,
sudden changes in diameter, contributing side-streams, outgoing side-streams or obstructions.
Remove all rocks, sediment or other debris from the bottom of the pipe.
• The flow should not have visible swirls, eddies, vortices, back-flow or dead zones.
• Do not select areas immediately downstream from sharp bends or obstructions.
• Do not select areas with converging or diverging flow (approaches to a flume) or vertical drops.
• Do not select areas immediately downstream from sluice gates or places where the channel spills
into a body of stationary water.
Do a velocity calibration
Use this feature to remove a velocity offset if necessary. The velocity offset stays active until the
meter power is switched off.
1. Collect a bucket of water from the water in the profile area. The bucket must be non-metallic and
at least 20.32 cm (8 in.). The water depth must be at least 15.24 cm (6 in.).
2. Put the sensor in the center of the bucket so that it does not touch the sidewall or the bottom of
the bucket.
3. Let the water become still.
4. Let the velocity reading stabilize.
5. Select Zero Velocity.
Wet/Dry threshold
The wet/dry threshold is the trigger point for the meter to know when the sensor is in or out of the
water. This information is important because if the meter does not know that the sensor is under the
English 33
surface of the water, the meter sets the velocity value to zero. For a profile or real-time reading, the
meter prompts the user to submerge the sensor in the water.
If the specific conductivity of the water being measured is very low, adjust the threshold value for the
best performance. Go to Setup Menu>Wet/Dry Threshold.
For troubleshooting, the present reading is used as a guide to set a custom threshold. Get a reading
in the water (wet) and then out of the water (dry). The threshold value must be between the wet and
dry value. For example, if the actual wet value is 17 and the actual dry value is 2, put in a threshold
value half way between 2 and 17. The default value is 20.
34 English
U.S. and countries other than EU
HACH COMPANY
4539 Metropolitan Court
Frederick, MD, 21704-9452, U.S.A.
Tel. (800) 368-2723
Fax (301) 874-8459
[email protected]
www.hachflow.com
©
Marsh-McBirney and Sigma Flow
Products (except Sigma Flow
Products in France and the UK)
FLOWTRONIC, SA.
Rue J.H. Cool 19a
B-4840 Welkenraedt, Belgium
Tel. +32 (0) 87 899 799
Fax +32 (0) 87 899 790
www.flow-tronic.com
Hach Company/Hach Lange GmbH, 2012.
All rights reserved. Printed in U.S.A.
France and UK
(Sigma Flow Products Only)
HACH LANGE GmbH
Willstätterstraße 11
D-40549 Düsseldorf, Germany
Tel. +49 (0) 211 5288-0
Fax +49 (0) 211 5288-143
E-mail: [email protected]
www.hach-lange.com