1
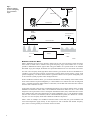
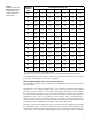
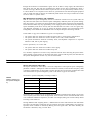
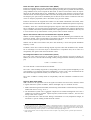
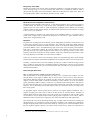
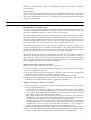
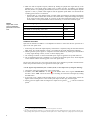
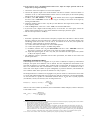
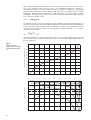
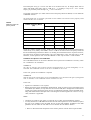
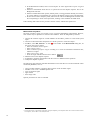
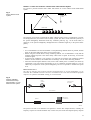
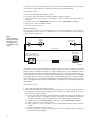
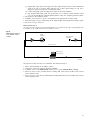
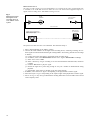
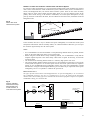
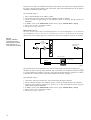
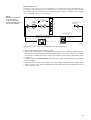
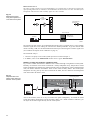
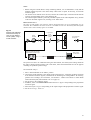
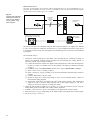
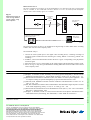
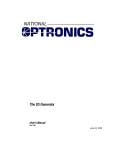
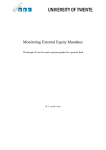
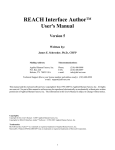
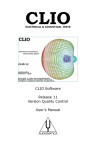
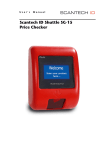
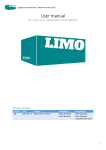
APPLICATION NOTE Measuring Speech Intelligibility Using DIRAC — Type 7841 DIRAC PC software is used for measuring a wide range of room acoustical parameters. Based on the measurement and analysis of impulse responses, DIRAC supports a variety of measurement configurations. For accurate measurements according to the ISO 3382 standard, you can use the internally generated MLS or sweep signals through a loudspeaker sound source. Survey measurements are easily carried out using a small impulsive sound source, such as a blank pistol or even a balloon. Speech measurements can be carried out in compliance with the IEC 60268-16 standard, for male and female voices, through an artificial mouth-directional loudspeaker sound source or through direct injection into a sound system, taking into account the impact of background noise. DIRAC is not only a valuable tool for field and laboratory acoustics engineers, but also for researchers and educational institutions Photo courtesy of Muziekcentrum Frits Philips Eindhoven, The Netherlands Basic Principle Modulation Transfer Function (MTF) The speech intelligibility parameters in DIRAC are based on the relation between perceived speech intelligibility and the intensity modulations in the talker’s voice, as described by Houtgast, Steeneken and Plomp [1] and [6]. When a sound source in a room is producing noise that is intensity modulated by a low frequency sinusoidal modulation of 100% depth, the modulation at the receiver position will be reduced due to room reflections and background noise. The Modulation Transfer Function (MTF) describes to what extent the modulation m is transferred from source to receiver, as a function of the modulation frequency F, which ranges from 0.63 Hz to 12.5 Hz. Hence, the MTF depends on the system properties and the background noise (see Fig. 1) Fig. 1 Relation between speech intelligibility and modulation depth Background Noise Reflections Direct Sound Mouth Simulator Omni-directional Microphone Room under test Intensities m source (F) 100% MTF (F) m receiver (F) < 100% 020156 Modulation Reduction Matrix MTF is determined for each octave frequency band involved. The octave frequency bands used range from 125 Hz to 8 kHz and are related to the typical frequency range of the human voice. It is also possible to differentiate between typical male and typical female voice spectra based on the standard IEC 60268–16 [2]. For example, the female voice spectrum model does not cover the 125 Hz octave band. For each octave frequency band, high MTF values indicate a good transfer of the level modulations in a speaker’s voice at the source position, as perceived by a listener at the receiver position – hence, good speech intelligibility. Low MTF values indicate a significant reduction of the speech intelligibility, due to the acoustical system properties and/or background noise. From a modulation reduction matrix, you can obtain information on the reliability of the results and the cause of the reduction of speech intelligibility. A constant MTF over F indicates the cause as backgound noise, a constantly decreasing MTF indicates reverberation, and an MTF which first decreases and then increases with F indicates an echo. In the matrix, the MTF values for the 14 modulation frequencies are averaged, resulting in the so-called Modulation Transmission Index (MTI). The modulation transmission indices for the 7 octave band frequencies can be processed to arrive at the Speech Transmission Index (STI), which takes into account most conditions that could cause deterioration of speech intelligibility (see [1]. The parameters RASTI (STI for room acoustics) and STITEL (STI for telecommunication systems) are obtained in a similar way, but cover less frequency bands and/or different modulation frequencies. Table 1 shows an example of a modulation reduction matrix. In the table, the given modulation and octave band frequencies apply directly to STI. Projected as well are RASTI and STITEL frequency pairs, whose F-values generally lie in between the STI F-values 2 Table1 Example of STI modulation reduction matrix. Female speech parameters exclude the 125 Hz octave frequency band Modulation Frequency F(Hz) Octave Band Frequency (Hz) 125 250 500 1k 2k 4k 8k 0.63 1.000 1.000 1.000 1.000 1.000 1.000 1.000 0.8 1.000 1.000 1.000 1.000 1.000 1.000 1.000 1.0 1.000 1.000 ! 1.000 1.000 1.000 1.000 1.000 1.000 1.000 1.000 1.000 1.000 1.000 1.000 0.841 0.835 ! X X 1.25 ! 1.6 0.858 0.866 0.806 0.852 0.837 2.0 0.858 0.866 ! 0.806 0.852 0.837 0.841 0.835 2.5 0.858 0.866 0.806 0.852 0.837 0.841 0.835 3.15 0.858 0.866 0.806 0.852 0.837 0.841 0.835 4.0 0.858 0.866 ! 0.806 0.852 0.837 0.841 0.835 5.0 0.651 0.676 0.543 0.543 0.630 0.633 0.612 0.630 0.633 0.612 X ! X X ! 6.3 0.651 0.676 0.543 0.543 8.0 0.506 0.533 ! 0.377 0.377 0.506 0.502 0.471 10 0.506 0.533 0.377 0.377 0.506 0.502 0.471 12.5 0.444 0.460 0.267 0.427 0.406 0.413 0.373 MTI 0.75 0.76 0.7 0.75 0.73 0.74 0.73 X ! X ! – Shows RASTI octave bands and modulation frequencies X – Shows STITEL octave bands and modulation frequencies Note: Some RASTI and STITEL modulation frequencies are intermediate between the listed modulation frequencies The modulation reduction matrix of Table 1 reflects a case where only reverberation plays a role, while the influence of background noise and echoes is negligible. Measuring MTF: Modulated Noise versus Impulse Response Two commonly used MTF measuring methods are the Modulated Noise method and the Impulse Response method. The Modulated Noise method is straightforward. A source produces an excitation signal basically consisting of 7 × 14 = 98 summed noise signals, each of which is filtered and 100% modulated according to the matrix in Table 1. A receiver picks up the signal at the listener position and measures the reduced modulation MTF(F) for each octave band and modulation frequency. With this method, the source is always independent and separate from the receiver, which is convenient for long distance measurements. However, due to the randomness of the exictation signal, a measurement takes a relatively long time to obtain reproducible results (about 30 seconds on average), and because background noise may fluctuate, the receiver may misinterpret these fluctuations as signal modulations and overestimate the speech intelligibility at low Signal to Noise Ratio (SNR) values. Schroeder [3] showed that the MTF, hence the STI, can be derived from the impulse response through the complex MTF, which is the Fourier transform of the squared impulse response. Rife [4] then used both Houtgast, Steeneken and Plomp [1] and Schroeder [3] and included the impact of background noise to arrive at his conclusions for Impulse Response method. If the impulse response is measured 3 through deconvolution of a deterministic signal, such as an MLS or sweep signal, the measurement takes much less time than with the modulated noise method for the same reproducibility (about 5 seconds on average). Because deconvolution requires the source to run synchronously with the receiver, it is more dificult to use a separate source. However, synchronisation errors between digital equipment (such as sound cards and CD players) are sufficiently small to allow sine sweeps recorded on an audio CD to be used as a separate source. MTF Measurement Conditions and Limitations MTF as a basis for speech intelligibility also has its limitations. Distortions in the system under test may affect the MTF (hence the measured speech intelligibility) differently from real speech intelligibility. For instance, a recorded voice that is played back at a slightly higher speed is still quite intelligible, but the measured MTF may drop significantly. Center clipping (cross-over distortion) may affect real speech intelliibility much more severely than the measured MTF. The same is true for signal dropouts (Houtgast, Steeneken et al [6]). In general the deviation between real and measured speech intelligibility will be different for Modulated Noise and Impulse Response measuring methods. In IEC 60268–16 [2], some conditions are given to avoid problems: • The system under test should not introduce frequency shifts or use frequency multiplication. • The system under test should not contain vocoders, such as LPC, CELP and RELP. • The speech transmission should be essentially linear, with amplitude compression or expansion limited to 1 dB, and no peak clipping. To these precautions, we can also add: • The system under test should not introduce center clipping. • The system under test should not introduce drop-outs. It is, therefore, important to be aware of any nonlinear behaviour when measuring the speech intelligibility through a sound system. On the other hand, if the system is behaving linear, the measured and real speech intelligibilities correlate very well for both methods. Parameters Related to Speech Intelligibility Speech Transmission Index (STI) The Speech Transmission Index (STI) is the most comprehensive and important speech intelligibility parameter in DIRAC. Although not usable for transmission channels, which introduce frequency shifts or frequency multiplication, or that include vocoders, STI takes into account most conditions that could cause deterioration of speech intelligibility (refer to IEC 60268–16 [2] for more details). STI relates to speech intelligibility according to Table 2. Table2 Relation between STI and speech intelligibility STI Speech Intelligibility 0.00 – 0.30 Bad 0.30 – 0.45 Poor 0.45 – 0.60 Fair 0.60 – 0.75 Good 0.75 – 1.00 Excellent Technically, STI is calculated as the weighted sum of Modulation Transfer Indices (MTI), one for each octave frequency band from 125 Hz through 8 kHz, where each MTI value is derived from MTF values over 14 different modulation frequencies (see Table 1 for examples) taking into account auditory effects according to IEC 60268–16. Through different MTI weighting factors, a differentiation has been made between male and female STI values. The STI male is measured, using an excitation signal with a standard male voice frequency spectrum, which in DIRAC is obtained by filtering the source signal with a Male filter. Similarly, the STI female is measured, using a Female filter. 4 Room Acoustics Speech Transmission Index (RASTI) RASTI is a simplified version of STI, intended to emulate STI under typical room acoustical conditions. RASTI was originally developed to decrease the required processing time to perform the measurement (using modulated noise) and to compute the final result. To obtain correct RASTI values, the requirements for the STI method must be met. Additionally, the overall system frequency response must be uniform from the 125 Hz through the 8 kHz octave band, the background noise must be smooth in time and frequency, the space must be substantially free of discrete echoes and the reverberation time must not be too frequency dependent (refer to IEC 60268–16 [2] for more details). RASTI is calculated as the weighted sum of MTI's over the 500 Hz and 2000 Hz octave bands, where the MTI values are derived from MTF values over 4 and 5 different modulation frequencies respectively. In DIRAC, where STI is measured through impulse responses rather than modulated noise, RASTI has no advantages over STI with respect to measurement or computation time. However, RASTI does require a smaller measurement system bandwidth and a simpler speech level calibration than STI, and it can be used for survey measurements in most practical room acoustical situations. Speech Transmission Index for Telecommunication Systems (STITEL) STITEL is another simplified version of STI, also meant to decrease measuring and calculation time. In order for STITEL values to approximate corresponding STI values, several measurement conditions have to be met, which are typical for telecommunication systems. STITEL uses the same octave bands as STI, but in each band only 1 octave band specific modulation frequency is used. In DIRAC, where STI is measured through impulse responses rather than modulated noise, STITEL has no advantages over STI with respect to measurement or computation time, but is meant as a comparability tool against other measured STITEL values. Percentage Articulation Loss of Consonants (% ALC) The % ALC (also called % ALcon's) is originally based on the reception of words by listeners. In DIRAC, the % ALC is derived from STI through a widely used approximation formula by Farrel Becker [6]1: % ALC = 170.5405 e–5.419(STI) The same formula is used with RASTI and STITEL. The % ALC values normally range from 0 (corresponding to an excellent speech intelligibility) to 100 (corresponding to an extremely bad speech intelligibility), but the % ALC value calculated from the above-mentioned approximation formula, will exceed 100 at very low STI. The % ALC in DIRAC is mainly meant for comparability with other calculated or measured % ALC values. Signal to Noise Ratio (SNR) SNR is defined as the logarithmic ratio of the signal level and the noise level and is, therefore, related to signals rather than systems. In DIRAC, SNR is meaningful only if 3 conditions are met: 1. SNR is obtained using the Internal MLS, Internal Sweep, External MLS or External Sweep measuring method with the Pre-average set to 1. 2. The measurement system noise is negligible compared to the measured background noise. This is normally the case when a loopback2 impulse response, measured under condition 1, does not show clearly visible noise or spikes. 3. The system under test is time-invariant. During a measurement in a room, temperature changes, air movements or persons walking around should be avoided. 1. The editor of [6] notes on p.81: “This equation, referred to as Farrel Becker equation, is often used to relate to STI to ALcons scores. It appears tht the source of this equation is not documented in open literature. However, a remarkable correspondence is observed with the empirical data reported (in a figure rather than as an equation) by Houtgast et al [1]. It seems reasonable to assume that the equation was either obtained through similar experiments, or derived from the data reported by Houtgast et. al.” 2. Using internal generator: sound card output connected to sound card input. Using external generator: generator output connected to sound card input. 5 Early Decay Time (EDT) Because EDT relates more than the other reverberation parameters to the inital and highest level part of the decaying energy, it is also the parameter that relates most to modulation reduction. EDT is derived from the decay curve section between 0 dB and 10 dB below the initial level. From the corresponding slope, EDT is calculated as the time to reach –60 dB. Hardware Guidelines Mouth-directional Loudspeaker Sound Sources Mouth-directional loudspeaker sound sources, in short mouth simulators, have a directivity similar to a human mouth. This directivity is relevant for speech intelligibility, in that speech intelligibility is highest on the axis of the source. A small, high-quality loudspeaker with a diameter not exceeding 100 mm is usable for this purpose; though, an artificial mouth with directivity characteristics according to ITU–T P.51 [5] is preferred. A mouth simulator is normally used in the situation of an unamplified talker or in a situation with a sound system equipped with a close-talking microphone. It is driven by a power amplifier with an output power of approximately 10 W. Equalizers In general, due to background noise affecting speech intelligibility, the absolute sound pressure level in each octave frequency band is of great importance. The sound card output and/or mouth simulator octave band frequency characteristic needs to be flat in order not to distort the standard speech spectra provided by DIRAC. This is accomplished using pink noise and an octave frequency band equalizer. Pink noise is generated by DIRAC. By properly adjusting each equalizer octave band gain, while generating the pink noise signal through the sound card, you can get equal energy in each octave frequency band of the sound card or mouth simulator output. After equalizing, the spectrum is ready for being shaped by the standard voice source filters in DIRAC. In the case of STI, the relevant octave frequency bands to be equalized range from 125 Hz through 8 kHz. RASTI only requires the 500 Hz and 2 kHz band to be equalized, which is of course much easier. Normally, a common audio octave band equalizer, providing a ± 12 dB or 24 dB level range, will be able to equalize a sound card plus a loudspeaker frequency characteristic. Once the correct equalizer settings have been determined, you can write them down and reuse them for any future speech level calibrated measurement. External Signal Generators MLS or Sweep Generator: Digital Sound Recording Device With external MLS or sweep measurements, you have to use a generator that produces the same periodic MLS or sweep signal as DIRAC does in Internal MLS or Internal Sweep mode. Because a slight timing difference between the generator and the sound card could easily cause the Impulse response to Noise Ration (INR) to decrease substantially, a better method is to record an excitation signal, generated by DIRAC through a sound card, on a digital sound recording device, and then use the same sound recording device to play back this signal, and the same sound card to record the room responses. This is particularly true for MLS signals, which are much more sensitive to timing errors than sweep signals. An appropriate digital sound recording device preserves the original digitized information, has a stepwise recording gain control with a read-out in dB, and has an overload detector. Examples of suitable digital sound recording devices are a DAT recorder and a notebook PC with an audio or data CD recorder. Do not use digital sound recorders applying audio compression, such as DCC, MP3 or Minidisk recorders, because audio compression may reduce the INR and/or SNR significantly. The external MLS and sweep measuring methods rely on highly stable and identical recording and playback speeds. It is good practice to make sure that this condition is not violated due to temperature changes and ageing of the sound recorder and/or media, by verifying prior to each measurement session that the loopback1 impulse response is free from clearly visible noise or spikes (see instructions in 1. In this instance: digital sound recording device output connected to measuring PC sound card input 1. 6 DIRAC User Manual BE 1685, Section 4.3: Qualifying the Soundcard). If necessary, re-record the excitation signal. Noise Generator With the external noise measuring method, you can use any broadband random signal as an excitation signal. This may be useful for speech intelligibility measurements in occupied rooms, where music may be more suitable than noise. However, it is not possible to use random signals to perform calibrated speech level measurements. Speech Level Calibration Simulated Speech and Noise Levels The cause of reduced speech intelligibility may originate from the transferring system's characteristics (for instance reverberation and reflections in a room or echoes in a telecommunication system). This reduction is independent of signal level, which is irrelevant in this respect. Speech intelligibility may also be reduced due to background noise. In fact, the effective parameter is the Signal to Noise Ratio (SNR) rather than the background noise level, where ‘Signal’ and ‘Noise’ refer to the signal level and background noise level, which are both present at the receiver position. Because the background noise level is a real level, the source signal should also have a real level to get the correct SNR at the receiver position. This requires a calibrated speech level. After calibrating the speech level, the output signal has a standard voice frequency spectrum and an A-weighted sound pressure level in compliance with IEC 60268–16. This implies that the SNR values obtained with each impulse response measurement, equal the values that would be measured with a real talker, and therefore result in the correct reduction of the speech intelligibility. Speech level calibration requires the excitation signal spectrum to be shaped, which in DIRAC is possible with the internally generated excitation signals MLS and Sweep. In addition to having the right speech level, another condition to obtain the correct SNR values is that the measurement system noise is negligible compared to the measured acoustical background noise. All these requirements can be met by using either of the following measuring methods. DIRAC’s Internal MLS or Internal Sweep method This method is the most stable with respect to low system noise. 1. The excitation signal is real-time generated on the measuring PC, which requires the excitation input to be in the neighbourhood of the PC. 2. The excitation signal spectrum can be shaped by a selectable source output Filter, which depends on the desired speech intelligibility parameters according to Table 3. 3. Set the Pre-average value to 1, in order not to artificially increase the measured SNR. 4. Make sure that the loopback impulse response is free from clearly visible noise or spikes (for help, see DIRAC User Manual BE 1685, Section 4.3: Qualifying the Soundcard). DIRAC’s External MLS or External Sweep method 1. The excitation signal is generated from a separate generator, which allows the excitation input to be remote from the measuring PC. • Sweep signals can for instance be generated by a second PC running a demo version of DIRAC (in Internal Sweep mode, using the Test button) or, after being recorded on an audio CD using any CD player. Typical speed differences between PCs and/or CD players are within ± 0.1%, and have negligible impact on the resulting impulse responses. • MLS signals are much more time critical than sweep signals and must be recorded from the measuring PC (in Internal MLS mode, using the Test button) on a digital sound recording device, and played back from the same sound recording device during the measurements. • Hereafter in this note, for the sake of simplicity, externally generated signals are assumed to be recorded, although this is not necessarily the case with sweep signals. The term ‘digital sound recording device’ will also be used to denote the chain: CD recorder 1 – CD – CD player 2, although the recording and playback device must be the same with MLS signals. 2. During the recording session, the excitation signal spectrum can be shaped by a definable source Source Filter, which depends on the desired speech intelligibility parameters, according to Table 3. 3. Set the Pre-average value to 1, in order not to artificially increase the measured SNR. 7 4. Make sure that the impulse response, obtained by feeding the played back signal directly to the measuring PC, is free from clearly visible noise or spikes (for help, see DIRAC User Manual BE 1685, Section 4.3: Qualifying the Soundcard). If this is not the case, while the loopback impulse response is clean, a possible cause might be that the playback speed differs too much from the recording speed, which is not allowed. • External MLS or sweep method relies on highly stable and identical recording and playback speeds. Thus, make sure that this condition is not violated due to temperature changes and ageing of the sound recorder and/or media, by carrying out the above-mentioned check prior to each external MLS or sweep measurement session. If necessary, re-record the excitation signal. Table3 Output filter versus speech intelligibility parameter to be measured Speech Intelligibility Parameter to be Measured Output Filter STI Male or corresponding %ALC value Male STI Female or corresponding %ALC value Female RASTI or corresponding %ALC value RASTI STITEL for male voice or corresponding %ALC value Male STITEL for female voice or corresponding %ALC value Female Calibration Procedure Speech level calibration in DIRAC is accomplished as follows to ensure that the test speech level is equal to the real speech level: 1. If necessary, the sound card output frequency characteristic is equalized, using the Pink+Blue filtered MLS signal. If a mouth simulator is used, it is included in the signal chain before equalizing. 2. DIRAC generates speech signals in compliance with IEC 60268–16 by filtering the internal MLS or sweep signal through a Male, Female or RASTI shaping filter. 3. The resulting acoustical or electrical standard speech signal is applied to the system under test. 4. The A-weighted signal level is adjusted so as to match the practical speech level, which depends on the situation and the measuring point in the total signal chain. The first and last actions are part of the actual speech level calibration procedure described below. Follow the procedure based on your application of the input signal: A. If the signal is injected directly into a sound system, set the output level by doing the following: 1. Connect the sound card output to the sound system input. 2. In DIRAC, select File, Measure... or click in the toolbar. Select Source Signal: Internal MLS and Source Filter: Male. Choose an MLS Length: exceeding 2 s and switch on the signal by clicking the Test button. 3. If you want to use a digital sound recording device, record at least 15 s of the signal, connect the digital sound recording device to the sound system input and then play back the signal. 4. Set the system or digital sound recording device output level to get the LAeq,101 value for continuous speech2. 1. LAeq,10 is the A-weighted equivalent sound pressure level, averaged over 10 seconds. 2. This level could be found by measuring LAeq,10 while playing back real speech without pauses from a tape recorder or having a real talker speaking without pauses into a microphone, with the system set at a ‘normal’ output level, as judged by the user of the system. 8 B. If the signal is fed to a mouth-directional sound source, shape the output spectrum and set the output level by doing the following: 1. Connect the sound card output to an octave band equalizer. 2. Connect the equalizer output to the mouth simulator and direct it towards a sound level meter1 at a distance of 1 m or, if the mouth simulator will be used in a sound system, at the normal speaking distance from the sound system microphone. 3. In DIRAC, select File, Measure... or click in the toolbar. Select Source Signal: Internal MLS and Source Filter: Pink+Blue. Choose an MLS Length: exceeding 2 s and switch on the signal by clicking the Test button. 4. Adjust the equalizer gains in such a way that you will obtain the same signal levels (within ± 1 dB) in all frequency bands. 5. Click the Stop button, select Source Filter: Male, and click the Test button. 6. If you want to use a digital sound recording device, record at least 15 s of the signal, connect the digital sound recording device to the mouth simulator and then play back the signal. 7. Set the total output level to 68 dB(A). Notes: • Procedure A presumes the sound card has a frequency response that is flat within ± 1 dB over 88 Hz through 11.3 kHz for the input channel of a calibrated sound card or for the output channel of an uncalibrated sound card. If this is not the case or not assumed to be the case, first equalize the sound card2 output spectrum by doing the following: (a) Connect the sound card output to an octave band equalizer. (b) Connect the equalizer output to an RMS voltage meter. (c) In DIRAC, select the Source Signal: Internal MLS and Source Filter: Pink+Blue. Choose an MLS length: exceeding 2 s and switch on the signal by clicking the Test button. (d) Adjust the equalizer gains in such a way that you will obtain the same signal levels (within ±1 dB) in all frequency bands. • The calibration, which is performed with the Male speech filter, also holds for the Female and RASTI speech filters. Negligibility of Background Noise If the background noise level is negligible or if you want to eliminate its impact by measurement technique, the speech level calibration can be omitted. This also simplifies the measurement in the sense that an equalizer is not needed, and in situations with a sound system, the output level does not have to be calibrated each time a measurement is carried out. Therefore, it is worthwhile to take a closer look at the impact of SNR on speech intelligibility in practical situations, and formulate the exact condition under which speech level calibration is really required. The background noise is assumed to be negligible if its presence results in a STI decrease of less than 5 % of the STI without background noise. To figure out what the consequence is for the allowed SNR, we write the MTF as a product of 2 modulation reduction factors, m0(k,F) due to system properties (reverberation, echoes) and mSNR(k,F) due to background noise: m 0 ( k, F ) MTF ( k, F ) = m 0 ( k, F ) ⋅ m SNR ( k ) = -------------------------------1 + 10 SNR ( k ) – ------------------10 where k is the octave number. By definition, the so-called effective SNR, SNReff(k,F) relates to MTF(k,F) as does SNR to mSNR: MTF ( k, F ) SNReff ( k, F ) = 10 log ------------------------------------ 1 – MTF ( k, F ) 1. A sound level meter with octave band filters is preferred, but a sound lever meter with linear frequency weighting could be used as follows: • Set all equalizer octave band levels at minimum • Measure the level with the 125 Hz slider set at maximum, and put back to minimum • Repeat this for all bands from 250 Hz through 8 kHz • Set the slider of the band with minimum measured level at maximum, and the other sliders such that all levels are equal. The disadvantage of a sound level meter with linear frequency weighting is the large range required for each equalizer frequency band. Using an 11-band equalizer, a slider should be set at least 10 dB above minimum to exceed the noise level of the remaining 10 bands at minimum level. For an additional 10 dB SNR, a total minimum range of 20 dB is required leaving only 4 dB adjustment range for a common ± 12 dB (24 dB range) audio equalizer. Most likely a second or other type of equalizer is then required 2. You can also choose another sound card with the required frequency response specified by the manufacturer. 9 Hence, SNReff equals SNR if the modulation is reduced by background noise only. For each k from a set of octave frequency bands, and each F from a set of modulation frequencies, SNReff(k,F) is calculated, and clipped to ±15 dB, before being further processed to calculate STI. The clipping operation reflects that SNReff values exceeding 15 dB cannot have any negative impact on speech intelligibility, while SNReff values lower than –15 dB cannot have any positive impact on speech intelligibility. The clipped SNReff values are converted to transmission indices TI(k,F) that range from 0 to 1, and each contribute to STI. SNR ( k, F ) + 15 TI ( k, F ) = -------------------------------------30 For the final STI, the TI values are averaged over the modulation and octave band frequencies in a special way, thereby taking into account auditory masking and the absolute hearing threshold. However, to get an idea of the impact of SNR on STI, it is sufficient to evaluate TI for several values of m0 and SNR. Fig. 2 shows the relative change of TI when going from a situation with SNR = ∞ to a situation with the given finite SNR: TI SNR – TI ∞ ∆TI = ------------------------------ ⋅ 100 % TI ∞ The relative changes in TI would also hold for the STI in case of equal weighting factors for each octave frequency band. Actually, the SNR values of the octave bands from 500 Hz through 4 kHz are the most significant. 1.00 0.90 Transmission Index without background noise Fig. 2 Upper and lower graphs: Impact of SNR on transmission index TI 0.80 0.70 0.60 0.50 0.40 0.30 0.20 0.10 0.00 0.0 0.1 0.2 0.3 0.4 0.5 0.6 0.7 0.8 0.9 1.0 0.6 0.7 0.8 0.9 1.0 m0 0.0 0 0.1 0.2 0.3 0.4 0.5 24 dB 21 dB 18 dB -2 Relative change of TI (%) 15 dB -4 12 dB -6 -8 -10 SNR=9 dB -12 -14 030021 10 From both parts of Fig. 2, it can be seen that as m0 increases from 0.5, TI changes faster with m0 (hence with SNR), until SNReff clips to 15 dB at TI = 1, resulting in a dip at m0 = 0.97. A much steeper, yet practically irrelevant dip at m0 = 0.03 is not shown. Using Table 4 and Figure 2, in which relevant octave frequency bands are defined, we now define the 15 dB SNR criterion: The background noise is negligible if the SNR exceeds 15 dB in each relevant octave frequency band and the STI does not exceed 0.8. Table4 Relevant octave frequency bands Octave Frequency Band (Hz) Source Excitation Signal Male Female 125 • 250 • • 500 • • 1k • • 2k • • 4k • • 8k • • RASTI • • If only the condition of SNR exceeding 15 dB is met, this could theoretically lead to an underestimation of the STI by 10 %, namely if the SNR is close to 15 dB for all relevant octave frequency bands and the STI without background noise would be 1.0, resulting in a measured STI of 0.9. In practice however, STI values rarely exceed 0.8 and most likely, only a few SNR values, if any, will come close to 15 dB. Therefore, in most practical cases it will be sufficient to meet only the SNR > 15 dB condition. Conditions for Speech Level Calibration The 15 dB SNR criterion can be used to determine when a speech level calibration is necessary. There are 2 conditions to be considered. Condition A The effect of both the room acoustics and the background noise on speech intelligibility is to be measured. The 15 dB SNR criterion is not met or assumed not to be met. In this case, speech level calibration is required. Condition B Only the effect of the room acoustics on speech intelligibility is to be measured. The effect of background noise is excluded, or the 15 dB SNR criterion is known to be met. In this case: • Speech level calibration is not required. • Before starting the speech intelligibility measurements, check the relevant octave band SNR values with DIRAC (see Table 4). If any value does not exceed 15 dB (due to background or measurement system noise, and/or because the speech level is not calibrated), artificially increase the SNR values, using SNR enhancement techniques such as increasing the excitation signal level or the Pre-average value, whichever is applicable. Notes: • Conditions A and B not only apply to rooms but also to other speech transmission systems. • To verify whether the 15 dB SNR criterion has been met when speech level is not calibrated, requires that you use an estimate of the real SNR. Do not use the SNR parameter in DIRAC as the SNR parameter will not reflect the real SNR. You can estimate the real SNR as follows: 1. Place an omni-directional microphone at the listener position with the lowest expected SNR. 11 2. In the Measurement window, select External Impulse as source signal and a Capture Length of about 10 s. 3. Perform a measurement while there is no speech and save the impulse response. This is the Background Noise file. 4. Perform a measurement while speech, without pauses, is being generated naturally, for instance, by a person talking or a played-back voice, and save the impulse response. This is the Speech file. 5. In each relevant octave frequency band, subtract the G value of the Background Noise file from the corresponding G values of the Speech file, resulting in the estimated real SNR values. If the resulting SNR values do not provide a decisive answer, calibrate the speech level. Measurement Procedure Measurement Procedures The basic procedure1 below can be used to carry out speech intelligibility measurements. However, some actions may be dependent on situation and conditions. These are designated by asterisks. 1. Connect the excitation signal to a mouth simulator at the talker’s position or to the sound system input.* 2. Connect an omni-directional microphone at a listener position to sound card input 1. 3. In DIRAC, select File, Measure... or click in the toolbar. In the Measurement dialog box, set the source and receiver settings: • Select an excitation Source Signal.* • Select a Source Filter.* • Select a MLS/Sweep/Capture Length: exceeding 2 s or twice the estimated reverberation time, whichever is higher. • Select a Pre-average value. • Click the single omni-directional receiver button: 4. Measure and save the impulse response. 5. If applicable, repeat the measurement with the receiver at different listener positions. 6. Analyse the impulse responses. The following pages describe individual measurement cases that take into account situational and/or conditional parameters, such as: • • • • • Using a mouth simulator or applying direct injection of the excitation signal Whether or not to use a calibrated speech level Type of excitation signal Type of filter Pre-average value Specific procedures for each are included. 1. For other details, such as dual channel measurement, microphone amplifiers, power amplifiers and the use of sound level meters instead of microphones, refer to DIRAC User Manual, BE 1685. 12 Situation 1: Talker and Listeners in Same Room without Sound System Fig. 3 shows a practical situation with a talker and listeners in a room without sound reinforcement system. Fig. 3 Room without sound system Background Noise Reflected Sound Direct Sound 030020/1 The listeners receive direct sound from the talker; reflected sound, such as reverberation or echoes; and background noise, for instance from an HVAC system. The direct sound contributes positively to the speech intelligibility. Reflected sound may contribute positively (e.g. via the front board) or negatively to the speech intelligibility. Background noise contributes negatively to the speech intelligibility. Notes: • It is recommended to use the internal MLS or sweep measuring methods wherever possible, because these are the most stable with respect to low system noise. • Before using the external MLS or sweep measuring method, it is recommended to verify that the loopback impulse response is free from clearly visible noise or spikes. If necessary, re-record the excitation signal. • If speech level calibration is not required, you could use the external noise measuring method. However for this situation, this method has no advantage over the other measuring methods. • When the external impulse method is used, such as with a blank pistol or a balloon, the directivity requirement is not met and the measurement is not in compliance with IEC 60268–16. You can obtain only an impression of the speech intelligibility, and it is not possible to calibrate the speech level. Measurement Case 1 The effect of both the room acoustics and the background noise on speech intelligibility is to be measured. The 15 dB SNR criterion is not met or is assumed not to be met. The measurement equipment comprises an equalizer and DIRAC running on a notebook PC. Fig. 4 Speech calibrated measurement setup with equalizer, in room without sound system Mouth Simulator Omni-directional Microphone Room under test DIRAC running on notebook PC Equalizer TOSHIBA 020177/1 The speech level has to be calibrated. An equalizer is used in this example because, normally, the frequency response of a mouth simulator and, in some cases, the sound card output frequency response 13 is not flat over the relevant frequency bands. Obviously, for RASTI measurements with only 2 relevant octave frequency bands, flatness is reached much easier than for STI measurements. The situational setup is: 1. Place a mouth simulator at the talker’s position. 2. Connect the sound card output to the mouth simulator through an equalizer. 3. Set the equalizer and gain settings to the calibration values, if necessary through speech level calibration. 4. In DIRAC, select in the Measurement window Source signal: Internal MLS or Sweep. 5. Select a Source Filter: according to Table 3. 6. Set the Pre-average value to 1. Measurement Case 2 The effect of both room acoustics and background noise on speech intelligibility is to be measured. The 15 dB SNR criterion is not met or is assumed not to be met. The measurement equipment includes a digital sound recording device. Fig. 5 Speech calibrated measurement setup with digital sound recording device, in room without sound system Mouth Simulator Omni-directional Microphone Room under test Digital sound recording device playing back previously recorded equalized DIRAC excitation signal DIRAC running on notebook PC TOSHIBA 020178/1 The speech level has to be calibrated. By recording the signals on a sound recording device through an equalizer, with its settings at the calibration values, you can measure at a calibrated speech level without equalizer. Additional advantages of a sound recording device are the diminished risks of accidentally changing equalizer settings and the reduced connection cable length. A disadvantage of a sound recording device is the risk of reduced SNR (and INR) due to a slight difference in recording and playback speed (in particular for MLS signals). Another disadvantage is the requirement that the source signal settings (e.g. Male/Female/RASTI filters) in the Measurement window have to be chosen prior to recording the signal. During the measurements, the settings cannot be changed simply from within DIRAC. The situational setup is: 1. Place a mouth simulator at the talker’s position. 2. Connect the mouth simulator to the digital sound recording device, containing recordings of speech level calibrated excitation signals, recorded from the measuring PC running DIRAC. If necessary, perform such recordings as follows: (a) Connect the sound card output to the digital sound recording device through an equalizer. Set the equalizer settings to the calibration values. If necessary, first calibrate the speech level, temporarily connecting the mouth simulator instead of the digital sound recording device. (b) In DIRAC, select in the Measurement window Source Signal: Internal MLS or Sweep. (c) Select a Source Filter: according to Table 3. (d) Select a MLS/Sweep Length: exceeding 2 s or twice the estimated reverberation time, whichever is higher. (e) Click the Test button to play the signal. (f) Record the signal for a period long enough to carry out the minimum desired number of measurements during playback. 14 3. 4. 5. 6. (g) If applicable, repeat steps (b) through (f) for other signal settings. Record at least a Male MLS signal for at least 15 seconds. When changing over to other signal settings, be sure not to change any sound card output or recording gain setting. (h) Connect the digital sound recording device output to the mouth simulator. (i) Play back the Male MLS signal, and set the gain so as to obtain a mouth simulator output LAeq,10 level of 68 dB(A) at a normal speaking distance, using an A-weighting sound level meter. Set the gains to the calibration values. In DIRAC, select the Source Signal: corresponding to the played back excitation signal. Select the Capture Length: corresponding to the capture length of the played back excitation signal. Set the Pre-average: value to 1. Measurement Case 3 The effect of room acoustics on speech intelligibility is to be measured. The effect of background noise is excluded, or the 15 dB SNR criterion is known to be met. Fig. 6 Measurement setup in room without sound system Mouth Simulator Omni-directional Microphone Room under test DIRAC running on notebook PC TOSHIBA 020179/1 The speech level does not have to be calibrated. The situational setup is: 1. 2. 3. 4. Place a mouth simulator at the talker’s position. Connect the sound card output to the mouth simulator. In DIRAC, select in the Measurement window Source Signal: Internal MLS or Sweep. Select any Source Filter, provided that the resulting SNR values exceed 15 dB in each relevant octave frequency band. 5. Set Pre-average: to any value, provided that the resulting SNR values exceed 15 dB in each relevant octave frequency band. 15 Measurement Case 4 The effect of room acoustics on speech intelligibility is to be measured. The effect of background noise is excluded, or the 15 dB SNR criterion is known to be met. The measurement equipment comprises a digital sound recording device and DIRAC running on a PC. Fig. 7 Measurement setup with digital sound recording device in room without sound system Mouth Simulator Omni-directional Microphone Room under test Digital sound recording device playing back previously recorded DIRAC excitation signal DIRAC running on notebook PC TOSHIBA 020180/1 The speech level does not have to be calibrated. The situational setup is: 1. Place a mouth simulator at the talker’s position. 2. Connect the mouth simulator to the digital sound recording device, containing recordings of excitation signals recorded from the measuring PC running DIRAC. If necessary, perform such recordings as follows: (a) Connect the sound card output to the digital sound recording device. (b) In DIRAC, select in the Measurement window Source Signal: Internal MLS or Sweep. (c) Select Source Filter: None. (d) Select a MLS/Sweep Length: exceeding 2 s or twice the estimated reverberation time, whichever is higher. (e) Click the Test button to play the signal. (f) Record the signal for a period long enough to carry out a number of measurements during playback. (g) If applicable, repeat steps (b) through (f) for other signal settings. 3. In DIRAC, select the Source Signal: corresponding to the played back excitation signal. 4. Select the Capture Length: corresponding to the capture length of the played back excitation signal. 5. Set Pre-average: to any value, provided that the resulting SNR values exceed 15 dB in each relevant octave frequency band 16 Situation 2: Talker and Listeners in Same Room with Sound System Fig. 8 shows a talker and listeners in a room with sound reinforcement system. Primarily, the listeners receive direct sound from the sound reinforcement system; reflected sound, such as reverberation or echoes; and background noise, for instance from an HVAC system. There are also some secondary effects. There is direct sound coming from the talker, which is a low level delayed version of the primary direct sound arriving at the listeners. Furthermore, the sound system microphone not only picks up the direct sound from the talker, but also reflections from the lectern, feed-back sound and background noise. Fig. 8 Room with sound reinforcement system Reflected Sound Background Noise Direct Sound 030022/1 In this situation, there are 2 ways to measure the speech intelligibility. To include the sound system microphone characteristic and all secondary effects, use a mouth simulator. Otherwise, you can inject the excitation signal directly into the sound system. Notes: • It is recommended to use the internal MLS or sweep measuring methods wherever possible, because these are the most stable with respect to low system noise. • Before using the external MLS or sweep measuring method, it is recommended to verify that the loopback impulse response is free from clearly visible noise or spikes. If necessary, re-record the excitation signal. • The external noise measuring method results in a relatively high system noise level. • The external impulse method could be used with a low level impulsive sound source in front of the sound system microphone or an electrical pulse fed into the sound system. However, impulsive signals are not recommended with a loudspeaker system, due to the risk of loudspeaker overload and distortion. Using the external impulse method, you can obtain only an impression of the speech intelligibility, and it is not possible to calibrate the speech level. Measurement Case 1 The effect of both room acoustics and background noise on speech intelligibility is to be measured. The 15 dB SNR criterion is not met or is assumed not to be met. All sound system microphone characteristics and secondary effects are included. The measurement equipment comprises an equalizer and DIRAC running on a notebook PC. Fig. 9 Speech calibrated measurement setup with equalizer and mouth simulator, in room with sound system Mouth Simulator Sound reinforcement system Omni-directional Microphone Room under test DIRAC running on notebook PC Equalizer TOSHIBA 020181 17 The speech level has to be calibrated. During the measurement, the sound system settings should be the same as during normal operation with a real talker, unless the measurements are for the purpose of finding the optimum system settings. The situational setup is: 1. Place a mouth simulator at the talker’s position. 2. Connect the sound card output to the mouth simulator through an equalizer. 3. Set the equalizer and gain settings to the calibration values, if necessary through speech level calibration. 4. In DIRAC, select in the Measurement window Source Signal: Internal MLS or Sweep. 5. Select a Source Filter: according to Table 3. 6. Set the Pre-average value to 1. Measurement Case 2 The effect of both room acoustics and background noise on speech intelligibility is to be measured. The 15 dB SNR criterion is not met or is assumed not to be met. All sound system microphone characteristics and secondary effects are excluded. The measurement equipment comprises an equalizer. Fig. 10 Speech calibrated measurement setup with equalizer through direct injection, in a room with sound system Sound reinforcement system Omni-directional Microphone Room under test DIRAC running on notebook PC Equalizer TOSHIBA 020182 The speech level has to be calibrated. To this end, the sound system total acoustical output level LAeq,10 should be the same as during normal operation with a real talker (see Calibration Procedure on page 8). In this example, the equalizer is necessary only if the sound card frequency response is not flat or is assumed not to be flat (see the Notes under Calibration Procedure on page 9 ). The situational setup is: 1. Connect the sound card output to the sound system input through an equalizer. 2. Set the equalizer settings to the calibration values, if necessary through speech level calibration. 3. Adjust the total acoustical output level to get the LAeq,10 value for continuous speech, using the internal MLS signal and Male filter. 4. In DIRAC, select in the Measurement window Source Signal: Internal MLS or Sweep. 5. Select a Source Filter: according to Table 3. 6. Set the Pre-average: value to 1. 18 Measurement Case 3 The effect of room acoustics on speech intelligibility is to be measured. The effect of background noise is excluded, or the 15 dB SNR criterion is known to be met. All sound system microphone characteristics and secondary effects are included. The measurement equipment comprises of a digital sound recording device and DIRAC running on a notebook PC. Fig. 11 Measurement setup in room with sound system, using digital sound recording device and mouth simulator Mouth Simulator Sound reinforcement system Omni-directional Microphone Room under test Digital sound device playing back previously recorded DIRAC excitation signal DIRAC running on notebook PC TOSHIBA 020183 The speech level does not have to be calibrated. The situational setup is: 1. Place a mouth simulator at the talker’s position. 2. Connect the mouth simulator to the digital sound recording device, containing recordings of excitation signals recorded from the measuring PC running DIRAC. If necessary, perform such recordings (see Situation 1: Talker and Listeners in Same Room without Sound System, Measurement Case 4 on page 16). 3. In DIRAC, select in the Measurement window the Source Signal: corresponding to the played back excitation signal. 4. Select the Capture Length: corresponding to the capture length of the played back excitation signal. 5. Set Pre-average: to any value, provided that the resulting SNR values exceed 15 dB in each relevant octave frequency band. 19 Measurement Case 4 The effect of room acoustics on speech intelligibility is to be measured in a room that is occupied. The effect of background noise is excluded, or the 15 dB SNR criterion is known to be met. All sound system microphone characteristics and secondary effects are also excluded. Fig. 12 Measurement setup using direct injection, in room with sound system Sound reinforcement system Omni-directional Microphone Room under test DIRAC running on notebook PC CD Player TOSHIBA 020184 The speech level does not have to be calibrated. Because the room is occupied, music is a more suitable excitation signal than noise, making the external noise method preferable. To get the relevant SNR values exceeding 15 dB, use the SNR enhancement technique of increasing the excitation signal level (see Conditions for Speech Level Calibration on page 11). The situational setup is: 1. Connect a CD player to the sound system input and to sound card input 2. 2. In DIRAC, select in the Measurement window Source Signal: External Noise. Situation 3: Talker and Listeners in Different Areas Fig. 13 shows a talker and listeners in different areas connected through a long distance sound system. Primarily, the listeners receive direct sound from a nearby loudspeaker array; delayed direct sound from a loudspeaker array further away; reflected sound, such as reverberation or echoes; and background noise, for instance from the environment. There are also some secondary effects. The sound system microphone not only picks up the direct sound from the talker, but also reflections and background noise from within the talker’s room. Fig. 13 Separate talker and listener areas with long distance sound system First arriving sound Background Noise Delayed Sound 030023 Also in this situation, there are 2 ways to measure the speech intelligibility. To include the sound system microphone characteristics and all secondary effects, use a mouth simulator. Otherwise, you can inject the excitation signal directly into the sound system. 20 Notes: • Before using the external MLS or sweep measuring method, it is recommended to verify that the loopback impulse response is free from clearly visible noise or spikes. If necessary, re-record the excitation signal. • The external noise method cannot be used, because this would require connections from both the receiving and transmitting areas to the measuring PC. • The external impulse method is practically unusable in public areas with loudspeaker arrays, because of the low allowable signal levels, resulting in low SNR values. Measurement Case 1 The effect of both outdoor area acoustics and the background noise on speech intelligibility is to be measured. The 15 dB SNR criterion is not met or is assumed not to be met. All sound system microphone characteristics and secondary effects are included. Fig. 14 Speech level calibrated measurement setup in case of long distance sound system, using a mouth simulator Mouth Simulator Long distance Sound transmission system Omni-directional Microphone Digital sound recording device playing back previously recorded equalized DIRAC excitation signal DIRAC running on notebook PC TOSHIBA 020186 The speech level has to be calibrated. During the measurement, the sound system settings should be the same as during normal operation with a real talker, unless the measurements are for the purpose of finding the optimum system settings. The situational setup is: 1. Place a mouth simulator at the talker’s position. 2. Connect the mouth simulator to the digital sound recording device, containing recordings of speech level calibrated excitation signals, recorded from the measuring PC running DIRAC. If necessary, perform such recordings (for instructions, see Situation 1: Talker and Listeners in Same Room without Sound System, Measurement Case 2 on page 14). 3. Set the gains to the calibration values. 4. In DIRAC, select in the Measurement window the Source Signal: corresponding to the played back excitation signal. 5. Select the Capture Length: corresponding to the capture length of the played-back excitation signal. 6. Set the Pre-average: value to 1. 21 Measurement Case 2 The effect of both outdoor area acoustics and the background noise on speech intelligibility is to be measured. The 15 dB SNR criterion is not met or is assumed not to be met. All sound system microphone characteristics and secondary effects are excluded. Fig. 15 Speech level calibrated measurement setup in case of long distance sound system, using direct injection Long distance Sound transmission system Omni-directional Microphone Digital sound recording device playing back previously recorded equalized DIRAC excitation signal DIRAC running on notebook PC TOSHIBA 020187 The speech level has to be calibrated. Using the direct injection method, it is slightly more difficult to carry out an output level calibration, because the LAeq,10 (see Calibration Procedure on page 8) has to be measured in the receiving area and adjusted in the transmitting area. Of course this can be handled by telephone. The situational setup is: 1. Connect the sound system input to the digital sound recording device, containing recordings of speech level calibrated excitation signals recorded from the measuring PC running DIRAC. If necessary, perform such recordings as follows: (a) Connect the sound card output to the digital sound recording device. If the sound card frequency response is not flat or is assumed not to be flat, equalize it according to Calibration Procedure on page 8. (b) In DIRAC, select in the Measurement window Source Signal: Internal MLS or Sweep. (c) Select a Source Filter: according to Table 3. (d) Select a MLS/Sweep Length: exceeding 2 s or twice the estimated reverberation time, whichever is higher. (e) Click the Test button to play the signal. (f) Record the signal for a period long enough to carry out the minimum desired number of measurements during playback. (g) If applicable, repeat steps (b) through (f) for other signal settings. Record at least a Male MLS signal for at least 15 seconds. When changing over to other signal settings, be sure not to change any sound card output or recording gain setting. 2. Adjust the total acoustical output level to get the LAeq,10 value for continuous speech, using the internal MLS signal and the Male source filter (and the telephone). 3. In DIRAC, select the Source Signal: corresponding to the played back excitation signal. 4. Select the Capture Length: corresponding to the capture length of the played back excitation signal. 5. Set the Pre-average: value to 1. 22 Measurement Case 3 The effect of outdoor area acoustics on speech intelligibility is to be measured. The effect of background noise is excluded, or the 15 dB SNR criterion is known to be met. All sound system microphone characteristics and secondary effects are also included. Fig. 16 Measurement setup in case of long distance sound system, using a mouth simulator Mouth Simulator Long distance Sound transmission system Omni-directional Microphone Digital sound recording device playing back previously recorded DIRAC excitation signal DIRAC running on notebook PC TOSHIBA 020188 The speech level does not have to be calibrated, but must be high enough to obtain SNR values exceeding 15 dB in each relevant octave frequency band. The situational setup is: 1. Place a mouth simulator at the talker’s position. 2. Connect the mouth simulator to the digital sound recording device, containing recordings of excitation signals recorded from the measuring PC running DIRAC. If necessary, perform such recordings (for instructions, see Situation 1: Talker and Listeners in Same Room without Sound System, Measurement Case 4 on page 16). 3. In DIRAC, select in the Measurement window the Source Signal: corresponding to the played-back excitation signal. 4. Select the Capture Length: corresponding to the capture length of the played-back excitation signal. 5. Set Pre-average: to any value, provided that the resulting SNR values exceed 15 dB in each relevant octave frequency band. 23 Measurement Case 4 The effect of outdoor area acoustics on speech intelligibility is to be measured. The effect of background noise is excluded, or the 15 dB SNR criterion is known to be met. All sound system microphone characteristics and secondary effects are excluded. Fig. 17 Measurement setup in case of long distance sound system, using direct injection Long distance Sound transmission system Omni-directional Microphone Digital sound recording device playing back previously recorded DIRAC excitation signal DIRAC running on notebook PC TOSHIBA 020189 The speech level does not have to be calibrated, but high enough to obtain SNR values exceeding 15 dB in each relevant octave frequency band. The situational setup is: 1. Connect the sound system input to the digital sound recording device, containing recordings of excitation signals recorded from the measuring PC running DIRAC. If necessary, perform such recordings. 2. In DIRAC, select in the Measurement window the Source Signal: corresponding to the played-back excitation signal. 3. Select the Capture Length: corresponding to the capture length of the played-back excitation signal. 4. Set Pre-average: to any value, provided that the resulting SNR values exceed 15 dB in each relevant octave frequency band. Brüel & Kjær is the sole worldwide distributor of DIRAC. For information on DIRAC, please contact your local Brüel & Kjær representative or the Brüel & Kjær headquarters in Denmark HEADQUARTERS: DK-2850 Nærum · Denmark · Telephone: +45 4580 0500 Fax: +45 4580 1405 · bksv.com · e-mail: [email protected] Australia (+61) 2 9889-8888 · Austria (+43) 1 865 74 00 · Brazil (+55)11 5188-8166 Canada (+1) 514 695-8225 · China (+86) 10 680 29906 · Czech Republic (+420) 2 6702 1100 Finland (+358) 9-755 950 · France (+33) 1 69 90 71 00 · Germany (+49) 421 17 87 0 Hong Kong (+852) 2548 7486 · Hungary (+36) 1 215 83 05 · Ireland (+353) 1 803 7600 Italy (+39) 0257 68061 · Japan (+81) 3 3779 8671 · Republic of Korea (+82) 2 3473 0605 Netherlands (+31)318 55 9290 · Norway (+47) 66 77 11 55 · Poland (+48) 22 816 75 56 Portugal (+351) 21 47 11 4 53 · Singapore (+65) 377 4512 · Slovak Republic (+421) 25 443 0701 Spain (+34) 91 659 0820 · Sweden (+46) 8 449 8600 · Switzerland (+41) 1 880 7035 Taiwan (+886) 22 713 9303 · United Kingdom (+44) 14 38 739 000 · USA (+1) 800 332 2040 Local representatives and service organisations worldwide 03/03 BO 0506 – 11 [1] Houtgast, T., Steeneken, H.J.M. and Plomp, R. Predicting Speech Intelligibility in Rooms from the Modulation Transfer Function. I. General Room Acoustics. Acustica vol. 46. 1980. pp 60 – 72 [2] International Electrotechnical Commission (IEC). IEC 60268–16. Sound system equipment – Part 16: Objective Rating Of Speech Intelligibility by Speech Transmission Index. 1998. [3] Schroeder, M.R. Modulation Transfer Functions: Definition and Measurement. Acustica vol. 49. 1981. pp 179 – 182 [4] Rife, D.D. Modulation Transfer Function Measurement with Maximum Length Sequences. Journal of the Audio Engineering Society vol. 40, no. 10. 1992. pp 779 – 790 [5] International Telecommunication Union Standardization Sector (ITU–T). ITU–T P.51. Recommendation P.51: Artificial mouth. 1996 [6] Houtgast, T., Steeneken, H.J.M. et al. Past, Present and Future of the Speech Transmission Index. TNO Human Factors, Soesterberg, The Netherlands, © 2002. ISBN 90–76702–02–0 Rosendahls Bogtrykkeri References