1
SolidSDD
Duplicate Code Detector
User Manual
For SolidSDD v1.4
March 2010
© 2007-2010 SolidSource BV
www.solidsourceit.com
Page |3
Contents
1
2
3
Introduction .......................................................................................................................................... 5
1.1
Supported configurations ............................................................................................................. 6
1.2
Installation .................................................................................................................................... 6
Main functions ...................................................................................................................................... 7
2.1
Basic code cloning terminology .................................................................................................... 7
2.2
GUI layout ..................................................................................................................................... 9
2.3
Creating a new project ................................................................................................................ 11
2.3.1
Line filter scripts .................................................................................................................. 13
2.3.2
Hierarchy files ..................................................................................................................... 14
2.4
Loading a project......................................................................................................................... 17
2.5
Running the duplication detection ............................................................................................. 18
2.6
Adjusting the project settings ..................................................................................................... 18
2.7
Generating reports...................................................................................................................... 21
2.8
Running SolidSDD in batch mode ............................................................................................... 23
2.9
Analyzing and managing duplication detection results .............................................................. 24
2.9.1
Analysis perspectives .......................................................................................................... 24
2.9.2
Clone management ............................................................................................................. 30
Usage example .................................................................................................................................... 32
© 2007-2010 SolidSource BV
www.solidsourceit.com
Page |5
1 Introduction
SolidSDD is an application for detecting and managing duplicate code. It can be used to analyze large
projects and detect code that has been cloned (e.g., via cut-n-paste operations) during development.
Identifying such code fragments can be very useful for facilitating development and maintenance, or for
reducing the memory footprint of an application.
In addition to identifying the duplicated code fragments, SolidSDD offers an intuitive graphical user
interface for assessing the similarity characteristics and the location of the duplicated code fragments in
the code stack. This enables developers/architects to manage the process of refactoring duplicated code
by assessing the required effort and establishing priorities.
The main features for SolidSDD are:
Fast and scalable
SolidSDD can analyze thousands of files in a matter of minutes1. It uses
caches for preprocessed information, so the second time it runs even faster.
In many scenarios it can be executed on the fly, enabling quick and timely
assessment of code duplication (e.g., before committing code to a versioning
repository).
Tolerant to variations
SolidSDD is white space (e.g., comment, spacing characters) agnostic.
Additionally it searches beyond exactly duplicated code fragments. Most of
the times when code is duplicated, developers perform small modifications
such as renaming variables or inserting/deleting some code. SolidSDD is able
to cope with such modifications, while still recognizing the modified piece of
code as a duplicate. Additionally, SolidSDD pinpoints the actual differences in
the code, so developers can easily assess the required refactoring effort.
Informative
SolidSDD can be used both by developers, architects and project managers.
The detailed code views enable developers to precisely locate the duplicated
code fragments; the visual overview enable architects to assess the
architectural implications of duplications in order to initiate and prioritize
refactoring; the aggregated duplication metrics enable managers to take
informed decisions regarding maintenance and trigger timely actions.
Configurable
The duplication detection engine of SolidSDD can be configured for various
detection strategies and accuracy levels to suit specific analysis contexts and
needs.
Easy to integrate
SolidSDD can be integrated in the build environment via its command line
interface. In this way the duplication detection operation can be executed in
batch mode, for example together with the nightly builds.
1
The recorded end-to-end analysis time of the Azureus code stack (Java application with 3240 files 28MB) on a
Intel® Core™2 Duo CPU @2.2 GHz with 4GB RAM was 68 seconds.
© 2007-2010 SolidSource BV
www.solidsourceit.com
Page |6
1.1 Supported configurations
SolidSDD supports currently the analysis of software stacks written in the C, C++, C# or the Java
programming languages. Other languages can be supported on demand.
System requirements:
Operating system: Windows 2000, NT, XP or Vista (32 bit);
Memory: 1GB minimum, 4 GB advised;
Graphics card: OpenGL 1.0 compliant in full-color (RGBA) mode, resolution of 1024 x 768
minimum, 1280 x 1024 or higher advised;
Hard disk space: 100 MB free minimum. The actual amount of free space required is dependent
on the size of the analyzed repository and the type of analysis being performed.
1.2 Installation
SolidSDD is delivered in binary form, with an associated installer that simplifies the installation process.
When running the installer (which is for the largest part self-explaining), one will be offered the option
to select from several installation modes. The minimal mode installs only the strictly required
components, and uses minimal disk space. The full mode installs also some examples of datasets from
already analyzed projects, and can be used to learn the functions of SolidSDD without having to first run
the analysis on a specific source tree. This mode requires extra disk space to be available.
© 2007-2010 SolidSource BV
www.solidsourceit.com
Page |7
2 Main functions
In this section, the main functionality of SolidSDD is described. After reading this, one should be able to
perform a basic scenario: create a new project, run the duplication detection process and analyze the
results. To get a better understanding of how SolidSDD can be used to perform real-life analysis
scenarios, the reader is advised to study the use case example presented in Section 3.
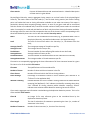
2.1 Basic code cloning terminology
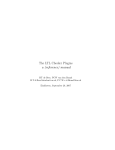
In order to understand how SolidSDD works and how to interpret the results, one should be familiar
with the duplication detection terminology. Here is a minimal set of terms and concepts one should
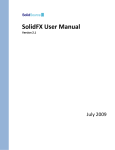
know before using SolidSDD (see also Figure 1):
Clone
An ordered set of statements that is repeated in a number of places in the
source code.
Clone instance
A (minimal) piece of code that includes the ordered set of statements associated
with a code clone.
Clone set
The set of all instances of a clone.
Cloning relation
An ordered pair of clone instances belonging to the same clone set. The first
clone instance of the pair is called the reference; the second clone instance is
called the cloning partner.
Clone fan-out
The number of files containing instances of given clone.
Local gap
A number of neighboring statements in a clone instance that are not part of the
ordered statement set of the associated clone. Local gaps are the result or code
insertion/deletion/change that typically takes place after duplicating code via
copy-paste operations.
Identifier renaming
The process of changing the name of identifiers (e.g., variable/function/type
name) after duplicating code via copy-paste operations. Code resulting from
copy-paste operations is rarely of immediate use during development. Such code
has to be adapted first to meet the specification that it implements. Together
with code insertion/deletion, identifier renaming is a common step performed in
combination with code cloning.
Cumulated gap
The sum of all local gaps from the beginning of a clone instance up to a given
statement, corrected with the gap decay. This metric is clone instance and
statement specific.
Gap decay
A decrease in the cumulated gap to be considered for each statement of a clone
instance that is part of the ordered set of statements of the associated clone.
This metric is clone instance and location specific being considered on the same
set of statements as the cumulated gap.
© 2007-2010 SolidSource BV
www.solidsourceit.com
Page |8
Figure 1: Basic clone detection terminology
File A
...
if (my_flag == 1){
int var2;
var1 = 1;
var2 = 1;
int var_sum = var1+var2;
Clone
int var_prod = var1*var2;
1: if (my_flag == 1)
Clone instance 1
int var1;
}
2: {
3: int var1
...
Clone set
4: int var2
5: var1 = 1
6: var2 = 1
7: int var_sum = var1+var2
8: int var_prod = var1*var2
9: }
File B
...
Identifier
renaming
if (my_flag == 1)
{
cumulated gap = 1
int var_diff;
var1 = 1;
var2_new = 1;
int var_sum = var1+var2_new;
Clone instance 2
int var1; int var2_new;
int var_prod =var1*var2_new;
var_diff = var1 – var2_new;
cumulated gap = 1.5
(assume gap decay = 0.1)
© 2007-2010 SolidSource BV
}
...
Local gap
www.solidsourceit.com
Page |9
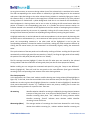
2.2 GUI layout
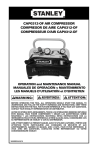
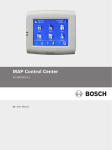
SolidSDD comes as a Graphics User Interface (GUI) with multiple interconnected display areas. The main
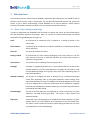
components of the GUI are depicted in Figure 2. These are:
Top menu
(highlight A)
Toolbar
(highlight B)
View mode selection
(highlight C)
A classical window menu that offers access to most of the application
features (e.g., duplication detection project management).
An icon based toolbar (see Figure 3 for a magnified view) that offers
shortcuts to some frequently used operations (e.g., run duplication
detection)
A number of tabs for choosing the view mode of the clone selection area.
Available view modes are:
Clone view: three lists enabling the user to select a cloning relation
by specifying the clone, the clone instance used as reference and the
clone instance used as cloning partner.
File view: two lists enabling the user to select all cloning relations
between two files by indicating the file where the reference
instances are located and the file where the cloning partner
instances are located.
Watchlist: similar to the Clone view, but includes only the clones
that have been previously marked as interesting for further
inspection.
Blacklist: similar to the Clone view, but includes only the clones that
have been previously marked as not interesting for further
inspection.
Clone selection area
(highlight D)
Reference file area
(highlight E)
Clone partner file area
(highlight F)
A number of lists (depending on the selected view mode) for selecting a
given set of cloning relations for further inspection.
The annotated code of the file containing the reference instance (or set of
instances) corresponding to the currently selected set of cloning relations.
The annotated code of the file containing the cloning partner instance (or set
of instances) corresponding to the currently selected set of cloning relations.
In a typical usage scenario, the user has to:
- Create a duplication detection project (see Section 2.3), or load a previously defined one (see
Section 2.4);
- Adjust the project settings (see Section 2.6), if necessary;
- Run the duplication detection process (see Section 2.5);
- Select a (set of) cloning relations in one of the available view modes;
- Inspect in detail the cloning metrics and the annotated source code of the reference and cloning
partner instances;
- Assess the distribution of the cloning relations (see Section 2.9);
- Generate duplication detection reports (see Section 2.7).
© 2007-2010 SolidSource BV
www.solidsourceit.com
P a g e | 10
A more detailed description of the SolidSDD GUI and clone analysis features is given in Section 2.9.
Figure 2: SolidCD GUI layout
A
Top menu
Toolbar
View mode selection
B
C
Clone selection (reference and cloning partner)
Annotated code of
reference instance
E
D
Annotated code of F
cloning partner instance
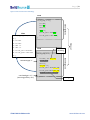
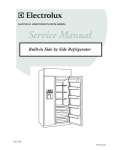
Figure 3: Application toolbar
Find clones
Remove clone
from blacklist
1
Move clone
to blacklist
Move clone
to watchlist
© 2007-2010 SolidSource BV
2
Remove clone
from watchlist
3
4 5
Qualify
filenames
6
Include watchlist
in the overview
7 8 9 10 11 12
Show clone
overview
Include blacklist
in the overview
Show duplication
summary
Generate report
Settings
www.solidsourceit.com
P a g e | 11
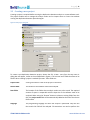
2.3 Creating a new project
Creating a project is required before running the duplication detection analysis on a new software stack.
The project enables one to manage the analysis results and to inspect them at a later time without
running the duplication detection procedure again.
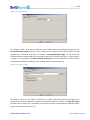
Figure 4: New project dialog box
A
B
C
D
To create a new duplication detection project, choose the File → New… entry from the top menu. A
dialog box will appear, similar to the one depicted in Figure 4. The minimal set of fields that have to be
filled in when creating a project is marked by arrows. These fields are:
Project name
A user given name to refer to the project in the future.
Source folder
The location of the software stack to be analyzed.
Data folder
The location of the folder where analysis results are to be stored. The required
amount of space is comparable with the byte size of the software stack to be
analyzed. When using the “Browse” button to select an existing folder form the
disk, the project name field will be automatically added at the end of the chosen
folder name.
Language
The programming language for which the analysis is performed. Only the files
that match this field will be analyzed. File extensions are used to perform the
© 2007-2010 SolidSource BV
www.solidsourceit.com
P a g e | 12
matching (e.g., .c and .h files will be associated with the C programming
language).
In the “Analysis settings” section, the dialog box contains a number of fields for tuning the settings of
the duplication detection process. These fields are required, yet have default values that should lead to
satisfactory results in most analysis projects. These fields can be adjusted afterwards if needed. They
are:
Local gap
The maximum size of a local gap in a clone instance (see Section 2.1). When
cloning code, users perform small modifications, such as renaming variables or
adding/deleting small portions of code. These modifications lead to differences
in the cloned code with respect to the cloning source. By accepting gaps when
searching for code clones, one can minimize the influence of modifications on
the duplication detection process, and discover clone instances that contain
(small) code modifications. This field sets the maximum size (in SolidSDD
statements2) of a contiguous modified piece of code that could be accepted as
part of a clone.
Cumulative gap
The maximum cumulative gap that can be built during comparison (see Section
2.1). Allowing the presence of gaps when searching for code clones could lead to
identifying relatively very different pieces of code as being similar. These pieces
could be parts of an original code clone that has been heavily modified, or can be
simply unrelated code parts, yet with a similar construction pattern. Such pieces
of code are less relevant for immediate consideration, and can make the
inspection of the overall results very difficult. The cumulative gap parameter
allows users to control the rate with which local gaps are allowed to become part
of code clones during detection. This parameter sets a maximum size (in
SolidSDD statements) for the cumulated gap in a clone instance.
Gap decay
The decrease in the computed cumulative gap upon detecting a duplicated
statement while comparing clone instances (see Section 2.1). Together with the
maximum cumulative gap this parameter can be used to control the rate with
which gaps are allowed to become part of code clones.
Minimum clone size
The minimum length of the reported clones (in SolidSDD statements). Clones
that are shorter than this will be discarded. Setting this threshold value too low
can significantly increase the number of reported clones (including false
positives) and makes the result inspection difficult.
2
A SolidCD measure of code that tries to abstract from language-specific definitions of a statement. In general, one
SolidCD statement can be considered to be equivalent with one language-specific statement.
© 2007-2010 SolidSource BV
www.solidsourceit.com
P a g e | 13
In addition to the required fields presented above, the “New project” dialog box contains also three
optional fields (highlighted by A, B, C and D in Figure 4). These are not required to perform duplication
detection, yet they can be used to filter the input or to enable extra analysis features:
File List
The path to a text file containing a list of files to be considered during duplication
detection. If this parameter is present, it will be used to filter source folder. The
text file should contain the full path of each file to be analyzed on an individual
line, and should contain files rooted in the source folder.
File filter
A set of wildcard expressions (one per line) indicating what files from the source
folder should be taken into account. Each expression should be preceded by a “-“
or a “+” indicating whether the files matching the expression should be removed
or included in the selection. The expression are processed in order from top to
bottom and are computed on the list of files in the source folder, filtered by the
file list filter if present.
Line filter
The filter to be used in order to restrict the duplication detection to a subset of
the lines contained in a file. This can be used, for example, to discard
automatically generated code from the analysis, when the position of such code
can be programmatically detected.
The drop list contains all registered filters. Filters are scripts written in the
Python programming language that use the open SolidSDD API. For more
information on line filter scripts (e.g., developing and registering line filters), see
Section 2.3.1.
Hierarchy
The name of a XML file containing an alternative hierarchical description of the
input. By default, the hierarchy given by the source code tree will be used for
aggregating and presenting the analysis results. This is called the physical
hierarchy. In addition to this, users can specify a logical decomposition of the
system (e.g., from an architectural point of view) and use this when analyzing the
duplication detection results. For more information on the XML schema used to
describe the logical hierarchy, see Section 2.3.2. During analysis users can switch
back and forth between the physical and logical hierarchies.
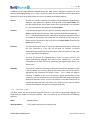
2.3.1 Line filter scripts
Line filter scripts are text processing programs written in the Python programming language and
implementing a simple line selection interface. The only method of this interface has the following
signature:
Name
GetSkipLines
Input parameters
file_name (name of the file being filtered)
© 2007-2010 SolidSource BV
www.solidsourceit.com
P a g e | 14
Output parameters
A list of all line numbers pointing to lines that will be discarded during
duplication detection.
Discarded lines will be treated as non cloned lines, so they may generate gaps in the reported cloned
code. Here is a sample line filter that can be used to discard the first 10 lines of each file during
duplication detection:
def GetSkipLines(p_sFile):
l_lLines = []
try:
fileHandle = open(p_sFile,'r')
lLines = fileHandle.readlines()
fileHandle.close()
except:
print >> sys.stderr,('ERROR: could not parse %s')%(p_sFile)
l_iRange = max(10,len(lLines))
l_lSkipLines = range(l_iRange)
return l_lSkipLines
2.3.2 Hierarchy files
Hierarchy files are used to give an alternative hierarchical description of the code (a logical hierarchy)
starting from the physical source code tree. This can be useful, for example, when looking at the code
from an architectural point of view.
The logical hierarchy is described using an XML notation. The non–leaf nodes of the hierarchy have user
defined names, while the leaf nodes are files in the source tree. Non-leaf nodes are constructed using
node tags:
<node name=”My node”>
/* Children nodes*/
...
</node>
The children of non-leaf nodes can be other non-leaf nodes or leaf nodes. Leaf nodes are specified via
tree, directory or file tags, each having two required attributes: action and location. The definition of
each
tag
and
required
attribute
is
given
in
© 2007-2010 SolidSource BV
www.solidsourceit.com
P a g e | 15
Table 2-1:
© 2007-2010 SolidSource BV
www.solidsourceit.com
P a g e | 16
Table 2-1: Leaf node specification of hierarchy files
Tag
Action
tree
Specifies in a recursive way all files in a given location. It takes precedence over
previous occurrences of tree. That is, when a non-leaf element uses the tree tag
to specify its leaf nodes, previous assignments of those leaf nodes to other nonleaf nodes done via a tree tag will be discarded.
directory
Specifies all files in a given location but it doesn’t work recursively, and it takes
precedence over tree entries and previous occurrences of directory.
file
Specifies one unique file location, and takes precedence over directory and tree
entries, and previous occurrences of file.
“add”
Indicates that the files referred by the tag should be added to the current
selection of the non-leaf node.
“remove”
Indicates that the files referred by the tag should be subtracted from the
current selection of the non-leaf node.
Location Gives the physical location of the element referred by the tag, enclosed in double quotes. The
path should be relative to the source folder (see Section 2.3).
Example: Assume the following physical hierarchy with source folder = “C:\”:
C:\Folder_X\Folder_Y\File1.c
C:\Folder_X\Folder_Y\File2.c
C:\Folder_X\Folder_Z\File3.c
C:\Folder_X\Folder_Z\File4.c
And the following hierarchy description:
<?xml version="1.0" encoding="utf-8"?>
<nodes>
<node name=”Component 1”>
<tree action=”add” location=”Folder_X”>
<directory action=”remove” location=”Folder_X/Folder_Y”>
<file action=”add” location=”Folder_X/Folder_Y/File2.c”>
</node>
<node name=”Component 2”>
<directory action=”add” location=”Folder_X/Folder_Y”>
<file action=”add” location=”Folder_X/Folder_Z/File4.c”>
</node>
</nodes>
© 2007-2010 SolidSource BV
www.solidsourceit.com
P a g e | 17
This will lead to the following logical hierarchy:
Root
Component 1
File2.c
File3.c
Component 2
File1.c
File4.c
In detailed steps, the above hierarchy is constructed as follows:
-
The whole physical hierarchy is added to Component 1 → Component 1 = { File1.c, File2.c,
File3.c, File4.c}
Folder_Y is subtracted from Component 1 → Component 1 = {File3.c, File4.c}
File2.c is added to Component 1→ Component 1 = {File2.c, File3.c, File4.c}
Folder_Y is added to Component 2→ Component 2 = {File1.c} (i.e., File2.c has been
previously assigned to Component 1 using a tag with higher precedence: file)
File4.c is added to Compoenent 2 → Component 2 = {File1.c, File4.c}, Component 1 =
{File2.c, File3.c} (i.e., Component 1 looses File4.c which gets assigned to Component 2 using
a tag with higher precedence: file)
2.4 Loading a project
After a duplication detection project has been created and the duplication detection procedure has
finished, results are saved and they can be inspected at a later time without running the duplication
detection again. To this end, one needs to load the project using the File →Open…menu entry in the top
menu.
When modifying files after running the duplication detection, the clone information can be corrupted
and become outdated. When loading a project, SolidSDD initiates a check of consistency (i.e., a progress
bar dialog pops-up with the caption “Checking files…”). This check tries to identify the files that have
changed in the meantime, and marks the duplication detection results that may have been invalidated
in the process. Invalid clones and files containing instances of invalid clones are marked via a golden ball
in the lists of the clone selection area (see Figure 5). This, however, is no guarantee that the marked
information is no longer valid, but only a warning. To make sure the information is consistent when
corruption warnings are issued, one needs to run the duplication detection process again.
Figure 5: Clone consistency warning
File containing
instances of a
corrupted clone
© 2007-2010 SolidSource BV
www.solidsourceit.com
P a g e | 18
Users can safely skip the consistency step at load time, if they are confident files have not been changed
in the meantime. This will speed up the loading, at the risk of introducing presentation inconsistencies if
changes did take place.
2.5 Running the duplication detection
To initiate the duplication detection process, one can press the “Find clones” button in the toolbar (i.e.,
button 1 in Figure 3) or alternatively, trigger the process using the Tools → Find clones menu entry.
When creating a new project, duplication detection is performed automatically. The process has two
main stages: preprocessing and extraction.
During preprocessing, SolidSDD analyzes each file and extracts a number of code features that will be
used when searching for clones. Depending on the size of the project, this stage can be time consuming,
yet it has limited requirements on the amount of memory available on the processing machine. Once
retrieved, the information is cached. The preprocessing stage has two steps, the progress of each being
displayed by progress bar dialogs:
Compiling input list…
Pre-processing…
The extraction stage uses the information cached during preprocessing to look for duplicates in the
code. This stage has 4 steps. The progress of each step is displayed using a progress bar dialog. The
information contained in all files has to be in memory during the extraction step. Consequently, for large
projects, this step can be very demanding on the amount of available memory (i.e., RAM). To cope with
very large projects, one could run the duplication detection process on a workstation with sufficient
RAM and, afterwards, distribute the raw results for further analysis and interpretation to users with less
capable workstations.
The extraction stage uses information cached by the preprocessor when possible. Files that have not
been changed since the last preprocessing stage are used from the cache when running the duplication
detection again. Files that changed are sent to the preprocessor first. When only a few files change
between consecutive runs of the clone detector, the preprocessing stage has little influence on the total
duration of the duplication detection process.
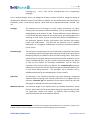
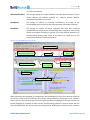
2.6 Adjusting the project settings
Once a duplication detection project is created, users can adjust many of the initial project and
application settings to better suit particular analysis needs at a given moment. In order to adjust
settings, one has to access the “Settings” dialog box. To this end, one can press the “Settings” button in
the toolbar (i.e., button 11 in Figure 3 ) or use the Settings →Settings…menu entry in the top menu.
The “Settings” dialog box has four sections (see Figure 6) that can be accessed using the corresponding
tab in the upper left part of the dialog box:
Project
Contains settings for selecting the input and tuning the duplication detection process.
© 2007-2010 SolidSource BV
www.solidsourceit.com
P a g e | 19
Filters
Contains settings for tuning the filtering of the duplication detection results.
Display
Contains settings for the location of the SolidSX application used to visualize the cloning
relations, the appearance of the annotated code, and the level of detail used for qualifying
file names.
Report
Contains settings for the type and amount of information included in generated reports.
The “Project” section is to be used with two main scenarios:
1. Importing duplication detection results generated on another machine. To this end, the
directory given by the Data folder parameter (see Section 2.3) on the machine used for
detection needs to be copied to the target machine. Next, the actual location of the original
input needs to be set (i.e., if this is different) by adjusting the Source folder parameter on the
target machine. Changes take effect when pressing the “Apply” button.
2. Tuning the duplication detection process parameters (see Section 2.3 for a detailed description).
After adjusting these parameters one has to run the duplication detection process again, for
changes to take effect (see Section 2.5).
Figure 6: The “Project” settings
The “Filters” section can be used to filter the results of the cloning detection process, such that only
relevant cloning relations are taken into account during inspection and reporting (see Figure 7). By
adjusting the Norm(#IDs) threshold parameter, a number of cloning relations can be discarded from
analysis and aggregation (see Section 2.9). Changes take effect when pressing the “Apply” button.
© 2007-2010 SolidSource BV
www.solidsourceit.com
P a g e | 20
Figure 7: The "Filters" settings
The “Display” section can be used to adjust the way in which results are presented (see Figure 8). The
De-qualified name length parameter can be used to set the number of path nesting levels presented
together with a file name in the GUI. For example, if De-qualified name length = 2, files names will
include the name of parent folders for the next two levels above in the file hierarchy (i.e., when button 6
in Figure 3 is not pressed). The show renaming consistency check box determines the color scheme
used to present identifier renaming in the annotated code areas (see Section 2.9).
Figure 8: The “Display” settings
The “Report” section can be used to customize the content of generated reports (see Figure 9). A
number of check boxes indicate the sections that will be included in the report. The Easy gain region
parameter can be used to set a threshold on the amount of clones considered when computing certain
project wide metrics (see Section 2.7).
© 2007-2010 SolidSource BV
www.solidsourceit.com
P a g e | 21
Figure 9: The “Report” settings
2.7 Generating reports
SolidSDD can aggregate the cloning information and export it to text reports in the comma separated
values (CSV) format. Such reports can be easily imported in spreadsheet processing applications (e.g.,
MS Office Excel) and further embedded in custom reporting systems.
To generate a report, one can press the “Generate report” button in the toolbar (i.e., button 12 in Figure
3) or alternatively, trigger the process using the Tools → Report menu entry.
The contents of the generated report can be customized using the Report tab of the “Settings” dialog
box (see Section 2.6). Five sections can be included:
Project wide metrics
Presents cloning metrics aggregated for the entire project. These metrics
try to answer the question What is the potential gain of removing
duplicate code? from the point of view of reducing the size of the
application.
Two sets of values are given. The first set gives the potential benefits of
removing all clones. The second set gives the total and relative benefit of
removing only a given percentage of the top longest clones. This
percentage is called Easy gain region and can be set on the Report tab of
the “Project settings” dialog (see Section 2.6)
Physical hierarchy metrics
Presents cloning metrics aggregated for the non-leaf nodes of the physical
hierarchy. A detailed description of these metrics is given below.
Logical hierarchy metrics
Presents cloning metrics aggregated for the non-leaf nodes of the logical
hierarchy (if present). A detailed description of these metrics is given
below.
File metrics
Presents cloning metrics aggregated on file level. A detailed description of
these metrics is given below.
© 2007-2010 SolidSource BV
www.solidsourceit.com
P a g e | 22
Clone metrics
Presents all detected clones and associated metrics. A detailed description
of these metrics is given below.
Physical/logical hierarchy metrics aggregate cloning metrics on non-leaf nodes of the physical/logical
hierarchy. The metric values of the leaf nodes (i.e., the file level cloning metrics) are used as starting
point. Leaf nodes that have no cloning information available are not taken into account. This aspect is
particularly relevant when computing average metrics, as sums for any given node will be normalized
with the number of considered leafs, instead of the total number of leafs present under the considered
node. For example, for a node with 100 leafs out of which only three have cloning information available,
the average value of a metric X will be computed as the sum of the X metric values corresponding to the
three leafs divided by three. Here is a list with the available hierarchy metrics:
Name
Level
Average cloned %
Average fan-out
Total #clones
Average #clones
Total #statements
Average #statements
The name of the considered non-leaf node (e.g., un-qualified folder name in
the physical hierarchy; user defined node name in the logical hierarchy);
The level of the non-leaf node in the hierarchy (i.e., the distance from the
root);
The average percentage of cloned lines per file;
The average clone fan-out per file;
The total number of clones affecting files under the non-leaf node;
Average number of clones per file;
The total number of cloned statements in files under the non-leaf node;
The average number of cloned statements per file.
File metrics are computed by aggregating the clone information of all clone instances located in a given
file. Here is a list of the available file metrics:
File name
The qualified name of the considered file.
Number of clones
Number of clones with clone instances in the file.
Clone fan-out
Number of files with which the file has cloning relations.
Clone coverage
Percentage of statements located in clone instances (also referred to as
“%Cloned” in the application GUI)
Identifier renaming
Indicates whether the file is involved in cloning relations that exhibit identifier
renaming (Yes/No/Partial). “No” indicates no identifier renaming takes place.
“Yes” indicates all cloning relations exhibit identifier renaming. “Partial”
indicates some relations exhibit identifier renaming, but not all of them.
Clone metrics aggregate raw information resulted during the duplication detection process. This is a list
of the available clone metrics.
Clone ID
An integer ID for easy reference given to the considered clone by the
duplication detection process.
Clone length
The size of ordered set of statements representing the clone (i.e., number of
statements in the clone).
Number of instances
Number of clone instances (i.e., the size of the clone set).
© 2007-2010 SolidSource BV
www.solidsourceit.com
P a g e | 23
Clone fan-out
Number of files containing instances of the clone.
Total gap
Total number of statements located in gaps in instances of the clone.
2.8 Running SolidSDD in batch mode
The analysis and reporting features of SolidSDD can be run also in batch mode using the embedded
command line functionality. To get a listing of the parameters that can be used in batch mode, run
SolidSDDcmd with the –h parameter on the command line.
© 2007-2010 SolidSource BV
www.solidsourceit.com
P a g e | 24
2.9 Analyzing and managing duplication detection results
After the duplication detection process completes (see Section 2.5) results are available for inspection. A
typical analysis scenario involves selecting a set of clone relations and, subsequently, inspecting the
annotated source code and the distribution of the cloning relations (see also Section 2.2).
2.9.1 Analysis perspectives
An analysis can be initiated from three main perspectives:
The file perspective
The clone perspective
The system perspective
The file perspective
In this perspective, the “File view” mode is used for selecting a set of cloning relations (follow highlights
in Figure 10). First a reference file has to be selected (highlight B). To this end, the user can inspect first
the cloning metrics corresponding to each file and included in the list (highlight D). For a detailed
description of these metrics see Section 2.7. Basic list sort operations are available and can be triggered
by pressing on the corresponding column headers. A user would typically be interested in investigating
first clones located in files with a high percentage of cloned statements.
Figure 10: The SolidCD GUI (File view mode)
Toolbar
View mode
I
G
Jump to next
difference in file A
A
Aggregated clone
metrics file A D
Selected reference (File A)
B
Selected cloning partner
(File B)
C
Swap files A and B
Annotated source
code in file A
Cloning metrics file B
(relative to A) D
H
Jump to next
difference in file B
G
E
Annotated source
code in file B E
File coverage overview
(clone instance position,
F
size, content)
© 2007-2010 SolidSource BV
www.solidsourceit.com
P a g e | 25
When selecting a certain reference file, a number of possible cloning partner files are displayed in the
second list of the clone selection area (see also Figure 2). Using the cloning metrics in these lists, one can
guide the selection of the most interesting cloning partner (highlight C). The cloning metrics presented
in the second list are relevant for the reference file. For example, the “%Cloned” column indicates the
percentage of the reference file (highlight B) that is cloned in the partner file (highlight C), and NOT the
other way around. Three metrics are used to describe the identifier renaming situation for the selected
pair of files:
ID renaming
Indicates whether identifier renaming is exhibited by the corresponding
cloning relation set. It can be one of No/Yes/Partial. “No” indicates no
identifier renaming takes place. “Yes” indicates all cloning relations exhibit
identifier renaming. “Partial” indicates some relations exhibit identifier
renaming, but not all of them.
#Renamings (#Ren)
The total number of renamings that have been detected.
#Renamed IDs (#IDs)
The total number of unique identifiers that have been renamed. In general
only a few different identifiers are renamed during cloning. Large values of this
metric can indicate false positives / uninteresting clones.
A default initial selection in the second list is proposed by the application, based on the maximum
percentage of cloned statements. Upon choosing a cloning partner, all relevant cloning relations are
selected and the annotated code areas are populated (see highlight E and Figure 11). A cloning relation
is considered as relevant for the chosen pair of files if the corresponding clone instances are located in
the chosen files.
Figure 11: Annotated code areas
Selected cloning relation
(not active)
Code not cloned
File coverage
overview
Active cloning relation
Highlight code
correspondence
© 2007-2010 SolidSource BV
www.solidsourceit.com
P a g e | 26
At any given moment, at most one cloning relation (out of the selected set) is considered to be active.
The code corresponding to the active relation is marked by a light blue background in the annotated
code areas. Code that belongs to the other selected cloning relations is marked by light green. Code in
the reference file (i.e., the left panel in the image) that is cloned but not covered by any of the selected
cloning relations is marked with a yellow background. Code that is not cloned can be identified by a
white background. A cloning relation can be set as active by clicking the left mouse button when the
pointer is located in the corresponding green area. It is possible that clone instances overlap. An
indicator situated in the status bar of the application shows the number of overlapping clone instances
at the location pointed by the mouse. By repeatedly clicking the left mouse button, one can cycle
through all clone instances (and their corresponding cloning relations) covering the given location.
A highlight mechanism is used to indicate the code correspondence in the two panels. By hovering with
the mouse over a valid statement (i.e., not a comment or white space) in the active relation area of one
panel, the corresponding statement in the other panel will be highlighted. It can be that the
corresponding statement is situated at another line position, making the visual comparison difficult. By
clicking the left mouse button, the two statements are horizontally aligned, making the assessment
easier.
The synchronization of the two panels can be affected by scrolling as follows: scrolling the left panel will
automatically scroll the right panel (the two panels are “linked”). Scrolling the right panel will not modify
the position in the left panel (the two panels are not “linked”).
The file coverage overview (highlight F) shows for each file what parts are covered by the selected
cloning relations and where identifier renaming took place (see also the clone perspective below).
Besides scrolling one can navigate the annotated code panels by using the “Jump to next difference”
buttons (highlight G). These will scroll the two panels to the next difference (local gap or identifier
renaming) in the corresponding clone instance of the active cloning relation.
The clone perspective
In this perspective, the “Clone view” mode is used for selecting one cloning relation (follow highlights in
Figure 12). To this end, three lists are available in the clone selection area (see also Figure 2). The top list
enables one to select a given clone (highlight J) based on a number of metrics (highlight K). Besides the
clone metrics described in Section 2.7, 5 additional metrics are present, enabling one to assess the
identifier renaming situation for a specific clone. These are:
ID renaming
Identifies whether identifier renaming is exhibited by cloning relations between
instances of the given clone. It can be one of No/Yes/Partial. “No” indicates no
identifier renaming takes place. “Yes” indicates all cloning relations exhibit
identifier renaming. “Partial” indicates some relations exhibit identifier
renaming, but not all of them.
#Renamings (#Ren)
The average number of renamings that have been detected for each cloning
relation that exhibits renaming (i.e., relations without identifier renaming are
© 2007-2010 SolidSource BV
www.solidsourceit.com
P a g e | 27
not taken into account).
#Renamed IDs (#IDs)
The average number of unique identifiers that have been renamed for each
cloning relation that exhibits renaming (i.e., relations without identifier
renaming are not taken into account).
Norm(#Ren)
The average of number of renamings normalized by the length of the
corresponding clone instance for each cloning relation that exhibits renaming.
Norm(#IDs)
The average of number of unique identifiers that have been renamed
normalized by the length of the corresponding clone instance for each cloning
relation that exhibits renaming. In general only a few different identifiers are
renamed during cloning. Large values of this metric (i.e., higher than 3) can
indicate false positives / uninteresting clones.
Figure 12: The SolidCD GUI (Clone view mode)
Overall clone metrics
Clone listing
(watchllist/blacklist/no list)
Cloning reference (File A)
L
Selected clone
N
J
Partner status P
(active / filtered)
K
Clone instance
metrics M
Selected cloning
partner (File B)
O
Full name file A
R
S
Identifier renaming markers
When selecting a clone (highlight J), the application fills the bottom lists of the clone selection area with
all instances of the clone set, enabling one to specify cloning relations by selecting the clone reference
and the partner instances of the pair. The left list gives the reference (highlight N); the right list gives the
partner (highlight O). A number of metrics can be used for making a selection. These are similar with the
ones described above, but concern only one cloning relation. Modifying the selection of the reference
© 2007-2010 SolidSource BV
www.solidsourceit.com
P a g e | 28
instance, affects the contents of the cloning partner list, and new metric values will be presented
according to the new possible pairs (i.e., cloning relations).
The Norm(#IDs) identifier can be a very good indicator of false positives / uninteresting clone relations.
Usually, relations with a Norm(#IDs) value lower than 3 are worth investigating. SolidSDD offers a way to
filter out the remaining relations, discarding them from the metric aggregation. To this end, one needs
to set the desired threshold for the Norm(#IDs) parameter in the “Settings” dialog box of the application
(see Section 2.6). Cloning relations that are included in the aggregation (i.e., Norm(#IDs) lower than the
threshold) are marked by a blue ball before the name of the file in the cloning partner list (highlight P).
The filtered relations are not marked with a ball, and have a faded blue/red text color, depending on the
cause of filtering. Red colored relations are automatically filtered via comparison with the threshold.
Blue colored relations are manually enforced by the user, using the pop-up menu commands that can be
accessed by right clicking with the mouse on a given entry in the partner list. The pop-up menu also
enables users to enforce consideration of interesting relations that have been automatically filtered out.
In all cases, manually enforced filtering takes precedence over the automatically performed one.
Both in the file and clone perspective, identifier renaming is marked using a special color encoding in
addition to the one for marking cloned text (i.e., depicted in Figure 11). This encoding partially depends
on the show renaming consistency parameter setting in the “Settings” dialog box (see Section 2.6). In
the basic operation mode (i.e., show renaming consistency is not checked) two colors are used to mark
identifier renaming. In the annotated code panel of the reference file, renamed identifiers are marked
with a green highlight, and corresponding identifiers in the partner panel are marked with a yellow
highlight (highlight S in Figure 12 shows several cases). When browsing the code, users can jump
between locations of renamed identifiers and local gaps using the “Jump to next difference” buttons
located in the upper area of each code panel (see highlight G in Figure 10). In the advanced operation
mode (i.e., show renaming consistency is checked) two additional colors are used: dark cyan and red.
Dark cyan is used in the reference (i.e., left) file panel to mark identifiers that are inconsistently
renamed. That is, for one name in the reference panel, two or more names are matched in the partner
panel after considering all detected renamings. In the partner (i.e., right) panel, identifiers that belong to
renamings that brake consistency are marked by red. Here is an overview of possible combinations:
Identifier A
(reference)
Identifier B
(partner)
Green
Yellow
A is consistently renamed to B (A is always different from B)
Yellow
A is renamed, but not consistently. An “ID A (dark cyan) → ID C (red)”
correspondence can be found in the code below this point. Mind the fact
that A doesn’t have to be different from B or C, but B is always different
from C.
Red
A is renamed, but not consistently. An “ID A (dark cyan) → ID C (yellow)”
correspondence can be found in the code above this point. Mind the fact
that A doesn’t have to be different from B or C, but B is always different
from C.
Dark cyan
Dark cyan
© 2007-2010 SolidSource BV
Situation description
www.solidsourceit.com
P a g e | 29
Local gaps are marked in the annotated code areas using a dark grey highlight.
The system perspective
In the system perspective, the SolidSX application that is bundled with SolidSDD is used to visualize the
overall distribution of the cloning relations and to navigate them (follow highlights in Figure 13). For a
detailed explanation of the SolidSX GUI and functionality, the reader is advised to consult the user
manual that comes with the SolidSX distribution. If installed, the SolidSX application can be invoked
from the application toolbar of SolidSDD by pressing the “Show clone overview” button (i.e., button 7 in
Figure 3). If the presence of SolidSX is not automatically detected by SolidSX, one can make it available
to the application by using the appropriate entry in the “Display” section of the “Settings” dialog box
(see Section 2.6).
Figure 13: The SolidSX GUI
G
Node display
settings
Relation display
settings
H
E
D
Relation
display filters
Node coloring
metric
Relation I
coloring metric
Node color scale
C
Relation
color scale
B
C
Clone relation
Input hierarchy nodes
A (source code tree)
Selected ordinal
relation display filter
F
SolidSX is a generic visualization tool that visualizes nodes in a hierarchy, relations between these nodes,
and metrics on both. The node are visualized as nested boxes placed in concentric rings (highlight A),
whereas relations are depicted as bundled curves (highlight B). SolidSDD uses SolidSX to visualize
physical or logical hierarchies and the associated cloning relations.
© 2007-2010 SolidSource BV
www.solidsourceit.com
P a g e | 30
SolidSX offers a wide range of selection and filtering scenarios. Color plays an important role - both
nodes and relations can be colored according to associated metrics from the duplication detection
process. The list of settings available in the upper left corner of SolidSX (highlight G) can be used to set
the coloring attributes for the nodes of the hierarchy, and the list in the upper right corner deals with
filtering and coloring relations (highlight H).
To choose a coloring attribute for nodes, one can click the “Coloring attribute” entry in the upper left
corner (highlight D) and choose one of the available metrics from the list that pops-up. An interesting
metric for many users is “Cloned %”, which gives an overview of the system components containing files
with a high percentage of cloned statements. Nodes with no information available (e.g., no clones have
been detected in the leaf elements) are depicted with a grey color.
To choose a coloring attribute for relations, one can click the “Coloring attribute” entry in the upper
right corner (highlight I) and choose one of the available metrics from the list that pops-up. Interesting
metrics in many scenarios are “Cloned %” and “Norm(#IDs)” (see also the file and clone perspectives).
To filter the displayed relations, one can use the “Filter” and “Ordinal filter” entries (highlight E). The
“Filter” entry can be used to visualize either individual cloning relations (i.e., “Type=Clone”) or
aggregated sets (i.e., “Type=File”). This filter can be also used to indicate whether cloning relations
filtered based on the Norm(#IDs) value should be included or not in the visualization (i.e.,
“Status=Active” means that relations that are filtered out will not be displayed). One can combine more
filters (e.g., “Type=File and Status=Active”) by holding down the SHIFT key when making the entry
selection in the pop-up window.
To filter relations based on a given metric value interval, one can use the “Ordinal filter” (highlight F).
This enables the user to set a “band pass” interval for a given metric. Only relations that fall in this
interval will be displayed. Users can set the limits of the “band pass” interval by clicking and dragging
boundaries in the associated scale visualization (highlight F).
The SolidSDD and SolidSX views are synchronized. Clicking on a relation in SolidSX will automatically
select that relation in the SolidSDD GUI, and the other way around. Clicking on hierarchy nodes in the
SolidSX visualization will have no effect on the SolidSDD GUI (i.e., no corresponding entries can be
identified in this case), except when clicking on leaf-nodes. In that case, the corresponding file in the
SolidSDD will be selected if it exists (i.e., the file has associated cloning information).
2.9.2 Clone management
SolidSDD enables users to manage the process of clone inspection via two additional view modes:
“Watchlist” and “Blacklist” (see also Section 2.2). These two modes are very similar in layout and
functionality with the “Clone view” mode, yet they only work with a subset of the entire collection of
detected clones. In the “Watchlist” mode, only clones that have been previously marked as interesting
are present, while in the “Blacklist” mode, only clones marked as not interesting can be inspected. The
operation of marking clones as interesting or not is further referred to as clone listing.
© 2007-2010 SolidSource BV
www.solidsourceit.com
P a g e | 31
Clone listing is persistent across analysis sessions and subsequent runs of the detection process. That is,
when a given clone is marked as interesting/uninteresting during analysis, it will keep that classification
next time when loading the project and even after running the duplication detection again, if the
associated clone set does not change.
Clone listing can be done while in the “Clone view” mode by using buttons 2, 3, 4 and 5 of the
application toolbar (see Figure 3). In this view, clones previously marked as interesting will be indicated
via a green box preceding the clone ID in the clone selection area, while uninteresting clones will be
indicated by a red box (see highlight L in Figure 12). These boxes and the associated clones are visible in
the “Clone view” mode only when the corresponding listing modes are enabled. The listing modes can
be enabled / disabled using buttons 8 and 9 of the application toolbar (see Figure 3).
Clones marked as not interesting will be discarded from all metric aggregations (e.g., clone metric
aggregation at file level) if the corresponding listing mode is not enabled (i.e., button 9 in Figure 3 is not
pressed).
In the “File view” mode, clone listing for the clones with instances in the presented files is suggested via
boxes preceding file names and a more complex coloring scheme:
Red
For files containing only clone instances of clones marked as
not interesting.
Light red
For files partly containing instances of clones marked as not
interested, and partly instances of not listed clones.
Green
For files containing only clone instances of clones marked as
interesting.
Light green
For files partly containing instances of clones marked as
interesting, and partly instances of not listed clones.
Blue
For files containing instances of both interesting and not
interesting clones.
When the listing mode corresponding to uninteresting clones is not enabled (i.e., button 9 in Figure 3 is
not pressed), the second list of the clone selection area in the “File view” mode will not contain entries
that would be marked using the first entry in the list above.
Irrespective of the enabled listing modes, the “Watchlist” mode will list all clones marked as interesting,
and the “Blacklist” mode will list all clones marked as not interesting. This enables usage scenarios in
which an architect inspects first the duplication detection results and marks the clones that need to be
removed from the software, and, subsequently, passes the information to a team of developers that
refactor the code and remove the corresponding cloning relations. To this end, both the architect and
the developers can use the SolidSDD application and pass refactoring targets via the listing mechanism.
© 2007-2010 SolidSource BV
www.solidsourceit.com
P a g e | 32
3 Usage example
In this section, a typical usage example of SolidSDD is presented. To illustrate the scenario steps, an
Open Source Software (OSS) project is used: Azureus. The source code of Azureus is available at the
project web page: http://azureus.sourceforge.net/. This section assumes the reader is familiar with the
main concepts, way of working, and user interface of SolidSDD. These notions are detailed in the first
two sections of the user manual.
A typical analysis scenario would start with creating a new project. The default parameters can be left
unchanged. The only mandatory information that has to be provided is the user given project name, the
location of the source code input, the folder where the results will be stored and the programming
language of the analyzed code (for details see Section 2.3). When a project is created, the duplication
detection process is run automatically. Depending on the size of the input and the chosen project
settings, the duplication detection process can take from a few seconds to many hours. In the case of
Azureus, the end-to-end duplication detection process takes approximately 1 minute3. When the
process finished, a summary dialog box is displayed reporting the number of clones and the elapsed
analysis time.
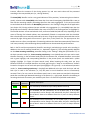
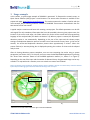
After de cloning detection process completes, one can start inspecting the results using a system
perspective (see Section 2.9.1). To this end, one has to start the bundled SolidSX application by pressing
the “Show clone overview” button of the SolidSDD application toolbar (i.e., button 7 in Figure 3).
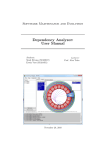
Depending on the size of the input and the number of detected clones, the generated image can be very
crowded. To cope with such a situation, users can switch to a coarser level of detail.
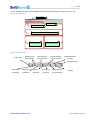
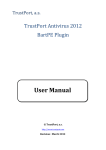
Figure 14: Choosing a level of detail for visualizing Azureus clones in SolidSX: a) The full tree contains many nodes and relations
b) The collapsed nodes aggregate information and make the image easier to inspect.
Choose an
appropriate level
a)
3
b)
Measured on an Intel® Core™2 Duo CPU @ 2.2 GHz with 4 GB RAM..
© 2007-2010 SolidSource BV
www.solidsourceit.com
P a g e | 33
To this end, one needs to set first the coloring attribute for the nodes of the hierarchy to “Level” and
select a coarser level by clicking with the mouse an entry in the associated scale. Levels are numbered
using capital letters starting from “A” for root and finishing with the last letter for the deepest nesting
level. When selecting a level, the corresponding nodes in the visualization are highlighted. By pressing
the key “C” (or choosing the Edit → Collapse entry in the top menu of SolidSX) the highlighted nodes will
be collapsed and will become “leaf” nodes in the visualization. This will reduce the level of detail
presented in the hierarchy and will aggregate relations making the image easier to inspect. In Figure
14.b level “D” has been chosen for visualizing clone relations in Azureus.
The next step of a typical scenario is the relation filtering. Not all cloning relations are relevant for a
given assessment. For example, when the user is interested in finding files that are linked by cloning
relations, only one relation between the files is enough to spot them. SolidSDD generates aggregate
relations for all cloning relations between two files. To visualize only these relations, one needs to
choose the “Type=File” entry in the pop-up window displayed by clicking on the Filter field in the upper
right corner of the GUI (see “The system perspective” in Section 2.9.1). Additionally, one would typically
be interested only in relations that have not been filtered out by the automatic comparison with the
Norm(#IDs) threshold. To remove the filtered out relations from the visualization, one needs to add the
‘Status=Active” entry to the selected filter. To do this, one should hold down the SHIFT key and select all
entries that have to be combined. By releasing the SHIFT key, the selection will be made and the pop-up
window discarded.
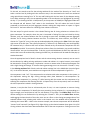
Once the appropriate level of detail is chosen and the uninteresting relations removed, one can enrich
the visualization by adding coloring attributes to nodes and relations. In a typical scenario, users would
be interested in cloning percentage. Duplication is easier to remove when it takes place between files
with a high cloning percentage. To visualize cloning percentage, users can choose the “Cloned %” entry
in the Coloring attribute field of both node and relation settings lists in the SolidSX GUI (see also Figure
13). In the case of Azureus, users would see an image similar to the one depicted in Figure 15.a.
One component is red: “util”. This component has no relations with other components in the system, so
the duplication causing the high cloning coverage takes place between its sub-components. By
expanding the component (i.e., pressing “E” while hovering with the mouse over the component or by
selecting the component and choosing the Edit → Expand entry from the top menu) users can identify
the sub-components involved in cloning relations.
However, it may be that from an architectural point of view, it is more important to remove cloning
relations across components. To identify the most promising cloning relations (i.e., corresponding to a
high coverage), one would have to look for red relations in the image. The Ordinal filter field of the
relation settings list can facilitate this. By selecting the “Cloned %” entry in the Ordinal filter window,
and dragging the lower border of the scale, users can set a filter on the cloning percentage value of the
selected relations. Only relations with values in the interval set in the window will be displayed. By
selecting the interval 80% – 100% in the Azureus example, two relevant components will be identified:
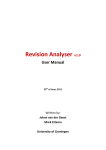
“azureus” and “azureus2” (see Figure 15.b). Right clicking on the relation between them gives a list of all
cloning relations that have been detected between files of the two components. Clicking on one of the
© 2007-2010 SolidSource BV
www.solidsourceit.com
P a g e | 34
relations will select the corresponding cloning relation in the SolidSDD GUI, making it ready for a more
detailed inspection.
Figure 15: Identifying files with a high cloning percentage
Ordinal filter window
a)
b)
If selecting the relation NotLoggedInException.java ↔ UISWTViewEventCancelledExcpetion.java in the
Azureus example, one would obtain a SolidSDD GUI appearance similar to the one depicted in Figure 16.
Figure 16: Synchronizing SolidSX and SolidCD
© 2007-2010 SolidSource BV
www.solidsourceit.com
P a g e | 35
Using the “Jump to next difference” button (see also Figure 10) users can inspect in SolidSDD all
differences between the two clone instances of the selected relation. In this way, they can easily reach
the conclusion the two exception classes are almost identical and they only differ by naming (i.e., as
opposed to functionality) and the hardcoded value of a constant.
This can be considered a good candidate for refactoring. Users can mark it as interesting for further
handling by switching to the “Clone view” mode in SolidSDD and pressing the “Move clone to watchlist”
button of the application toolbar (i.e., button 4 in Figure 3). Subsequently, the “Watchlist” mode can be
used as TODO list by a team of developers instructed with removing duplicate code.
© 2007-2010 SolidSource BV
www.solidsourceit.com