1
SECTION 6
BY-LAWS
SECTION 7
Performance – D-1
BLOOD TYPING
Generation III is basically an “information
highway” for breeders and users of Limousin
genetics. The primary goal is to comprehensively
describe characteristics of Limousin cattle in a
timely and accurate manner, such that appropriate selection decisions can be made.
The primary vehicles on the Limousin information highway are the multiple and single application for entry forms (see pages B-9 and D-4). Limousin breeders can choose to use either of these
forms when submitting information. Data items
included on the forms are identical. The only cattle
that cannot be processed using these forms are
those produced through embryo transfer. A SPE-
SECTION 5
Overview - A Year in the Life of
NALF Record Keeping
BREEDER INFO
The primary function of the North American
Limousin Foundation is to maintain the herd
book of pedigree and performance information
for Limousin breeders in North America. As the
breed has evolved and expanded, so has the
need to upgrade procedures for collecting, submitting and processing animal information. For
the purpose of positioning its members favorably
in an increasingly competitive seedstock industry, the North American Limousin Foundation
encourages a thorough understanding of the
Generation III system.
SECTION 4
Introduction
While animal information can be reported at
any time, NALF suggests that data be reported following each phase of production, after calving,
following weaning and again after yearling data
are collected. For most breeders, the multiple
application for entry is the form of choice. The primary vehicle is the Cow Inventory - Birth Report.
Limousin breeders receive these report forms automatically just prior to the start of the calving season with their current cow herd inventory and
other information pre-printed for added convenience. See example on page D-2. As calving season progresses, breeders are asked to collect as
much calving data as possible from newborn
calves. While some data items are mandatory for
registration, others are optional. Required items
are identified with an asterisk in the list of Generation III calving data fields listed here, however
the mandatory items are identified by red print on
the actual Generation III form.
DAM HERD ID/FC BREED
*DAM TATTOO/FC BIRTH YEAR
*DAM REGISTRATION/FC ID
DAM STATUS
*CALF’S SIRE REGISTRATION
*A.I. FROM/TO
*CALF TATTOO
*YEAR CODE
*LOC
CALF HERD ID
*BIRTH DATE
BIRTH GROUP
*SEX
TYPE
H/P/S
COLOR
BIRTH WT
EASE
CALF NAME
PERFORMANCE
D-10
D-12
Cow Inventory - Birth Report
SECTION 3
. D-1
. D-2
D-13
D-11
TRANSFERS
Cow Inventory/Birth Report . . . . . . . . .
Calving Report/Weaning Update . . . . . .
Dam Summary . . . . . . . . . . . . . . . . . . . .
Performance Record . . . . . . . . . . . . . . .
Weaning Summary/
Yearling Update . . . . . . . . . . . D-3,
Yearling Summary . . . . . . . . . . . . . . . . .
CIAL FORM IS REQUIRED FOR ET CALVES - SEE
THE SECTION ON EMBRYO TRANSPLANT CALVES
FOR INFORMATION, page F-1 and F-2.
SECTION 2
NALF Generation III
Information System
REGISTRATION
Performance
Programs
SECTION 1
INTRODUCTION
SECTION 4
SECTION 1
INTRODUCTION
SECTION 2
REGISTRATION
SECTION 3
TRANSFERS
SECTION 4
PERFORMANCE
SECTION 5
BREEDER INFO
SECTION 6
BLOOD TYPING
BY-LAWS
SECTION 7
Fig. D-1: Cow Inventory – Birth Report
Each of these items are defined in more detail
later in this section of the Members Manual,
beginning on page D-4.
Immediately following calving season, the
Cow Inventory - Birth Report forms, with recorded birth information, should be sent into the
NALF office for processing of birth data. For the
purpose of timely information exchange, breeders are asked to drive in the fast lane and report
birth information as soon as possible after calving season is completed. If you do not want to
register calves at this time, you must check the
“Do Not Register” box located in the far righthand column of the Cow Inventory - Birth
Report. Keep in mind, if you don’t plan to register the calves, NALF still wants all available performance information and will record it for a
$2.50 fee per head or $5.00 for non-members,
which applies to the registration costs. Calves
that die within 72 hours of birth are processed
free of charge. Complete data reporting is essential for calculation of reliable genetic values.
Calving Report - Weaning Update
The Limousin information highway travels in
two directions, both to and from Limousin breeders and NALF. Upon receipt of the birth data,
NALF will record all the pedigree and birth information, and return a Calving Report - Weaning
Update, see example included on page D-3. This
is actually the same vehicle as the Cow Inventory - Birth Report, but with the previously submitted calving information included. If you have
chosen to register the calves following calving
D-2 – Performance
season, you will also receive a “Performance
Record” for each animal (see description of Performance Record on page D-11).
Information on the calving report should be
checked for errors and then used for submitting
weaning data to NALF. Make corrections to errors
and return with the weaning data. Note: if the error
pertains to an animal that is already recorded, also
return the registration certificate at that time. Typically, following calving, cow-calf pairs are eventually sorted into one or more breeding pastures where
they remain until collection of weaning data. By
definition, each of these breeding pasture groups
becomes a contemporary group. By noting the pairs
which are in various breeding groups and the range
in calf age within each group, plans can be made as
to when to collect weaning information. These notes
can then be used to designate management practices from calving to weaning (WEAN GROUP AND
FOSTER/CREEP, see detailed discussion, page D-7).
Remember, if there is a 90-day age range among
calves in any one group, there is only one possible
day to collect weaning weights, such that all calves
are within age limits. In order for calf weaning information to be used for calculation of genetic values
(EPDs - Expected Progeny Differences), all calves in a
group must be weighed on the same day, when the
youngest calf in the group is at least 160 days old
and the oldest calf in the group is no more than 250
days of age. DO NOT WEIGH AND MEASURE EACH
CALF ON THE EXACT DAY IT IS 205 DAYS OLD as
you will end up with a series of contemporary groups
comprised of one animal. The date-calculation
wheel included with your original NALF Member’s
PERFORMANCE
SECTION 4
BREEDER INFO
SECTION 5
BLOOD TYPING
SECTION 6
BY-LAWS
SECTION 7
Performance – D-3
SECTION 3
After weaning information has been
processed, a Weaning Summary – Yearling
Update will be returned with space provided to
report yearling information (see example on
page D-10). The Weaning Summary should be
checked to insure that all weaning group and
TRANSFERS
Weaning Summary - Yearling Update
Once again, certain guidelines apply for collection of yearling performance information. In
order for data to be used in the genetic evaluation
system, animals must be between 330 and 450
days of age when yearling information is collected, and 140 days must have elapsed since weaning data were collected. As with collection of
weaning data, all animals in a group must be
evaluated on the same day, not on the exact
yearling birthday of each animal. All of the
above yearling performance traits must also be
evaluated on the same day. Failure to comply
with these guidelines renders the data unfit for
SECTION 2
Again, each of these items are described in
more detail later, beginning on page D-7.
performance information has been accurately
processed. At the end of each Weaning Summary, the average adjusted 205 day weaning weight
ratios for calves from each sire are summarized.
If animals have been registered, an updated Performance Record (see page D-11) with the latest
EPDs and accuracies will be provided.
As with weaning data, the collection and submission of yearling performance information is
optional, but recommended. The following are
yearling data items included in the Generation
III system. Again, those marked with an asterisk
are of particular importance:
*YEARLING DATE
*YEAR GROUP
*YEARLING WEIGHT
*YEARLING HEIGHT
*YEARLING SCROTAL MEASUREMENT
PELVIC HORIZONTAL MEASUREMENT
PELVIC VERTICAL MEASUREMENT
REGISTRATION
Manual was designed to help determine when to collect weaning and yearling data. Failure to collect
weaning data at the appropriate time will result in a
NOTIFICATION letter (see page B-11 and B-12) and
delay processing of performance information.
The “Do Not Register” box must be left blank if
you wish to register calves when submitting weaning data. Please refer to page A-10 for a breakdown of registration fees for different animal ages.
Again, even if you don’t plan to register an animal, please submit the performance data.
The following weaning data are not required
for registration; however, they are important in
that NALF’s genetic evaluation system is based
upon this information, particularly the items
marked with an asterisk:
*WEANING DATE
*WEAN GROUP
*FOSTER/CREEP
*WEANING WEIGHT
WEANING HEIGHT
DISPOSITION
DAM WEIGHT AT WEANING
DAM CONDITION
SECTION 1
INTRODUCTION
Fig. D-2: Calving Report – Weaning Update
INTRODUCTION
SECTION 1
SECTION 2
REGISTRATION
TRANSFERS
SECTION 3
SECTION 4
PERFORMANCE
SECTION 5
BREEDER INFO
SECTION 6
BLOOD TYPING
BY-LAWS
SECTION 7
inclusion in the genetic evaluation and results in
a NOTIFICATION letter from the NALF office, and
will delay processing (see pages B-11 and B-12).
Yearling performance information should be
sent to the NALF office as soon as possible after it
has been collected. After processing, NALF will
send a Yearling update which lists all birth, weaning and yearling information and provides averages for adjusted 365 day weight ratios by sire. If
the animals are registered, an updated Performance Record will be provided with updated EPDs
and accuracy values. Features of the Performance
Record are discussed later, see page D-11.
Fig. D-3: Sample Multiple Application Form
1
2
9
8
21
22
23
10
24
A Note About Important Data
Submission Cut-off Dates
Performance data from calves does not contribute to the calculation of EPDs for parents of
the calves until it is processed through the
National Limousin Genetic Evaluation at the
University of Georgia. Also, in order for the accuracies of EPDs to be upgraded from “P” or “P+” to
a numeric value, performance and group information must be evaluated by the University of
Georgia. Check with the NALF office to learn of
the cut-off dates, before which data must be submitted and processed error-free in order to be
included in the next National evaluation.
The Limousin information highway includes
the exchange of pedigree and performance information between each individual member and
NALF, between NALF and the University of Georgia and between NALF and all users of Limousin
genetics through the National Limousin Genetic
Evaluation Manual and other NALF reports sent
to commercial users of Limousin genetics.
Because accurate information is essential for
determination of genetic merit, a detailed explanation of each data item on the single and multiple application forms is provided here. Note:
All items in red on the actual form and shown in
this section with an asterisk must be completed
in order for the application to be processed.
Completing the Multiple
Application Form
1. DAM HERD ID – Ear tag number used to
identify a registered dam in your herd. Maximum of 6 numbers and letters. (If dam is a
foundation cow, see #3).
NOTE: If you haven’t previously reported
herd dam I.D.s, you can do so in this position
when you report the calf. Keep in mind the
herd inventory reports you receive are sorted
according to these herd I.D. numbers first; in
the absence of herd I.D. numbers, the reports
are listed according to tattoo numbers.
Remember, you can use up to six characters for the herd I.D. Also, if you’re expecting
to receive a herd inventory report sorted in
logical chronological order, here is how to
make it happen: always make sure all of the
I.D. numbers you report utilize the same
number of digits, i.e. if the largest I.D. number you are using is 2000 (four digits), then
you would report I.D. #1 as 0001 (again four
digits). Likewise, if the largest I.D. number
Fig. D-4: FC Breed Codes
1
2
3
4
5
6
7
8
9
– Angus
– Hereford
– Shorthorn
– Red Angus
– Brahman
– Santa Gertrudis
– Charolais
– Brangus
– Polled Hereford
D-4 – Performance
A
B
C
D
E
F
G
– Simmental
– Beefmaster
– Scotch
Highland
– South Devon
– Red Brangus
– Milking
Shorthorn
– Galloway
H
I
J
K
L
M
N
O
P
– Holstein
– Gelbvieh
– Jersey
– Murray Grey
– Limousin
– Maine Anjou
– Charbray
– Senepol
– Pinzgauer
Q
R
S
T
– Salers
– Red Poll
– Brown Swiss
– Texas
Longhorn
U – Guernsey
V – Tarentaise
W – Normande
X – Unknown
4. DAM STATUS – Used to inform NALF of
the status of this cow or heifer for the calf
crop being reported. Status codes enable
NALF to keep an accurate record of each
herd’s current inventory and monitor factors
affecting longevity. For status codes that
describe reasons for culling, enter the code
which indicates the primary cause.
NOTE: Leave space blank if cow or heifer produced a calf and information is included.
A cow used as embryo donor or recipient
B cow or heifer did not conceive or aborted,
but has been retained for breeding
C cow or heifer did not conceive or aborted,
was culled and should be removed from
herd inventory
D cow had calf that died at birth or within
72 hours following birth due to calving
difficulty but was retained for breeding
E cow had calf that died at birth or within
72 hours following birth due to calving
difficulty, was culled and should be
removed from the herd inventory
F cow had calf that died at or following
birth for reasons other than calving difficulty but was retained for breeding
Performance – D-5
BY-LAWS
dams, enter the complete registration number
of the dam including the three-letter registration prefix (i.e. NPF, NFF, NXF, etc.). The registration prefixes are described in more detail
on page B-7.
FC ID – For foundation cows, enter the eartag
number being used for this cow.
SECTION 7
Year . . . . . . . . Letter
2001 . . . . . . . . . . . . L
2002 . . . . . . . . . . . M
2003 . . . . . . . . . . . . N
2004 . . . . . . . . . . . . P
2005 . . . . . . . . . . . . R
2006 . . . . . . . . . . . . S
2007 . . . . . . . . . . . . T
2008 . . . . . . . . . . . . U
2009 . . . . . . . . . . . . V
2010 . . . . . . . . . . . W
3. *DAM REGISTRATION – For registered
SECTION 6
have herd prefix, tattoo, and year letter code.
You can find the Dam’s complete tattoo on
her registration certificate. Please refer to page
A-3 for information about obtaining a herd
prefix. Information about tattooing is provided on page E-2. The letters I, O and Q are not
used as NALF year letter codes.
FC BIRTH YEAR – For foundation cows, enter
the birth year of the cow. If available, also
provide the month and day of birth.
BLOOD TYPING
2. *DAM TATTOO – Registered dams, must
37
SECTION 5
36
you report is 999 (three digits), then you
need to report #1 as 001 (three digits also).
Etc., etc. This may sound like a small point,
but it will pay you big dividends in convenience and time.
*FC BREED – Used to identify the breed
makeup of a foundation cow (FC) that is the
dam of the calf to be submitted. Use the breed
codes in Fig. D-4 on page D-4.
SPECIAL NOTE: If the sire or dam of the calf to
be recorded is a registered animal of another
breed, please note the breed and provide the
animal’s registration number of the respective
breed and submit a copy of the dam’s or sire’s
registration certificate. Also, remember NALF
and the Canadian Limousin Association calculate blood percentage differently. For a complete explanation, please see the registration
section in this manual, page B-5.
Year . . . . . . . . Letter
1990 . . . . . . . . . . . . Y
1991 . . . . . . . . . . . . A
1992 . . . . . . . . . . . . B
1993 . . . . . . . . . . . . C
1994 . . . . . . . . . . . . D
1995 . . . . . . . . . . . . E
1996 . . . . . . . . . . . . F
1997 . . . . . . . . . . . . G
1998 . . . . . . . . . . . . H
1999 . . . . . . . . . . . . J
2000 . . . . . . . . . . . . K
20
BREEDER INFO
28
19
SECTION 4
18
PERFORMANCE
17
SECTION 3
27
16
TRANSFERS
26
15
SECTION 2
25
14
7
REGISTRATION
13
12
6
SECTION 1
INTRODUCTION
11
5
4
3
SECTION 1
INTRODUCTION
SECTION 2
REGISTRATION
SECTION 3
TRANSFERS
**G cow had calf that died at or following
birth for reasons other than calving difficulty, was culled and should be removed
from the herd inventory
**H cow was culled because of unacceptable
disposition, remove from herd inventory
**I cow was culled due to teat and/or udder
problems, remove from herd inventory
**J cow was culled due to old age, including
no teeth, remove from herd inventory
**K cow was culled due to unsoundness of feet
and legs, remove from herd inventory
**L cow was culled because of inferior calf
weaning weight, remove from herd
inventory
M cow was sold with papers, submit transfer to NALF
**N cow was sold without papers and should
be removed from herd inventory
**O cow died or was sold to slaughter for reasons other than those listed above.
** Please return Registration Certificate
to NALF; cow will be removed from
herd inventory.
SECTION 4
SECTION 5
BREEDER INFO
BLOOD TYPING
SECTION 6
PERFORMANCE
5. *CALF’S SIRE REGISTRATION – Enter
complete registration number including threeletter prefix (i.e. NPM, NFM, etc.)
6. *CHECK IF A.I. CALF – Check box if dam
was A.I. serviced.
7. *A.I. or OBSERVED BREEDING DATE
(Required if calf is the result of A.I.) – For A.I.
or observed breeding, enter month (Mo.), day
and year (Yr.).
8. *CALF TATTOO – The individual tattoo
given to each calf. As described above, the
tattoo consists of a herd prefix (typically 4 letters) and up to 4 numbers.
9. *YEAR CODE – The year letter code for the
birth year of the calf. See year letter codes listed on page D-5.
10. *LOC – Location of tattoo: L = left ear, R =
right ear, B = both ears.
11. CALF HERD ID (optional) – Your herd ID
(tag number) for the calf. Maximum of 6 letters and numbers. Please refer to Note on
Item 1 of these instructions for making the
best use of your I.D. numbers.
BY-LAWS
SECTION 7
12. *BIRTH DATE – Calf’s birth date (month,
day, year)
13. BIRTH GROUP – Different birth group
codes will cause calves to be separated into
D-6 – Performance
different birth contemporary groups. If
groups of cows on the same operation were
managed differently nutritionally, during
the last trimester of gestation, birth weights,
calving ease scores and gestation lengths
may be affected. Thus, different groups
should be designated. If more than one herd
prefix is represented in the same birth contemporary group (i.e. father/son, brothers,
partnerships, etc. managing cattle together),
then all calves should be coded as being in
the same birth group and submitted at the
same time in the same package. Please
attach a cover letter stating that calves
should be included in the same birth
group if calves with different herd prefixes are listed on separate forms. Different
groups should be designated on the form(s)
as 1, 2, 3, etc. NALF will separate the calf
crop into additional birth groups based on
season of birth, sex and percent Limousin.
14. *SEX – H = heifer, B = bull, S = steer. If
applications are filled out at weaning time,
bull calves that are castrated at weaning
should be listed as bulls. Bulls castrated at
weaning should be recorded as steers when
yearling information is submitted. Bull calves
castrated before 3 months of age should be
listed as steers at weaning.
15. TYPE – S = Single calf, TS = twin same sex,
TO = twin opposite sex, TR = triplet. In multiple births of mixed sexes, the females cannot
be registered until proven a breeder or blood
typed with the freemartin test (please see
Blood Typing section beginning on page F-1).
16. H/P/S
H = Horned: Bone-like growths that are firmly attached to the skull. May not appear in
Limousin until 6 or 7 months old. Calves
that are dehorned by any means must be
recorded as horned.
P = Polled or Smooth Polled: No horns, scurs
or horn-like growths on the skull and never
dehorned with paste, hot iron, mechanical or
surgical means.
S = Polled with Scurs: Small bone-like growths
that are in the hide and are not firmly
attached to the skull. Animals never
dehorned. Scurs may be present on only one
side of the skull and can appear as late as 12
or 13 months of age. Horned, polled and
scurred status may be reported when weaning
or yearling data is submitted on this form.
18. BIRTH WT. – Actual birth weight in
PERFORMANCE
SECTION 4
BREEDER INFO
SECTION 5
BLOOD TYPING
SECTION 6
BY-LAWS
SECTION 7
spaces. If left blank, NALF will use herd prefix
and tattoo for name. Breeders may use naming system of their choice. It is suggested that
the herd prefix and tattoo be included in the
codes will cause the calves to be separated
into different weaning contemporary groups.
NALF forms the weaning groups for breeders
based on the WEANING DATE, WEAN
GROUP, FOSTER/CREEP, SEX and percent
Limousin blood information stored in the
NALF computer. If you have calves that were
handled in different groups (good vs. poor
pasture), you must indicate these groups as 1,
2, 3, etc. It is the breeders responsibility to
separate the calf crop into different groups
SECTION 3
20. CALF NAME – Names cannot exceed 25
22. WEAN GROUP – Different WEAN GROUP
TRANSFERS
A = unassisted, calf born unobserved or without assistance
B = Some assistance, calf was assisted but not
by mechanical calf puller
C = mechanical assistance, mechanical calf
puller used
D = cesarean, calf taken by surgical cesarean
E = abnormal presentation, calf backwards,
breach or other abnormal presentation
requiring assistance
the calf weaning weight was taken. All calves
with the same management codes (wean
group and foster/creep codes) which are to be
included by NALF in the same weaning contemporary group should be weighed on the
same day. For extremely large groups that
cannot all be processed on the same day,
please indicate in a cover letter that all calves
are to be in the same weaning group. The
maximum spread in weigh days for these
groups is 5 days.
SECTION 2
19. EASE – Calving ease code:
21. WEANING DATE – Month, day and year
REGISTRATION
pounds taken within 48 hours of birth. Do not
submit estimated weights. If accurate weights
are not available, leave this space blank. Do
not estimate birth weight with a hoof or girth
tape.
name if possible. Name may be changed,
except for bulls after progeny have been submitted to NALF or semen has been sold. Additional rules apply to name changes, please
refer to Registration Section, page B-11, for
name change policies.
SECTION 1
1 = Red, no white other than underline
2 = Black, no white other than underline
3 = Red with white on face or body
4 = Black with white on face or body
5 = Cream color
6 = Other colors not listed above
INTRODUCTION
17. COLOR
Fig D-5: Determining Docility (Disposition) Score
DOCILITY SCORE
DESCRIPTION
1 DOCILE
mild disposition, gentle and easily handled, stands and moves slowly during processing, undisturbed, settled, somewhat dull, does not pull on
headgate when in chute, exits chute calmly
2 RESTLESS
quieter than average but slightly restless, may be stubborn during processing, may try to back out of chute, pulls back on headgate, some flicking of
tail, exits chute promptly
3 NERVOUS
typical temperament, manageable but nervous and impatient, a moderate
amount of struggling, movement and tail flicking, repeated pushing and
pulling on headgate, exits chute briskly
4 FLIGHTY (WILD)
jumpy and out of control, quivers and struggles violently, may bellow and
froth at mouth, continuous tail flicking, defecates and urinates during processing, frantically runs fenceline and may jump when penned individually,
exhibits long flight distance (see glossary for definition) and exits chute wildly
5 AGGRESSIVE
may be similar to score 4 but with added aggressive behavior, fearful,
extreme agitation, continuous movement which may include jumping and
bellowing while in chute, exits chute frantically and may exhibit attack
behavior when handled alone
6 VERY AGGRESSIVE extremely aggressive temperament, “killers”, pronounced attack behavior
Performance – D-7
INTRODUCTION
SECTION 1
SECTION 2
REGISTRATION
TRANSFERS
SECTION 3
SECTION 4
PERFORMANCE
BREEDER INFO
SECTION 5
SECTION 6
BLOOD TYPING
BY-LAWS
SECTION 7
Fig D-6: Determining Condition Score
(Richards, et al.)
CONDITION SCORE
DESCRIPTION
1
EMACIATED
Cow is extremely emaciated with no palpable fat detectable over spinous
processes, transverse processes, hip bones or ribs. Tail-head and ribs project
quite prominently.
2
POOR
Cow still appears somewhat emaciated but tail-head and ribs are less
prominent. Individual spinous processes are still rather sharp to the touch
but some tissue cover exists along the spine.
3
THIN
Ribs are still individually identifiable but not quite as sharp to the touch.
There is obvious palpable fat along spine and over tail-head with some tissue cover over dorsal portion of ribs.
4
BORDERLINE
Individual ribs are no longer visually obvious. The spinous processes can be
identified individually on palpation but feel rounded rather than sharp.
Some fat cover over ribs, transverse processes and hip bones.
5
MODERATE
Cow has generally good overall appearance. Upon palpation, fat cover over
ribs feels spongy and areas on either side of the tail-head now have palpable fat cover.
6
HIGH MODERATE Firm pressure now needs to be applied to feel spinous processes. A high
degree of fat is palpable over ribs and around tail-head.
7
GOOD
Cow appears fleshy and obviously carries considerable fat. Very spongy fat
cover over ribs and around tail-head. In fact, “rounds” or “pones” beginning
to be obvious. Some fat around vulva and in crotch.
8
FAT
Cow very fleshy and over-conditioned. Spinous processes almost impossible
to palpate. Cow has large fat deposits over ribs, around tail-head and below
vulva. “Rounds” or “pones” are obvious.
9
EXTREMELY FAT
Cow obviously extremely wasty and patchy and looks blocky. Tail-head
and hips buried in fatty tissue and “rounds” or “pones” of fat are protruding. Bone structure no longer visible and barley palpable. Animal’s mobility may even be impaired by large fatty deposits.
based on differences in management and
nutrition which calves may be exposed to
from shortly after birth to weaning age.
the weaning weight was taken. NALF will calculate a 205 day adjusted hip height and a
frame score.
23. FOSTER/CREEP – Indication for foster
26. DISPOSITION – Calf docility score at the
dam or creep fed.
F = Foster Dam
C = Dam with creep for 6 weeks or more.
time weaning data are collected. To be
assigned while processing cattle. See Fig. D-5
on page D-7.
24. WEANING WT. – Actual weight in
27. DAM WT. AT WN. – Actual weight in
pounds on the date indicated in the weaning
date field. Each calf must be individually
weighed when it is between 160 and 250 days
of age, inclusive. NALF will adjust all calves
to a standard 205 day weight and adjust
weight for age of dam differences. Do not
weigh all calves on the exact date when each
calf is 205 days of age.
pounds of the calf’s dam within a week of the
day the calf’s weaning weight was taken.
Because dam weights can change dramatically shortly after weaning, weights should be
collected as close as possible to the same day
that calf weaning weights are collected. This
enables NALF to use the calf weaning group
information to also serve as cow weight
groups. Ideally, dam condition scores (Figure
D-6) should be reported along with the dam
weights.
25. WEANING HT. – Actual hip height in
inches measured at the hip bone on the day
D-8 – Performance
centimeters, measured on the same day other
yearling information is collected. NALF will
calculate an adjusted 365 day yearling scrotal
circumference. Additional information regarding scrotal circumference can be found in the
Breeder Information section, page E-12.
29. YEARLING DATE – Month, day and year
SECTION 6
BY-LAWS
SECTION 7
Performance – D-9
BLOOD TYPING
If you have any questions about reporting
animal information and registration using
Generation III forms, or about collection and
submission of performance data, please contact the NALF office.
SECTION 5
inches measured between the hooks on the
day the yearling weight was taken. NALF will
calculate a yearling adjusted frame score. For
more information about calculation of frame
scores, refer to Breeder Information section,
page E-14.
mal being recorded is to be transferred at the
same time. An “Application for Transfer” form
must also be completed. These forms are available from the NALF office and are discussed in
detail in the Transfer section beginning on
page C-1. (On single application forms, be sure
to complete the “Transfer to” section.)
BREEDER INFO
32. YEARLING HT. – Actual hip height in
37. TRANS. INCL. – Check this box if the ani-
SECTION 4
on the date indicated in the YEARLING DATE
field. Each calf must be individually weighed
when it is between 330 and 450 days of age,
inclusive, and at least 140 days after weaning
weights were collected. NALF will adjust all
calves to a standard 365 day yearling weight
and calculate yearling weight ratios.
or not animal is to be registered by using this
box – check this box if you do NOT want animal to be registered.
PERFORMANCE
31. YEARLING WT. – Actual weight in pounds
36. DO NOT REGISTER – Indicate whether
SECTION 3
measurement in centimeters taken on the
day the yearling weight was taken. NALF will
calculate adjusted 365 day pelvic area. Page
E-13 provides additional information about
pelvic measurements.
codes will cause the calves to be separated
into different contemporary groups. If you
have calves that were managed in different
groups (i.e., high concentrate feeding vs.
high roughage feeding), you must indicate
additional yearling groups as 1, 2, 3, etc. It
is the breeders responsibility to separate the
calf crop into different groups by management and nutrition. NALF will separate the
calf crop into additional groups based on
date weighed, sex, foster/creep and percent
Limousin.
35. PELVIC VERT. – Actual pelvic vertical
TRANSFERS
30. YEAR GROUP – Different YEAR GROUP
tal measurement in centimeters taken on the
day the yearling weight was taken. NALF will
calculate adjusted 365 day pelvic area. Pelvic
measurements are discussed in more detail in
the Breeder Information section, page E-13.
SECTION 2
34. PELVIC HORIZ. – Actual pelvic horizonREGISTRATION
the calf yearling weight was taken. All calves
in one contemporary group should be
weighed the same day. For large groups
which cannot be weighed on the same day,
please indicate on a cover letter that they are
all in the same contemporary group with
maximum 5 day spread for weigh days.
SECTION 1
33. SCROTAL – Actual scrotal circumference in
within a week of the day the calf’s weaning
weight was taken. Dam condition scores may
be reported regardless of whether or not it is
possible to obtain a cow weight. Use the condition scoring system in Fig. D-6 on page D-8.
INTRODUCTION
28. DAM COND. – Condition score of dam
INTRODUCTION
SECTION 1
SECTION 2
REGISTRATION
Fig. D-7: Weaning Summary and Yearling Update
2
1
4
3
5
6
8
7
9
SECTION 3
SECTION 4
SECTION 5
BREEDER INFO
SECTION 6
BY-LAWS
SECTION 7
BLOOD TYPING
PERFORMANCE
TRANSFERS
10
Weaning Summary and
Yearling Update
As producers submit weaning information,
NALF processes the data and returns the Weaning
Summary and Yearling Update. The information
in the report is as follows (note, the numbered
items correspond with the numbers on example
forms):
1 Owner Information – The upper left
corner includes the membership number,
membership code, name, and address of the
owner of the progeny listed.
2 Contemporary group – In the opposite
corner appears all information that is specific
to this particular contemporary group. Listed is
the date the summary was printed, the contemporary group number, the page number of the
summary and the make-up of the contemporary group (sex, percent Limousin, etc.).
3 Birth Date/Calf ID – The calf ID listed
corresponds to the ear tag number submitted
at the time of weaning.
4 Calf Tattoo/Calf Registration – All
calves in the contemporary group that have
had weaning data submitted are listed with
their tattoo and NALF designated registration
number. In the case of calves that are not
registered, a number with the prefix URF
(unregistered female) or URM (unregistered
male) will appear as the registration number.
5 Sire Registration/Dam Registration
– The sire and dam for each calf are listed by
NALF registration number.
D-10 – Performance
6 Calf Description – Information reported
for the calf at birth is displayed in the center
columns of the Weaning Summary. This
includes the calf’s color, horned/polled/
scurred status, birth weight, adjusted birth
weight (calculated by NALF), calving ease
score, and age of dam.
7 Weaning Data – A summary of the
reported weaning information appears in the
center section of the report. The data includes
both the actual and adjusted weaning
weights, adjusted weaning weight ratio,
frame score, hip height, and the age of the
calf. Also included is the disposition score of
the calf and the weight and condition of the
dam at the time of weaning.
8 Actual Yearling Data – Space is
provided on the summary for the owner to
record yearling information to be reported
back to NALF. The date weighed, actual
weight, hip height, scrotal circumference and
pelvic dimensions may all be reported. A
column is also provided for the owner to
specify calves he or she may wish to register
at the time with NALF.
9 Group Averages – The average adjusted
birth and weaning weights for the
contemporary group appear at the end of
the Weaning Summary.
10 Overall Sire Average – At the bottom of
the report is listed the average adjusted
weaning weight ratios for the progeny of
each sire represented in the report. These
ratios are calculated across contemporary
groups for the entire calf crop.
PERFORMANCE
SECTION 4
BREEDER INFO
SECTION 5
BLOOD TYPING
SECTION 6
BY-LAWS
SECTION 7
Performance – D-11
SECTION 3
CE — Calving Ease Score (A, B, C, D, and E)
W HIP — Weaning Hip Height (in.)
FS — Frame Score (calculated for both
weaning and yearling hip heights)
DOC and CGA — Docility Score and
Contemporary Group Average Docility Score
Y HIP — Yearling Hip Height (in.)
PH — Pelvic Height (cm)
PW — Pelvic Width (cm)
PA — Pelvic Area (sq. cm)
MW — Mature Weight (lbs. — last recorded
cow weight)
CS — Condition Score (last recorded score)
MEAS DATE — Measurement Date for
Mature Weight & Condition Score of Cow
TRANSFERS
GL — Gestation Length (days)
DOC — Docility (probability units)
BW — Birth Weight (lbs.)
ST — Stayability (probability units)
WW — Weaning Weight (lbs.)
CW — Carcass Weight (lbs.)
YW — Yearling Weight (lbs.)
REA — Ribeye Area (sq. in.)
MA — Milking Ability (lbs.)
FAT — Fat Thickness (in.)
In addition to the trait abbreviations listed
above, under the sections of the performance
record titled “Individual’s Performance” and
“Progeny Performance” several additional
acronyms appear and are defined as follows:
SECTION 2
NALF’s new performance record is likely the
single most informative document ever produced
for individual Limousin animals. Along with
animal ownership, EPD and pedigree information, the new performance record includes a
comprehensive summary of individual, progeny
and daughters progeny performance.
While most of the abbreviations used on the
performance record for the traits are commonly
understood, the following is a complete description of the acronyms listed under the section
titled “Expected Progeny Differences”:
TM — Total Maternal (lbs.)
MARB — Marbling Score (units USDA score)
SC — Scrotal Circumference (cm)
REGISTRATION
NALF’s New
Performance Record
SECTION 1
INTRODUCTION
Fig. D-8: Performance Record
SECTION 1
INTRODUCTION
SECTION 2
REGISTRATION
SECTION 3
TRANSFERS
Computationally, NALF’s new Performance
Record includes the following enhancements:
• incorporation of continuous age of dam
adjustment factors for calculation of
adjusted birth weights and adjusted 205day weaning weights (see pages E9, E10 and
E11 of the NALF Members Manual for more
information)
• calculation and printing of adjusted birth
weight ratios (lower ratios are desired and
indicate genetics for lower birth weight of
individual compared to within herd
contemporaries)
• immediate computation of “P+” accuracy
EPDs for birth weight (previously, “P+” EPDs
for birth weight were not computed until
after submission of weaning data
• calculation of pedigree EPDs for a given
trait, as long as the animal’s sire has an
EPD with numeric accuracy and either the
dam has an EPD with at least “P” accuracy
or the maternal grandsire has an EPD with
numeric accuracy (previously, dams were
required to have numeric accuracy)
• for animals entering the NALF herdbook
and passing through batch processes,
computation and printing of pedigree EPDs
(“P” accuracy) for carcass traits (as long as
the criteria provided above are met)
• interim EPDs for yearling weight with “P+”
accuracy are no longer computed prior to
submission and processing of yearling data
Fig. D-9: Yearling Summary
1
4
BREEDER INFO
SECTION 4
SECTION 5
3
Yearling Summary
BLOOD TYPING
SECTION 6
PERFORMANCE
2
The Yearling Summary includes all the information previously reported in the Weaning Summary and Yearling Update. The summary date
refers to the actual date the summary was printed and not the date weights were recorded. As
before, each summary refers to a specific contemporary group and includes only those animals in
that group.
BY-LAWS
SECTION 7
1 Weaning Summary Number – The
invoice number for the weaning summary for
the listed progeny appears in the upper right
corner, just below the contemporary group
information.
2 Yearling Data – The listed yearling
information includes the actual yearling
D-12 – Performance
weight and age at which the weight was
recorded, adjusted yearling weight and ratio,
hip height, frame score, scrotal circumference
(actual and adjusted), and the pelvic
dimensions. For the pelvic area, both the
vertical and horizontal measurements are
reported along with the calculated area and
adjusted area.
3 Herd Average – As with the weaning
summary, average adjusted weights are
reported for the contemporary group.
4 Overall Sire Average – At the bottom of
the report the average adjusted yearling
weights and weight ratios for the progeny of
each sire represented are listed. These ratios
are calculated across contemporary groups
for the entire calf crop of that breeder.
4
3
1
SECTION 1
INTRODUCTION
Fig. D-10: Dam Summary
2
4 Expected Progeny Differences (EPDs)
– The most current EPDs and their corresponding accuracy values are printed just below the
EPD date information. The EPDs reported
include: gestation length, birth weight,
weaning weight, yearling weight, milking
ability, total maternal, scrotal circumference,
stayability and docility. See the section on EPDs
beginning on page D-20.
Calf Information
5 Calving History – Information on all of
the cow’s progeny, regardless of registration
status, that were reported to NALF appear in
the center of the summary. Also listed, in
addition to the calf’s tattoo and sire are the
8 Average Calving Interval and Age
at First Calving – The Dam Summary
includes reproductive performance history in
the form of the age at first calving and the
average number of days between calvings.
The Dam Summary may be ordered from
NALF at any time. To maximize the accuracy of
the summary, NALF suggests that breeders report
the performance of all of a cow’s progeny, regardless of their registration status or percent Limousin. Dam summaries are issued to the current
owner of the animal at no charge. If the dam
summary is requested by someone other than the
owner of record, there is a $2.00 charge.
Performance – D-13
BY-LAWS
horned/polled status (HPS) and color (CLR)
are provided along with the status codes for
these traits for each progeny.
calculated. MPPA is an indication of the
within herd rank of the cow based on the
average weaning weight ratio of her progeny.
Because MPPAs do not take into account the
growth influence of the sire, differences may
exist between two similar cows that are
mated to different sires.
SECTION 7
3 Horned/Polled and Color – The dam’s
7 Most Probable Producing Ability
(MPPA) – The cow’s MPPA is also
SECTION 6
hand area of the Dam Summary identifies
the cow by her herd I.D., registration number,
birth date, and tattoo code.
includes the average weaning weight and
yearling weight ratios for all bull and heifer
progeny.
BLOOD TYPING
2 Dam Identification – The upper left-
6 Production History – The Dam Summary
SECTION 5
the particular animal at the time of
registration appears near the top-left of the
Dam Summary.
BREEDER INFO
1 Name of Dam – The name designated to
SECTION 4
Dam Information – This section of the report
includes information about the dam.
animal’s birth date, calving ease score, sex,
gestation length, age of dam, color and
horned/polled/scurred information. Trait
ratios for each calf’s weaning weight and
yearling weight are also reported.
PERFORMANCE
Dam Summary
SECTION 3
8
TRANSFERS
7
SECTION 2
6
REGISTRATION
5
INTRODUCTION
SECTION 1
SECTION 2
REGISTRATION
NALF’s Performance Program
Introduction
By design, the NALF Generation III Information System provides the raw material (pedigree
and performance information) for NALF’s Performance Program. Together, this information comprehensively describes performance characteristics of Limousin cattle. In order to take full
advantage of the NALF Performance Program,
users of Limousin genetics should be knowledgeable of the program’s features.
SECTION 3
SECTION 4
PERFORMANCE
SECTION 5
SECTION 6
For purposes of laying a foundation for
understanding the Performance Program, a brief
discussion of “Basic Animal Breeding” may help
producers understand the processing of performance information.
The actual performance of any given animal,
be it birth weight, weaning weight or any other
measurement, is determined by the genetic
makeup of the animal and the environment to
which it is exposed (see figure D-11). Information
arrives at the NALF office in the form of actual
performance, which must then be adjusted for
environmental effects and further processed to
arrive at genetic values in the form of Expected
Progeny Differences (EPDs), which are defined
and discussed later.
Depending upon the trait, typically an animal’s performance is adjusted for the effects of
the animal’s age and the age of its dam. Specific
age and age of dam adjustment procedures are
discussed later. Differences in the performance
of groups of animals exposed to different
Fig. D-11: Factors which determine
an animal’s actual performance
BY-LAWS
SECTION 7
BLOOD TYPING
BREEDER INFO
TRANSFERS
Basic Genetics
D-14 – Performance
environments/management practices are
accounted for through the formation of contemporary groups, and through taking into account
the genetic ties between groups. Contemporary
groups are formed by NALF according to the
group and management information reported
by Limousin breeders.
Contemporary Groups
One key to determining an animal’s genetic
merit, is to accurately separate genetic and environmental effects on performance. Contemporary groups define an animal’s environment,
and allow genetics to be separated from environment. It follows that differences in the performance of animals which are treated alike (in the
same contemporary group) can most likely be
attributed to genetic differences between the two
animals.
So, what do you need to know about contemporary groups? The only requirement of Limousin breeders is that they report accurate group
information to the NALF office on the Generation III forms. Specifically, information regarding
birth groups (BIRTH GROUP), weaning groups
(WEAN GROUP), creep vs. no creep and yearling
groups (YEAR GROUP) are used by the NALF
computer along with sex, percentage Limousin,
birth date, and weigh date information to automatically form contemporary groups.
Putting it all together, a contemporary group
is a group of cattle of the same sex, within the
same percentage Limousin group, that were born
within a 90 day period, that have been managed
BY-LAWS
SECTION 7
Performance – D-15
SECTION 6
Birth weight has been identified as the single
most influential factor contributing to calving
difficulty. Subjective calving ease codes used by
NALF include:
A = Unassisted or unattended
B = Some assistance - non-mechanical
assistance
C = Mechanical assistance
BLOOD TYPING
Adjusted Birth Weight
and Calving Ease
SECTION 5
ed on all animals, even those which you do not
intend to register; the information is processed free
of charge.
Using ratios, let’s take a closer look at how
reporting performance on only the best animals
may adversely influence the ratios of the animals
from which performance was reported. As an
example, refer to the adjusted 205 day weight
ratios of animals reported in a group of 10, as
compared to the ratios if only the top 5 animals in
the group were reported, provided in table D-12.
If data on all 10 head were reported, ratios of
the heaviest 5 heifers would be 107, 105, 104,
103 and 101. On the other hand, if only the
heaviest 5 heifers are reported, you’d get ratios of
103, 101, 100, 99 and 97. Reporting complete
performance information on all animals gives us
a clearer picture of genetic differences between
animals. This goes for all traits.
BREEDER INFO
99
98
97
96
91
SECTION 4
500
497
490
485
463
PERFORMANCE
6
7
8
9
10
103
101
100
99
97
SECTION 3
As an example, a bull calf which had an
adjusted weaning weight of 630 lbs. in a group
which averaged 600 lbs. would have an adjusted
205 day weight ratio of 105. The ratio of 105
indicates that the bull was 5% heavier than the
average of the group.
NALF encourages breeders to report performance information on all cattle produced in order
to make the comparisons include as many animals as possible. While it only takes two animals
to make a valid group, reporting information on
only the best calves will diminish the comparative
performance of the animals reported and could
diminish the accuracy of their EPDs. With that in
mind, performance information should be report-
107
105
104
103
101
TRANSFERS
X 100
543
531
525
519
510
SECTION 2
)
1
2
3
4
5
REGISTRATION
(
Individual’s Adjusted Weight
—————————————————
Average Adjusted Weight of Group
Adjusted
Adjusted
205 Day
205 Day
Adjusted
Weight
Weight
Heifer 205 Day
Ratio
Ratio
Number Weight Group of 10 Group of 5
SECTION 1
Ratio =
Fig D-12: Comparison of ratios for
animals when information is
reported for all animals versus
when only the top animals have
weights reported.
INTRODUCTION
alike and weighed on the same date (except for
birth weight). Currently, animals are grouped
according to the following percentage Limousin:
1. 37% to 49% Limousin
2. 50% to 68% Limousin
3. 69% to 81% Limousin
4. 82% to 100% Limousin
Remember, if certain individual animals or
groups of animals are given preferential treatment, experience sickness or injury which has an
effect on their performance, or perform differently for managerial or environmental reasons,
then different group codes must be designated for
these animals. As a side note, do not weigh individual animals exactly when they turn 205 or
365 days of age. Rather, collect individual
weights for all animals of a group on the same
calender date, when the youngest and oldest animals of the group are within the age limit guidelines explained later in this section.
In order to use an animal’s own performance
in any given trait for the calculation of EPDs for
that animal, the animal must be in a contemporary group. Just as EPDs are comparisons
between animals, animals must be evaluated in
groups in order for their performance to be compared to the performance of other animals.
What’s important in the EPD calculations is how
individual animals compare to the average performance of the group of animals in which the
animal competed. Head-to-head comparisons of
animals on a level playing field form the basis of
EPD calculations.
A useful within-herd tool which allows easy
comparisons of animal performance are the trait
ratios which are part of the weaning and yearling summaries. Trait ratios are calculated for
weaning and yearling weight according to the
following formula:
SECTION 1
INTRODUCTION
SECTION 2
REGISTRATION
SECTION 3
TRANSFERS
SECTION 4
PERFORMANCE
SECTION 5
BREEDER INFO
SECTION 6
BLOOD TYPING
BY-LAWS
SECTION 7
D = Caesarean section
E = Abnormal presentation, i.e. breach,
leg back, etc.
In order to maintain its reputation as an
easy-calving breed, Limousin breeders are
encouraged to place selection pressure on birth
weight. Birth weights should be taken within 48
hours following birth. For the purpose of transforming actual birth weight data into EPDs for
birth weight, the raw data must first be adjusted
for age of dam, since young dams typically have
progeny with lower birth weights than mature
dams. The objective of the age of dam adjustment is to correct the actual birth weight for the
environmental influence of age of dam, on the
day the calf is born. Approximate Limousin age
of dam adjustment factors for bull and heifer
calves, which are added to the actual birth
weight by the NALF computer, are listed below:
Age of Dam
(Years)
Pounds of Adjustment
Bulls
Heifers
2
3
4
5
6 to 11
12 & older
+6
+4
+2
+1
0
+1
+5
+3
+2
+1
0
+1
Adjusted 205 Day Weaning Weights
Weaning weights are used to evaluate genetics for early growth and milk production. In
order for calves of the same sex and percent Limousin, with the same weaning group (WEAN
GROUP) and creep vs no creep management
codes to be in the same weaning contemporary
group determined by the NALF computer, all
calves in the group must be:
1) weighed on the same date,
2) at least 160 days of age and not older than
250 days of age.
The Date Calculation Wheel provided with
your original Member’s Manual should be used
to determine the range in possible dates appropriate for collection of weaning weights, such
that all calves are within the prescribed 90-day
age range. If you have more than a 90-day
range in birth dates, select a date when the
largest number of calves or the oldest calves will
be within the 90-day group, or weigh subsets of
the cattle on two separate dates. It is not necessary to actually wean the calves on the date
weaning weights are collected. Male calves castrated at weaning should be reported as bull
calves when weaning data are reported. If castrated prior to three months of age, male calves
should be reported as steers when weaning data
are reported.
As a reminder, scales used for collection of
weaning and yearling weights should be balanced before you begin processing cattle, and
checked after each animal is weighed.
For purposes of calculating Adjusted 205 Day
Weights, the actual weaning weights are adjusted for age and age of dam (AOD) according to
the following formula:
NALF and the University of Georgia (UG) utilize
a sophisticated procedure for adjusting birth
weights. Rather than considering age of dam
rounded to the nearest year of age, NALF and the
UG adjust birth weights for age of dam, according
to the dam’s age in days, on the day the calf was
born. For more information on age of dam adjustments, please refer to the Breeder Information section of this manual, page E-9.
NALF and the UG form
birth weight contemporary
Actual
Actual
groups based on Herd Prefix
Weaning
–
Birth
Adjusted
Actual Continuous
or Birth Group, Sex, Percent
Weight
Weight
X 205 + Birth +
AOD
205 Day =
————————————
Limousin, Year and Season.
Weight
Age in Days
Weight Adjustment
Another environmental factor which influences birth
weight is the season of year in which the calf was
If actual birth weights were not reported,
born. Typically, calves born in the Spring are heavstandard birth weights of 80 lbs. for heifers and
ier than calves born in the Fall. To account for the
85 lbs. for bulls are used for this calculation.
effects of season, the UG forms birth weight conThese standard weights are used only for purpostemporary groups based on season of birth, as
es of calculating adjusted 205 and 365 day
defined below:
weights.
Adjustments for AOD are made to help make
Season 1 = December 1 to February 15
adjusted
205 day weaning weights comparable
Season 2 = February 16 to May 30
across
various
ages of dams represented within a
Season 3 = June 1 to August 31
contemporary group, since younger dams typiSeason 4 = September 1 to November 30
cally express lower levels of milk production
((
D-16 – Performance
) )
Bulls
No Creep
BLOOD TYPING
SECTION 6
BY-LAWS
SECTION 7
Performance – D-17
SECTION 5
Yearling weight is the trait most closely associated with growth potential through market
age. In order for yearling weights and other yearling measures to be used for calculation of
adjusted weights, measures and yearling EPDs,
the yearling data must be:
1 taken at least 140 days after the weaning
weight was measured,
2 taken when the youngest animal in the
group is at least 330
days of age and when
Fig D-13: Formulas
the oldest animal is a
Actual Yearling Weight - Actual Weaning Weight
maximum of 450
Postweaning ADG = ————————————————————————
Number of Days Between Weights
days old,
3 accompanied by a
Adjusted
Adjusted
yearling group (YEAR
365 Day = (Postweaning ADG X 160 days) + 205 Day Weaning
GROUP) code,
Weight
Weight
4 taken on the same
date for all yearling
traits.
Average
Actual Yearling Weight - Birth Weight*
Daily Gain (ADG) = ————————————————————
Again, the data calNumber of Days Between Weights
Birth to Yearling
culation wheel can be
used to determine when
Adjusted
yearling weights should
365 Day = (ADG * 365) + Birth Weight + AOD Adjustment
be taken to insure that
Weight
as many animals as possible are eligible to be
*If a birth weight is not available, a standard 80 lbs. is used for heifers and 85 lbs. is
placed into yearling conused for bulls.
temporary groups. If ani-
BREEDER INFO
Adjusted 365 Day Yearling Weights
Adjusted yearling scrotal circumference (SC)
has been shown to be a good indicator of age at
puberty. Younger age at puberty has been linked
to higher conception rates and earlier calving
dates in females, an increase in the quality and
quantity of semen produced by bulls (with large
SC), and a host of related measures of production.
Yearling adjusted scrotal circumference in males
and age at first estrous in females have been
identified as virtually the same traits. Consequently, daughters of bulls that excel in yearling
scrotal circumference can be expected to reach
puberty earlier. See page E-12 for more detail.
For the purpose of making scrotal measurements comparable within a contemporary
group, measurements are adjusted for the effects
of age and age of dam. Scrotal circumferences
should be measured:
SECTION 4
Similar to AOD adjustments for birth weight,
NALF and the UG use a refined procedure for
making AOD adjustments to weaning weights.
Again, NALF and the UG consider the AOD in
units of days, rather than rounding the age of
dam to the nearest year of age. For a detailed
description of the age of dam adjustments,
please turn to pages E-10 and E-11.
Adjusted Yearling Scrotal
Circumference
PERFORMANCE
40
25
14
6
1.6
0
.1
2.7
8.4
SECTION 3
42
26
13
5
.6
0
.1
2.7
8.4
TRANSFERS
50
32
18
8
2
0
.2
3
9
SECTION 2
53
32
16
6
.7
0
.2
3
9
Heifers
Creep
REGISTRATION
2
3
4
5
6
7&8
9
10
11 & older
Pounds of Adjustment
Bulls
Heifers
Creep
No Creep
SECTION 1
Age
of Dam
(Years)
mals are treated differently from weaning to
yearling ages, they must be designated with different yearling group codes (YEAR GROUP). For
male calves castrated at weaning age, the sex
code should be changed to steer when yearling
data are reported.
If guidelines are met, each animal’s postweaning average daily gain (ADG) is calculated
and used along with the adjusted 205 day weaning weight to arrive at the adjusted 365 day
weight according to the first pair of formulas
given in Fig. D-13.
Occasionally, animals have a yearling weight
submitted, but have not had a weaning weight
collected. In such cases, adjusted 365 day weights
are computed using the second pair of formulas
in Fig. D-13.
INTRODUCTION
than mature dams. The NALF computer utilizes
continuous AOD adjustment factors for weaning
weight. These correspond closely to the weights
provided below:
SECTION 1
INTRODUCTION
SECTION 2
REGISTRATION
SECTION 3
TRANSFERS
SECTION 4
PERFORMANCE
SECTION 5
BREEDER INFO
SECTION 6
BLOOD TYPING
BY-LAWS
SECTION 7
1
2
3
4
using the same age guidelines as are used for
yearling weight
using a tape calibrated in centimeters
(available from NALF)
by the same person for all animals within
each group
according to the recommended technique
described in the Scrotal Circumference
LimGuide included on page E-12
data as do the guidelines for collecting yearling
weights which were previously described. For all
animals within each group, the same technician
should collect all pelvic measurements. NALF recommends using a device called the Rice Pelvimeter
to measure the height and width of the pelvis,
although other devices are available. Even though
the shape of the pelvis is not square, research has
shown that pelvic area can be expressed in square
(sq.) centimeters by simply multiplying the pelvic
height times the pelvic width:
NALF adjusts actual scrotal circumference
measurements to a standard 365 day age and
Pelvic Area = Pelvic Height X Pelvic Width
mature dam equivalent. Research has shown
that the yearling scrotal measurements of bulls
For the purpose of comparing animals, pelvic
from young dams (2 and 3-year-olds) and old
areas are adjusted to a constant 365 days of age
dams (11 and older) are smaller for environmenusing the following formula:
tal reasons and should be adjusted
upward. Presumably, this effect is due to
Adjusted 365 Day Actual *Growth
lower milk production for cows in these
Pelvic Area = Pelvic Area +
age categories. The following formula is
Growth Coefficient X (365 - Actual Age)
used to calculate adjusted yearling scrotal
*The growth coefficient is .27 sq.cm/day for heifers and .25 sq.cm/day for bulls.
circumferences:
In the short-run, breeders are
advised to use pelvic information as a culling tool to eliminate females with exceptionally
Age of Dam (AOD)
Centimeters (cm) of Scrotal
small areas. Once enough
(Years)
Circumference (SC) Adjustment
pelvic data is collected, NALF
2
+.52
intends to investigate using this
3
+.42
information for the calculation
4 to 10
0
of EPDs for maternal calving
11 & older
+.35
ease. For a more complete discussion of how to interpret and
For additional information regarding collection
use pelvic information, refer to page E-13.
and use of scrotal circumference data, please refer
Frame Scores
to page E-12. The Breeder Information section
Frame scores are actually hip heights which
beginning on page E-1 also includes information
have
been adjusted for age and converted to a
regarding culling decisions for weaning age bulls.
numeric scale. Limousin breeders may report hip
Adjusted Yearling Pelvic Area
heights (expressed in inches) for weaning and/or
Most calving difficulty results when the size of
yearling age cattle. NALF recommends that height
the fetus is too large relative to the size of the
measurements be collected at the same time other
dam’s pelvic dimensions. While research shows
weaning and yearling performance data are colthat birth weight is over four times more imporlected. Page E-14 provides a detailed description of
tant than pelvic size in determining calving diffihow to collect hip height measurements.
culty, pelvic area is still the most important
The frame score can be useful in describing
maternal genetic factor which is easily measured.
the maturity pattern and projected mature size
Pelvic area is an internal measurement which
of cattle. Along with mature weight and milk
requires rectal palpation with a measuring device.
production information, frame sizes can be used
Measurements should be taken at the same time
as indicators of nutritional maintenance requireanimals are evaluated for other yearling traits. The
ments and slaughter endpoints.
same guidelines for age apply to collecting pelvic
Yearling
SC
Adjusted SC = Actual SC + .0467 cm/day (365 – Age) + AOD
Adjustment
Fig D-14: Frame Scores
Bull Formula:
Frame Score = -8.6955 + .3755 (Height) - .02063 (Days of Age) + .0000051 (Days of Age)2 + .0001521 (Height) (Days of Age)
Heifer Formula:
Frame Score = -10.9325 + .4251 (Height) - .01645 (Days of Age) + .0000048 (Days of Age)2 + .0000928 (Height) (Days of Age)
D-18 – Performance
BREEDER INFO
SECTION 5
BLOOD TYPING
SECTION 6
BY-LAWS
SECTION 7
Performance – D-19
SECTION 4
3
PERFORMANCE
2
Honest and accurate weights and measures
collected according to the guidelines for age
and measurement techniques,
Complete and accurate birth, weaning,
yearling and creep vs. no creep group
information from which NALF forms
contemporary groups, and
Timely submission of data, appropriate
adjustments and further processing for the
calculation of EPDs.
SECTION 3
1
TRANSFERS
The performance data collected and submitted
by Limousin breeders is by far the most important
element in NALF’s overall genetic evaluation program. Reliable genetic values are only possible if
the raw data from which they are derived is provided by breeders. As a review, accurate performance information is a function of:
SECTION 2
Accurate Data Is Imperative
REGISTRATION
Disposition or docility is defined as the ease
with which animals yield to handling or treatment and their submissiveness to training or
management. Problems associated with docility
represent a risk to the safety of handlers, an animal welfare concern, added potential costs for
appropriate handling equipment, a potential liability to meat quality, a threat of reduced performance in related traits, and a serious public relations problem.
Specific behaviors of interest include; the reaction of animals while processed through a squeeze
chute, maternal instincts at or around the time of
calving, newborn calf vigor, reproductive behaviors such as serving capacity, and an animal’s foraging behaviors. Since these are distinctly different behaviors, different strategies are necessary to
quantify differences among animals.
The scoring system provided on page D-7 is
designed to subjectively evaluate differences in
behavior during the time animals are processed
under uniform conditions through a squeeze
chute. Because an animal’s behavior can be
influenced by past experiences, the NALF scoring
is to be conducted at the same time other weaning data are collected. Again, the same age
guidelines are used for disposition scoring as the
ones used for collection of weaning data
described earlier. At this time, the need for
adjustment factors has not been determined.
NALF implemented collection of dam weight
and condition scores to provide data to describe
genetic differences in mature size and fleshing
ability within the Limousin breed. Since a cow’s
weight and condition can fluctuate depending
upon her stage of production, NALF requires that
this information be collected at the same time
weaning data are collected. Because it is often
difficult to collect both weaning data from calves
and process cows on the same day, cow information is useful as long as it is collected within a
week of the date the calf’s weaning data was collected. The condition scoring system is described
on page D-8.
While it is recommended that both dam
weight and condition information be collected, if
it is not possible to weigh cows, collection of condition score data alone is still useful. Currently,
adjustment factors for these traits have not yet
been developed. In the long run, it is NALF’s
intention to develop EPDs for these traits to enable
breeders to more easily select for optimum sizes
and adequate levels of fleshing ability.
SECTION 1
Disposition Scores
Dam Weight and Condition
Score at Weaning
INTRODUCTION
Since bulls and heifers typically grow and
mature at different rates, the formulas used for
calculating frame scores are different for each
sex. NALF automatically calculates frame scores
for animals when hip heights are reported. Formulas used for frame score calculations are in
Fig. D-14 on page D-18.
For quick reference, Limousin Frame Score
Charts for bulls and heifers are provided on page
E-14 of this manual. The Limousin Directions
Recommendations Manual suggests that breeders target the production of frame score 5, 6 and
7 animals as optimums for most production
environments.
INTRODUCTION
SECTION 1
SECTION 2
REGISTRATION
SECTION 3
TRANSFERS
SECTION 4
PERFORMANCE
SECTION 5
BREEDER INFO
SECTION 6
BLOOD TYPING
BY-LAWS
SECTION 7
EPDs: A User’s Manual
Introduction
Buying the “right” bulls is the key to genetic
improvement, and to a satisfying experience
with Limousin genetics. The secret to buying the
“right” bulls is making smart use of expected
progeny differences (EPDs). EPDs represent the
most reliable performance information available
for selection. Understanding how to interpret
EPDs for Limousin cattle is the first step toward
buying the “right” bulls.
In basic terms, an EPD predicts the difference
in performance of future offspring of a parent, as
compared to offspring from other parents. EPD
calculations utilize all available pedigree and
performance information, and account for; differences in environment from which data were
submitted, the heritabilities and genetic relationships among traits, nonrandom mating (selective
breeding to only the best mates), and level of
competition within and between groups. Since
only “Registered Limousin” cattle have EPDs
provided on their “Performance Records” and
other NALF documents, cattlemen are encouraged to always insist that animals be registered,
and ownership be transferred, such that updated
genetic information may be provided.
Before thinking about EPDs for individual
traits, the basic concept of EPDs is that they
serve to rank animals according to additive
genetic merit for a given trait. The accompanying tables provide the average EPDs for current Limousin sires and percentile breakdown
information, both of which give benchmarks to
determine where animals rank, genetically, in
the population.
Gestation Length (GL) EPDs
Gestation length EPDs predict genetic differences in gestation length, and are calculated
from breeding and calving date information on
A.I. sired calves. Different from other traits, gestation length EPDs are expressed in days. Low
gestation EPDs are desired, and indicate genetics
for shorter average gestation lengths of offspring.
The advantages of shorter gestation length
include: a small increase in post-partum interval
and thus slightly improved re-breeding performance; slightly decreased birth weight and an
associated subtle improvement in calving ease,
primarily for first calf heifers; a slight increase in
actual weaning weight because increased age at
weaning for shorter gestation length cattle.
As an example of how to use gestation length
EPDs, consider the following two bulls:
D-20 – Performance
GL EPD
Bull A
-3.0 days
Bull
B
+2.0 days
_______________________
Difference
= 5.0 days
For this example, if bulls A and B were bred
to comparable groups of cows, calves from bull A
would be expected to be born 5 days earlier (on
average) than calves from bull B due to differences in the genes for gestation length from these
two sires. If follows that cows bred to bull A
would have 5 days longer to recover from calving
before the start of the next breeding season.
Generally, because of the small but favorable
genetic relationships between gestation length
and birth weight, bull A’s calves would be
expected to be born with less calving difficulty as
compared to calves from bull B. Because calf
birth weight is more closely related to calving
ease than gestation length, birth weight EPDs
should continue to receive primary emphasis,
while at the same time sires with high, positive
gestation length EPDs should be avoided for use
on heifers.
Birth Weight (BW) EPDs
Birth weight has been identified as the single
most influential factor contributing to calving
difficulty. In studies of birth weight data, birth
weight EPDs of sires has been shown to be the
single most accurate genetic predictor of differences in calf birth weight. Generally, lower
birth weight EPDs are desired, and indicate
genetics for smaller calves at birth and less associated calving difficulty.
Here’s how birth weight EPDs work. Consider
the following two bulls for use on first-calf
heifers, and the difference between their birth
weight EPDs:
BW EPD
Sire A
–2.5 lbs.
Sire
B
+2.5
lbs.
_______________________
Difference
= 5 lbs.
If bulls A and B were each bred to similar
groups of heifers, based on their birth weight
EPDs we would expect calves from bull A to have
birth weights that average 5 lbs. less than calves
from bull B. Lower birth weight EPDs indicate
lighter progeny birth weights, which generally
should translate into less potential for calving
difficulty for calves from sire A as compared to
those from sire B.
BY-LAWS
SECTION 7
The difference in total maternal EPDs
between sires A and B is 15 lbs. Calves out of
daughters of sire A would be expected to weigh
15 lbs. more at weaning as compared to calves
from daughters of sire B, due to both genes for
milk the sire passed on the his daughters and
genes for weaning growth that the daughters’
calves inherited from their maternal grandsire.
Total maternal EPDs are useful because neither
the weaning or milk EPD entirely predicts the
weaning performance differences of calves from
daughters.
SECTION 6
The difference in milk EPD of bulls A and B is
10 pounds. Daughters of bull A would be expected to wean calves that are 10 pounds heavier
than the calves from daughters of bull B, due to
genes for milking ability the daughters inherited
from their respective sires.
It is important to remember that the level
of milk EPD which is “best” depends upon a
number of factors, including; whether or not
daughters are retained for breeding, the
length of time calves are fed following weaning before they are marketed, the cost and
availability of feed, and the milking ability of
the cows to which the bulls are mated. A high
level of milk will result in heavy calves at weaning from daughters, but is also likely to cause an
increase in maintenance requirements and
potentially lower expressed reproductive perfor-
15 lbs.
BLOOD TYPING
= 10 lbs.
10 lbs.
SECTION 5
Difference
= 10 lbs.
BREEDER INFO
Milk EPD
Bull A
+5 lbs.
Bull
B
–5 lbs.
_______________________
Difference
SECTION 4
Since milk is a trait only expressed in daughters, and because milk is not directly measured,
milk EPDs are expressed as differences in pounds
of weaning weight of calves from daughters, due
to genes for milk passed from sires to daughters.
An example helps make milk EPDs easier to
understand. Let’s look at the following two bulls:
PERFORMANCE
Milk (MA) EPDs
WW EPD MA EPD TM EPD
Bull A
20 lbs.
10 lbs.
20 lbs.
Bull
B
10
lbs.
0
lbs.
5 lbs.
________________________________________
SECTION 3
Because of his advantage in growth EPDs,
bull A would be expected to pass on genes to his
calves which result in 10 more pounds at weaning and 20 more pounds at yearling as compared to calves from bull B, when bred to comparable cows. This weight difference is due to genes
for growth the calves inherited from their sires.
TRANSFERS
20 lbs.
SECTION 2
Difference 10 lbs.
Total maternal EPDs combine predictions for
milk and weaning weight to predict the total
weaning weight difference of calves from daughters. Similar to milk EPDs, total maternal EPDs
express differences in pounds of calf weaning
weight from daughters. However, as the name
implies, total maternal EPDs predict the total
pounds of calf weaning weight difference from
daughters, due to both the genes for milk the
daughter inherited and genes for weaning growth
passed from the sire, to the daughter and on to
the daughter’s calf. Total maternal EPDs are
calculated by adding an animal’s milk EPD to
one-half of the animal’s weaning weight EPD.
An example helps to make total maternal
EPDs easier to understand:
REGISTRATION
WW EPD
YW EPD
Bull A
15 lbs.
30 lbs.
Bull
B
5
lbs.
10 lbs.
______________________________
Total Maternal (TM) EPDs
SECTION 1
Whether you market your calves at weaning, after a growing or backgrounding program, or as fed cattle; weaning and yearling
weight EPDs are useful because they help predict genetic differences in sale weight. Weaning and yearling weight EPDs are expressed in
pounds, with higher EPDs indicating genetics
passed on to offspring for added growth to weaning and yearling ages.
Consider the weaning (WW) and yearling
(YW) EPDs on the following two bulls:
mance if sufficient feed is not available to help
heavy milking cows cycle back and rebreed
quickly. On the other hand, cows with low genetic potential for milk are not likely to produce sufficient calf weaning weight to offset their cost of
production.
INTRODUCTION
Weaning (WW) and Yearling (YW)
Weight EPDs
Scrotal Circumference (SC) EPDs
Scrotal circumference EPDs are expressed in
cm, with higher values indicating genetics for
larger yearling scrotal circumference of sons and
earlier age of puberty in daughters. Larger scrotal circumference and earlier age at puberty are
linked to higher semen quantity and quality in
bulls, and potentially higher conception rates
and earlier calving in replacement heifers.
Here’s an example of how to interpret EPDs
for scrotal circumference:
SC EPD
Bull A
–.5 cm
Bull
B
+.5
cm
_______________________
Difference
= 1.0 cm
Performance – D-21
SECTION 1
INTRODUCTION
SECTION 2
REGISTRATION
SECTION 3
TRANSFERS
SECTION 4
PERFORMANCE
SECTION 5
BREEDER INFO
SECTION 6
BLOOD TYPING
BY-LAWS
SECTION 7
If bulls A and B were each bred to similar sets
of cows, bull calves from sire B would be expected to have yearling adjusted scrotal measurements which average 1.0 cm larger than yearling
sons of sire A. Since yearling scrotal size in bulls
and age at first cycling (puberty) in heifers are
similar traits, daughters of bull B would also be
expected to have inherited genes for earlier
puberty than daughters of bull A. Scrotal circumference EPDs warrant consideration when
selecting bulls from which daughters are going to
be retained for replacements.
Stayability (ST) EPDs
Stayability EPDs are calculated from calving
and pedigree data, and predict genetic differences
in the probability that daughters will remain in
production until six years of age or beyond, given
that daughters had at least one calf reported prior
to six years of age. Since the primary reason cows
are culled is because of reproductive failure, EPDs
for stayability mainly indicate genetic differences
in sustained reproduction. To a lesser extent,
stayability EPDs may also represent genetic differences in other factors which contribute to reasons
why daughters of certain sires are “preferred” by
breeders, and as a result remain in the herd until
at least six years of age.
Higher stayability EPDs are desired, and
generally indicate genetics for greater
longevity. The two sires listed below help illustrate how to interpret EPDs for stayability:
Stayability EPD
Sire A
+15%
Sire
B
+5%
_______________________
Difference
= 10%
If sires A and B were bred to comparable
cows, 10% more of sire A’s daughters would be
expected to remain in production until at least
six years of age as compared to daughters of sire
B. Stated another way, due to genetics for stayability EPD from their sires, each daughter of sire
A would be expected to have a 10% greater likelihood of staying in production to age six or
beyond, as compared to daughters of sire B.
Docility (DOC) EPDs
Thanks to the efforts of Limousin breeders,
well over 100,000 (as of 1/2000) Limousin animals have had docility scores submitted to the
NALF office. NALF sponsored research has determined that docility scores are moderately heritable (.40), and that behavior problems can be
effectively avoided through the use of EPDs for
docility.
Docility EPDs predict genetic differences in
the probability that offspring exhibit calm
D-22 – Performance
behavior. Higher docility EPDs are preferred,
and represent genetics for calmer behavior.
Here is how to interpret docility EPDs:
Docility EPD
Sire A
+20%
Sire
B
+ 5%
_______________________
Difference
= 15%
If sire A has a docility EPD of +20% and sire B
is +5%, we would expect 15% more of sire A’s offspring to be scored as “calm”, as compared to
the percentage of offspring of sire B. Said another way, each offspring of sire A would have a
15% greater likelihood of inheriting genetics for
“calm” behavior as compared to each offspring
of sire B. Docility EPDs can thus be used to minimize the proportion of animals produced with
unacceptable behavior.
EPDs for Carcass Traits
Analogous to EPDs for growth traits, EPDs for
carcass traits predict genetic differences in carcass merit. However, the optimum genetic profile for carcass EPDs depends upon the targeted
market for which cattle are being produced.
Remember, as with other traits the observed carcass performance of an animal (phenotype) is
determined by both genetics and environment,
and EPDs only predict differences due to genes
passed from parents to offspring.
Carcass Weight (CW) EPDs
EPDs for carcass weight predict genetic differences in the average hot carcass weight of progeny, at an age constant endpoint. Consequently,
carcass weight EPDs predict genetic differences in the growth of muscle, fat and bone
which contribute to hot carcass weight. While
more carcass weight equates to more total dollars
worth of product produced, carcasses which are
too heavy may be discounted. To avoid discounts, carcass weight EPDs may also be used to
help avoid producing carcasses which fall outside the targeted industry range. Based on the
National Beef Quality Audit, an industry “ideal”
carcass weight of around 750 pounds was identified, with weights between 650 and 900 pounds
cited as acceptable.
As a means of demonstrating carcass weight
EPDs, consider the following two bulls:
CW EPD
Bull A
10 lbs.
Bull
B
40 lbs.
_______________________
Difference
= 30 lbs.
If bulls A and B were each bred to comparable groups of cows, the average carcass weights
of offspring of each sire would differ by 30
SECTION 4
BREEDER INFO
SECTION 5
BLOOD TYPING
SECTION 6
BY-LAWS
SECTION 7
The National Beef Quality Audit identified
excess external fat and excess seam fat as two of
the largest contributors to economic lost opportunity in the beef industry. By industry standards,
most Limousin cattle represent genetics for
high levels of carcass leanness. However, some
Marbling Score (MARB) EPDs
PERFORMANCE
Fat Thickness (FAT) EPDs
SECTION 3
By definition, if sires A and B are mated to
similar groups of cows, the average ribeye area
of calves from sire B are expected to be 1.00
square inch larger than the average of calves
from sire A, at an age constant end point, due to
genes passed on for ribeye area. While larger
ribeye area is generally desired, some marketing
programs may discriminate against carcasses
with ribeyes which are too large.
Recognizing that ribeye area EPDs may not
be available for some young sire prospects, differences in muscularity can be observed visually,
and these differences are at least moderately heritable. Fed cattle with high red meat yield can
successfully be produced by selecting thick, muscular appearing sires.
TRANSFERS
Difference = 1.00 sq.in.
SECTION 2
REA EPD
Bull A
–.40 sq.in.
Bull
B
.60 sq.in.
_______________________
When bred to similar sets of cows, managed
alike and processed at a constant age, offspring
of sire A are expected to produce carcasses which
have .05 inches less outside fat measured at the
12th/13th rib interface as compared to the average for carcasses from offspring of sire B.
As with other carcass traits, depending upon
the targeted market, there is likely danger in
selecting for extreme levels of either low or high
outside fat. It follows that intermediate levels
are likely more optimum in most traditional situations. While cattle that are too fat represent
excessive levels of trim loss, extremely lean cattle
can represent potential for cold induced shortening (causing toughness), fleshing ability problems in the cowherd, and potentially “harder
doing” cattle.
REGISTRATION
Ribeye area EPDs offer an objective measurement of genetic differences in muscularity. EPDs
for ribeye area are expressed in units of square
inches, with larger values indicating larger
ribeyes and increased expected overall carcass
muscularity and red meat yield. As an example of how to interpret ribeye area EPDs, consider
the following two sires:
FAT EPD
Bull A
.00 in.
Bull B _______________________
.05 in.
Difference
= .05 in.
SECTION 1
Ribeye Area (REA) EPDs
variation exists within the Limousin population.
Consider the fat thickness EPDs for the following two bulls:
INTRODUCTION
pounds due to genes inherited from their sires.
Remember, EPDs predict differences in performance, not actual weights. Knowing which of
the above two bulls is most appropriate may not
be as simple as it seems. On one hand, bull B is
expected to produce more total pounds of carcass
weight. However, if bull B produces some carcasses which are too heavy, overweight discounts
may work to bull B’s disadvantage.
Optimum carcass weight EPDs for sires will
vary according to a number of factors, such as
characteristics of the cows to which the sires are
mated and the calf growing/finishing management regime. Gaining a feel for optimum carcass weight EPDs will require some trial and
error, and are likely to depend upon the targeted
market. Avoiding extremes in carcass weight
EPD should help to minimize the risk of discounts in traditional markets.
Marbling scores are subjective evaluations of
intramuscular fat in the ribeye. At present, marbling scores are the only easily measured indicator of palatability of beef carcasses. The three
components of palatability include tenderness,
juiciness, and flavor. It appears that the chief
benefit of marbling is that it serves as an insurance policy against overcooking. As well, marbling is the primary determinant of USDA quality grades, which contribute to determination of
the value of beef carcasses in many traditional
fed cattle marketing transactions.
Marbling EPDs are expressed in units of
numeric marbling score, with higher values
indicating genes for greater deposition of
intramuscular fat, or higher expected marbling score and higher USDA quality grade at
a constant age.
Consider the marbling score EPDs of sires A
and B:
MARB EPD
Bull A
–.15
Bull
B
+.15
_______________________
Difference
= .30
If bred to comparable groups of cows and
processed at a constant age, the average marbling score of carcasses from offspring of sire A is
expected to be .30 score units higher than the
average of carcasses of offspring produced by sire
Performance – D-23
INTRODUCTION
SECTION 1
SECTION 2
REGISTRATION
TRANSFERS
SECTION 3
SECTION 4
PERFORMANCE
SECTION 5
BREEDER INFO
SECTION 6
BLOOD TYPING
BY-LAWS
SECTION 7
B, due to genes passed on from the
Table 1. Limousin Possible Change Values for
sires for marbling score. The differVarious Levels of Accuracy.
ence of .30 score units is equivalent to
Possible Change (+ or –)
about one-third of a USDA quality
BIF
Birth
Weaning Yearling
Milk
Scrotal
grade.
Accuracy Wt EPD
Wt EPD
Wt EPD
EPD
EPD
Generally, depending upon the
.1
2.9
15.9
23.6
15.6
.62
marketing system, higher marbling
.2
2.6
14.1
21.0
13.8
.56
score EPDs are favored over lower val.3
2.2
12.3
18.4
12.1
.49
ues, because “Choice” grade carcasses
.4
1.9
10.6
15.8
10.4
.42
are typically more valuable than car.5
1.6
8.8
13.1
8.7
.35
casses which grade Select or lower, if
.6
1.3
7.0
10.5
6.9
.28
other carcass characteristics are equal.
.7
1.0
5.3
7.9
5.2
.21
However, marketing programs exist
(i.e. Laura’s Lean Beef) which do not
.8
.7
3.5
5.3
3.5
.15
reward marbling, and may in fact
.9
.4
1.8
2.8
1.7
.08
desire less marbling in order to minimize the fat and caloric content of
weight EPDs of three unproven, young sire
branded beef products. Research has also shown
prospects, generally the accuracy associated with
that there is generally only a relatively weak
the average EPD would be somewhere around
relationship between level of marbling and ten.60. What’s more, even a “P” or “P+” accuracy
derness, which is the most important factor conEPD has been shown to be a more reliable genettributing to palatability.
ic indicator than the animals own adjusted
Accuracy
weight or ratio.
Generally, animals with numeric accuracy
Accuracy is a measure of the reliability assoabove
about .30 have had their own weights and
ciated with an EPD. For Limousin cattle, accugroup
information, and/or that of progeny
racy is designated by either a “P”, “P+” or a
processed
through the NCE. Higher accuracy
numeric value which ranges from 0 to 1.
values,
those
closer to one, indicate more reliaAccuray indicates the type and amount of inforbility
because
more information has been incormation which was used to calculate the EPD.
porated.
Accuracy
increases as more informaEPDs with “P” accuracy have the lowest
tion
from
progeny
accumulates,
which in turn
level of reliability because only pedigree inforreduces
the
amount
of
potential
error
associated
mation was available for calculating the EPD.
with
the
EPD.
(See
Table
1:
Possible
Change
ValSince an animal inherits a sample half of its
ues.)
Consequently,
accuracy
allows
us
to
evalugenes from each parent, EPDs with “P” accuracy
ate the amount of risk associated with a selection
are calculated by simply averaging the EPDs of
decision. Risk can be minimized through use of
the parents. Breeders are strongly recommended
genetically superior, high accuracy sires, typicalto also consider the adjusted weights and ratios
ly facilitated through an A.I. program.
for animals which only have “P” accuracy.
Accuracy defined as “P+”, or a low numeric
Possible Change
accuracy (<.30), indicates that both pedigree
First of all, keeping in mind everything you
data and an animal’s own weight and contemjust read about accuracy, keep in mind possible
porary group information have been incorporatchange is nothing more than the potential error
ed into the animal’s EPDs. For example, a “P+”
associated with an EPD.
accuracy associated with an animal’s weaning
Put another way, the accuracy estimates the
weight EPD means that the animals own adjustpossible error associated with an EPD at a given
ed weaning weight, and that of other animals in
accuracy level.
its weaning group, along with pedigree informaLook at Table 1 above. This is similar to the
tion for all animals in the group has contributed
Table of Possible Change you will find in every
to the calculation of the EPD. An animals “P+”
Limousin genetic evaluation manual.
accuracy is updated to a numeric accuracy durNow, let’s look at a bull you are considering
ing each National Cattle Evaluation (NCE).
that has a +5.0 lbs. milk EPD with a .5 accuracy.
For “P”, “P+” and low levels of accuracy,
Reading across you will see that at that accuracy
commercial and seedstock producers should
level, you’re really saying the bull is +5.0 lbs. for
find comfort in the fact that the accuracy
milk, plus or minus 8.7 lbs. In fact, given statistiassociated with the average EPD of a group of
cal rules, what you’re saying is that there is 66.6
young, non-parent sires can be fairly high.
percent chance the bull’s true value for milking
For example, if you were to average the yearling
ability lies somewhere between -3.7 lbs. and
D-24 – Performance
BREEDER INFO
SECTION 5
BLOOD TYPING
SECTION 6
BY-LAWS
SECTION 7
Performance – D-25
SECTION 4
While it may be difficult to fully understand
the mathematics which are used to calculate
EPDs, it is not too difficult to gain a conceptual
“cowboy feel” for what goes into calculating
EPDs at the University of Georgia (UG).
Producers can think of the genetic evaluation
program as a giant, ongoing investigation which
is conducted to zero-in on the true genetic differences between animals for various traits. As additional information accumulates daily in the NALF
office, and evaluations are conducted at the UG,
Limousin breeders are continually honing in on
true genetic differences between animals.
Without question, the most important “raw
materials” needed to calculate EPDs are the
weights, measurements and management/
grouping information submitted by Limousin
breeders. As already discussed, similar to most
PERFORMANCE
What goes into
figuring EPDs?
SECTION 3
As a commercial cattlemen purchasing genetics, or as a seedstock producer building genetics
for the commercial industry, you must understand that you cannot directly compare EPDs
between breeds.
There are lots of complicated reasons for this
fact but basically it boils down to the fact that
each breed’s EPDs are calculated using a different
historic time-frame from which to calculate EPDs.
Consequently, tempting as it may be to look at a
Limousin EPD and compare it to Angus, you
can’t; it’s like comparing apples to oranges.
Yes, there has been a lot of talk about statistical equations which allow you to do this. The jury
is still out, and so far there is not an inter-breed
system that the North American Limousin Foundation feels confident enough in to endorse.
TRANSFERS
EPDs Are Breed Specific
SECTION 2
In basic terms, a contemporary group is a
group of cattle of the same sex and percentage
blood, born within 90 days of each other that are
managed the same way.
For the Limousin breed, if you’re submitting
performance data, all you need to do is designate
the management code for each animal you
report. As long as calves are designated by management code, and whether or not they have
been creep-fed, the NALF computer assigns them
to correct contemporary groups.
REGISTRATION
EPDs come from performance information
submitted to a breed organization. What’s more,
when calculating EPDs, only performance information submitted on animals evaluated in contemporary groups can be utilized.
Contemporary groups and the fact that all
animals within a breed population share common ancestors are the reasons calves out of Sire
A in Georgia can be compared to other calves
out of Sire A in Nevada. It doesn’t matter that
individual calves by sire A do better or worse in
one environment or another, what matters is
how calves out of Sire A compare to calves out of
other sires in the same environment, in the same
contemporary group.
For instance, it could be the calves of Sire A
weaned at 625 lbs. on some lush pasture in Georgia, but only weaned at 500 lbs. on the Nevada
desert. In the same environment, perhaps calves
out of Sire B weaned 600 lbs. in Georgia and at
475 lbs. in Nevada. By themselves, the actual
weights don’t mean anything when it comes to
calculating EPDs, what matters is that in a contemporary group, in both environments, the difference between Sire A and Sire B is 25 lbs.
Given the genetic connectedness of the breed,
performance evaluation in contemporary groups
allows for the genetic comparison of sires
between herds all across the nation.
So, EPDs come from breeders submitting performance data on calves in contemporary
groups. With that in mind, the validity of EPDs
So, What’s A Contemporary Group?
SECTION 1
More About Where
EPDs Come From
can only be as good as the accuracy with which
performance information is submitted. Moreover, the more data that is submitted, the more
accurate EPDs become.
INTRODUCTION
+13.7 lbs. Conversely, statistics say there is a 33.3
percent chance the true value will fall above or
below that range.
If you expect EPDs to be a static, one-time,
all-time measurement of an animal, it will frustrate you. If you accept the fact that EPDs
change, that they’re expected to change, you’ll
be less frustrated.
Other Accuracy Measures—In order to offer
breeders perspective on the breadth of information contributing to specific EPDs, you will also
find in the Genetic Evaluation Manual the number of herds from which birth weight has been
reported, the number of daughters contributing
to total maternal, the number of sons contributing to scrotal, and the number of carcasses used
in deriving the carcass EPDs.
The bottom line is that as more data is collected on the progeny of a sire or dam, the higher their EPD accuracy becomes; or the less the
error becomes associated with the true progeny
difference for that animal.
SECTION 1
INTRODUCTION
SECTION 2
REGISTRATION
SECTION 3
TRANSFERS
SECTION 4
PERFORMANCE
SECTION 5
BREEDER INFO
SECTION 6
BLOOD TYPING
BY-LAWS
SECTION 7
Fig D-15: Heritability estimates
for current Limousin genetic
evaluations.
Trait
Birth Weight
Weaning Weight
Yearling Weight
Milking Ability
Scrotal Circumference
Heritability
.42
.23
.20
.19
.41
“raw materials”, the raw data must be adjusted
and weighted before it has maximum predictive
value and is in the form of an EPD.
In one sentence, an EPD summarizes all of the
performance information reported, which has
been adjusted for environmental effects, weighted
by the heritability of the trait and relationships to
other traits, and attached to the pedigree information for all animals and their mates over time.
Accurate and comprehensive inputs including
data, adjustments, heritabilities and mathematical
formulas, result in accurate and reliable EPDs,
which are the most accurate predictors of genetic
merit that we have in the beef industry. Keep in
mind, EPDs measure genetic differences between
animals and do not predict absolute performance.
Preparing the Data
As previously mentioned, depending upon the
trait, NALF and the UG adjust performance
records for the effects of age and/or the age of an
animal’s dam and other environmental effects. In
addition to other data edits which are performed,
this is the first step to calculating EPDs. Once
records are adjusted, the degree to which each
animal’s performance differs from the average
performance of all animals in its contemporary
group is calculated for each respective EPD trait.
Records Weighted for the
Heritability of the Trait
As mentioned previously, when computing
EPDs, performance data is weighted according to
the heritability of the trait. Actually, an animal’s
deviation from the average of the contemporary
group is weighted by the heritability of the trait.
Heritability estimates are values which range
from 0 to 1, and quantify the degree to which
like begets like for any given trait. The higher the
heritability, the higher the resemblance among
relatives and the higher the degree to which
genes influence expression of the trait. Table D15 provides the heritability estimates used for
birth, weaning and yearling weight, milking
ability and scrotal circumference.
D-26 – Performance
Statistical Models
In addition to adjustments and weighting
performance for the heritabilities of the traits,
different multiple trait statistical models are used
for calculation of EPD and accuracy values.
EPDs for weaning, yearling and milk are calculated using a multiple trait model. In simplified
terms, this means that weaning information is
used to help more accurately estimate EPDs for
yearling weight. This is possible because research
tells us that some of the same genes which influence weaning weight also influence yearling
weight. Milk is included in the model to separate
out the maternal effects on weaning weight.
The genetic evaluation for birth weight also
utilizes a multiple trait model. Simply stated, this
means that both birth and weaning weight information contributes to birth weight EPDs. The primary advantage to this approach is that birth
weight EPDs for young, non-parent animals
should be more reliable because growth information is contributing to the estimate.
A separate multiple trait model is used to calculate scrotal circumference EPDs. The model
includes scrotal circumference as well as direct
and maternal weaning weight. Weaning weight
was included in the model to help account for
selection which occurs at weaning and provide
information on a correlated trait to increase the
accuracy of scrotal circumference EPDs.
Multiple trait models utilize the genetic correlations between traits. Table D-16 lists the
correlations used to calculate EPDs for Limousin cattle. Genetic correlations range from –1 to
+1, and quantify the degree to which genes
influencing one trait also affect another trait.
Generally, the genetic correlations used in the
Limousin EPD analysis indicate that some of
the genes which positively influence growth,
also cause higher birth weights and larger scrotal circumferences.
Direct/Maternal Relationship
Set to Zero
Milk EPDs are calculated using a zero relationship between weaning weight and milking
ability. This means that NALF is assuming that
different sets of genes independently control
weaning growth and milk production. Using a
zero relationship in the calculation procedures
means that milk EPDs will be based strictly on
pedigree information until weaning weights of
calves from daughters pass through the evaluation at the University of Georgia.
SECTION 5
BLOOD TYPING
SECTION 6
BY-LAWS
SECTION 7
Performance – D-27
BREEDER INFO
EPDs change because additional performance
information is continually accumulating for animals and their relatives over time. As animals
and their offspring are represented in various
additional groups throughout different environments, EPDs are recalculated to incorporate
SECTION 4
Why do EPDs Change?
Understanding Interim EPDs
and Accuracy
PERFORMANCE
In order to make EPDs comparable for all animals across all contemporary groups, the calculation procedures take into account the degree to
which animals are related through common
ancestors in their pedigrees. Because of the widespread use of AI, contemporary groups are linked
together through the use of these pedigree ties.
This also functions to account for differences in
the level of genetic competition among animals
across groups. It follows that accurate pedigree
information is an important contributor to accurate and reliable EPDs.
SECTION 3
Linking Contemporary Groups
Together
TRANSFERS
In addition to these requirements, ET calves
must be produced from fairly common
breeds/crossbred types of recipients in order for
their performance to contribute to their EPDs. As
well, the same contemporary group concepts
apply to ET calves as are used for natural calves.
If all conditions are met, records from ET calves
contribute to EPDs for the ET calves, donor cows
(direct traits only, not milk) and sires. Please see
the Blood Typing section on recording ET calves
for information about how to correctly complete
the ET forms.
SECTION 2
The UG utilizes performance records from
calves produced through ET if the following
information is reported:
1 Recipient cow ID
2 Recipient cow breed code
3 Recipient cow birth year
4 Recipient cow registration number (if
recipient is a registered Limousin)
EPDs are assigned one of three types of
accuracy values, either a “P”, “P+” or
numeric value which ranges from zero
to one. Accuracy was discussed in
more detail on page D-26. If EPDs have a “P” or
“P+” accuracy, the EPD was calculated by NALF
and is considered an interim EPD. The word
“interim” is used because these values are calculated and updated by NALF in-between evaluations at the UG. Interim values are updated and
assigned numeric accuracy for a given trait if
performance information on the individual or its
offspring are added to the NALF herdbook prior
to the next UG evaluation.
In order to understand why two types of interim EPDs (“P” and “P+”) are calculated, it is necessary to talk about how quantitative traits are
inherited.
Traits that are continuously distributed, like
weight traits and numeric measurements, are
controlled by a large number of genes, each of
which have relatively small effects. Because of
the large number of randomly inherited genes
involved, a single cow mated to a single bull can
produce an estimated 1.073 billion different
genetic combinations.
If no performance information is available
for an animal or its offspring, EPDs with “P”
accuracy are calculated by figuring the average
of the EPDs of the parents (see page D-26). This
calculation assumes the individual inherited an
average sample of genes from each parent, but
tells us nothing about the sample it actually
inherited. Clearly, some animals inherit an average sample, but many others inherit a sample
which is either above or below average.
For timely and accurate representation of the
EPD, as soon as performance information is
reported for an animal and its mates in the same
group, the EPD is adjusted to reflect how well the
animal performed in its group. A “P+” accuracy
is then assigned and the EPD indicates whether
or not it received a good, average or poor sample
of genes from its parents. The “P+” accuracy tells
you that the animal’s pedigree information, plus
its own performance has been incorporated into
the EPD, but that the performance has not yet
contributed back to its parent’s values. The “P+”
accuracies are updated to numeric values during
the UG evaluation.
REGISTRATION
Incorporation of Performance
Records on ET Calves
Interim EPDs
SECTION 1
Trait
Genetic Correlation
Birth Weight and Preweaning Gain
.34
Birth Weight and Postweaning Gain
.22
Preweaning Gain and Postweaning Gain
.28
Preweaning Gain and Scrotal Circumference
.15
added information. It should be
understood that only during the evaluation at the UG, do the performance
records of offspring contribute to the
EPDs of their parents. In the meantime, NALF computes interim EPDs.
INTRODUCTION
Fig D-16: Genetic correlation estimates used
in Limousin EPD calculations.
SECTION 1
INTRODUCTION
SECTION 2
REGISTRATION
TRANSFERS
SECTION 3
SECTION 4
PERFORMANCE
SECTION 5
BREEDER INFO
SECTION 6
BLOOD TYPING
BY-LAWS
SECTION 7
In order for an animal to have an EPD with
“P” or “P+” accuracy computed, its parents (sire
and dam) or its sire and maternal grandsire
must have EPDs with numeric accuracy. In the
case of an animal whose sire and maternal
grandsire have EPDs with numeric accuracy, but
whose dam does not have EPDs, EPDs are calculated by adding one-half of the sire’s EPD to onefourth of the maternal grandsire’s EPD for each
respective trait. If the sire has EPDs with “P”
accuracy, no “P” or “P+” EPDs are calculated for
their offspring.
Another NALF policy of interest regarding
pedigree EPDs with “P” accuracy involves older
animals who have not had performance reported
in a group or offspring with performance reported
in groups. If none of the above information has
been reported in the present year and the four previous years, the animal’s “P” accuracy EPDs are
no longer printed on any NALF paperwork. This
policy is intended to encourage the reporting of
performance information and helps save computing time and space in the NALF computer.
Reporting performance information is not
mandatory. However, from the time animals are
born until evaluated as yearlings, a number of different combinations of performance data on various traits is available on different animals. Figure
D-28 – Performance
D-17 on the next page was designed as a reference
to help determine what EPDs and accuracies are
calculated when common combinations of birth,
weaning and yearling data are reported.
As a final note, breeders should recognize that
NALF’s performance program and the genetic
evaluation process is continuously evolving.
While implementation of technical advancements
may cause the look of EPDs to change over time,
incorporation of enhanced procedures is necessary
to provide breeders the best possible genetic predictions. Ultimately, a progressive approach helps
give Limousin breeders a competitive advantage
over other seedstock producers.
Where To From Here?
What you hold in your hands are rudimentary basics when it comes to EPDs. If you take the
time to study and understand these basics you
will be miles down the road in putting the power
of EPDs to work for you.
There are many more advanced principles
associated with Expected Progeny Differences
and their use. If you would like further information or if you would like to buy a video explaining EPDs, contact the North American Limousin
Foundation, Box 4467, Englewood, CO 80155;
303/220-1693.
Record(s) Available
(at time of UG NCE)
BREEDER INFO
SECTION 5
BLOOD TYPING
SECTION 6
BY-LAWS
SECTION 7
Weaning Weight (WW)
Record Reported,
but no birth weight
SECTION 4
UG NCE values for birth weight and NALF interim values for other traits
BW EPDs from UG NCE with numeric ACC
WW EPDs from NALF with “P” ACCs
YW EPDs from NALF with “P” ACCs
MA EPDs from NALF with “P” ACCs
SC EPDs from NALF with “P” ACCs
Note: EPDs from NALF with “P” ACCs are calculated for animals whose sire and dam
or MGS have EPDs with numeric ACCs. As WW records reported in valid contemporary groups are processed by NALF, EPDs for WW and YW are updated to reflect the
addition of weaning weight records, and NALF then assigns a “P+” ACC to updated
WW and YW EPDs. “P+” indicates the animal’s record has contributed to its EPDs,
but has not yet contributed to the EPDs of its parents. “P+” EPDs are updated to EPDs
with numeric ACC during the UG NCE.
Birth Weight (BW)
and
Weaning Weight (WW)
Records Reported
and
no yearling
records reported
PERFORMANCE
Birth Weight (BW)
record reported
and
no weaning or
yearling records
reported
SECTION 3
Note: Sire and Dam or Sire and MGS must have EPDs with numeric accuracy for the
respective traits in order for NALF to compute interim EPDs.
TRANSFERS
Pedigree EPDs with “P” ACC are equal to:
1/2 Sire EPDs + 1/2 Dam EPDs or
1/2 Sire EPDs + 1/4 Maternal Grandsire (MGS) EPDs for each respective trait
SECTION 2
Interim EPDs and ACCs calculated by NALF
REGISTRATION
No Records Reported
and
only pedigree
information
available
EPD/ACC
SECTION 1
for non-parents calculated by the North American Limousin Foundation (NALF) and the University of Georgia
National Cattle Evaluation (UG NCE) for birth weight (BW), weaning weight (WW), yearling weight (YW), milking ability (MA) and scrotal circumference (SC) according to available record(s).
INTRODUCTION
Fig D-17: Expected Progeny Differences (EPDs) and Accuracy Values (ACCs)
UG NCE values for BW, WW, YW and MA
See special notes SC EPDs and ACCs
BW EPDs from UG NCE with numeric ACC
WW EPDs from UG NCE with numeric ACC
YW EPDs from UG NCE with numeric ACC
MA EPDs from NALF with “P” ACC (MA EPD is a pedigree estimate)
SC EPD: Calculation of values depend upon sex of animal and available information.
Bulls - NALF “P” ACC EPDs if sire and dam or sire and MGS have SC EPDs with
numeric ACCs.
BW EPD from NALF with “P” ACC
WW EPD from UG NCE with numeric ACC no birth records
YW EPD from UG NCE with numeric ACC reported
MA EPD from NALF with “P” ACC
SC EPD - See Above Notes
While additional combinations of reported performance information exist, the examples cited above
explain the most common combinations of performance information available.
Performance – D-29
INTRODUCTION
SECTION 1
SECTION 2
REGISTRATION
SECTION 5
BREEDER INFO
Terminal Growth and Carcass Sire
SECTION 6
TRANSFERS
Specifications for the
“Right” Sires
PERFORMANCE
SECTION 3
Selecting the “right” sires is the key to making genetic improvement. In your next calf-crop,
half of the genes will be from sires used during
the last breeding season. If you produce your
own replacements, nearly 90% of the genetic
makeup of your herd is comprised of genes from
sires used during the last three generations.
Selecting the most appropriate sires depends
upon accurately evaluating the given situation.
Different sires are needed for different purposes.
The following are three different practical examples of types of bulls needed for different circumstances and a list of traits and considerations
that are especially important for each type:
BLOOD TYPING
SECTION 4
Your Commercial Customers —
Choosing the Right Sire...
• Will not save replacement heifers
• Rapid growth (“high” weaning and yearling
weight EPDs)
• Superior carcass (heavily muscled, lean,
high quality)
• Sensible size to maintain acceptable carcass
weights
• Acceptable birth weight
• Milk is not important
• Compliment the cows and match the end
product market (consumers)
Maternal “All Purpose” Sire
• Will retain replacement heifers
• Optimal birth weight, milk, growth and
mature size (moderate frame)
• ”Large” scrotal EPD
• Adaptability and convenience traits
(fleshing ability, udder quality, etc.)
• Structurally sound, high volume, easy
fleshing
• Match the environment, management and
mating system
• Muscularity
BY-LAWS
SECTION 7
Calving Ease Sire (Heifer Bull)
• Calving ease (“low” birth weight EPD)
• Sensible actual and adjusted birth weight
• Sensible size
• Same as maternal sire if daughters retained
as replacements
• Reasonable muscling
D-30 – Performance
Selecting the
“Right” Sire
For example, consider the three sire prospects
in Table D-18 on the following page.
Different situations require different bulls. Seldom can one bull be expected to adequately and
cost effectively suit the wide variety of needs
described in scenarios 1, 2 and 3.
The Growth and Carcass Sire
Because of his superior growth (yearling
EPD), Sire A would potentially be the “Growth
and Carcass Sire,” especially if he has adequate
muscularity when evaluated visually. Bull A’s
birth weight EPD of 2.2 ranked him in about the
upper 10% of the population for heavy birth
weight in a specified genetic evaulation, i.e.
each genetic evaluation at the University of
Georgia yields new percentile rankings. Thus he
should only be bred to mature cows, in order to
avoid calving difficulty. The negative milking
ability and lower total maternal EPDs are not of
concern since no daughters will be retained for
replacement.
The Maternal “All Purpose” Sire
Bull B combines average birth weight with
high growth, milk and total maternal EPDs, has
a large adjusted scrotal circumference and has a
sensible frame score. This performance profile
identifies Bull B as an “All Purpose” Maternal
Sire prospect. Since daughters of this bull are to
be relied upon to perpetuate the cow herd, it
becomes especially important to pay close attention to all EPDs. In addition, this bull must be
muscular.
The Calving Ease Sire
Most calving difficulty and associated losses
occur in first-calf heifers. Calf birth weight has
been identified as the most important factor contributing to difficulty, and birth weight EPD has
been shown to be the best tool for predicting differences in birth weight. Based on Bull C’s birth
weight EPD of -1.8, he is a probable calving ease
bull that could be mated to yearling first-calf
heifers. Bull C also has respectable growth and
milk EPDs and would be a possible choice for
breeding cows whose mature size is too large.
A
B
C
2.2
.6
–1.8
Weaning
Weight
EPD
16
12
8
Yearling
Weight
EPD
Milking
Ability
EPD
35
25
15
–4
6
3
Total
Maternal
EPD
4
12
7
Scrotal
Circum.
EPD
.2
1.0
.5
Adj. Yr.
Scrotal
Circum.
(cm)
32
35
33
Frame
Score
7.0
6.5
6.0
Performance – D-31
BY-LAWS
If a cow is not listed on your Cow Inventory
Report for any of the above reasons, you can
add her on a blank line of the report.
SECTION 7
what to do...
3
SECTION 6
5
2
The sire of the animal
a. does not have EPDs
or
b. has EPDs with only a “P” or “P+” accuracy
The dam of the animal
a. does not have EPDs
or
b. the maternal grandsire has no EPDs or
only “P” or “P+” accuracy EPDs
The animal:
a. was not weighed in a weaning group
and
b. has not produced natural (non E.T.)
offspring which have been evaluated in a
weaning group; or have not produced ET
calves evaluated in a contemporary group
or have produced ET calves without
reporting breed information of the recipient
female.
BLOOD TYPING
3
4
The cow is not registered with NALF.
The cow is listed with NALF as dead or
having sold without papers.
The animal is not yet old enough to calve.
The animal is 5-years-old or older and has
had no offspring reported to NALF in the
past three years.
The animal was recently purchased and was
not listed under the breeder’s membership
when the inventory was printed.
1
SECTION 5
1
2
Why doesn’t my animal have EPDs?
BREEDER INFO
Reasons one or more of your cows
doesn’t appear on your preprinted
cow inventory...
SECTION 4
Troubleshooting
PERFORMANCE
NALF has available an on-line program
designed to assist in the selection of sires for use
in breeding programs. This program is updated
after each National Cattle Evaluation (NCE) to
include the latest EPDs. All bulls that qualify for
the NCE General Listing and the top 500 young
sires for birth, weaning, yearling and milking
ability are included.
After the breeder enters selection criteria, bulls
that meet the criteria are selected for display and
printing. Criteria can include: low/high EPDs,
minimum accuracies, birth year range, polled/
scurred only, fullblood only and black only.
For more information about this useful tool,
contact the NALF office, or log onto NALF’s website at www.nalf.org.
SECTION 3
Don’t forget, Limousin EPDs cannot be directly compared to EPDs of other breeds. Compared
to British breeds (Angus and Hereford), the average Limousin EPDs for birth, weaning, yearling,
milk and total maternal are lower because they
are based on a different zero EPD point.
TRANSFERS
On-Line
Sire Selector Software
SECTION 2
Other Things to Remember
REGISTRATION
(Remember, new averages are calculated with each new Genetic Evaluation Manual.)
SECTION 1
Sire
Birth
Weight
EPD
INTRODUCTION
Fig D-18: Selecting the “Right” Sire
BY-LAWS
SECTION 7
SECTION 5
BREEDER INFO
SECTION 6
BLOOD TYPING
SECTION 4
PERFORMANCE
SECTION 3
TRANSFERS
SECTION 2
REGISTRATION
SECTION 1
INTRODUCTION
Notes:
D-32 – Performance
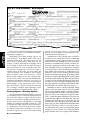
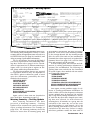
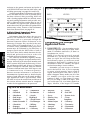
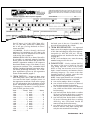
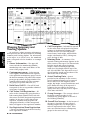
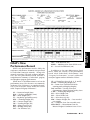
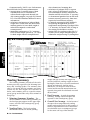
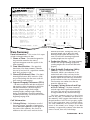
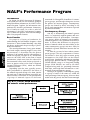
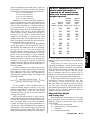
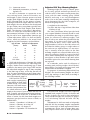

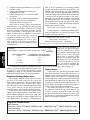
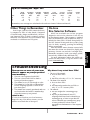


![取扱説明書[EH-SC50] (1.82 MB/PDF)](http://vs1.manualzilla.com/store/data/006535735_2-1cbb4db04173b4665a2bca7979860b15-150x150.png)