1
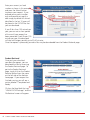
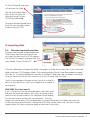
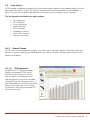
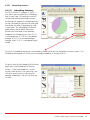
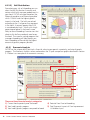
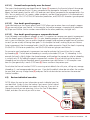
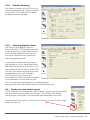
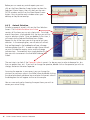
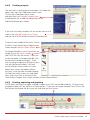
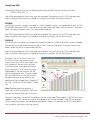
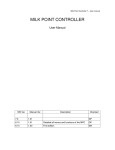
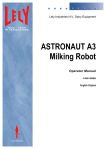
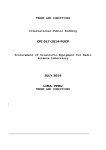
USER MANUAL
Software developed by Holstein Association USA, Inc.
Dairy Vision Trend Analysis Program
1
2
Dairy Vision Trend Analysis Program
1)
Introduction
1.1)
1.2)
2)
Getting Started
2.1)
2.2)
2.3)
3)
5)
Installing DVTAP
Program setup
Obtaining data
Importing Data
3.1)
3.2)
4)
Herd analysis
Hardware requirements
First time import of your data
Importing data updates
Viewing your Data
4.1)
Selecting a herd
4.2)
Trend analysis
4.2.1) Genetic trends
4.2.1.1)
TPI comparison
4.2.1.2)
TPI Distribution graph
4.2.1.3)
Other comparison
4.2.1.4)
Calves Born summary
4.2.2) Inbreeding analysis
4.2.2.1)
Inbreeding summary
4.2.2.2)
Bull distribution
4.2.3) Economic analysis
4.2.3.1)
Current herd superiority over the breed
4.2.3.2)
Your herd’s genetic progress
4.2.3.3)
Your herd’s genetic progress compared to breed
4.3.
Review individual cow data
4.3.1) Identification summary
4.3.2) Genetic summary
4.3.3) Attaching digital pictures
4.4.
Create your own animal reports
4.4.1) Animal selection
4.4.2) Creating a report
4.4.3) Printing, exporting and graphing
Updating Animal Status
Dairy Vision Trend Analysis Program
3
1) Introduction
1.1)----Herd Analysis
DVTAP is the most extensive genetic management program available to the dairy industry, allowing you
to evaluate your herd’s genetic and inbreeding trends over time. DVTAP allows you to evaluate your
herd’s breeding program over the last 10 years and find areas for improvement, which will help your
identify what changes are needed to breed your desired cow.
Some of the main features of DVTAP are:
1. Ten year trend analysis
2. Review an individual animal’s genetics
3. Create and evaluate cow reports
1.2----Hardware Requirements
Minimum hardware requirements to run DVTAP are:
• Windows 98 or higher
• 32 MB Ram available
• 15 MB of free disk space
• Screen resolution 1024x768 or higher
2) Getting Started
2.1)----Installation
To install the Dairy Vision Trend Analysis Program (DVTAP) insert the My Holstein ID Software Suite CD in
your computer, or download from www.holsteinusa.com.
Installing DVTAP from CD
If you are downloading the program from a CD, click on the Dairy Vision Trend Analysis Program
installation button in the main menu. The program should now install on your computer. Follow
the on-screen instructions to finalize the installation. Make sure to restart your computer after you
have installed DVTAP.
Downloading DVTAP from website
If downloading from the website, click the button to download the program, and select the folder
where you would like to save the program. After it downloads to the folder of your choice, click on
the Setup icon to initiate installation and follow the on screen instructions.
4
Dairy Vision Trend Analysis Program
2.2)----Program Setup
Before you load or review any data, you must first setup the
program. If you are a user of Red Book Plus/MultiMate and/or
EASY ID, you can link your DVTAP program with any of these
programs.
Start your DVTAP software by clicking on the Windows Start
button, select All Programs, and select the Trend Analysis
Program folder. Click on the DVTAP icon to start the program.
Select “Setup” from the menu at top left of your screen.
The Setup screen will appear.
If you have Red Book Plus/MultiMate installed on your computer enter in the Red Book Plus folder edit
box: C:\Redbook, or click on the Browse button and locate the folder where Red Book Plus/MultiMate
is installed. If you have EASY ID installed on your computer, enter in the EASY ID folder edit box: C:\
EASYID, or click on the Browse button and locate the folder where EASY ID is installed. Once you are
finished click the Close button.
2.3)----Obtaining data
Now that you have installed the program, and setup you linkages with EASY ID or Red Book Plus/
MultiMate, you are ready to start using the program. But before you can look at your herd’s data you
must request a data file. You have two options to get data for your herd. The first option is to call the
Holstein Association’s office and request the DairyVision Trend Analysis data files. Your second option
is to access the Holstein Association’s Web site, www.holsteinusa.com, and download the Dairy Vision
Trend Analysis data files yourself.
NOTE:
To download data from the Holstein Association Web site, you must have internet access and a Web
user name and password. If you do not have a Web user name, you can call 800.952.5200 to have one
setup, or you may set up a Web user name and password online.
Requesting your DairyVision Trend Analysis data files:
To download the DVTAP data files, click on the Software button in the menu on the Holstein Web site.
On the next screen select the Dairy Vision Trend Analysis Program. From the Dairy Vision Trend Analysis
Program screen select to download a cow data file. You will have to login to access the download setup
screen for your data file. Once you have logged in the DVTAP submission screen will appear.
Dairy Vision Trend Analysis Program
5
Enter your account, or herd
number as shown in this example,
and press the Submit button
to process your request. If you
entered your account number
only and you did not specify a
date range, by default all animals
identified in the last 10 years will
be placed in the DVTAP files that
you can download.
If you ID less then 100 animals per
year, you can wait a short period
of time until your request has
been processed. If you ID over 100
animals per year, the download
will take a bit longer, possibly up to 30-40 minutes.
Once the request is processed, your data files may be downloaded from the Product Retrieval page.
Product Retrieval
Once you have submitted
your data file request, you can
download the files by accessing
the Product Retrieval page. To
get to the Product Retrieval
page, simply click on the Product
Retrieval button from the menu
on the left side of the Holstein
homepage. If your request has
finished running, you will see a
section labeled “Completed and
Ready.”
Click on the blue label that says
“WWW-DVTAP Package” and the
File Retrieval screen will appear.
6
Dairy Vision Trend Analysis Program
On the File Retrieval screen you
will see three files listed.
You will need to download
each file by clicking on the
name and saving it to your
DVTAP\Download folder.
Once you have downloaded these
three files, you are ready to load
the data into you DVTAP.
3) Importing Data
3.1)----First time import of your data
Once you have received, or downloaded your
Trend Analysis data files from Holstein you
can import this data into the DVTAP program.
Start the DVTAP program, and select from the
menu header “Import File from PC”.
A file open dialog box will appear. By default the program will look for new data files in your Download
folder inside your DVTAP program folder. Any unprocessed data files you have downloaded, or copied
will show up. If you downloaded your data files to a different folder, then select a different file location.
Once you found the herd you wish to load, click on the file name, and click Open.
A confirm message box will appear asking if you wish to load this
data as a new herd file, or if you wish to append to, or update an
existing herd.
NEW HERD (first time import):
If this is the very first time you are loading data, select New Herd
and continue importing the data. Next step is to provide a herd
name that will be used to identify the herd data you are loading,
this name will also be used on your printed reports. Once the
program has read all data a File save dialog box will appear. Please select the folder where you wish
to save your processed information, and provide a file name (can be herd name). You now finished
importing your first herd, and you are ready to take a look at your data.
Dairy Vision Trend Analysis Program
7
3.2)----Importing data updates
If you previously downloaded your herd and
wish to update your existing database, select
from the menu header Import file from PC.
You will be asked for a file to import. If you
downloaded your complete herd from the
Holstein web site, you can append, or create a
new herd file.
APPEND TO HERD
If you have previously downloaded this herd,
and you wish to update the old data file, then
select Append to Herd, and select the folder and herd file you previously imported data into for the same
herd. The program will update any existing animals, and add any new ones to your herd file. You now
finished updating your herd, and you are ready to take a look at your data.
4) Viewing your Data
4.1)----Selecting a Herd
Once you have loaded your initial data file, you can view your
information. Since DVTAP can handle multiple herds, before
you see any information, you have to select the herd you wish
to view data for.
To select a herd click from the menu header
on the Select Herd button.
A file dialog box will appear asking for the herd file name
you wish to load. Select the file name you wish to load and press the Open button. DVTAP will start
loading the data. A dialog box will appear and ask you if you wish to load the information based on
Cow ID number. If you select Cow ID (Yes),
it will take longer to load the data because
DVTAP has to check for duplicate herd
management numbers. Therefore for herds
over 2000 cows we recommend you do
not load by Cow ID number (click on No)
unless you wish to wait longer for the data
to load.
A second dialog box will appear asking you
for a date to summarize by. The default
will be the current month. Press the OK
button if you wish to summarize everything
as of today. When all data is loaded a
graph will appear showing the current herd
trend graph for TPI.
8
Dairy Vision Trend Analysis Program
4.2)----Trend Analysis
DVTAP provides a wide array of graphs that can be used to study the genetic and inbreeding trends that have
taken place over the last 10 years. DVTAP only includes animals that were identified into the Herdbook, or
Basic ID. Any animals that did not get identified with Holstein are not included in any of the graphs.
The herd graphs are broken into eight sections:
•
•
•
•
•
•
•
•
TPI Comparison
TPI Distribution
Other Comparison
Stud Distribution
Bull Distribution
Inbreeding Summary
Calves Born Summary
Economic Summary
4.2.1)----Genetic Trends
DVTAP is the most comprehensive program that allows you to view your genetic information and make
decisions if you are meeting your breeding goal or not. Below will be a brief description of each of the
genetic trend graphs.
4.2.1.1)----TPI Comparison
By default the TPI Comparison graph
displays the average PTPI by Year of
birth for all animals born in a certain
year (includes live and dead animals),
and compares this value with the breed
average PTPI for the same year of birth. If
you have loaded a list of live animals (read
Section 5 for more info), you will see a
third column indicating the average PTPI
for live animals only.
Dairy Vision Trend Analysis Program
9
4.2.1.2)----TPI Distribution Graph
The TPI Distribution graphs displays for each
year born the % of animals within each TPI
percentile. For example animals coded as
P9 rank in the 90th percentile for TPI for a
specific year of birth. Animals coded as <P5
are animals that rank below breed average
for TPI. If you wish to find out the number
of animals instead of the % animals for each
year of birth, click on the Graph # Cows
button.
4.2.1.3)----Other Comparison
The Other Comparison section allows
you to view graphs for Milk, Fat, Protein,
Productive Life, Somatic Cell Score, Type,
Udder Composite, and Feet&Leg Composite.
Your herd is broken out by year of birth, and
for each year your herd is compared to the
breed average for a specific trait. To select
a different trait to view, click on the Trait to
Graph listbox and select the trait you wish to
view. If you have loaded a list of live animals
(read Section 5 for more info), you will see a
third column indicating the average for the
trait selected for live animals only.
4.2.1.4)----Calves Born Summary
The Calves Born summary allows the user
to have a close-up view what the genetic
trend will be for animals moving into the
milking string based on the animals that
were born in the last 26 months of calvings.
For each month of calving the number of
calves are displayed, as well as the average
for the trait that was selected in the Graph
listbox. Assuming death loss was small and
all animals were identified, this graph can
help explain what level of genetics will be
entering the milking herd over the next two
years.
10
Dairy Vision Trend Analysis Program
4.2.2)----Inbreeding Analysis
4.2.2.1)----Inbreeding Summary
DVTAP is the first PC program in the U.S.
that allows you to review your inbreeding
level in your herd. By keeping accurate ID
records and building parentage through
the Holstein ID programs, inbreeding values
can be calculated on your animals and used
to evaluate the effect inbreeding has had
in your herd. The Inbreeding Distribution
graph allows you to review how many
animals you have bred in four different
categories of inbreeding. Less then 3.12%
is considered low, 3.12-6.25 is considered
average, 6.25-12.5 is considered above
average, and >12.5 % is considered highly
inbred.
To view the inbreeding trend press the Inbreeding Trend button on the inbreeding summary screen. The
inbreeding trend graph will show you the average inbreeding % by year of birth.
To return back to the Inbreeding Distribution
graph press the Inbreeding Distribution
button. If you have loaded a list of live
animals (read Section 5 for more info), you
will see a second column indicating the
average inbreeding % for animals that are
still alive.
Dairy Vision Trend Analysis Program
11
4.2.2.2)----Bull Distribution
To evaluate your risk of inbreeding you can
select the Bull Distribution Summary and
review which bulls are more predominant in
your herd. DVTAP calculates based on Sire,
Maternal grandsire, and Paternal grandsire
which 10 bulls have the highest genetic
impact in the herd. The bulls are ranked
according to the % of genes they represent
in the herd. A percent greater then 6.25
is considered very high. A bull with a high
percentage of genes in the herd is more
likely to cause inbreeding if service sires that
relate to this bull are randomly used across
the herd. The use of a mating program that
manages inbreeding will help protect you
from inbreeding while making the highest
amount of genetic progress possible.
4.2.3)----Economic Analysis
DVTAP has the unique ability to attach a financial value to your genetic superiority, and rate of genetic
progress. The Economic Analysis values are based on the 10 year comparison graphs described in Section
3.1. Below is an example of an economic summary.
2
3
1
4
5
There are three financial analysis categories:
1) Current herd superiority over the breed 2) Your herd’s genetic progress 3) Your herd’s genetic progress compared to breed
12
Dairy Vision Trend Analysis Program
4) Potential Loss Due to Inbreeding
5) Total Economic Impact of Cow Improvement
& Variables Input.
4.2.3.1)----Current herd superiority over the breed
The current herd superiority over breed financial figures (1) represents the financial value of the average
genetics in your herd over the last 10 years compared to the average for the breed. In the example
above, the herd’s genetic level for milk is $5 lower per cow lifetime compared to the average herd in the
USA. You can review milk, fat, protein, udder composite, and feet & leg composite. In the example each
cow genetically is $-5+$-27+$-35=$-67 behind on production, and $0+$3=$3 ahead on type compared
to the breed.
4.2.3.2)----Your herd’s genetic progress
Aside from looking at the current genetic level DVTAP allows you to review how much genetic progress
(2) you are making per cow lifetime. In this example, the herd on average is improving milk production
by $8 per cow lifetime. Similar numbers are available for the other production, and type traits.
4.2.3.3)----Your herd’s genetic progress compared to breed
Since the breed is making genetic progress as well, it is important to compare your genetic improvement
with the breed’s genetic improvement (3). If in your breeding program you have emphasized specific
traits in your sire selection, you can review the genetic progress and compare to breed financial numbers
to see if you are actually achieving these goals. In this example the herd is making $6 per cow lifetime
faster improvement then the average herd in the USA for udder composite. Overall the herd is improving
$2+$8+$15= $25 faster on production, and $6+$2=$8 faster on type per cow lifetime.
To summarize your herds genetic improvement we need to evaluate the financial loss that is caused
by inbreeding (4). The loss due to inbreeding is currently estimated at $23 per 1% inbreeding. In this
example the herd is slightly higher then breed average, and therefore the average loss due to inbreeding
is currently only $3. By adding the genetic improvement numbers (1) and subtracting the loss due to
inbreeding we can estimate the overall genetic improvement per cow lifetime. In this example a cow
born this year genetically is worth $130 more (5) then a cow born the previous year.
To calculate the financial number DVTAP is assuming certain defaults for milk price, culling rate, average
inbreeding %, and average production per cow. If you feel the default values do not reflect the numbers
for your herd, you may change these (5) and press the Re-calculate button and review the corrected
financial numbers.
4.3)----Review individual cow data
DVTAP allows the user to view information on each individual cow that
was identified. Simply click on the Lookup Cow icon on the left side of
your screen, and the individual cow screen will show up. If you wish to
change the animal you are reviewing, click on the Cow ID drop down
listbox, and select the animal you wish to view. Dairy Vision Trend Analysis Program
13
The Individual Cow Screen is divided
into three sections:
• Identification
• Genetics
• Picture
4.3.1)----Identification Summary
The Identification section displays all
pertinent ID information about the animal.
Depending if the animal was identified
into the Herdbook, or Basic ID, different
information will be displayed. If you have
Red Book Plus installed on your computer,
and you wish to obtain more information
about the sire of the animal you are looking
at, click on the Lookup Sire in Red Book
Plus button (1). You can do the same for
the Maternal Grand Sire. If you click on the
Lookup Dam button, DVTAP will search back
through it’s database to find the dam of the
animal you are currently looking at. If the
Dam is identified under the same ownership
account, and was born in the last 10 years,
she can most likely be found in your database.
2
To lookup and Progeny for an animal, click on the
List Animal Progeny button (2). A new screen
will appear and list any offspring it could find in
the database.
If you wish to lookup any of the offspring listed in the
Progeny Screen, simply double click on the ID you wish
see, and the Cow summary will change to the animal
you clicked on. To return to the original animal (Dam),
click on the Return to Dam button on the Progeny
screen.
14
Dairy Vision Trend Analysis Program
1
4.3.2)----Genetics Summary
The Genetics Summary list the PTA’s for the
animal you are reviewing, as well as the dam
of the animal. PTA’s listed with a # symbol
are based on parent averages.
4.3.3)----Attaching digital pictures
I you wish to use a digital picture as a
backup identifier, DVTAP provides you with a
system to keep track of your digital pictures.
If you can create digital pictures, you can
link the file location of each picture with
each corresponding animal.
If you know the location of the picture on
your hard drive, click on the Browse button,
and locate the file you wish to attach. Once
you have found the file click OK, and DVTAP
will insert the image onto the picture screen.
If you decide to print the ID summary,
DVTAP will print the picture as well.
Press the Reset button if you wish to remove
the link between an animal and a picture.
NOTE: Once you have linked the pictures, renaming, moving or
deleting pictures, will cause DVTAP to lose the link with the picture file.
4.4)----Create your own animal reports
DVTAP allows you to create your own animal reports. You can set up your animal
selection criteria and your report item selection. DVTAP will find all animals
matching your criteria and list the information you requested on the screen.
To create your animal report, click on the Cow Listings icon, and the Cow Listings
screen will show up.
Dairy Vision Trend Analysis Program
15
Before you can create any animal reports you must
click on the Show Selection Screen button to show the
Selection Criteria Screen, then click back on the main
DVTAP window, and click on the Show Report Screen
button. You can position each window across your
desktop so they do not overlap.
4.4.1)----Animal Selection
To Select a group of animals, click on the Cow Selection
Screen. The Available Database Item listbox
contains all the items you can set criteria with. To include
one of these items, simply double click the item you wish to
use as a selection criteria. Once you double click an item, it
will move into the Selected Database Items listbox.
Repeat this for all the items you wish to use to limit your
selection. In the example given, we will select all animals
that are Registered in the herdbook and have a lineage
indicator greater then 9.2. In order to select these animals
we must included the registry status and the Lineage
indicator item. To remove an item simply double click the
item you wish to remove in the Available Database Item
listbox.
The next step is to check if the Operator listbox is correct. (i.e. do you want a value to be equal to , less
then, or greater then, etc). If you wish to change the operator, double click on the operator you wish to
change, and enter the correct operator.
Assuming the operator is now correct, you can change the
minimum or maximum value in the Value listbox by double clicking
the value behind each database item and enter the correct value in
the dialog box that will appear similiar to this example.
You can now continue by choosing the report items you wish to
see on your animal listing.
16
Dairy Vision Trend Analysis Program
4.4.2)----Creating a report
The next step in creating your animal report is to choose the
report items from the Listed Report Items Screen.
Click on the Listed Report Items Screen,
and select from the Available Database Items
Simply double click to add the selected item to the
Selected Database Items listbox. If you wish to change the order click on the item you wish to
move in the Selected Database Item listbox,
and use the UP or DN button to move the selected item.
Once you have included all the items, click on
the Dairy Vision Trend Analysis Program main
screen and press the Run Report button.
To change the order in which the animals are
sorted, click on the column header
and DVTAP will sort the animals. If you wish
to sort the report in the opposite order, click
on the column header once again. If you
wish to change the group of animals or items
that are listed on your report, click back
on the Selection criteria screen, or Listed
report items screen, and add or subtract
any items. Once you have finished changing
the Selection criteria screen, or Listed report
items screen click back on the DairyVision
Trend Analysis Program main screen and press the Run Report button.
4.4.3)----Printing, exporting and graphing
DVTAP allows you to print a report, or export a report to an ASCII comma delimited file. Once you have
created the report click on the Print, or Export button. If you wish to change the report font, click on the
Font button and choose the font type, size, and color you wish to use.
Dairy Vision Trend Analysis Program
17
DVTAP allows you to create a scatter, or herd comparison graph that allows the user to graphically
evaluate the selected animals compared to the non-selected animals. To create a scatter graph click on
the Graph button, and select Yes to look at the scatter graph. If you wish to look at a Herd Comparison
graph, select No.
If you selected Yes the Scatter Graph Screen will appear.
You can select any two data items that are available for
the X-axis and Y-axis to graph. Once you have selected
the two items you wish to compare, click on the Graph
Cows button.
If you selected No, the Herd comparison graph will
appear. Select from the Item to Graph Listbox the
item you wish to review, and click on the Graph
Cows button.
5) Updating animal status
DVTAP allows a user to update the status on each individual animal. The status field of an animal
indicates if the animal is Alive, or Dead, or Unknown. The reason for having the status listed as a
database item is that Holstein USA does not keep track of which animals have left the herd. When you
obtain a data file for your herd, by default the animal status is “Dead/Unk”.
If you wish to update this, you can do this
on each individual animal by accessing the
Lookup Cow screen and find the animal you
wish to update. To change the status of an
animal, click on the Status label, and DVTAP
will change the status to the opposite status,
and save this as part of the record.
Having to do this on each individual animal can become very time consuming. Therefore if you have a
herd management program that allows you to export your registration numbers, American ID, or USDA
eartag numbers to an ASCII comma separated file, you can import this ASCII file into DVTAP, and DVTAP
will update the status to “Live” on every animal it can match any of these three ID number.
18
Dairy Vision Trend Analysis Program
DairyComp 305:
In DairyComp 305 you can use the following command to export the live animals ID number:
FILEOUT USDA REG \C
You will be prompted for a file name, after you entered a file name switch to DVTAP and select your
herd, and import the file you just created by clicking on the Import Animal Status button.
PCDART:
For PCDART you must create a new report in the Print Reports section. Include database items 52 (DHI
ID) and 690 (Secondary DHI ID), and make sure to select cows and heifers and no summary. Save your
report, and print the report to an ASCII comma delimited file.
You will be prompted for a file name, after you entered a file name switch to DVTAP and select your
herd, and import the file you just created by clicking on the Import Animal Status button.
DHIPLUS
In DHIPLUS you can create a new report that should include the COWID field, make sure you changed
the controls to include heifers and dry animals as well, finally run the report. Once you have ran the
report, export the file to a comma delimited file.
You will be prompted for a file name, after you entered a file name switch to DVTAP and select your
herd, and import the file you just created by clicking on the Import Animal Status button.
To import a file in DVTAP click from the
DVTAP main menu the Import Animal
Status button. You will first be asked if you
wish to reset all animals status to Dead.
If you answer No, the program will leave
any animal with a “Live” status the same,
independent if she was found in the file
you are importing or not. If you answered
Yes, any animal that is in the file that you
are importing and can be found in the
database will be changed from “Dead/Unk”
to “Live”, all others will be listed as “Dead/
Unk”.
All
Live
Breed
Note: Depending on the herd size, it
might take a while to import all the animal
statuses for herds milking over 1000 cows.
Once the importing is successfully finished you will see a new Herd Graph appear. If DVTAP has animals
coded as “Live” it will calculate a third set of averages and list these averages in the PTPI trend graph,
Other Comparison graphs, and Inbreeding trend graph. Below is an example of the PTPI Trend graph
that includes a third column for Live animals.
Dairy Vision Trend Analysis Program
19
For more help contact support at 800.952.5200
Software developed
developed by:
by:
Software
Holstein Association
Association USA,
USA, Inc.
Inc.
Holstein
Holstein Place,
Place, PO
PO Box
Box 808
808
11 Holstein
Brattleboro, Vermont
Vermont 05302-0808
05302-0808
Brattleboro,
20
www.holsteinusa.com ••
www.holsteinusa.com
Dairy Vision Trend Analysis Program
800.952.5200
800.952.5200