1
Time Series Modelling Version 4.47
Appendices
James Davidson
23rd September 2015
Appendix A. Installation .............................................................................3 Windows ................................................................................................................3 Installation......................................................................................................3 Installing 64-bit TSM .....................................................................................4 Starting and Running TSM ............................................................................4 About the Home Folder .................................................................................5 Creating Additional Shortcuts and Start Options...........................................6 Installing Gnuplot ..........................................................................................6 Upgrading ......................................................................................................7 Troubleshooting .............................................................................................7 TSM under Linux and Mac OS X ..........................................................................7 SsfPack State Space Modelling .............................................................................8 Program malfunctions ............................................................................................9 Appendix B. Setting GUI Appearance and Run Options .........................10 Appendix C. Including User-coded Ox Functions ...................................15 Basic Coding Guidelines .....................................................................................15 Coding Residuals .................................................................................................17 Solving the Model ................................................................................................18 Coding the Likelihood .........................................................................................19 Coding a Test .......................................................................................................19 Returning Test Names..................................................................................21 Passing Settings to the Function ..................................................................21 Critical Values .............................................................................................21 Coding a Test with Hessian Contributions ..................................................22 Computing a Statistic ...........................................................................................22 Generating Data ...................................................................................................23 Controlling Program Functions ...........................................................................24 Loading the Code .................................................................................................25 Maintaining a Function Library ...........................................................................26 Exporting Ox Code ..............................................................................................27 Documenting the Code ........................................................................................28 Debugging Code: Running in Diagnostic Mode..................................................28 Appendix D. Calling the Code from an Ox Program ...............................30 Appendix E. Saving and Loading Batch Settings in the GUI ..................31 Appendix F. Using TSM in the Classroom ..............................................33 Installation and Use .............................................................................................33 Linear Regression Mode ......................................................................................33 Simplified Output ................................................................................................33 1
James Davidson 2015
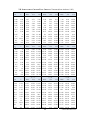
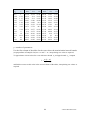
Easy Equation Graphics Display .........................................................................33 Distributing Class Exercises ................................................................................33 Maintaining and Upgrading TSM ........................................................................34 Appendix G. Using Empirical Distribution Functions .............................35 Creating EDFs......................................................................................................35 Using EDFs for inference ....................................................................................36 EDF File Format ..................................................................................................36 Appendix H. Running TSM in the Condor environment. ........................38 Installing TSM for Condor ..................................................................................38 How Condor Works .............................................................................................39 Command Line Interactions.................................................................................40 Special Settings ....................................................................................................40 Appendix I. Tables for Nonstandard Tests ...............................................41 2
James Davidson 2015
Appendix A. Installation
Windows
This version of the program, running under Ox 7, is for Microsoft Windows (9.x, Me,
NT4, 2000, XP, Vista, 7, 8 and 10).
The following additional software components are needed to run TSM in GUI mode.
1. Ox 7.10 Professional or Console, or later version, from
http://www.doornik.com/download.html.
Ox Console is freeware for academic use. OxEdit and GiveWin are useful but
non-essential accessories under Windows. The Professional version is neede to
run 64-bit TSM.
2. The Java Runtime Environment (JRE), freeware from http://java.com/
3. GnuPlot from http://www.gnuplot.info/ . A compact Windows version of GnuPlot
is bundled with TSM but installing the latest release is recommended. It will be
used if it is present.
A graphics file viewer/ processor is a useful accessory.
4. Under Windows, IrfanView from http://www.irfanview.com/ is recommended
freeware. IrfanView will display .png, .gif, .eps and .emf files, and allows
limited editing and conversion to other formats such as .jpg. (Also ideal for
your holiday snaps.)
A PDF viewer is required to read the documentation files. If not already installed on your
system, get
5. Acrobat Reader, freeware from
http://www.adobe.com/products/acrobat/readstep2.html
For data input, suitably formatted text files can be used at a pinch, but a spreadsheet
format, such as .xls, .wks or .in7 (GiveWin format) is recommended .xls
(Microsoft Excel format) is the TSM default data format.
Regrettably, a Linux installation is no longer available since we do not yet have a Linux
compilation of OxJapi Version 2 compatible with Ox 7. Volunteers with Linux or OS-X
expertise and tools are eagerly sought! Meanwhile, TSM for Windows can be run under
Linux or OS-X using a package such as Wine (see http://www.winehq.org/download/).
Installation
This is by running the executable setup file. Be sure to run the TSM installation after
installing Ox and the JRE. The TSM files are installed in a sub-directory of the Ox
installation, which must accordingly exist. The options presented by the program to
specify the installation are as follows:
1. The installation directory (TSM Home). This must specify a path of the form [oxhome]\packages\tsmod4, where [ox-home] is the location of the Ox
installation, and in the most usual case will stand for c:\program
files\OxMetrics7\Ox. In a 64-bit Windows 7/8/10 system, for 32-bit Ox,
including Ox Console, the destination directory is c:\program files
(x86)\OxMetrics7\Ox.
3
James Davidson 2015
2. The “Start-in” directory, (or home folder) which will be used by default to write
program outputs. This should normally be a subdirectory of the user’s Documents
directory. The user must have write permissions in this directory although, once
TSM is installed, write permissions in TSM Home are not required.
3. The Ox installation options are “32-bit Ox Professional or Ox Console” and “64-bit
Ox Professional”. Be sure that the selection at Stage 1 matches the selection made
here. Note that Ox Console (the free version for academics) is currently only
available as a 32-bit application.
4. The Start Menu folder, by default “Time Series Modelling 4”.
5. Choice of look and feel for the graphical user interface. The “Windows Classic”
interface is similar to that used in TSM versions up to 4.26, featuring 3D-effect
buttons and boxes. “Windows Standard” is said to adapt itself to the flavour of
Windows installed, XP, Vista etc. “Java Metal” is described as cross-platform,
ensuring a similar appearance under Windows and Unix.
6. Also selectable are two alternative sizes for the icons and fonts. Under Windows XP
and Windows 7 the choice “Small” appears satisfactory. However, on a Windows 8
or Windows 10 Surface tablet, the display is excessively cramped, and scrollbars do
not display correctly. In this situation (or simply if you like a big bold application)
choose “Large”. These settings can be refined post-installation by editing the header
file tsmgui4.oxh – see Appendix B.
The installation creates registry keys that provide icons for the special program files,
with extensions .tsm (program settings and specifications, the red TSM logo) and
.tsd (model specifications, results and data; blue TSM logo on a page.)
Installing 64-bit TSM
This requires the 64-bit version of Ox 7, which is a component of OxMetrics 7
Professional. This is a commercial product that can be purchased from Timberlake
Consultants Ltd. There is no 64-bit version of Ox Console, as yet. Also needing to be
installed is the 64-bit version of the Java JRE. Install TSM in the same way as for the 32bit version, with the appropriate selection at Stage 3 above. Note that it is possible to
have both 32-bit and 64-bit Ox installed, so be careful to select the correct installation
directory at Stage 1. In Windows 7, this is contained in Program Files while 32-bit
software is installed in Program Files (x86).
Starting and Running TSM
In normal use, TSM is started by running the Ox executable (oxl.exe) on a starter file
(called tsmod_run.ox by default) which in turn loads the main TSM code module.
This, in its turn, starts the Java Runtime Environment (JRE). There are always two icons
on the task bar, one (with red TSM logo) for the JRE, the other representing the DOS
box running Ox. The latter normally runs in minimized mode, but it displays error
messages in case TSM terminates incorrectly.
There are three basic ways to initiate this sequence.
1) By clicking a shortcut on the Start Menu or Desktop. The installation program
places two shortcuts on the Start Menu.
4
James Davidson 2015
“Time Series Modelling 4”, is for normal use, and runs the Windows batch file
tsmod_runsc.bat. This starts the instance of tsmod_run.ox residing in
the TSM Home directory.
“TSM4 with User Code” runs the batch file tsmod_runuc.bat which starts an
instance of tsmod_run.ox located in the Start-in directory. If this does not
exist it will be created. It can be edited to allow the user to compile his/her own
Ox code with the program.
The start menu icon associated with these shortcuts shows the TSM logo enclosed in
a white square. Since errors in the user’s code can prevent TSM from starting, it is
advisable to keep both these start-up icons available on the Start Menu.
2) By double-clicking a TSM settings file (having .tsm extension and red TSM icon)
in Windows Explorer. This action runs the associated batch file Start_TSM.bat
which in turn runs the batch file tsmod_runsf.bat, passing the name of the
chosen settings file. In this case, the Start-in directory is the one where the selected
.tsm file resides. The second icon on the task bar (representing Ox) is in this case
the Windows black and white “c:\-prompt” icon.
3) By double-clicking a TSM model/listings file (having .tsd extension and blue
TSM icon) in Windows Explorer. Similar to 2), except that the file settings.tsm
in the current Start-in directory is loaded if it exists, and then the model or listing data
are loaded.
About the Home Folder
The home folder (or work folder, also referred to here by its Windows name the “Startin” directory) is the storage location of the TSM settings file (default name
settings.tsm) from which program data are read at start-up, and to which they are
written at close-down and periodically during program operations. By default, other files
generated by the program (particularly data files associated with models and batch
operations, with extension .tsd) are also stored in the home folder, although other
locations can be selected when the program is running.
In normal operations, when the program is started from a desktop icon or Start Menu
icon, the home folder is the one selected during the installation procedure, the path being
used to create a Windows shortcut. (See the next section for details.) The home folder
location itself is not stored in the settings file, so if a different settings file is opened
while the program is running, the home folder is unchanged.
However, if TSM is started by double-clicking a settings (.tsm) file in Windows
Explorer, the home folder is the location of this file at start-up. Other file storage
locations are stored as program settings, so the program will continue to look for its data
in the places remembered from the last session, regardless of where it is started.
However, these locations can be changed as required, using the menu commands “Files /
Folders / ….”. The files (other than results files that are not accessed by the program and
batch files which are temporary) are moved automatically to their new locations.
If a settings (.tsm) file has been created using the command Files / Settings / Export…
all relevant material (data, model files, tabulations, etc.) is bundled in the file, and
existing storage locations are not preserved unless they are subfolders of the home
folder. Thus, such files can be freely ported between installations and distributed to other
users. At start-up, all stored files are written to the same locations relative to the home
5
James Davidson 2015
folder. The option to move one or more types of file to new locations can then be chosen
as before.
Creating Additional Shortcuts and Start Options
Here’s how to create a new Windows shortcut from scratch.
a. Open the TSM installation folder in Windows Explorer. Typically, this is
C:\Program Files\OxMetrics7\ox\packages\tsmod4.
b. Right-click the batch file tsmod_runsc.bat and choose “Create
Shortcut”.
c. Right-click the shortcut, and select “Properties”.
d. Edit the Target field, and add the following run parameters following the
batch file name:
(i) The path to the Ox executable oxl.exe, typically
"C:\Program Files\OxMetrics7\ox\bin"
(ii) The path to the TSM installation, typically
"C:\Program Files\OxMetrics7\ox\packages\tsmod4"
(Use the Target field in the default shortcut as a template for these entries.)
e. Set the Start-in directory, as desired.
f. Set the “Run” option to “Minimized”.
g. Change the icon to tsmico.ico. located in the TSM Installation directory.
h. Click OK, rename the shortcut, and drag it to the Start Menu or desktop.
Any number of such shortcuts can be created, to point to starter files in different folders
associated with different research projects. To create additional shortcuts of the “TSM4
with User Code” type, create the shortcut to point to tsmod_runuc.bat. The user
code module and settings file loaded then depends on which shortcut is used to start the
program.
The use of shortcuts can be avoided by double-clicking any settings file (with .tsm
extension) in Windows Explorer, to start the program. The folder containing this file is
then automatically assigned as the Home folder.
Another possibility is to create additional batch files to point to different Ox start-up files.
Any file with the .ox extension containing the first line
#import <packages/tsmod4/tsmgui4>
can be used to launch TSM. Batch files can be located anywhere convenient, in the Startin directory for instance. Use the file tsmod_run.bat as a template. Create shortcuts
to the new files as described above.
Installing Gnuplot
TSM uses the public domain Gnuplot system for its graphics. The Gnuplot version 4.2.6
executable (wgnuplot.exe ) is installed automatically with TSM. The current version
of the package, Gnuplot 4.6.3, features a number of useful enhancements. It is too large
to distribute in this way, but can be installed separately. Download the Gnuplot
installation package from http://www.gnuplot.info/. If installed, this version will be used
automatically in place of the distributed version. In case the location of the installed
package is different from the default, edit the Get_GnuPlotExe() function in
6
James Davidson 2015
tsmgui4.h to supply the correct path.
Warning: Upgrading your installation is essential! Earlier versions of Gnuplot are not
compatible. To force the use of the distributed version, go to Options / General /
Special Settings and double-click “Plot with Gnuplot 4.2”.
Upgrading
To upgrade an existing installation, run the installation program as usual. The existing
file locations are retained unless edited during the setup process.
The file tsmgui4.oxh may be customized by the user (See Appendix B). The Setup
routine copies this file to the Start-in directory only if it does not already exist. The
existing copy is not over-written, nor is it deleted by the uninstall routine. Setup creates a
file called tsmgui4bk.oxh containing the current default entries for tsmgui4.oxh.
An upgraded tsmgui4.oxh is created by combining these two files, preserving the
existing form of all lines containing customizable settings. See Appendix B (page 12) for
the list of keywords identifying customizable lines. If there is no pre-existing copy of
tsmgui4.oxh in the installation directory, it is copied direct from tsmgui4bk.oxh.
Copying this file manually is an easy way to restore the default settings.
Troubleshooting
1. Under Windows XP/Vista/7/8/10, the program should install reliably provided all the
installation procedures are followed correctly. In particular, be sure that in the TSM
installation wizard, the “Destination Location” is correctly located within the existing
Ox installation folder.
2. If nothing happens when you try to start the program as above, check whether the
DOS command window has opened, and then whether the Java Runtime Environment
(JRE) has started. These components have separate task bar icons. Problems with the
JRE have occasionally been reported under Windows Vista, and these almost
certainly have to do with the misbehaviour of certain third-party firewalls and viruscheckers. To check if this is your problem, completely uninstall any suspect programs
and re-boot your system, before trying again.
3. If there is a problem displaying help files and toolbar icons, first make sure that the
help files are located in the folder [ox-home]\packages\tsmod4\help\
so that the program can find them. Toolbar icon files, with extensions .gif, are
contained in [ox-home]\packages\tsmod4\swicons\. If a problem
remains, or graphics files fail to display, open the file tsmgui41.h in a text editor,
and edit the line Get_HomeDirectory(){…}. On most systems the Ox command
oxfilename(1) works OK, but it might be necessary to type the path explicitly,
using DOS short names. Don’t forget to enclose the path in double quotes, and use
‘\\’ in place of the DOS ‘\’.
TSM under Linux and Mac OS X
TSM for Ox 7 is available only for Windows. This may change in future, but meanwhile
it can be run successfully on other platforms using the free Wine package; see
http://www.winehq.org/. This section describes the implementation on an Ubuntu 13.04
system.
7
James Davidson 2015
Use the Ubuntu Software Centre (look under “Uncategorized”) to install Wine and also
Q4Wine, a utility that implements versions of standard Windows components including
the Explorer, Notepad and DOS console. Use Q4Wine Explorer to access the Wineemulated “Windows” directory structure, including a “C: drive” with Program Files and
Users subdirectories. Using Q4Wine, download and install the Windows versions of Java,
Ox console and then TSM, and also Gnuplot, by running the installation executables in
the usual way in Q4Wine Explorer.
There does not appear to be a facility in Wine to create shortcuts to run batch files, nor
can TSM be started by the usual Windows procedure of double-clicking a settings file.
Hence, a different strategy must be used to start TSM. Running oxl.exe in the Q4Wine
command window is a possible method, but a much more convenient alternative is to use
OxEdit. The one additional installation step needed is to use Q4Wine Explorer to access
the TSM home directory, and copy the file tsmod_run.ox into the working directory
designated when TSM was installed. The steps to start the package are then as follows:
1. Navigate to the working directory in Q4Wine Explorer, and double-click on
tsmod_run.ox into start OxEdit with this file loaded.
2. Run tsmod_run.ox in OxEdit to start TSM.
Once TSM is running it can be operated in the usual way. Either the operations of
dragging and dropping from the Q4Wine Explorer, or the usual menu commands, can be
used to load data and settings files. Speed penalties appear negligible.
There are two further features of the true Windows implementation of the program that
Wine (in the version under examination) cannot emulate. The first, a fairly minor issue, is
that the Courier (typewriter) font appears to be unavailable to Java. A variable-width font
is used in the results window, so that the usual formatting, with columns of data aligned,
is not obtained. A work-around to see the output in its usual formatting is to highlight the
required text, right-click and choose Copy, and then paste the text into Q4Wine Notepad,
which does offer the option of a Courier font.
The second issue is that DOS commands issued by Ox can fail to execute and, in
particular, graphics are not displayed by Gnuplot automatically. However, the .PLT files
that TSM creates to be processed by Gnuplot are placed in the working directory. With
Gnuplot installed, double-clicking these icons in Q4Wine Explorer brings up the desired
plots.
SsfPack State Space Modelling
SsfPack Basic is a free (for academic research and teaching purposes) download from
http://www.ssfpack.com/ . If it is installed as a package in your Ox installation, its
facilities can be accessed from TSM. Simply extract the ssfpack folder from the
download file ssfpack_basic_30.zip into the oxmetrics7/ox/packages
folder and then re-run the TSM installation program. SsfPack will be detected
automatically, and a dialog to use its features can be opened from the Setup menu. Usage
is fully documented in the TSM User’s Manual in conjunction with the SsfPack
documentation.
Please note that commercial and government users should purchase a licence for SsfPack,
as for the Ox package itself. See the web page for details.
8
James Davidson 2015
Program malfunctions
If TSM should crash due to an Ox execution error it restarts automatically, displaying a
screen with instructions for saving diagnostic information. The Ox error message,
including line numbers to identify the crash point, is shown in the console window.
If the crash occurs in TSM code, please copy the message and email it, along with a note
of the TSM version you are using, to [email protected]. Please make sure
you have the latest version of the program, since bug reports on earlier versions cannot be
considered. The error screen displays options to continue or quit, and also to export the
current settings and models to a file called error_report.tsm in the home directory.
It will greatly assist in diagnosing problems if this file is emailed along with the error
message. However, please be aware, in case there are any issues with confidentiality, that
this file will contain the data set and model specifications.
In rare circumstances the Java front end can freeze up, with the program becoming
unresponsive. If this happens, closing the DOS box running Ox usually terminates the
program. If the TSM window does not close at this point, either close it in Task Manager
or run the utility “renewjava.exe” in the installation folder. By default, restarting the
program should restore the complete working environment including the results window
contents.
9
James Davidson 2015
Appendix B. Setting GUI Appearance and Run Options
Changes can be made to the appearance and behaviour of TSM by editing the file
tsmgui4.oxh in the installation directory. This file specifies certain external functions
which return user-selected values to the program. Each function consists of a single line,
“return [option];” where [option] is the user-selected item, either a text string
enclosed in "" or an integer value.
The main settings are made by running the installation program, which edits this file
automatically according to the user selections. Editing the file manually allows fine
tuning of the installation. Edit these lines with care, since errors may prevent TSM from
starting!
Get_HomeDirectory()
returns a text string containing the path to the TSM home directory, which is the
directory where your TSM installation resides. By default, this is the string
returned by the Ox function oxfilename(1), but an explicit path can be
substituted. Use this setting if (e.g.) the help and graphics functions are not
working as expected.
Get_CWD()
returns a text string containing the path to the desired working directory. By
default this is the string returned by the Ox function getcwd(). An explicit path
can be substituted to let files be written to a location different from the directory
where TSM is started.
Get_GnuPlotExe()
returns a text string, the explicit path/name of the installed Gnuplot executable. If
this points to a separate Gnuplot installation, it will be used in place of the
compact supplied version.
Note that this function is also defined in tsmknl4.oxh. It should be edited
separately if TSM is to be run without the GUI.
Get_ResultsBufferSize()
returns the desired memory (bytes) reserved to contain the contents of the results
window. If the buffer is filled, the user is prompted to save the contents to a file
before clearing it. The default value is 10000000 (10 Mb.) This should be large
enough for most sessions, but raise it if you have plenty of memory.
Get_HelpDir() and Get_IconDir() return the locations of help and icon files as
sub-directories of the TSM home directory.
Get_LFType() selects the look and feel of the GUI. Here are the options available for
Windows.
1 or 2: Windows look and feel (depends on Windows version).
3: Windows Classic look and feel.
0 or 4: Java ‘Metal’ motif.
Note: this setting should normally be changed by running the installation program. This is
the recommended procedure. You will need to reboot your computer (or close
javaw.exe in Task Manager) after changing this setting.
10
James Davidson 2015
Get_IconSize() selects the size of the toolbar icons. Returning 0 selects small (16
16 pixel) icons, while returning 1 selects 32 32 pixel icons.
WidthFactor() controls the on-screen dimensions of all program objects, including
the frame, dialogs and fonts.
When the installation executable is run, setting Icon and Font Size to “Small” sets
this function to return 1, as well as specifying small icons. This is generally the
best size for Windows XP and 7 systems. If Icon and Font Size is set to “Large”,
this function returns 1.6, and the onscreen display is scaled up accordingly.
Get_FontSize() sets the points for the dialog box text. Note that this setting is
relative to the selected width factor. The default value of 12 points should not
normally need changing.
Get_ChFontSize() sets the point sizes for lists and combo-box (pull-down menu)
text. Note that this setting is relative to the selected width factor. The default
value is 11, and should not normally need changing.
Get_FontStyle() sets the font style for the dialog box text.
GraphDelay() sets a delay (in 100ths of a second) between calling GnuPlot and
processing its output. The default is 200. Increase the setting if graphic files are
not being written to disk correctly.
Get_FrColor()returns the colour used for the menu bar, tool bar and status bar as an
RGB triplet (an array of three integers from 0-255). White is the colour selected
for Windows 8, 8.1 and 10 installations.
Get_BgColor()returns the dialog background colour, similarly.
Get_HgColor() returns the colour to be used for highlighted buttons, similarly.
Get_TextAreaBG() returns a background colour of the text window as an RGB
triple (selectable as one of the options in Options / General ).
Get_NameCharacter() returns a string containing the separator to be used for
determining where the name of a variable ends and the appended description text
begins. Use this character (or character string) when preparing data for input in a
spreadsheet or text file. The default setting is “@”.
Get_LenMRUList()returns an integer, the maximum length of the Most Recently
Used file lists. The default setting is 10. Setting to 0 turns off the MRU list
feature.
Get_MaxDatsets()returns an integer, the maximum number of data sets that can be
stored in memory. The default setting is 10. Setting to 0 turns off the option to
store additional data sets.
Get_LenMRUModList()returns an integer, the maximum length of the Most Recently
Used model lists, see “Model / Load a Model…”. The default setting is 20.
Setting to 0 turns off the quick model loading feature.
Get_ComboBoxRows()returns an integer, the number of items to be displayed in a
combo-box (pull-down menu, choice widget). The default setting is 20.
Get_StartFileName() returns the name of the file that is run under Ox to start
TSM. TSM needs to know this for restart operations. The default name is
11
James Davidson 2015
tsmod_run.ox. It can be changed, but the name must also match that
appearing in Windows batch file scripts – otherwise TSM will not start.
Get_CodeFileName() returns the name of the file used to contain the user’s Ox code
for compilation under TSM. The default name is usercode.ox It can be
changed, but should also match the name appearing in Windows batch file scripts.
Get_BatchFileName() returns the name of the Windows batch file containing the
TSM start-up script, needed to enable automatic restarts. By default this is
tsmod_runsc.bat. It can be changed, but must match the name appearing in
the Windows Start Menu and Folder Option scripts.
Get_SettingsFileName() returns the name to be used for the standard TSM
settings file, which is opened at start-up. By default the value returned is
“settings.tsm”. It may be convenient to use a different name if two or more TSM
installations exist.
Get_ListingFileName() returns the name to be used for the data backup file, and
should have a “.tsd” extension. By default the value returned is “settings.tsd”. In
general, use the name matching the standard settings file.
Get_ModelFolder(), Get_EDFFolder(), Get_BatchFolder()
These functions return default paths to storage folders for files of the indicated
types, as subdirectories of the Start-in directory (the home folder). The entries
returned by these functions are appended to the Start-in path (as set during
installation) – they should not be complete paths! They are empty by default
(returning "") such that the Start-in directory contains all these files.
ChangeUserPath() returns a two-element array, where the first element is a string
and the second element can be a string or an array of strings. This allows the user
to copy settings files seamlessly between installations, even when the paths to the
user documents directory may be different. The first element should contain the
path to the documents directory of the local installation. The second element (or
array of elements) should consist of any paths that are to be replaced by the local
path if encountered while reading a file.
The default code is return {"",{}};
Some run settings can be modified by compiler directives. These can be included in the
file tsmod_run.ox, where they must appear before the line
#import <packages/tsmod4/tsmgui4>
For inclusion on a permanent basis, the directives can also be placed in tsmgui4.h.
Note that lines of a file with .ox or .oxh suffix beginning with // are treated as
comments, and ignored by the Ox compiler. This is called “commenting out” a line.
Use this method, rather than deleting lines, to edit your files. Then the old settings are
easy to restore.
The compiler directives take the form
#define [directive] where [directive] represents one of the following capitalized
names.
USER_CODE
12
James Davidson 2015
Signals the inclusion of user-coded functions in the run file. For further details see
Appendix C.
TEXT_INPUT
Set this directive if program settings are to be loaded at start-up in coded form, as
lines in an external function Text_Input(). See Appendix E for details.
TEXT_DEFAULTS
Similarly to TEXT_INPUT, this directs that default settings (to be re-instated
when the File / Settings / Clear All command is given in the program) are to be
read from an external function called Text_Defaults().
GNUADJUST
This allows some additional control over plot styles. In addition to setting the
#define GNUADJUST directive, add the following lines in the run file:
Adjust_Plotsettings()
{
PLOTLINE_1 = 2;
PLOTLINE_2 = 7;
PLOTLINE_3 = 5;
PLOTLINE_4 = 3;
}
//
//
//
//
first variable
second variable
forecasts
forecast s.e. bands
The settings shown here are the defaults. For the alternative settings, see the Ox or
GnuDraw help documents. Table draw1 shows the available line styles, and the
DrawZ function shows the s.e. band styles.
Note: line options for series plots are set as graphics options in the program. Use
this option to change the line style for graphics such as correlograms, spectra, QQ
plots etc.
OXDRAW
Loads the OxDraw drawing functions instead of GnuDraw. With this option,
interactive display of graphics using Gnuplot is not available, but .gwg files can
be saved to disk. These can be displayed in a GiveWin or OxMetrics window and
modified using the GiveWin/OxMetrics graphics editing features.
OXWARNING
Switches on Ox error messages that are normally suppressed, such as warnings of
attempts to invert singular matrices, failure in eigenvalue routines, etc. These may
be useful to diagnose problems with estimation. These warnings are not under the
control of TSM, and appear in the Ox console window, not the TSM results
window. Note that echoing of TSM output to the console is controlled by an
option in the Options / General Options dialog.
Here is the list of key words identifying lines that will be preserved when the file
tsmgui4.oxh is updated.
Get_HomeDirectory
Get_CWD
Get_ResultsBufferSize
Get_HelpDir
Get_IconDir
Get_NameCharacter
Get_LFType
13
James Davidson 2015
Get_FontSize
Get_ChFontSize
Get_FontStyle
Get_TextSize
Get_TextStyle
GraphDelay
Get_LenMRUList
Get_BgColor
Get_HgColor
Get_TextAreaBG
Get_LenMRUList
Get_LenMRUModList
Get_MaxDatsets
Get_StartFileName
Get_CodeFileName
Get_BatchFileName
Get_SettingsFileName
Get_ModelFolder
Get_EDFFolder
Get_BatchFolder
CondorNetOS
CondorNetArch
Get_ComboBoxRows
Get_GnuPlotExe
Get_64Bits
Get_IconSize
WidthFactor
ChangeUserPath
#define GNUADJUST
#define TEXT_INPUT
#define TEXT_DEFAULTS
#define OXDRAW
#define OXWARNING
#define CONDOR
#define USER_CODE
#define SSFPACK
Any line containing one of these strings is passed through unchanged to the updated file
when the installation is upgraded.
Additional settings for use when the program is run as an Ox module, not in GUI mode,
should appear in tsmknl4.oxh.
14
James Davidson 2015
Appendix C. Including User-coded Ox Functions
There are several different ways in which Ox code written by the user can be
incorporated into TSM. See Section 4.6.7 of the main TSM document to see how these
functions can be integrated into models formulated in the program.
UserFunction – return a vector/matrix of equation residuals representing f1t in
equation (4.32) (see the main TSM document, Section 4.6.3).
UserSolve – invert f1t in equation (4.31); i.e., solve a model from residuals
generated by the program.
UserLikelihood – return a likelihood function or other estimation criterion to be
optimized directly, by-passing TSM’s built-in options.
UserTest – compute a test statistic from estimation outputs (criterion gradient and
hessian, residuals, parameters, etc.)
Two additional options bypass TSM’s built-in features.
UserStatistic – compute a statistic direct from the data set.
UserGenerate – generate a full sample of random observations.
The following function is to allow unspecified user modifications of various kinds.
UserCode – return a value depending a state of the program.
Basic Coding Guidelines
With the main exception of UserTest, which has important extra arguments, the basic
format for these functions is similar. For example, the first case should take the form
UserFunction(const mcX, const cStart, const cEnd,
const vP, const aName, const bMode)
{
...
}
where the ellipsis represents the user's code. (Note that Ox is case-sensitive.) The
arguments passed to the function are as follows.
mcX is the data matrix, with the series arranged by columns.
cStart and cEnd are first and last of the block of rows of mcX for which the
calculations are to be performed.
vP is the row vector of parameters, as named in the dialog Model / Coded Function.
aName is a pointer to a location containing the string entered in the ‘Ox Function
Name:’ field in Model / Coded Function. The location itself (a string on entry, but
can be an array of strings on exit) is accessed as aName[0].
bMode is a Boolean flag, set equal to 1 if the function call is being made on a second
or subsequent occasion in an estimation or simulation run, and 0 otherwise.
Consider the following example, which generates the residuals for a first order bilinear
model.
UserFunction(const mcX, const cStart, const cEnd,
15
James Davidson 2015
const vP, const aName, const bMode)
{
decl xnum = VarNum("Bilin");
decl vcy = zeros(rows(mcX), 1);
for (decl t = cStart + 1; t <= cEnd; t++)
vcy[t][] = mcX[t][xnum] - vP[0]
- vP[1]* mcX[t-1][xnum]
- vP[2]* mcX[t-1][xnum]*vcy[t-1][];
if (cStart<=cEnd) return vcy[cStart:cEnd][];
else return 0;
}
Notes:
1. The const argument qualifier means that the argument cannot be changed by the
function. Attempting to assign a new value produces an error. This improves the
speed of execution, and is recommended as the default setting when writing Ox
functions. Omitting the qualifier has the effect that a local copy of the argument is
created with that name, and this can be changed, although the argument itself
(existing outside the function) is not changed.
2. Observe the Ox convention that matrix row and column indices start at zero. If the
whole sample has been specified for the calculations, then cStart = 0 and cEnd
= rows(mcX)-1. A matrix is indexed with row and column indices appearing in
separate [] pairs, so that the {t,j} element of the data matrix is mcX[t][j].
3. VarNum() is a TSM function that converts a variable name (a text string, enclosed
in double-quotes) to the corresponding column number of the data matrix. Note that
variable names are case-sensitive.
4. Variables in the data set can be referenced directly by name, using the VarNum()
function, or alternatively, program model settings can be referenced using the
variable names defined in the TSM Programming Manual. For example, the
dependent variable(s) selected in the Dynamic Equation dialog can be accessed in
SERIES which is an array of one or more strings (names). The column of the data
matrix containing the first (or only) dependent variable is obtained as
VarNum(SERIES[0]).
5. Functions can call other functions which can call yet others. The rules of Ox
programming apply, but the simplest rule to observe is that a called function must
appear before the calling function, in the .ox file.
6. See the Ox documentation for additional guidance on coding. The rule for fast code
is to use built-in Ox functions as much as possible. While nonlinear recursions such
as the above example may be unavoidable, explicit loops are slow to execute
compared to the equivalent operations using Ox matrix functions.
7. The bMode flag can be used to reduce computation time by storing the results of
calculations that need to be repeated in each of a sequence of calls. The statement
UserStore(x);
stores the contents of the object x, which can be of any type. Any existing contents
are overwritten. The statement
x = UserRetrieve();
16
James Davidson 2015
copies to x whatever has been stored by a previous call to UserStore. If nothing
has been stored, 0 is returned. Thus, suppose the user’s function contains the
statements
decl x;
if (!bMode)
{
x = ...
UserStore(x);
}
else x = UserRetrieve();
where the ellipsis represents the code for computing x. This will compute and store x
on the first call, and retrieve it on subsequent calls.
If there is more than one object to be stored and retrieved, define x as an array. It is
even possible to share the storage space between several user functions, by making
sure that the array is initialized on the first call. Recalling that UserRetrieve
returns 0 if nothing has been stored in it, consider the following example:
decl z, x = UserRetrieve();
if (!isarray(x)) x = new array[2];
if (!bMode)
{ x[0] = ...
UserStore(x);
}
z = x[0];
The second function using the store should contain the same lines (with z suitably
defined) except that x[0]is replaced by x[1].
8. Be careful to note that the pointer aName always points to a string (a name) when
the function is called. On exit, it can point to a different string and in some cases to
an array of strings.
Coding Residuals
For a single equation model, UserFunction should return a column vector of
residuals having cEnd - cStart + 1 rows.
For a system of equations, UserFunction should return a matrix with the residuals
for each equation in the columns. In this case, there is a built-in function LocUP for
locating the parameters for each equation. The location vP[LocUP (cEq, cJ)]
contains parameter cJ in equation cEq. Following the Ox convention we count from
zero, so the reference to the first parameter in the first equation is vP[LocUP (0, 0)].
This function will usually be called as part of a numerical optimization sequence. The
bMode flag is set to 0 on the initial call and 1 on all subsequent calls, until estimation is
completed. Any function components not depending on the parameters should be
evaluated and stored on the first call and retrieved in later calls.
Tips: If the number of lags, or other features of your function, are to be chosen
interactively, code the most general form you want to consider. Then, simplify the
function as required by “fixing” the corresponding parameters at 0 interactively in the
Values / Equation dialog. This allows the specification to be changed, and tested, without
needing to stop the run and re-code.
17
James Davidson 2015
Solving the Model
If ex ante forecasts or stochastic simulations are required, it is necessary to code the inverse
of UserFunction, to retrieve the original series back from the residuals. The function
UserSolve must be created to do this. This function must take the form
UserSolve(const mcX, const vcY, const cStart, const cEnd,
const vP, const aName, const bMode)
{
...
}
Note that it takes one additional argument, which is the vector (or matrix, for systems) of
residuals.
Here is the bilinear example.
UserSolve(const mcX, const vcY, const cStart, const cEnd,
const vP, const aName, const bMode)
{
decl vcx = zeros(cEnd - cStart + 1, 1);
decl xnum = VarNum("Bilin");
for (decl t = cStart; t <= cEnd; t++)
if (t > 0)
if (cStart>0)
vcx[t][0] = vcY[t][0] + vP[0]
+ vP[1]* mcX[t-1][xnum]
+ vP[2]* mcX[t-1][xnum]*vcY[t-1][0];
return vcx;
}
Notes:
1. This function should return a vector of values (or a matrix, for systems) with
cEnd – cStart + 1 rows. For simulations, it is called with cStart = cEnd, to
provide one new value at a time. cStart = 0 is a possible value. The coding
must be designed to allow for this, returning (e.g.) zero if lags are not available.
bMode is set to 0 when cStart and cEnd represent the first observation to be
solved, and 1 for the subsequent observations of the sample.
2. The program writes the generated values into the matrix mcX in sequence. For
cStart > 0, the user can assume that mcX[t-1][xnum] is either the actual
observation on BILIN, on the first call, or otherwise, the value returned on the
previous call.
3. The forecast period can extend beyond the end of the observed data, and in this
case the matrix mcX is extended with zeros. It is the user’s responsibility to make
sure to specify the sample and forecast periods so that valid data are being read. In
general, only closed models without exogenous variables can be forecast properly
ex ante (beyond the observed period).
4. UserSolve cannot return a function name, it can only receive the name as an
argument. It must be paired with a UserFunction, and if this function returns a
name, this is passed to UserSolve as well being used in the output.
18
James Davidson 2015
Coding the Likelihood
Another option is to return a user-coded likelihood function. In this case, all the
modelling options in the program are bypassed, and the user has freedom to specify a
complete model. The arguments for UserLikelihood are exactly as for
UserFunction.
This function must return a column vector of dimension cEnd – cStart + 1,
representing in this case the contributions to the log-likelihood for each observation – that
is, the log-density or log-probability terms. The function maximized is the sum of the
terms returned. The program may also differentiate this vector term by term by difference
approximation to compute score contributions.
Notes:
1. It is possible to compute residuals, simulations and forecasts in this mode
provided UserSolve and UserFunction are defined in the usual way. If
UserLikelihood itself calls UserFunction, it only needs to supply the
code to transform residuals into log-likelihood contributions.
2. UserLikelihood can return a name, similarly to UserFunction. This is
ignored by TSM unless bMode = 0.
3. Because the built-in model features are bypassed in this case, the Dynamic
Equation dialog can be used to specify variable groups which can then be
accessed by the code (see Note 4 under Basic Coding Guidelines). In addition to
SERIES, the arrays of names that can be accessed include REGRESSORS_1,
REGRESSORS_2, REGRESSORS_3 and INSTRUMENTS. This can allow the
model specification to be changed on the fly without changing the code.
Coding a Test
The UserTest function receives as arguments the main outputs of a successful
estimation run. These can be used to code one or more test statistics to be written to the
Results window, if this option is selected in Model / Coded Function.
To return a single test, the format is
UserTest(const vParam, const mGradients, const mHessian,
const mCovmat, const vRes, const vSigmas, aDstat, mStat,
const mcX, const cStart, const cEnd, const aName, const
bMode)
{
decl dStat, iDist, iDF1, iDF2;
. . .
return dStat|iDist|iDF1|iDF2;
}
The return value is in this case a 41 vector.
dStat is the computed value of the test statistic. iDist is an integer code to indicate
what distribution is to be used to compute the p-value for the test, and iDF1 and iDF2
are degrees of freedom or other test parameters. If only the statistic is returned, no pvalue will be reported.
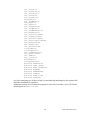
The distribution codes are:
iDist = -2;
No critical values. (No p-values are reported, equivalent to
19
James Davidson 2015
iDist
iDist
iDist
iDist
iDist
iDist
iDist
iDist
=
=
=
=
=
=
=
=
-1;
0;
1;
2;
3;
4;
5;
6;
iDist = 7;
iDist
iDist
iDist
iDist
=
=
=
=
8;
9;
10;
11;
returning the statistic only.)
Critical values returned by the function – see below.
Chi-squared with iDF1 degrees of freedom.
Standard normal (2-tail test).
Standard normal (upper tail test).
F distribution with iDF1 and iDF2 degrees of freedom.
Student’s t with iDF2 degrees of freedom (2-tail test)..
Student’s t with iDF2 degrees of freedom (upper tail test)..
Dickey-Fuller distribution with iDF1 =1 to allow for trend, 0
otherwise.
Dickey-Fuller distribution for regression residuals, with
iDF1 =1 to allow for trend, 0 otherwise, and iDF2 regressors
excluding trend.
KPSS distribution with iDF1 = 1 to allow for trend.
Lo’s R/S distribution.
Nyblom-Hansen distribution for iDF1 parameters.
Kiefer-Vogelsang-Bunzel F* distribution for iDF1 parameters.
To return K 2 tests, simply concatenate the columns for each test and return a 4K
matrix.
The additional function arguments are as follows, where T = cEnd – cStart + 1
and m = number of equations.:
vParam
The full parameter vector (1 × (p + r))
mGradients
Gradient contributions (T × p)
mHessian
Hessian matrix (p × p)
Covariance Matrix (p × p) (formula as specified in Options / Tests
mCovmat
and Diagnostics)
vRes
Residuals (T × m)
vSigmas
Conditional variances (T × m) (CV models only).
aDstat
Diagnostic statistics: an array of dimension m of 1 × 13
vectors.
mStat
Specification tests: (1 × 20).
Notes:
1. vParam contains all the parameters in the model, including p estimated elements and
r fixed and solved elements. The position of a parameter in the vector is found as the
number in the left-hand column in the relevant Values dialog. vP in the functions
defined previously includes only those appearing in the user-defined function, hence
is a subvector of vParam.
2. The column of mGradients or mHessian corresponding to an element of
vParam has to be found by subtracting the number of restricted (fixed or solved)
elements preceding it in the list from its number in the Values dialog.
3. The elements of aDstat are the diagnostic statistics for each equation. Codes to
access the elements of vectors aDstat[eq] and mStat are given in TSM4
Programming Reference, pages 34-35. Elements are 0 unless the test has been
specified in the input.
4. The other items in the list of arguments are the same as for UserFunction etc.
20
James Davidson 2015
Returning Test Names
The test, or tests, can be given a name by including in the function a statement of the
general form
aName[0] = "Test";
where an identifying name is substituted, in quotation marks on the right-hand side. This
is used to label the statistic in the output. In the case where two or more statistics are
returned, supply a name for each statistic. This is done by the use of an array, for
example,
aName[0] = {"MyStat1", "MyStat2"};
If bMode is set to 1, any returned names are ignored. In a Monte Carlo experiment, the
names are stored following a preliminary run with bMode = 0. The CPU time for the
experiment may be reduced by conditionally bypassing the code to create the name
strings.
Passing Settings to the Function
Numerical values representing test settings can be passed to the function as components
of the test name, in a specified format, and then converted using the Ox sscan function.
For example, suppose the test name is the string "TestCase:a= 4,b= 1", passed as
aName[0]. Variables ia and ib can be assigned the integer values 4 and 1,
respectively, using the statements
decl ia, ib, str;
sscan(&aName[0],"%s",&str,"%i",&ia,"%s",&str,"%i",&ib);
Note that the format "%s" reads everything up to the next space character as a string.
Spaces can therefore be conveniently used to separate the name components. The name is
entered in the GUI by typing it into the Ox Test Name field (or selecting from a list, see
Maintaining a Function Library below) in the Model / Coded Function dialog – see the
User’s Manual for details. Observe that the text components are arbitrary, provided the
order of components separated by spaces is maintained.
Critical Values
The program prints p-values for tests based on known formulae in cases in cases 0-5 of
the distribution codes. Cases 6-10 use published tabulations of critical values obtained
by simulation for specified tail probabilities. In these cases, since the tabulations are only
for selected significance levels, the p-values are reported in the form of inequalities.
It is also possible for the user to supply critical values for a test, either from published
sources, or generated by Monte Carlo simulation in TSM. There are two ways to do this:
1. Return a set of critical values with the statistic. In this case the function UserTest
should return a matrix with seven rows, and one column for each statistic. Thus, in
the case of a single test the return statement might appear as follows:
return dStat|-1|dCV50|dCV10|dCV5|dCV2|dCV1;
where the elements are the 50%, 10%, 5%, 2.5% and 1% critical values. If not all of
these are known, then replace them by the next largest value available. For example,
if only the 10%, 5% and 1% values are available, the return statement should read
return dStat|-1|dCV10|dCV10|dCV5|dCV1|dCV1;
21
James Davidson 2015
This setup ensures that p-values are still correctly reported in the form of
inequalities.
2. Supply the program with a spreadsheet file containing a complete empirical
distribution function (EDF). This can be constructed in any desired way provided the
format is correct, but the TSM Monte Carlo module can create EDF files with the
right format, from a simulation of the null hypothesis. See Appendix G for details of
the file format. Load the required tabulation file (File / Data / Load EDF) and check
“Use EDFs from File for p-Values” in Options / Tests and Diagnostics.
The program must find a statistic name in the EDF file to match the statistic name
returned in aName[0]. This condition will of course be fulfilled if the tabulation is
prepared using the same Ox code in a Monte Carlo simulation of the null hypothesis.
In case there is no match, the program checks for distribution details as in Case 1, and
uses these details if present. Otherwise, no p-value is reported.
Note: there is no need for UserTest to actually compute a test statistic. It can simply
retrieve one of TSM's "built in" tests from the arguments aDstat or mStat, and return
this together with alternative critical values, for example.
Coding a Test with Hessian Contributions
Some tests make use of the contributions to the Hessian of the log-likelihood function.
The best-known example is the information matrix test (a TSM option). The following
special function is provided to return these values:
CallHessianContributions(const vParam)
The argument should be the parameter vector exactly as passed to the UserTest
function. The function returns the (T × p(p+1)/2) matrix of Hessian contributions. The tth
row of this matrix contains the centred numerical second derivatives for observation t,
arranged by rows as the upper triangle of the Hessian, with indices ordered as (1,1), (1,2),
, …, (1,p), (2,2), …,(2,p),…,(p1,p), (p,p).
To use this feature the user code file must contain the header
extern CallHessianContributions(const vParam);
Computing a Statistic
The UserStatistic function does not use estimation outputs, and is intended to be
called free-standing. No simulation or estimation can be performed in a run specifying
this option. Create another model to generate data for Monte Carlo experiments. Select
the Coded Function option in the Model / Dynamic Equation dialog in the Model /
Coded Equation dialog, and the “Statistic” radio button in the Supplied Ox Functions
section.
The function format is
UserStatistic(const mcX, const cStart, const cEnd, const
vP, const aName, const bMode)
{
decl dStat, iDist, iDF1, iDF2;
. . .
return dStat|iDist|iDF1|iDF2;
}
22
James Davidson 2015
The format of the return value is the same as for UserTest. A single statistic or
multiple statistics can be returned. User-supplied critical values are implemented in the
same way, as described above.
Notes:
1. Either a single name or array of names can be returned from the function. In the case
that m statistics are returned, the array should be of dimension m + 1. The first
element is a heading for the test group, followed by names for the individual
statistics. Even if only one statistic is returned, the first of a pair of names is used to
provide a heading and the second appears “on the line”, before the statistic value is
printed. Returned names are ignored by TSM unless bMode = 0, so conditionally
bypassing the naming steps can save CPU time. .
2. Parameters can be passed to the supplied function by naming them in the Parameter
Names fields, and assigning values in the Values / Equations dialog. Note that these
values are simply passed through to the function. They are not changed by the
program, and can be arbitrary; for example, integer values to select from a list of test
options.
3. The supplied function can call TSM program functions, as described in the document
TSM4 Programming Reference (tsmod4prg.pdf). These can be used to change
model settings, compute and access estimates and other results, set starting values,
etc. However, be careful to note that such procedures would not be valid in
UserFunction, UserSolve, UserLikelihood or UserTest.
4. As for UserTest, p-values can be taken from the currently loaded EDF file, if this
option is selected (see Critical Values, Note 2). The name returned by the function
must match one in the EDF file. The natural application is, of course, to use an EDF
file generated from a Monte Carlo simulation of the same test, under the null
hypothesis.
5. Since the specifications in the Model / Dynamic Equation dialog are bypassed by
TSM in this case, the dialog can be used to specify lists of variables which are passed
to the code by external declaration – see Coding the Likelihood, Note 3, for details.
6. It is possible to return comments which will be printed following the statistic values
and p-values. Append up to m additional strings onto the array aName. (These can be
of length 0 if there no comment.) These extra elements of aName are ignored when
the function is called from a Monte Carlo experiment.
Generating Data
The format for the function is
UserGenerate(const mcX, const cStart, const cEnd, const vP,
const aName, const bMode)
{
decl mY;
. . .
return mY;
}
The return value should be a column vector, or matrix, of generated data having cEndcStart+1 rows.
23
James Davidson 2015
Notes:
1. The generated data are stored under the name(s) of the dependent variable(s) selected
in the Model / Dynamic Equation dialog. Use the “Make Zeros” and “Rename”
commands in the Setup / Data Transformation and Editing dialog to create these
“placeholder” variables. It is the user’s responsibility to have the number of variables
selected matching the number of columns returned. Any other model specifications
are ignored.
2. The function argument aName passes the string entered in the ‘Function Name:’ field
in Model / Coded Function/Test. This can be used, as with UserFunction, to
select one of a set of coded specifications. Note, the UserFunction and
UserLikelihood options cannot be implemented at the same time as
UserGenerate. These options can be used in combination in a Monte Carlo
experiment by creating different models, to generate the data and estimate the model
respectively.
3. The parameter vector vP corresponds to the supplied function parameters, as in
UserFunction and UserSolve. These can be named and assigned values in the
Model / Coded Function/Test dialog.
4. The main difference between this function and UserSolve is that is does not use
residuals generated by TSM, and always returns the full generated sample in a single
call. It is not called sequentially, observation by observation. If the Coded Function
option is selected in Model / Dynamic Equation, the simulation module uses the
output from UserGenerate whenever the function is defined, and its return value
is not equal to 0 – otherwise, UserSolve is called.
5. As with UserStatistic, TSM program functions can be called from
UserGenerate.
Controlling Program Functions
In the present implementation, the function
UserCode(const Input, const Output)
can be used to control the acceptance of a Monte Carlo replication. Output represents a
memory location, allowing values to be passed by reference. The line
Output[0]=x;
places the contents of x in a location where it can be accessed in the calling routine.
Currently, this function is called after a Monte Carlo replication is complete. Setting
Output[0]=1 causes the replication to be discarded, similarly to a convergence failure
in the optimization routine. This allows criteria chosen by the user, such as parameter
estimates falling in an illegal region or other evidence of a false maximum of the
estimation criterion, to be used to decide whether to discard a replication. (To activate
this feature, go to Options / General / Special Settings, and set “Censor MC
Replications” to TRUE.)
Note that the argument Input is not used in this application. This function is designed
so that it can to provide a similar functionality in other contexts in future releases.
24
James Davidson 2015
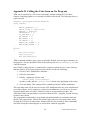
Loading the Code
To include the coded function or functions, TSM should be started from the user’s
working directory. The Windows installation sequence creates a special short-cut, “TSM4
with User Code”, which runs the copy of the run file tsmod_run.ox located in the
designated ‘Start-in’ directory. (Linux users should copy this file manually.) The shortcut also creates a standard code file (named usercode.ox by default) which can serve
as a template for the user’s own code. On installation, this file contains dummy (donothing) versions of all the user-editable functions. Edit these functions as required to
include your own code.
Note: Compilable versions of all these functions, whether dummy or active, must be
present in the code file – otherwise TSM will not start!
Once the code exists in usercode.ox, compile it by opening TSM and giving the
command ‘File / Restart / Load User Code’, and choosing the option ‘OK’. This
command restarts TSM, after first creating or editing the file tsmod_run.ox as
necessary, so that it contains (at least) the three lines
#define USER_CODE
#import <packages/tsmod4/tsmgui4>
#include "usercode.ox"
This file can also be edited manually in a text editor, if required (OxEdit recommended).
Once these lines are present, any code included in the code file will be compiled
automatically at start-up, so the ‘Restart’ step need not be repeated.
However, the recommended scheme is to place the actual code in yet another Ox file, to
be “included” 1 in usercode.ox. In this case, in Windows, a code file can be loaded
automatically by giving the command ‘File / Restart / Load User Code’ and choosing the
option “Select Code File”, which opens the file dialog. Suppose the file mycode.ox is
selected. Then the following actions take place.
1. usercode.ox is edited to contain the line
#include "mycode.ox"
Any other #include directives are deleted, and any other contents are
commented out.
2. TSM is restarted, loading the new code.
Since usercode.ox is a system file whose name is cannot easily be changed, this
strategy makes it much easier to load different bits of code for different purposes.
usercode.ox can also be edited by hand (Linux users do not have the Restart feature
in the current version). If the code file is located in a different directory, include the path
as well as the file name in the quotes, but remember that Ox path formatting conventions
must be used – avoid single backslashes ‘\’. Windows can handle either ‘\\’ or ‘/’, the
latter is also valid under Linux.
Note: Previous versions of TSM used separate #define directives for each type of
function, for example,
1
In Ox, a #include compiler directive followed by the path and name of a text file, in double quotes, has
the same effect as if the contents of the named file were inserted at that position.
25
James Davidson 2015
#define USER_FUNCTION
This type of scheme can still be implemented by editing tsmknl4.h. In this case the
dummy “do-nothing” functions can be deleted from the code file. However, it is then
more difficult to implement a function library, and export and import code. Adopting the
scheme described here is strongly recommended.
Maintaining a Function Library
By preparing the code file suitably, it is possible to run a coded estimator or test by
simply selecting the function from a list in the Models / Coded Function/Test dialog.
To implement this scheme, an additional function to return a list of names must be
created for each function type,. The naming functions are
UserFunction_Names()
UserLikelihood_Names()
UserTest_Names()
UserStatistic_Names()
UserGenerate_Names()
These functions take no argument and should return an array of strings. These names are
displayed in the Models / Coded Function/Test dialog when the corresponding Ox
function type is selected, and can be displayed in turn with the “Previous” and “Next”
buttons.
The displayed name (more precisely, a pointer to its location in memory) is passed to the
function through the aName argument. The function must accordingly be set up to return
the required output, depending on the value of this string.
For example: suppose two test statistics have been programmed, to be called MyTest1
and MyTest2. In this case the naming function should take the form
UserStatistic_Names()
{
return {"MyTest1","MyTest2"};
}
The function UserStatistic might now take the following form
UserStatistic(const vParam, const mcX, const cStart,
const cEnd, const aName, const bMode)
{
decl names;
if(aName[0] == UserStatistic_Names()[0])
return MyTest1(vParam, mcX, cStart, cEnd, &names);
else if (aName[0] == UserStatistic_Names()[1])
return MyTest2(vParam, mcX, cStart, cEnd, &names);
else PrintCall(1, "Error: ", aName[0], " not found. ");
aName[0] = names;
}
MyTest1 and MyTest2 are the functions containing the actual test formulae, returning
their output as 4 k matrices, as specified above. Note that they can also return a pointer
as &names, pointing to an array of names for labelling the outputs. This, in turn, is
handed back by assigning it to aName[0], see the last line of the example function..
26
James Davidson 2015
Notes:
1. Only one function library can be contained in each code file. Maintain different files
for different projects, and switch between them using the Restart command as
described in the previous section.
2. If the list of names to be checked through is lengthy, it saves a bit of CPU time in
repeated calls to store the index of the required function in UserStore at the first
call (when bMode = 0) and retrieve it for subsequent calls (when bMode = 1) .
3. There is no naming function paired with the UserSolve function, because the
outputs returned from this function (if defined) must be paired with the outputs
returned from UserFunction. The same names should of course label both cases.
Exporting Ox Code
The TSM command “File / Settings / Export …” creates a portable settings file bundling
settings, model specifications and data together in one file, with a .tsm extension.
Opening this file at another installation re-instates all the settings, exactly reproducing the
original set-up. If a file usercode.ox exists in the Start-in directory when the settings
are exported, and the option “Include User Code with Exported Settings” is checked in
the Options / General dialog, the currently loaded Ox code is saved similarly, and reinstated at the target installation. This feature can be used for various purposes – to
distribute coded estimators or tests to other users, or simply to store all the materials
associated with a project, including code, model settings and data, in one convenient
location.
In the following, assume that when the exported settings file was created, the user’s code
was contained in a file mycode.ox (say), and usercode.ox contained just the
associated #include directive (this is the recommended setup). When the settings file
is subsequently opened at the target installation, the following actions are performed
automatically.
1. If the file usercode.ox does not exist in the Start-in directory, it is created.
Otherwise, any existing contents are commented out,2 and the line
#include "mycode.ox"
is appended.
2. A copy of mycode.ox is created in the same directory.
3. The copy of tsmod_run.ox residing in the Start-in directory is edited as
necessary to compile the code, as described in Loading the Code at Start-up, or
created if it does not exist.
4. TSM program is restarted to compile the code.
Notes:
1. If a file of the same name as the loaded file already exists in the Start-in directory, the
name of the new file is changed as necessary to be unique. For example, if
mycode.ox exists, the new include file is named mycode1.ox, and the
2
A line of code is “commented out” by placing the characters // in front of it. Delete these to uncomment.
27
James Davidson 2015
#include directive points to this. If mycode1.ox also exists, the new file is
named mycode11.ox. And so on.
2. If tsmod_run.ox exists in the Start-in directory, it is edited automatically to
include the required compiler directives. Any pre-existing #define statements, or
other lines or comments added by the user, to should be preserved at Step 3 above –
but check this file in a text editor in case of unexpected behaviour.
3. It is possible to have the exported code contained in usercode.ox itself, although
this strategy is not recommended. In this case its existing contents are commented out
before the new code is added.
Documenting the Code
TSM features a menu command “Help / View Files / Imported Ox Code”, which displays
the contents of the current code file (either usercode.ox, or the first file “included” in
it) in a similar format to the Help pages. The natural way to document functions is
therefore to include the explanatory text at the top of the code file. This can be
commented out by placing it between /* and */ pairs.
This arrangement lets users examine both the description, and the code itself, without
starting a text editor. However, this is a viewing facility only. The file cannot be edited in
this window.
Debugging Code: Running in Diagnostic Mode
TSM implements an error recovery feature that allows Ox error messages to be reviewed
in the event of an execution error. Ox prints useful diagnostic information, including the
line number where the crash occurred. However, for this feature to work the program
must be able to start, so it does not help in the case of compilation and linking errors.
Provided the standard Ox header files are included in usercode.ox, the code can be
compiled as a free-standing module. Choose the option “Modules / Ox compile” in
OxEdit, which will print any error messages.
However, if there are linking errors preventing TSM from starting with usercode.ox
included, it is necessary to run TSM in diagnostic mode to see error messages, requiring
some configuration by the user. For widest scope of application, the procedures described
assume that the user does not have write permissions for the TSM Home directory.
1. Redirecting batch output.
a. Right-click the shortcut used to start TSM, and select “Properties”.
b. Edit the “Target” field, and enter “ >messages.txt ” at the end of the
line.
c. Click OK.
This directs Ox messages to the file messages.txt in the Start-in directory. Any
other suitable file name can be substituted.
This would be an ideal scheme to implement routinely, but unfortunately, Windows
XP (SP1 and SP2) contains a bug (see Microsoft Knowledge Base, Article 886659)
that can cause an unpredictable lock-up of the redirection file. TSM then cannot be
started, without either rebooting, or designating a different redirection file. The only
way to see if your system is affected by this problem is to try it. However, since the
28
James Davidson 2015
problem appears not to arise immediately, this is probably the quickest way to get
specific diagnostic information. Remember to remove the redirection switch if it
causes a problem.
2. Running in a DOS Console
a. Use a text editor to create a batch file in the Start-in directory called (say)
start_tsm.bat.
b. Enter the lines
cd [start-in]
[ox-home]\packages\tsmod4\tsmod_runsc.bat [oxhome]\bin [start-in]
Here, [ox-home] and [start-in] stand for the Ox home directory and
Start-in directory paths, as entered during the installation sequence.
c. Open a “DOS box” (Start / Run / Cmd, or go to Command Prompt in the
Programs / Accessories menu).
d. At the prompt, enter the commands
[start-in]\start_tsm.bat
This starts TSM normally, and any Ox messages will appear in the console window.
(Note: simply executing the batch file by double-clicking it in Windows Explorer also
launches the program, but in this case the console window shuts on exit, so cannot
relay error messages.)
3. Running under OxEdit
a. Install Ox as an OxEdit module, if this has not already been done. Go to View /
Preferences / Add Predefined Modules, and choose Ox.
b. Choose View / Preferences / Add/ Remove Modules, and highlight &Ox in the
list.
c.
Edit the “Arguments” field to read -s6000,6000 "$(FilePath)"
d. In the “Initial Folder” field, enter the path to the Start-in directory.
e. Close the dialog.
f. Load the file tsmod_run.ox from the Start-in directory, and launch it by
choosing Modules / Ox.
Messages from Ox, including compilation and execution error messages, are printed
in the OxEdit window.
Note on GiveWin/OxMetrics
In principle TSM can also be run from GiveWin/OxMetrics, using OxRun, but this mode
of operation is not recommended, because the GUIs of each program do not co-exist very
happily. However, GiveWin/OxMetrics is an excellent tool for organizing your data, and
its .in7 format can be read by TSM. It can also be used for graphics processing. The
OXDRAW compiler directive allows TSM to write .gwg files. See Appendix B for details.
29
James Davidson 2015
Appendix D. Calling the Code from an Ox Program
TSM can be operated by a file of text commands, without loading the GUI. Most
features, including graphics, are currently available in this mode. The following shows a
typical run file.
#import <packages/tsmod4/tsmknl4>
Text_Input()
{
PRINT_RESULTS = 1;
INPUT_FILE = "data.xls";
SERIES = "Garch";
INTERCEPT1 = 1;
IS_ARFIMA = 1;
AR_ORDER = 1;
MA_ORDER = 1;
IS_GARCH = 1;
GARCH_AR_ORDER = 1;
GARCH_MA_ORDER = 1;
}
main()
{
Set_Defaults();
Text_Input();
Run_Estimation();
}
TSM command variables (upper case) are globally defined, and can appear anywhere in
the program. See the document TSM4 Programming Reference (tsmod4prg.pdf) for
a full description.
Since TSM is a big program, a command line switch is needed to reserve more memory
than the default. To run your program from OxEdit, first do the following.
1. Choose Tools / Add/Remove Modules…
2. Select the entry &Ox
3. Edit the ‘Arguments’ field to read
-s6000,6000 "$(FilePath)"
(In other words, add the “-s6000,6000” switch at the beginning of the entry.)
4. Close the dialog. This setting will be remembered by the OxEdit installation.
This operating mode can be used in case the GUI installation does not work satisfactorily
on certain systems. It only requires a working Ox installation to run. However, its most
important application is to allow TSM to be used as a programming module. The
estimation results can optionally be accessed within the user’s program, instead of being
written to the console.
The program has commands to create batch jobs automatically for estimation runs and
Monte Carlo experiments. This facility allows large jobs to be run concurrently, while
keeping the GUI free for other tasks. Studying the Ox files created by these commands
may also be helpful in learning how to create more elaborate programs.
30
James Davidson 2015
Appendix E. Saving and Loading Batch Settings in the GUI
The program settings in GUI mode are saved by default into a file with extension “.tsm”,
but this file is only readable by the program. To save the current settings (except defaults)
into a text file, in a format suitable for creating the equivalent batch job as in Appendix
D, use the TSM command File / Settings / Display/Save Text… This command allows
creation of a text file whose contents has the format of the function Text_Input(). As
well as providing a quick way to set up a batch job, this is much the easiest way to learn
to program using the TSM scripting language. Set up a job interactively in the GUI, and
then write out the batch settings that correspond to it. An alphabetical index of TSM
commands can be found in the Programming Reference.
The file created by File / Settings / Settings as Text / Display/Save Settings has the
following structure. First, the program options, as defined in Programming Reference
Sections 2-4 and 6-8 are listed in alphabetical order for easy reference. Note that all
options not appearing explicitly in the file have their default values. Next, the parameter
values and associated flags, bounds and constraint values are listed, as described in
Programming Reference Section 5. Note that the latter items are not sorted alphabetically,
but are listed in the order given in the Programming Reference. Also note that stored
models are not saved. To save a stored model in text form, first load it in the Setup /
Model Manager dialog, then save it to an identified text file using the command File /
Settings / Settings as Text / Save Current Model…. Use a name such as “Model*.txt”
where * is the model identifier.
To use these exported settings in an Ox program calling the TSM kernel, as described in
Appendix D, simply copy the contents of the file to the clipboard, and paste the lines into
the .ox file between the braces of the Text_Input function. The order of the
statements is arbitrary. However, an even simpler method is to create the function
Text_Input(){ #include "settings.txt" }
The #include statement inserts the contents of the named text file into the program at
run time. The path to the file should also appear if the file is not located in the working
directory.
The settings contained in the Text_Input() function can also be loaded into the GUI,
so that a prepared batch job can be run and modified interactively. To do this, all that is
necessary in Windows is to create a file such as "settings.txt", as above, give the
TSM command File / Restart / Load Text Input, and select the prepared file in the file
dialog. The actions carried out by this command (which can also be performed
manually) are to edit the executable file tsmod_run.ox to include the following lines:
#define TEXT_INPUT
#import <packages/tsmod4/tsmgui4>
Text_Input(){ #include "settings.txt" }
The compiler switch #define TEXT_INPUT instructs the program to read the
settings. After restarting TSM, the file is edited again to remove the extra lines.
Note, if performing this operation by hand (e.g. in Linux) that the #define statement
must precede the #import statement, and the function should follow it similarly.
Note: the run ID counter can be reset by including the line
RUN_ID = [value];
31
James Davidson 2015
where the value is any nonnegative integer. (Use the special settings pull-down menu in
Options / General to change the counter interactively.)
To load two or more models in this manner, where each has been saved to its own text
file, it will be necessary restart the program for each one. The model listed in the file
tsmod_run.ox will be read in as the “current” settings, and can then be stored under
the desired name in the Setup / Model Manager dialog.
32
James Davidson 2015
Appendix F. Using TSM in the Classroom
This appendix draws attention to the program features which may be of special use when
using the program for teaching. Please see the Users’ Manual for further details of all
these features.
Installation and Use
TSM licence information is stored in a file called “registration.txt” in the TSM
installation directory (or home folder, for users who do not have write permissions there).
To licence a copy on a workstation, an alternative to typing in the username and key at
each installation is to copy this file, once created, directly into the TSM directories of
each installation. This is the natural procedure when installing centrally over a network.
If a licence file (“registration.txt”) is present in the user’s home folder (work folder), it
will take priority over the installed licence, and this name will be displayed at start-up.
This makes it easy for a user to run the program using their personal licence, in case all
the copies covered by the site licence are in use.
Linear Regression Mode
Uncheck Options / General, "Enable Optimization Estimators", and then restart the
program. This option suspends the nonlinear optimization features that are used chiefly
by more advanced practitioners. The "Running Man" and "Space Shuttle" buttons are
hidden and unnecessary dialogs disabled. This turns TSM into a simple regression
package and (hopefully) makes navigating the interface easier and less confusing for
beginners. Only numerical optimization features are disabled, which includes all
maximum likelihood options. The bootstrap and Monte Carlo options are all still
available.
Simplified Output
The log-likelihood and information criteria, residual higher moments and Jarque-Bera
statistic, and Q statistics, are all optional outputs, although enabled by default. See the
Options / Tests and Diagnostics dialog. The minimal output consists of the regression
coefficients, sum of squares, R 2 , and residual standard deviation.
Easy Equation Graphics Display
The “double chart” button on the toolbar shows, by default, the time plots of actual and
fitted values and residuals. The option “Extended Actual-Fitted-Residual Plots”, set in
Options / Graphics, includes the actual-fitted scatter plot and the histogram and kernel
density of the residuals distribution. These plots are also available as items on the
Graphics menu, but this option places them all together in a way the student can access
easily.
Distributing Class Exercises
The teacher can prepare a class exercise in the following way.
Read in a data set (or generate an artificial one using the simulation module); set up one
or more model specifications and store these in Model Manager; and also set other
program options, such as the display options described above. Then, give the command
33
James Davidson 2015
File / Settings / Export…, and assign an identifying name to the file. This command
creates a file with .tsm extension, in which all the data and settings are bundled. It is
also portable, since it contains no local path information. (Local paths are stored by the
command File / Settings / Save…, note.)
Distribute the file to the class, with instructions to copy it to a working directory in their
personal documents folder or network space. It should have a red TSM icon when TSM is
installed. Double-clicking on the file in Windows Explorer starts the program with all the
stored settings. The stored data are automatically written to a file in the selected
spreadsheet format, and model settings and outputs are likewise automatically written to
files with .tsd extensions. Paths to file locations within the original home folder are
recreated, relative to the new home folder, in the installed location. Hence, data, model
files and results can be organized into folders. However, any data stored outside of the
home folder in the original location are placed in the home folder in the new location.
If students change the settings and create their own models, these are saved automatically
in the files “settings.tsm”, and .tsd files for each model. Full estimation outputs,
including generated series, graphs, and (optionally) data and displayed results can be
stored as named “models” in the Model Manager. If they wish, students can also bundle
and save these items for future reference, using the Export feature.
Maintaining and Upgrading TSM
A current feature of TSM is fairly frequent upgrades and new releases. (One day it may
settle down and stop developing, but that has not happened quite yet.) This can be a
nuisance for network managers.
However, once the program is installed, upgrading is only a matter of copying code and
documentation files to the TSM home directory. It is easy to modify the TSM start-up
script (batch file) to check for updated files on a central server and download these as
required, as part of the start-up sequence.
For example: after setting the required write permissions, edit the file “tsmod_runsc.bat”
and add lines at the top, similar to the following:
net use y: \\server\tsmod
xcopy /q /d /s /y /z y:\*.* c:\Progra~1\OxMetrics5\Ox\packages\tsmod4
Here, “server” is the name of the central server, and “tsmod” should be replaced by the
path to the TSM file store. The assigned drive letter should also be set as required.
Upgrading a network installation is then a simple matter of copying the new files to the
central server, either from the zip download or from an installation that has been updated
by the “tsm...setup.exe” download.
34
James Davidson 2015
Appendix G. Using Empirical Distribution Functions
TSM can both create and use distributions in the form of cumulative frequency tables,
for calculating test critical values and p-values. These tables are stored in spreadsheet
files. If tables for the same statistic in different sample sizes are created, they will be
interpolated to give an approximate p-value appropriate to the actual sample size; see the
main TSM document, Section 13.3, for details of the method.
Creating EDFs
The usual method of creating an EDF is by a Monte Carlo experiment to simulate the
distributions of statistics under the null hypothesis.
There are two ways to have TSM make an EDF file from Monte Carlo data. Checking the
box “Save EDFs” in the Setup / Monte Carlo Experiment dialog will result in the raw
cumulative frequency tables being written after each run, with names of the form
EDF_Run##.[ext]. Alternatively, a more flexible approach is to open the Graphics /
Monte Carlo Distributions dialog after the run is completed. Pressing the “Make EDF
File” button opens the file dialog to save the EDF file, which will contain tables for all
the statistics simulated in the experiment.
The empirical distributions can be plotted in this dialog as frequency histograms with a
superimposed kernel estimate of the density. Adjust the kernel bandwidth using the
scrollbar, re-displaying the plot to see the result. It is (the cumulated forms of) these
kernel estimates which are used to create the EDF, so check and adjust as necessary all
the tabulations, before creating the file.
EDF files created for the same statistics with two or more sample sizes can be merged
into a single file. A file on disc may be merged with the table in memory using the
command Files / Data / Tabulations / Merge EDF File. The resulting combined file is
optionally saved under a name supplied by the user, otherwise under the name of the file
in memory.
Notes:
1. Remember that Monte Carlo distributions are stored, along with the other results,
under the data generation model for the experiment. To get access to the required
tables, load this model in Model Manager. Don’t use the model for further
experiments (i.e., save it under a different name before re-using the original) if you
want to keep the associated tabulations, which are stored in the associated .tsd file.
2. It’s a recommended practice to prefix the names of EDF files with “EDF_”, to
distinguish them from other spreadsheets.
3. The files created as described contain EDFs for all the eligible tabulations, that is, tvalues and test statistics, although not the estimators in non-normalized form. If any
of these tables are not required, the columns should be manually deleted from the file,
either using a spreadsheet program, or by loading the file into TSM as data and using
the “Save Selected” command in Setup / Data Transformation and Editing / Edit.
4. Setting the kernel bandwidth to 0 yields the ‘raw’ table, in other words, the cumulated
histogram. This is also the form of the distribution that is saved by checking the
“Save EDFs” box in the Monte Carlo dialog. There are no established results to
indicate what degree of smoothing gives the best approximation to the tail areas of the
true distribution. This must be a matter for the user’s judgement. There is no
35
James Davidson 2015
substitute for increasing the number of Monte Carlo replications to estimate a
distribution more accurately.
5. It is not possible to change the smoothing of a distribution once it is saved in EDF
format. Hence, if in doubt, retain the original tables as described in 1.
6. Results for different tests also be combined using the merge command. This happens
automatically if the test names and identifiers do not match up across the files.
Using EDFs for inference
Load an EDF file into memory with the command File / Tabulations / Load EDF File.
The loaded file can be used to calculate individual p-values and critical values, and also
to create density plots, in the Setup / Look Up Tail Probability and Setup / Look Up
Critical Value dialogs.
To use the tabulations for model inference, check the box “Use EDFs from File for pValues” in the Options / Tests and Diagnostics dialog. Then, if an EDF file is loaded, and
also contains a name and identifier matching the model to be estimated, the tabulation is
used to calculate p-values. Otherwise the conventional tabulation is used. It is ultimately
the user’s responsibility to be sure that the correct table is used for each test.
The EDF data resident in memory when a model is stored in Model Manager are stored in
the associated .tsd file with the other model information, and reloaded when the model
is loaded. The original file does not need to be present, once the data are associated with
a model in this way.
If more than one sample size is tabulated for a statistic, the tables are interpolated to give
the best approximation for the actual estimation sample; see the main TSM document
Section 13.3 for details.
EDF File Format
It is possible to create EDF files by hand, using data from different sources. The format
(completely revised in Version 4.24) allows the EDF file to contain any number of
columns, in any order, each representing the distribution (or distributions, given two or
more sample sizes) for a statistic. The format of a column is as follows.
The first five rows contain identifying information for the statistic:
Row 1: Name for parameters and test statistics (character string).
Row 2: Test type.
0 for t value of a model parameter
1 for a test statistic (whole model, including user-coded statistics)
2 for a diagnostic test statistic for equation residuals.
In multi-equation models, 2 denotes the diagnostics for Equation 1. In addition,
3 for diagnostic test statistic for Equation 2 residuals,
etc., etc.
That is, there are M+2 possible values for an M-equation model.
Row 3: Test identifier (see Notes).
Row 4: Test parameter (degrees of freedom, or other).
Row 5: S 1, the number of sample sizes for this statistic.
Then follow S blocks of rows. The within-block row values are as follows.
Row 1: R = number of rows in this block
36
James Davidson 2015
Row 2: Sample size
Row 3: 0 (reserved for future use.)
Row 4: Minimum bin value. (L)
Row 5: Bin width. (B)
Row j for j = 6,...,R + 5; cumulative frequencies up to and including bin value L +
(j6)*B.
Notes:
1. The test identifiers for parameter t-values are the numbers used to identify the
parameters in the Values dialogs. There must be a match between these identifiers
and the parameter names appearing in the name field, otherwise no EDF p-value is
returned (the conventional t-table is used). This minimizes (though does not
eliminate!) the possibility of inadvertently using the wrong table for a test.
2. Identifiers for the diagnostic tests and test statistics are in most cases the numbers
given in Tables 1 and 2 in the programming manual. The exception is the case of
user-programmed tests, which are given the numbers 1, 2, etc. This is with a view
to backward compatibility, since additional tests may be added to the list in future
program releases. Thus, “1” is interpreted as “the highest number on the list in Table
2”, which in the current version of the program is 23.
3. The interpretation of the test parameter depends on the case, but in most cases it is the
degrees of freedom of the test, or number of restrictions. If it is not used, or has a
default value, as in the case of t ratios, it is assigned the value zero. If non-zero, the
value is appended to the statistic name in Row 1, enclosed in square brackets.
4. Different numbers of bins are permitted for different tests and different sample sizes.
5. This file format must be followed exactly, or else the file cannot be loaded!
37
James Davidson 2015
Appendix H. Running TSM in the Condor environment.
Condor is a High Throughput Computing (HTC) system that currently runs on a number
of university networks around the world. It allows a program to be launched from a
Condor-enabled workstation to be run on another workstation on the network that is
currently idle, and the outputs from the run returned to the originating machine “as if” it
had been run locally. TSM exploits the implied availability of multiple processors by
allowing Monte Carlo experiments to be split into multiple small instances, to be run in
parallel. The results from these are aggregated automatically by TSM, to be presented as
the results of a single large experiment. The User’s Manual gives details.
The implementation of Condor in TSM uses the TSM facility to create a free-standing Ox
source file, with extension .ox, that can be compiled with the TSM code. This source
file contains the model specifications set up interactively by the user in TSM, using
TSM’s scripting language, and calls the various functions to run the job; either an
estimation run, or a Monte Carlo experiment. Running the Ox executable oxl.exe from
the command line, with this file as its argument, runs the estimation or simulation job
exactly as if the “Run” button had been pressed in the TSM GUI. In the basic single-run
implementation, the results are returned as a text file that can be loaded for viewing in the
TSM results window. When parallel instances of a Monte Carlo experiment are run for
subsequent aggregation, the results are returned as a group of files in special format, with
the .tsd suffix, which the user must load into the program for aggregation and display.
A note about Condor terminology. A group of jobs that is launched as a single
submission to Condor is known to Condor as a cluster. The individual jobs in a cluster
are known to Condor as processes. This is slightly confusing, since the term cluster is
also commonly used to describe a group of linked computers on a network. In the case of
TSM, we refer to the “instances” of a TSM “run”. Every Condor job is identified by a
cluster number, but please note that this is different from the “Run ID” number assigned
by TSM. However, the Condor process numbers do match the TSM instance numbers,
which run from 0 to N1 when there are N instances.
This appendix gives details about running Condor on a Windows network, on which we
have gained experience. Condor is implemented under other operating systems and could
certainly be used in conjunction with TSM under Linux, but we cannot give specific
advice about this, at this time. Later, hopefully.
Installing TSM for Condor
To enable Condor in a TSM installation, some changes must be made to the header file
tsmgui4.h, as follows.
1. In tsmgui4.h, uncomment the line #define CONDOR.
2. If the operating system variant installed on the machines of the Condor cluster is
different from that on the machine running TSM, this information must be provided
to the system. In tsmgui4.h , edit the line
CondorNetOS() {return "";}
so that the returned string identifies the operating system. The codes are listed in
Appendix A of the Condor manual, under ‘OpSys’ in the section headed ‘Machine
ClassAd Attributes’. For example, in Condor 7.8.1 the string is "WINDOWS", for any
version of Windows. The returned string can be replaced by an array of strings if
38
James Davidson 2015
more than one operating system is represented in the cluster (older versions of
Condor needed to distinguish XP, Vista, W7 and so forth).
3. If the system architecture of the machines of the Condor cluster is different from that
on the machine running TSM, this information must also be provided. In
tsmgui4.h , edit the line
CondorNetArch() {return "";}
The codes are listed in Appendix A of the Condor manual, under ‘Arch’ in the section
headed ‘Machine ClassAd Attributes’. In Condor 7.8.1 the supported options are the
default "INTEL", and “X86_64”. Typically, this setting will need to be changed
from the default when the user’s machine has 64-bit architecture and the machines of
the Condor cluster are 32-bit.
4. Depending on the installation, it may be necessary to run one or more programs as a
preliminary to launching a Condor job. Enter the required commands in a Windows
batch file called condor_init.bat, located in either the working directory or the
TSM installation directory. This file, if it exists, will be run automatically prior to
launch.
A possible requirement under item 4 is to ‘wake up’ a cluster of machines from powersaving mode. Consult your network administrator about these requirements.
How Condor Works
Various configurations of the Condor system exist for different roles. This paragraph
explains how Condor is implemented from the standpoint of TSM. There are three steps:
1. All the files needed to run an Ox job, including Ox executables, the Ox source file for
the job, and the data file, are copied from the local machine to the Condor server.
TSM automates the launch procedure by creating a ‘submit description file’ called
condor_submit.txt, which lists the required files and their locations, and
contains other instructions for the run, such as the executable to be run, the argument
list, and so on.3
2. The Condor server finds a workstation on the network to run the job, sets it up there
and launches it. Periodic snapshots of the machine’s state are recorded. If another
user interrupts the run by pressing a key or clicking the mouse at the target
workstation, Condor suspends the job, moves it to another free workstation, and
resumes execution at the point of the last recorded snapshot.
3. The output files written by Ox are written to your working directory, appearing
exactly as if you had run the job locally. Optionally, an email is sent to the user to
notify completion of the job. For Monte Carlo jobs in parallel, these outputs are
special data files with the .tsd extension. When all the parallel instances have
returned their outputs, the “Results” button in the TSM Monte Carlo dialog can be
used to load these files, aggregate the results and display them as the output of a
single experiment.
3
View this file after submitting a job, to see how installation settings 2 and 3 above are passed to Condor
as assignments to the Boolean requirements variable.
39
James Davidson 2015
Command Line Interactions
To interact directly with Condor, open a DOS box. This can be done by choosing
“Command Prompt” from the Windows Accessories menu, or by clicking “Start”, then
“Run”, and entering CMD in the “Open:” field.
The following are the basic commands to control and get information from Condor. Type
them on the command line and press Enter. For more information on these and the other
available commands, see the Condor user’s manual, downloadable from
http://www.cs.wisc.edu/condor/
condor_status
Displays a list of the machines available to take Condor jobs, and
their status. Machines don’t appear on the list if they are switched
off or in power-saving mode.
condor_q
Shows the status of the currently submitted jobs, and their status.
When a job is terminated, it disappears from the list. By default the
command shows just the jobs run under your username. To see all
the jobs currently queued on the system, append the argument –g
to the command.
condor_rm
This command terminates running Condor jobs. Append the cluster
number as an argument to the command to remove a particular
cluster, or –all to clear all your jobs.
condor_release Releases jobs in “Held” mode. To remove such jobs from the
system, run this command first, appending the cluster number, or
–all.
condor_submit
The command to launch a job, or a set of parallel jobs. It must be
followed on the line by the name of the submit description file,
which by default, in TSM, is condor_submit.txt.
Normally there is no need to give the condor_submit command by hand, since TSM
performs this step automatically after creating the submit description file. However, jobs
can be deferred to be run manually, and of course Condor can also be used independently
of TSM, to run other programs. To check out the syntax of the submit description files,
inspect condor_submit.txt as created by TSM. A copy can be found in the
working directory, following a run.
Special Settings
The Special Settings pull-down menu in the Options / General dialog contains four
interactive settings that are visible when Condor is enabled. These specify commands
appearing in the condor_submit.txt file. They are:
“Condor Notification”
Sets the conditions for notification of job status by email.
“Condor Email”
Email address for notification.
“Condor Output Files”
If TRUE, the contents of standard output are returned in a file.
“Condor Log Files”
If TRUE, a log file is returned.
40
James Davidson 2015
Appendix I. Tables for Nonstandard Tests
I. QUANTILES OF THE DICKEY FULLER DISTRIBUTION (prob. of a smaller value)
The three cases are: = raw data, = mean fitted, = mean and trend fitted
P( < v)
.01
.025
.050
.100
.90
.95
.975
.99
-2.58
-2.23
-1.95
-1.62
0.89
1.28
1.62
2.00
-3.43
-3.12
-2.86
-2.57
-0.44
-3.96
-3.66
-3.41
-3.12
-1.25
-0.07
-0.94
0.23
0.60
-0.66
-0.33
II. ASYMPTOTIC CRITICAL VALUES FOR ADF AND PHILLIPS-PERRON COINTEGRATION
TESTS (MacKinnon 1991, Table 1)
See original table for small sample corrections.
Intercept
P( < )
Intercept and Trend
.10
.05
.01
.10
.05
.01
No Regressors
-2.5671
-2.8621
-3.4335
-3.1279
-3.4126
-3.9638
1 Regressor
-3.0462
-3.3377
-3.9001
-3.4959
-3.7809
-4.3266
2 Regressors
-3.4518
-3.7429
-4.2981
-3.8344
-4.1193
-4.6676
3 Regressors
-3.8110
-4.1000
-4.6493
-4.1474
-4.4294
-4.9695
4 Regressors
-4.1327
-4.4185
-4.9587
-4.4345
-4.7154
-5.2497
5 Regressors
-4.4242
-4.7048
-5.2400
-4.6999
-4.9767
-5.5127
IV. RS TEST: QUANTILES OF THE DISTRIBUTION FV(v) (A. W. Lo 1991, Table II)
P(V < v)
.005
.025
.050
.100
.200
.300
.400
.500
v
0.721
0.809
0.861
0.927
1.018
1.090
1.157
1.223
P(V < v)
.543
2
.600
.700
.800
.900
.950
.975
.995
1.294
1.374
1.473
1.620
1.747
1.862
2.098
v
41
James Davidson 2015
IV. UPPER TAIL CRITICAL VALUES FOR ˆ & ˆ (Kwiatkowski et al. (1992) Table I)
: Upper tail percentiles of the distribution of
1
V (r ) dr
2
0
Critical level
.10
.05
.025
.01
Critical value
0.347
0.463
0.574
0.739
: Upper tail percentiles of the distribution of
1
V (r ) dr
0
2
2
Critical level
.10
.05
.025
.01
Critical value
0.119
0.146
0.176
0.216
V. NYBLOM-HANSEN TEST CRITICAL VALUES (from Hansen, 1990)
P(LC > )
# Parameters
.2
.1
.075
.05
.025
.01
1
2
3
4
5
6
7
8
9
10
11
12
13
14
15
16
17
18
19
20
.243
.469
.679
.883
1.08
1.28
1.46
1.66
1.85
2.03
2.22
2.41
2.59
2.77
2.95
3.14
3.32
3.50
3.69
3.86
.353
.610
.846
1.07
1.28
1.49
1.69
1.89
2.10
2.29
2.49
2.69
2.89
3.08
3.26
3.46
3.64
3.83
4.03
4.22
.398
.670
.913
1.14
1.36
1.58
1.78
1.99
2.19
2.40
2.60
2.81
3.00
3.19
3.38
3.58
3.77
3.96
4.16
4.36
.470
.749
1.01
1.24
1.47
1.68
1.90
2.11
2.32
2.54
2.75
2.96
3.15
3.34
3.54
3.75
3.95
4.14
4.33
4.52
.593
.898
1.16
1.39
1.63
1.89
2.10
2.33
2.55
2.76
2.99
3.18
3.39
3.60
3.81
4.01
4.21
4.40
4.60
4.79
1, .748
1.07
1.35
1.60
1.88
2.12
2.35
2.59
2.82
3.05
3.27
3.51
3.69
3.90
4.07
4.30
4.51
4.73
4.92
5.13
42
James Davidson 2015
VI. F* CRITICAL VALUES (from Kiefer and Vogelsang, 2002b)
P(F* < )
90%
95%
97.5%
99%
1
14.28
23.14
33.64
51.05
2
17.99
26.19
35.56
48.74
3
21.13
29.08
37.88
51.04
4
24.24
32.42
40.57
52.39
5
27.81
35.97
44.78
56.92
6
30.36
38.81
47.94
60.81
7
33.39
42.08
50.81
62.27
8
36.08
45.32
54.22
67.14
9
38.94
48.14
57.47
69.67
10
41.71
50.75
59.98
72.05
11
44.56
53.7
63.14
74.74
12
47.27
56.7
65.98
78.8
13
50.32
60.11
69.46
82.09
14
52.97
62.83
72.46
85.12
15
55.71
65.74
75.51
88.86
16
58.14
68.68
78.09
91.37
17
60.75
70.59
80.94
94.08
18
63.35
73.76
83.63
97.41
19
65.81
76.42
86.2
99.75
20
68.64
79.5
89.86
103.2
21
70.8
82
92.32
105.4
22
73.41
84.76
94.54
108
23
76.19
87.15
98.06
111.8
24
78.4
89.67
100.4
114.7
25
81.21
92.7
103.5
117.6
26
83.59
95.49
106.6
120.8
27
85.83
97.57
108.8
123.4
28
88.11
99.48
110.7
124.5
29
90.92
102.9
114.6
129.6
30
93.63
105.8
117.5
132.1
# Restrictions
43
James Davidson 2015
VII. STRUCTURAL CHANGE TEST CRITICAL VALUES (from Andrews 1993)
π0
0.5
0.49
0.48
0.47
0.45
0.4
0.35
0.3
0.25
0.2
0.15
0.1
0.05
π0
0.5
0.49
0.48
0.47
0.45
0.4
0.35
0.3
0.25
0.2
0.15
0.1
0.05
π0
0.5
0.49
0.48
0.47
0.45
0.4
0.35
0.3
0.25
0.2
0.15
0.1
0.05
1
1.08
1.17
0.27
1.49
2.25
3.45
5.44
9
16
32.11
81
361
10%
2.71
3.47
3.79
4.02
4.38
5.10
5.59
6.05
6.46
6.80
7.17
7.63
8.19
1
1.08
1.17
0.27
1.49
2.25
3.45
5.44
9
16
32.11
81
361
10%
7.78
8.93
9.42
9.82
10.35
11.39
12.1
12.8
13.36
13.82
14.31
14.94
15.62
1
1.08
1.17
0.27
1.49
2.25
3.45
5.44
9
16
32.11
81
361
10%
12.02
13.27
13.92
14.32
14.97
16.23
17.09
17.74
18.38
19.04
19.69
20.32
21.02
p=1
5%
3.84
4.73
5.1
5.38
5.91
6.57
7.05
7.51
7.93
8.45
8.85
9.31
9.84
p=4
5%
9.49
10.63
11.17
11.63
12.27
13.32
14.12
14.79
15.34
15.84
16.45
16.98
17.56
p=7
5%
14.07
15.52
16.14
16.63
17.38
18.41
19.34
20.01
20.63
21.07
21.84
22.51
23.22
1%
6.63
7.82
8.26
8.65
9.00
9.82
10.53
10.91
11.48
11.69
12.35
12.69
13.01
10%
4.61
5.42
5.8
6.12
6.6
7.45
8.06
8.57
9.1
9.59
10.01
10.5
11.2
1%
13.28
14.64
15.17
15.91
16.64
17.66
18.54
19.1
19.78
20.24
20.71
21.04
21.54
10%
9.24
10.39
10.96
11.4
12.05
13.09
13.86
14.58
15.17
15.63
16.2
16.87
17.69
1%
18.48
19.93
20.64
21.14
22.32
23.35
24.1
24.86
25.11
25.72
26.23
26.91
27.53
10%
13.36
13.29
13.89
14.43
15.05
16.26
17.06
17.9
18.61
19.17
19.82
20.45
21.23
44
p=2
5%
5.99
6.86
7.31
7.67
8.11
9.02
9.67
10.19
10.75
11.26
11.79
12.27
12.93
p=5
5%
11.07
12.28
12.88
13.27
14
15.16
15.93
16.48
17.25
17.88
18.35
18.93
19.61
p=8
5%
15.51
15.63
16.31
16.74
17.53
18.73
19.46
20.36
20.95
21.47
22.13
22.87
23.6
1%
9.21
10.3
10.71
11.01
11.77
12.91
13.53
14.16
14.47
15.09
15.51
16.04
16.44
10%
6.25
7.19
7.64
7.98
8.50
9.46
10.16
10.76
11.29
11.8
12.27
12.81
13.47
1%
15.09
16.34
16.83
17.32
18.06
19.23
19.99
20.67
21.39
21.9
22.49
23.34
24.18
10%
10.64
11.81
12.42
12.9
13.53
14.71
15.56
16.32
17
17.56
18.12
18.78
19.49
1%
20.09
20.53
21.14
21.72
22.28
23.63
24.64
25.64
26.1
26.76
27.25
27.69
28.77
10%
14.68
16.17
16.82
17.26
18.1
19.56
20.49
21.27
21.93
22.54
23.15
23.77
24.64
p=3
5%
7.81
8.83
9.29
9.62
10.15
11.17
12.05
12.58
13.16
13.69
14.15
14.62
15.15
p=6
5%
12.59
13.74
14.45
14.86
15.59
16.91
17.75
18.46
19.07
19.64
20.26
20.82
21.56
p=9
5%
16.92
18.56
19.25
19.74
20.59
22.12
22.93
23.65
24.31
24.91
25.47
26.16
26.94
1%
11.34
12.58
13.05
13.39
14.23
14.88
15.71
16.24
16.6
17.28
17.68
18.28
19.06
1%
16.81
18.32
19.12
19.64
20.45
21.6
22.33
23.06
23.65
24.27
24.79
25.21
25.96
1%
21.67
23.05
23.83
24.8
25.52
26.86
27.77
28.5
29.23
29.92
30.52
31.15
31.61
James Davidson 2015
π0
0.5
0.49
0.48
0.47
0.45
0.4
0.35
0.3
0.25
0.2
0.15
0.1
0.05
1
1.08
1.17
0.27
1.49
2.25
3.45
5.44
9
16
32.11
81
361
10%
15.99
17.35
18.08
18.67
19.39
20.74
21.87
22.73
23.32
24
24.62
25.39
26.24
π0
0.5
0.49
0.48
0.47
0.45
0.4
0.35
0.3
0.25
0.2
0.15
0.1
0.05
1
1.08
1.17
0.27
1.49
2.25
3.45
5.44
9
16
32.11
81
361
10%
19.81
21.05
21.87
22.46
23.31
24.91
26
26.95
27.64
28.36
29.13
30.01
30.9
π0
0.5
0.49
0.48
0.47
0.45
0.4
0.35
0.3
0.25
0.2
0.15
0.1
0.05
1
1.08
1.17
0.27
1.49
2.25
3.45
5.44
9
16
32.11
81
361
10%
23.54
25.32
26.22
26.83
27.75
29.34
30.56
31.56
32.33
33.21
33.9
34.72
35.81
p = 10
5%
18.31
19.79
20.35
20.92
21.78
23.15
24.17
25.05
25.8
26.42
27.03
27.87
28.63
p = 13
5%
22.36
23.73
24.53
25.24
25.95
27.56
28.77
29.7
30.48
31.1
31.8
32.62
33.42
p = 16
5%
26.3
28.17
29.05
29.73
30.59
32.28
33.4
34.41
35.19
35.95
36.66
37.48
38.51
1%
23.21
24.62
25.75
26.43
27.3
28.86
29.76
30.74
31.32
31.98
32.33
32.95
33.86
10%
17.28
18.65
19.4
19.94
20.7
22.24
23.25
24.19
24.82
25.41
26.14
26.86
27.91
1%
27.69
29.67
30.23
30.87
31.62
33.38
34.65
35.26
35.85
36.47
37.04
37.64
38.44
10%
21.06
22.52
23.45
24.09
24.98
26.46
27.52
28.41
29.31
29.98
30.67
31.48
32.48
1%
32
34.11
35.09
35.87
36.88
38.56
39.18
40.29
41.07
41.78
42.4
43.1
44.2
10%
24.76
26.77
27.65
28.16
29.14
30.82
31.96
32.99
33.85
34.53
35.39
36.19
37.24
45
p = 11
5%
19.68
21.02
21.81
22.36
23.27
24.95
25.93
26.71
27.43
27.93
28.55
29.21
30.15
p = 14
5%
23.68
25.17
26.11
26.75
27.65
29.2
30.3
31.08
31.83
32.65
33.45
34.22
35
p = 17
5%
27.58
29.72
30.58
31.25
32.18
33.74
34.86
35.83
36.71
37.49
38.12
39.05
40.05
1%
24.73
26.43
27.04
27.84
28.47
30.2
31.14
31.65
32.39
33.42
33.75
34.46
35.14
10%
18.55
20.27
21.01
21.54
22.42
23.81
24.8
25.63
26.37
27.08
27.74
28.47
29.31
1%
29.14
31.23
32.11
32.57
33.39
34.97
36.1
37.02
37.25
38.41
39.22
39.6
40.1
10%
22.31
24.3
25.13
25.65
26.59
28.21
29.23
30.21
30.93
31.68
32.51
33.28
34.25
1%
33.43
33.57
36.78
37.38
38.25
39.66
40.81
41.73
42.46
43.27
43.95
44.52
45.39
10%
25.99
27.85
28.76
29.32
30.38
32.11
33.4
34.33
35.27
36.07
36.85
37.64
38.68
p = 12
5%
21.03
22.7
23.54
24.08
24.99
26.26
27.45
28.18
28.98
29.61
30.16
30.88
31.76
p = 15
5%
25
26.93
27.82
28.42
29.25
31.07
32.11
32.8
33.65
34.41
35.06
35.76
36.74
p = 18
5%
28.87
30.79
31.57
32.24
33.17
35.1
36.23
37.09
37.94
38.77
39.55
40.38
41.36
1%
26.22
28.04
28.64
29.14
30.03
31.52
32.46
33.27
33.77
34.56
35.07
35.75
36.7
1%
30.58
32.73
33.55
34.08
35.16
36.59
37.32
38.28
38.93
40.07
40.56
41.28
42.05
1%
34.81
36.82
37.7
38.65
39.31
40.99
41.84
42.69
43.68
44.09
44.84
45.89
46.69
James Davidson 2015
π0
0.5
0.49
0.48
0.47
0.45
0.4
0.35
0.3
0.25
0.2
0.15
0.1
0.05
1
1.08
1.17
0.27
1.49
2.25
3.45
5.44
9
16
32.11
81
361
10%
27.19
29.36
30.18
30.87
31.95
33.54
34.71
35.72
36.6
37.47
38.36
39.16
40.27
p = 19
5%
30.14
32.4
33.2
33.86
34.82
36.53
37.79
38.77
39.75
40.43
41.25
42.01
43.05
1%
36.21
38.97
39.93
40.28
41.4
43.34
44.3
44.76
45.66
46.68
47.25
47.95
49.02
10%
28.41
30.44
31.39
32.01
33.09
34.78
36.04
37.04
37.92
38.97
39.96
40.74
41.83
p = 20
5%
31.41
33.56
34.62
35.12
36.41
37.93
39.21
40.25
40.98
41.9
43
43.76
44.52
1%
37.57
40.04
40.88
41.72
42.97
44.2
45.34
46.14
46.79
47.75
48.4
49.58
50.76
p = number of parameters.
Use the first column of the tables for the cases where the maximization interval bounds
(as proportions of sample size) are 0 and 1 0 , interpolating row values as required.
To approximate critical values for a test with lower bound 1 and upper bound 2 , compute
2 (1 1 )
1 (1 2 )
and find the nearest to this value in the second column of the tables, interpolating row values as
required.
46
James Davidson 2015