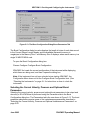
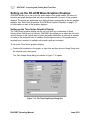
1
8001-ACM Rev 3.0 3DACM97 Configuration, Acquisition Software and Operating Manual for the 2D-ACM, 3D-ACM and 3D-ACM Wave June 2003 Falmouth Scientific, Inc. 1400 Route 28A Cataumet, MA 02534 Tel: (508) 564-7640 Fax: (508) 564-7643 Email: [email protected] FALMOUTH SCIENTIFIC, INC. i The information, descriptions and illustrations in this manual are the property of Falmouth Scientific, Inc. (FSI), and may be disclosed only to those persons or organizations specifically authorized by FSI. Duplication of any part of this manual is strictly prohibited unless authorized in writing by FSI. Table of Contents ii Falmouth Scientific, Inc. Limited Warranty ............................................................................v Liability ..................................................................................................................................v Falmouth Scientific, Inc. Return Procedure .......................................................................... vi Preface ................................................................................................................................ vii What’s in This Manual ......................................................................................................... vii System Configuration Requirements.................................................................................. viii Pull-Down Menus ............................................................................................................... viii Notes, Cautions and Warnings........................................................................................... viii Help ...................................................................................................................................... ix Customer Service ................................................................................................................. ix Unpacking the Instruments ...................................................................................................x Standard Items ......................................................................................................................x Optional Items ...................................................................................................................... xi Section 1: About 3DACM97 ............................................................................................ 1-1 3DACM97 Overview .......................................................................................................... 1-2 3DACM97 Compatible Processing Software ..................................................................... 1-3 The ACM Instruments ....................................................................................................... 1-4 Section 2: Installing and Starting 3DACM97 ................................................................. 2-1 Installing 3DACM97........................................................................................................... 2-1 Starting 3DACM97 ............................................................................................................ 2-4 Exiting 3DACM97 .............................................................................................................. 2-5 Uninstalling 3DACM97 ...................................................................................................... 2-5 Section 3: Windows and Commands ............................................................................ 3-1 The Main Window ............................................................................................................. 3-1 Menu Bar ........................................................................................................................... 3-2 Display Area ...................................................................................................................... 3-2 The Instrument Identification Window ............................................................................... 3-3 Section 4: Connecting the Instruments and Verifying Operation ............................... 4-1 The “Kick Start” Feature .................................................................................................... 4-1 The Test Cable and Power Supply .................................................................................... 4-1 Test Cable Connections .................................................................................................... 4-2 Power Supply Requirements ............................................................................................. 4-2 The Optional RS-485 Interface ......................................................................................... 4-2 Connecting the Instruments to Your Computer ................................................................. 4-4 When Using the Standard RS-232 Interface ..................................................................... 4-5 When Using the Optional RS-485 Interface ...................................................................... 4-5 Selecting a Different Serial Port and Baud Rate ............................................................... 4-6 Changing the Serial Port ................................................................................................... 4-6 Changing the Baud Rate ................................................................................................... 4-7 Verifying the Operation of the Instruments ........................................................................ 4-8 June 2003 3DACM97 Operating Manual iii Verifying the Operation of a 2D-ACM or 3D-ACM ............................................................. 4-8 Verifying the Operation of a 3D-ACM Wave .................................................................... 4-10 Checking and Saving the Calibration Constants To a File .............................................. 4-12 Loading the Calibration Constants from a Saved File ..................................................... 4-15 Section 5: Checking and Configuring the Instruments ............................................... 5-1 Checking the Instruments ................................................................................................. 5-1 Checking a 2D-ACM or 3D-ACM ....................................................................................... 5-1 Checking a 3D-ACM Wave ............................................................................................... 5-2 Checking the Instrument Automatically on Startup ........................................................... 5-3 Configuring a 2D-ACM or a 3D-ACM ................................................................................ 5-4 The Configure ACM Dialog Box ........................................................................................ 5-4 Selecting the Current Velocity and Optional Instantaneous Parameters ........................... 5-5 Selecting the Compass and Tilt Instantaneous Parameters ............................................. 5-8 Selecting Vector Averaged Current Velocity and Tilt ....................................................... 5-10 Setting the Run Times ..................................................................................................... 5-12 Setting Up Memory .......................................................................................................... 5-16 Reviewing the Statistics .................................................................................................. 5-17 Configuring a 3D-ACM Wave .......................................................................................... 5-21 The Average Configuration Dialog Box ........................................................................... 5-21 Selecting the Current Velocity, Pressure and Optional Instantaneous Parameters......... 5-22 Selecting the Compass and Tilt Instantaneous Parameters ........................................... 5-24 Selecting Vector Averaged Current Velocity and Tilt ....................................................... 5-26 The Burst Configuration Dialog Box ................................................................................ 5-28 Selecting the Current Velocity, Pressure and Optional Burst Parameters ....................... 5-29 Selecting the Compass and Tilt Burst Parameters .......................................................... 5-31 The Configure Time Dialog Box ...................................................................................... 5-33 Setting the Run Times and the Sampling Rate ............................................................... 5-33 Saving the Instrument Configuration to a File ................................................................. 5-37 Configuring an Instrument from a Saved File .................................................................. 5-38 Printing the Configuration File ......................................................................................... 5-39 Section 6: Deploying the Instruments ........................................................................... 6-1 Modes of Operation ........................................................................................................... 6-1 2D-ACM and 3D-ACM Modes of Operation ...................................................................... 6-2 3D-ACM Wave Modes of Operation .................................................................................. 6-2 Preparing the Instruments for Deployment........................................................................ 6-4 Preparing a 2D-ACM or 3D-ACM for Deployment ............................................................. 6-4 Preparing a 3D-ACM Wave for Deployment ..................................................................... 6-7 Changing the Mode of Operation .................................................................................... 6-10 Checking the Delayed Time and Date Settings ............................................................... 6-11 Section 7: Acquiring and Viewing Real-Time Data ....................................................... 7-1 Real-Time Acquisition Digital and Graphics Displays ........................................................ 7-1 Viewing the Digital Display and Saving Data from a 2D-ACM or 3D-ACM ........................ 7-2 Viewing the Graphics Display and Saving Data from a 2D-ACM, 3D-ACM or 3D-Wave .. 7-6 3DACM97 Operating Manual June 2003 iv Changing the Graphics Display Settings ........................................................................... 7-9 Changing the Velocity Display Settings ............................................................................. 7-9 Changing the Tilt Display Settings ................................................................................... 7-10 Changing the Speed and Direction Display Settings ....................................................... 7-11 Real-Time Acquisition 3D-ACM Wave Graphics Displays ............................................... 7-12 Viewing the Graphics Displays and Saving Data from a 3D-ACM Wave ........................ 7-12 The Time Series Graphics Display .................................................................................. 7-15 The Speed and Direction Graphics Display .................................................................... 7-15 The Progressive Vector Graphics Display ....................................................................... 7-16 The Distribution Graphics Display ................................................................................... 7-16 The Pressure Analysis Graphics Display ........................................................................ 7-18 The Wave Direction Graphics Display ............................................................................. 7-18 Setting up the 3D-ACM Wave Graphics Displays ........................................................... 7-20 Setting up the Time Series Graphics Display .................................................................. 7-20 Setting up the Speed and Direction Graphics Display .................................................... 7-21 Setting up the Progressive Vector Graphics Display ....................................................... 7-23 Setting up the Distribution Graphics Display ................................................................... 7-24 Setting up the Pressure Analysis Graphics Display ........................................................ 7-25 Setting up the Wave Direction Graphics Display ............................................................. 7-26 Section 8: Retrieving and Saving Data from the Instruments ..................................... 8-1 Retrieving and Saving data from a 2D-ACM or 3D-ACM .................................................. 8-1 Retrieving and Saving Data from a 3D-ACM Wave .......................................................... 8-5 Viewing the Data ............................................................................................................... 8-8 Section 9: Replacing the Battery Packs ........................................................................ 9-1 Degaussing a Battery Pack ............................................................................................... 9-1 Checking and Replacing a 2D-ACM Battery Pack ............................................................ 9-3 Checking and Replacing a 3D-ACM Battery Pack ............................................................ 9-6 Checking and Replacing a 3D-ACM Wave Battery Pack ................................................ 9-10 ADDENDUM A: 3DACM Status Command (STAT) ......................................................... A-1 Introduction ....................................................................................................................... A-1 Command Description ....................................................................................................... A-1 Kick Start Warning ............................................................................................................ A-2 June 2003 3DACM97 Operating Manual v Falmouth Scientific, Inc. Limited Warranty Falmouth Scientific, Inc. (FSI) guarantees its products to be free from defects in materials and workmanship for a period of one year from the date of shipment. In the event a product malfunctions during this period, FSI’s obligation is limited to the repair or replacement, at FSI’s option, of any product returned to the FSI factory. Products found defective should be returned to the factory freight prepaid and carefully packed, as the customer will be responsible for any damage during shipment. Repairs or replacements, parts, labor, and return shipment under this warranty will be at no cost to the customer. This warranty is void if, in FSI’s opinion, the product has been damaged by accident or mishandled, altered, or repaired by the customer, where such treatment has affected its performance or reliability. In the event of such mishandling, all costs for repair and return freight will be charged to the customer. All products supplied by FSI that are designed for use under hydrostatic loading have been certified by actual pressure testing prior to shipment. Any damage that occurs as a direct result of flooding is NOT covered by this warranty. If a product is returned for warranty repair and no defect is found, the customer will be charged a diagnostic fee plus all shipping costs. Incidental or consequential damages or costs incurred as a result of a product’s malfunction are not the responsibility of FSI. Equipment not manufactured by FSI is supported only to the extent of the original equipment manufacturer’s (OEM) original warranties. All OEM sensors that utilize electrodes (oxygen cartridges, pH, ORP, etc.) are warranted at the time of shipment, and shall perform upon initial installation within the OEM’s warranty, FSI will replace the product or defective part with a similar model, product or part, but only to the extent that the OEM warrants. All returned products must be accompanied by a Returned Material Authorization (RMA) number issued by FSI. Shipments without an RMA number will not be accepted. Liability FSI shall not be liable for incidental or consequential damages, injuries, or losses as a result of the installation, testing, operation, or servicing of FSI products. 3DACM97 Operating Manual June 2003 vi Falmouth Scientific, Inc. Return Procedure Before returning any equipment to FSI, you must contact FSI and obtain a Return Material Authorization (RMA) number. The RMA number assists FSI in identifying the origin and tracking the location of returned items. When returning items to FSI from outside the United States, follow the checklist presented below to prevent any delays or additional costs. ! Include with all shipments two copies of your commercial invoice showing the value of the items and the reason you are returning them. ! If the total value of the items is in excess of $1,000, include the following shippers oath with the invoices. (This can be typed on the invoices or on a separate letterhead.) I.___________, declare that the articles herein specified are the growth, produce, or manufacture of the United States; that they were exported from the United States from the Port of __________________, on or about __________________; that they are returned without having been advanced in value or improved in condition by any process of manufacture or any other means, that no drawback, bounty, or allowance has been paid or admitted thereof. Signed ____________________________ ! If there is more than one item per consignment, include a packing list with the shipment. It is acceptable to combine the commercial invoice and packing list with the contents of each carton, clearly numbered and identified on the commercial invoice. ! Consign all air freight shipments to Falmouth Scientific, Inc. in care of Air Sea Forwarders, 140 Eastern Avenue, Chelsea, MA 02150 ! If the items are the property of FSI, please insure them for their full value. ! Route via Logan International Airport only as the final destination. ! Mail or Fax one copy each of the invoice, packing list, and airway bill to FSI upon shipment. ! Refer to the FSI issued RMA number on all documents and correspondence. ! Prepay the freight. June 2003 3DACM97 Operating Manual vii Preface Congratulations on your purchase of an FSI precision oceanographic instrument. Founded in 1989, FSI has become an international leader in the development and manufacture of oceanographic instrumentation, including Conductivity/Depth/Temperature (CTD) profilers, acoustic current meters, high performance water samplers, and wave and tide instruments. FSI products provide the highest accuracy for your monitoring needs in environments ranging from estuarine to full ocean depth. What’s in This Manual This user manual provides information pertaining to the installation and operation of 3DACM97, a software program that configures and downloads data from FSI’s 2D-ACM, 3D-ACM and 3D-ACM Wave instruments and provides real time graphics displays. In addition, instructions are provided on how to connect, prepare for deployment and retrieve data from the instruments, and how to replace the battery packs. The manual is divided into the following nine sections: Section 1: About 3DACM97 describes the key features of 3DACM97 and the 2D-ACM, 3D-ACM and 3D-ACM Wave instruments. Section 2: Installing and Starting 3DACM97 provides installation and start-up procedures for getting 3DACM97 running on your computer, as well as procedures for exiting and uninstalling 3DACM97. Section 3: Windows and Commands describes the 3DACM97 windows and how to access menus and choose commands. Section 4: Connecting the Instruments and Verifying Operation provides instructions on how to connect the instruments to your computer and verify their operation. Section 5: Checking and Configuring the Instruments describes how to use 3DACM97 to check and configure the instruments. Section 6: Deploying the Instruments describes how to prepare the instruments for deployment. Section 7: Acquiring and Viewing Real-Time Data describes how to acquire data in real time while viewing and saving the data. Section 8: Retrieving and Saving Data from the Instruments provides instructions on how to retrieve and save data from the instruments’ internal memory. Section 9: Replacing the Battery Packs provides instructions on how to replace the instruments’ battery packs. 3DACM97 Operating Manual June 2003 viii System Configuration Requirements The system configuration required for 3DACM97 to operate properly includes the following: • Microsoft Windows 95®, Windows 98® or Windows NT® • A computer with an Intel 80486® or Pentium processor • Minimum 32 MB of RAM • A VGA monitor with 800 x 600 resolution • A CD-ROM drive • A hard disk with 10 MB free space Pull-Down Menus Like most programs, 3DACM97 uses pull-down menus, which are opened from the menu bar in the program’s Main window by pointing to the item with the mouse pointer and clicking the left mouse button. When the menu is open, you can select an item from it in the same manner. In many of the procedures presented in this manual, the ➤ symbol is used to represent a sequence of menu item selections. For example, “Choose File ➤ Open” means select File from the menu bar, and then choose Open from File menu when it opens. Notes, Cautions and Warnings Where applicable, notes, cautions and warnings are provided as follows: Note: Recommendations or general information that is particular to the material being presented or a referral to another part of this manual or to another manual. Caution: A statement that identifies a potential hazard that can be damaging to equipment, or a reminder that you are in danger of losing or misinterpreting data. Warning: A statement that identifies a potential hazard that could cause personal injury. June 2003 3DACM97 Operating Manual ix Help 3DACM97 provides on-line help, which can be accesed either from the menu bar by choosing Help ➤ Help, or by clicking Help from any open 3DACM97 dialog box. (See “SECTION 3: Windows and Commands,” for information on the Main window and how to access commands from the menu bar.) For information about 3DACM97, choose Help ➤ About. The About window opens, which provides important information about your version of 3DACM97: Customer Service FSI welcomes your feedback. Therefore, please contact FSI customer service to offer any comments or suggestions or to request technical support. FSI can be contacted using any of the following means: Mail Falmouth Scientific, Inc. PO Box 315 Cataumet, MA 02534 USA Email [email protected] Telphone or Fax Tel: (508) 540-7640 Fax: (508) 548-7643 3DACM97 Operating Manual June 2003 x Unpacking the Instruments Your 2D-ACM, 3D-ACM or 3D-ACM Wave is packed in a moisture proof, reusable case. Before opening the case, inspect it carefully for any signs of external damage. If the case appears damaged, report the damage to FSI and to the freight carrier. Caution: Report any damage to the freight carrier within 48 hours after receiving the shipment, as may carriers have time limits for reporting damage. To unpack the instrument: 1 Open the case and remove the contents. 2 Inspect all the items for damage. 3 If damage is evident, report the damage to FSI and to the freight carrier. 4 Compare the contents of the case and any other items in the shipment to the packing list and report any missing items to FSI. Battery pack is not installed in the instrument. See “SECTION 9: Replacing the Battery Packs,” for instructions on how to install and connect the battery packs. Standard Items The following standard items are included with each delivery: • The instrument • The 3DACM97 for Windows CD-ROM • Dummy connector • This manual • Reusable case Most of these items are shown, along with a typical setup of a 2D-ACM connected to a laptop computer, in Figure 4-2 on page 4-4. June 2003 3DACM97 Operating Manual xi Optional Items Optional items typically include the following: • Alkaline battery packs • Test cable • Power supply RS-485 Interface (includes Converter Box) • Service Manuals • Watertight case Some optional items with their corresponding FSI part numbers are listed below. (See “Customer Service” on page vii for information on how to contact FSI to order any of these items.) Optional Items ITEM FSI Part Number 2D-ACM 3D-ACM 3D-ACM Wave Test Cable 2ACM-CAB-TST 3ACM-CAB-TST 3ACM-CAB-TST Power Supply 2ACM-OP-PWR 2ACM-OP-PWR 2ACM-OP-PWR Alkaline Battery Pack 2ACM-OP-AB 3ACM-OPC-AB 3ACM-OPW-AB RS-485 Interface 2ACM-OP-485 3ACM-OP-485 3ACM-OP-485 0.5 MB Memory Upgrade 3ACM-OPC-MU 32 MB Memory Upgrade 3ACM-OPW-MU-32 Watertight Case 2ACM-OP-PSC 3ACM-OP-PSC 3ACM-OP-PSC 3DACM97 Operating Manual June 2003 1-1 Section 1: About 3DACM97 T he 3DACM97 configuration and acquisition software provides a convenient, user friendly means of configuring and acquiring data from FSI’s precision acoustic current meter (ACM) instruments. Data can be acquired in real time or downloaded from the instrument’s internal memory. And data acquired in real time can be viewed in real time on a digital or graphics display. The ACM instruments are the 2DACM Acoustic Current Meter, the 3D-ACM Acoustic Current Meter and the 3D-ACM Wave Acoustic Current Meter. All three ACMs collect, output and store instantaneous current velocity data, 3-axis compass data, 2-axis tilt data, temperature data, and data from optional sensors, including a CTD. And the current velocity and tilt data can be output and stored as vector averages over specified averaging intervals from 15 seconds to 60 minutes. The 2D-ACM provides current velocity measurements in two dimensions; the 3D-ACM and 3D-ACM Wave, three dimensions. In addition, the 3D-ACM Wave provides precision pressure measurements and incorporates a burst mode, which outputs and stores parameter data at one of five available sampling rates for specified periods at specified intervals. The burst data can be interleaved with the vector averaged current velocity and tilt data to provide an efficient data collection method. Current velocity data acquired from a 2D-ACM or 3D-ACM by 3DACM97 can be input to ACMPost, a software program available from FSI that processes the data for display on various graphics displays. ACMPost, a software program available from FSI that processes the data for display on various graphics displays. ACMPost also creates DAT, C00 and HDR files from the CTD data acquired from the optional CTD. These files can be input to FSIPost, a software program available from FSI that processes, displays and saves the CTD data. Current velocity and pressure data acquired from a 3D-ACM Wave by 3DACM97 can be input to WAVEPost, a software program that performs the same functions as ACMPost, but additionally processes the pressure data for display of wave height and direction on graphics displays. This program is also available from FSI and, like ACMPost, creates DAT, C00 and HDR files from CTD data for input to FSIPost. This section provides a general description of 3DACM97 along with 3DACM97 compatible processing software and the 2D-ACM, the 3D-ACM and the 3D-ACM Wave. June 2003 3DACM97 Operating Manual 1-2 3DACM97 Overview 3DACM97 runs on the Windows 95, the Windows 98 or Windows NT platform. 3DACM97 is primarily used to check, to configure and to prepare for deployment a 2DACM, a 3D-ACM or a 3D-ACM Wave. In addition, 3DACM97 is used to acquire and display data from any of these instruments in real time, to download data from the instrument’s internal memory, to view the data, and to save the data for processing by ACMPost or WAVEPost. Specifically, the major functions that 3DACM97 allows you to perform are the following: Check the instrument to establish communications with the instrument and to retrieve the instrument’s model and serial numbers, the version of the firmware installed in the instrument, and the instrument’s calibration date. Choose the instantaneous parameters to be output and stored by the instrument by selecting the parameters; namely, the instantaneous current velocity, pressure (3D-ACM Wave only) and optional parameters, and the instantaneous compass and tilt parameters. One record of the selected instantaneous parameters is output and stored along with the selected vector avaeraged parameters at the end of each averaging interval. Choose the vector averaged parameters to be output and stored by the instrument by selecting the parameters; namely, the vector averaged current velocity and tilt parameters. The selected vector averaged parameters are output and stored at the end of each averaging interval. Choose the burst averaged parameters to be output and stored by the instrument by selecting the parameters; namely, the vector averaged current velocity and tilt parameters. The selected vector averaged parameters are output and stored at the end of each averaging interval. Set the averaging interval by specifying the period during which the selected vector averaged current velocity and tilt parameters are averaged. Set the instrument run times by specifying what periods, other than running continuously, during which the instrument is to run and collect data; the delay time and date if the instrument is to begin collecting data at a future time and date; and for a 3D-ACM Wave only, the instrument sampling rate. For a 3D-ACM Wave, the periods during which the instrument collects instantaneous parameter data and vector averaged current velocity and tilt data, and during which it collects burst parameter data are specified separately. Set the instrument time and date by entering the time and date manually or by accepting the time and date from the computer on which 3DACM97 is running. 3DACM97 Operating Manual June 2003 1-3 Prepare the instrument for deployment under its own internal battery power by selecting one of three operating modes − Continuous, Interval or Delayed − in which the instrument is to run when deployed under its own internal battery power. Acquire data from the instrument in real time while saving the data to a text file, storing the data to the instrument’s internal memory, and viewing the data on a digital display (2D-ACM and 3D-ACM only) or a graphics display. Retrieve and save the data from the instrument after it has been recovered by downloading the data from the instrument’s internal memory and saving the data to a text file. View saved data by opening a text file that contains parameter data. 3DACM97 Compatible Processing Software Text files containing current velocity and pressure data that have been acquired from the ACM’s by 3DACM97 can be processed for display on various graphics displays. In addition, data from a CTD, which can be optionally installed on any of the ACMs, can be processed and displayed. The following three processing programs are available from FSI that perform these functions, and all run under the Windows 95, the Windows 98 or the Windows NT platform: ACMPost which is used to input current velocity data that have been acquired from a 2D-ACM or 3D-ACM. These data are processed for display in four separate graphics displays: the Time display, the Speed and Direction display, the Progressive Vector display, and the Direction Distribution display. The Time display shows a plot of current velocities versus either number of scans or time. The Speed and Direction display shows a stick plot of current speed and direction, where the speed is calculated from the square root of the sum of the squares of the vector averaged horizontal current velocities and the direction is calculated from the arctangent. The current speed is represented as the length of a line - one line for each scan, and the direction as the orientation of each line - 0° to 360° clockwise from straight up, where 0° is true north. The Progressive Vector display shows current speed and direction information on a polar graph, and as in the Speed and Direction display, the vector averaged horizontal current velocity is represented as the length and orientation of a line - one line for each scan. The Direction Distribution display shows histograms of the vector averaged current velocities and the current directions, each versus number of scans. June 2003 3DACM97 Operating Manual 1-4 WAVEPost which is used to input current velocity and pressure data that have been acquired from a 3D-ACM Wave. These data re processed for display in the same four graphics displays provided by ACMPost. However, two additional displays are provided: the Pressure Analysis display and the Wave Direction display. The Pressure Analysis display shows a plot of pressure versus number of scans and a frequency spectrum of wave height. The Wave Direction display shows wave direction, Frequency and relative height. FSIPost which is used to input CTD data that have been acquired from an optional CTD by 3DACM97 and saved into three files created by WAVEPost or ACMPost: a data file with extension .dat, a calibration file with extension .c00 and a header file with extension .hdr. FSIPost inputs all three files and provides a number of data processing features, including first difference editing, time lag correction, calculation of selected parameters, and calculation of pressure averages. In addition, FSIPost allows you to save, view and print reports, including plots of the CTD data and calculated parameters. The ACM Instruments 3DACM97 can configure and acquire data from the following three precision ACM instruments manufactured by FSI: 2D-ACM Acoustic Current Meter which measures current velocity in two dimensions and includes a 3-axis solid state compass for measuring the Earth’s magnetic field, a 2 axis solid state accelerometer for measuring tilt, and a solid state temperature sensor for measuring water temperature. The 2D-ACM can also interface with an optional CTD and includes two DC input channels which interface with most DC output sensors, including dissolved oxygen, pH, chlorophyll, light transmission, and others. The 2D-ACM can be powered from an external DC power supply or from an internal alkaline battery pack. Data can be acquired in real time in ASCII format through an RS-232 or optional RS-485 serial interface at baud rates up to 19200 bits/sec, or the instrument can be deployed and the data stored in its Figure 1-1 standard 1 MB internal flash memory for later retrieval. The 2D-ACM is small in size and low in weight and has a depth rating of 200 or optional 7000 meters. In addition, a 1.5 ton working strength 316 stainless steel mooring frame is included, and a 5 ton frame of the same material is available as an option. 3DACM97 Operating Manual June 2003 1-5 Figure 1-2 3D-ACM Acoustic Current Meter which measures current velocity in three dimensions and includes a 3-axis fluxgate compass for measuring the Earth’s magnetic field, a 2-axis electrolytic tilt sensor for measuring tilt, a solid state temperature sensor for measuring water temperature, and an optional pressure sensor for measuring the depth of the instrument. The 3D-ACM can also interface with an optional CTD and includes two DC input channels which interface with most DC output sensors. The 3DACM can be powered from an external DC power supply or froma an internal alkaline battery pack. Data cn be acquired in real time in ASCII format through an RS-232 or optional RS-485 serial interface at baud rates up to 19200 bits/sec, or the instrument can be deployed and the data stored in its 0.5 MB internal lithium battery backed RAM for later retrieval. The 3D-ACM has a depth rating of either 1000 meters or 7000 meters. A 1.5 ton working strength 316 stainless steel mooring frame is included, and a 5 ton frame of the same material is available as an option. 3D-ACM Wave Acoustic Current Meter which measures current velocity in three dimensions and includes a precision micro-machined pressure sensor for measuring wave height, a 3-axis fluxgate compass for measuring the Earth’s magnetic field, a 2-axis electrolytic tilt sensor for measuring tilt, and a solid state temperature sensor for measuring water temperature. The 3DACM can also interface with an optional CTD and includes two DC input channels which interface with most DC output sensors. The 3D-ACM can Figure 1-3 also interface with an optional CTD and includes two DC input channels which interface with most DC output sensors. The 3D-ACM can be powered from an external DC power supply or from an internal alkaline battery pack. Data can be acquired in real time in ASCII format through an RS-232 or optional RS-485 serial interface at baud rates up to 19200 bits/sec, or the instrument can be deployed and the data stored in its standard internal 32 MB PCMCIA flash memory card for later retrieval. The 3D-ACM has a depth rating of 25 meters, and a tri-pod stand is available as an option. June 2003 3DACM97 Operating Manual 1-6 3DACM97 Operating Manual June 2003 2-1 Section 2: Installing and Starting 3DACM97 T his section describes how to install 3DACM97 from the 3DACM97 For Windows 95 CD-ROM. 3DACM97 is installed using the FSI 3DACM97 Setup program, which is started by choosing the Add/Remove Programs icon in the Windows Control Panel. In addition, this section describes how to start, exit, and uninstall 3DACM97. Note: Before installing 3DACM97, uninstall any previous version of the program if installed on your computer. (See “Uninstalling 3DACM97 3DACM97” on page 2-5 for instructions on how to uninstall 3DACM97. Installing 3DACM97 To install 3DACM97: 1 Exit all programs and turn off any virus protection or screen save software. 2 Insert the 3DACM97 For Windows 95 CD-ROM into your CD-ROM drive. 3 Select Start ➤ Settings ➤ Control Panel to open the Control Panel. 4 Choose Add/Remove Programs in the Control Panel. The Add/Remove Programs Properties dialog box opens: Figure 2-1 June 2003 3DACM97 Operating Manual 2-2 5 SECTION 2: Installing and Starting 3DACM97 Click Install. The Install Program From Floppy Disk or CD-ROM dialog box opens: Figure 2-2 6 Click Next. The Run Installation Program dialog box opens: Figure 2-3 6 Click Finish. After the InstallShield Wizard is prepared, the Welcome dialog box opens: Figure 2-4 3DACM97 Operating Manual June 2003 SECTION 2: Installing and Starting 3DACM97 8 2-3 Click Next. The Choose Destination Location dialog box opens: Figure 2-5 9 Click Next to accept the specified destination directory as the directory in which the 3DACM97 program will be installed. Or instead, click Browse and follow the instructions to select a different directory, and then click Next. The Select Program Folder dialog box opens: Figure 2-6 10 Click Next to accept FSI Applications as the name of the program folder in which 3DACM97 icons will be added. Or instead, select an existing program folder from the list or type a new folder name, and then click Next. The 3DACM97 program files are copied to the specified destination 11 Click Finish in the Setup Complete dialog box to exit from the FSI 3DACM97 Setup program. 3DACM97 is installed and ready to be started. June 2003 3DACM97 Operating Manual 2-4 SECTION 2: Installing and Starting 3DACM97 Starting 3DACM97 To start 3DACM97: 1 Select Start ➤ Programs ➤ FSI Applications. The FSI Applications menu opens: Figure 2-7 2 Choose 3DACM97. 3DACM97 starts and the 3DACM97 Main window opens: Figure 2-8 3DACM97 Operating Manual June 2003 SECTION 2: Installing and Starting 3DACM97 2-5 Exiting 3DACM97 To exit 3DACM97: 1 Select File from the menu bar in the Main window. (See “SECTION 3: Windows and Commands,” for information on the Main window and how to access commands from the menu bar.) The File menu opens. 2 Choose Exit. Uninstalling 3DACM97 To uninstall 3DACM97: 1 Exit from 3DACM97. 2 Select Start ➤ Settings ➤ Control Panel to open the Control Panel. 3 Choose Add/Remove Programs in the Control Panel. The Add/Remove Programs Properties dialog box opens: Figure 2-9 4 Select 3DACM97 and click Add/Remove. 5 Click Yes when asked to confirm that you want to remove the program and all of its components. 3DACM97 is removed from your computer. June 2003 3DACM97 Operating Manual 2-6 SECTION 2: Installing and Starting 3DACM97 3DACM97 Operating Manual June 2003 3-1 Section 3: Windows and Commands A ll of 3DACM97’s commands are access from the Main window, which opens after 3DACM97 has completed its startup. (See “Starting 3DACM97” on page 2-4 for instructions on how to start 3DACM97.) This section provides a general description of the Main window as well as the Instrument Identification window, a window that provides information about the connected instrument, and shows how to access menus and choose commands. The Main Window After 3DACM97 has completed its startup, the Main window shown in Figure 3-1 opens. The Main window provides access to all of 3DACM97’s commands through the menu System menu Title bar Display area Menu bar Close button Maximize button Minimize button Instrument Identification window Figure 3-1 June 2003 3DACM97 Operating Manual 3-2 SECTION 3: Windows and Commands bar. The Main window also contains standard Windows features, such as the Control menu, the Title bar, and the Maximize, Minimize, and Close buttons. The display area composes the rest of the Main window. Menu Bar The menu bar, which contains pull-down menus, provides access to all of 3DACM97 commands. To open a menu from the menu bar, place the mouse pointer on the menu name to select it and then click the left mouse button. The menu opens as shown in Figure 3-2, which shows the open File menu. To choose an item from the menu, place the mouse pointer on the item to select it and then click the left mouse button. You can also use the shortcut method for selecting menu items. To do this, press ALT followed by the underlined letter of the item you want to select on the menu bar, and then the underlined letter of the item you want to select in the menu that opens. Figure 3-2: The Open File Menu Display Area The display area of the Main window is reserved for displaying real time graphics and dialog boxes. (See Figure 7-3 on page 7-8 for an example of a graphics display. 3DACM97 Operating Manual June 2003 SECTION 3: Windows and Commands 3-3 The Instrument Identification Window The Main window contains an Instrument Identification window, which is fixed and cannot be resized. The Instrument Identification window displays information about the instrument connected to your computer’s serial port. However, this information is displayed only after choosing Check Instrument from the Configure Menu. (See “Checking the Instruments” on page 5-1 for information on how to check the instrument using the Check Instrument command.) An example of an Instrument Identification window for a connected 2D-ACM or 3D-ACM is shown in Figure 3-3; one for a connected 3D-ACM Wave, in Figure 3-4. Figure 3-3: The Instrument Identification Window for a 2D-ACM or 3D-ACM Figure 3-4: The Instrument Identification Window for a 3D-ACM Wave Specifically, the Instrument Identification window displays the following information: Model: The model number of the instrument. (2DACM, 3DACM or 3DWAVE) S/N: The serial number of the instrument. Firmware Version: The version number of the firmware that is installed in the instrument. Cal Date: The calibration date of the instrument. June 2003 3DACM97 Operating Manual 3-4 SECTION 3: Windows and Commands 3DACM97 Operating Manual June 2003 4-1 Section 4: Connecting the Instruments and Verifying Operation B efore you can perform most of the functions provided by 3DACM97, your computer must be connected to a 2D-ACM, a 3D-ACM or a 3D-ACM Wave through an available serial port. The default serial port for 3DACM97 is COM1, and the default baud rate is 9600 bits/sec; however, any serial port from COM 1 to COM4 can be used and baud rates of 300, 1200, and 19200 bits/sec are additionally available. This section provides instructions on how to connect the instrument to your computer, how to configure 3DACM97 for a serial port and baud rate other than the defaults, and how to verify that the instrument is communicating with your computer and is functioning properly. The “Kick Start” Feature All the ACMs include a “Kick Start” (KS) feature, which allows you to override the instrument run time settings when the instrument has been configured to turn off for periods of time. KS is a logic input to the instrument and is normally not terminated. However, when KS is terminated to ground, “Kick Start” is enabled and the instrument remains on continuously, regardless of the configured instrument run times. Hence when “Kick Start” is enabled, you can configure the instrument at any time or retrieve data from the instrument immediately after recovery, even when it has been configured to remain off during that time. “Kick Start” is enabled by connecting Pin 5 (KS) to Pin 1 (GND) on the instrument’s bulkhead connector. The Test Cable and Power Supply Connecting an ACM to your computer and powering the instrument requires a test cable and a power supply, which are available from FSI. (See “Optional Items” on page ix for the FSI part numbers.) The test cable includes a KS Switch Box which allows you to connect both the power supply and the computer to the instrument and to switch the “Kick Start” feature on and off. The test cable connects to the bulkhead connector on the instrument and to the selected serial port on your computer. June 2003 3DACM97 Operating Manual 4-2 SECTION 4: Connecting the Instruments and Verifying Operation Test Cable Connections If a test cable is not available, you can fabricate your own cable using a pigtail that mates with the instrument’ bulkhead connector. Figure 4-1 show the pin orientation of the connector, which is shown face up. Table 4-1 shows the required connections from the instrument to the computer; Table 4-2, the required connections from the instrument to the power supply. The bulkhead connector on the instrument is a Subconn MCBH5F. The pigtail that makes with this connector is a Subconn MCIL5M and is available from the following source: MacArtney, Inc. 40 Western Way (P.O. Box 68) Duxbury, MA 02331 U.S.A. Tel: (781) 934-0719 Fax: (781) 934-0699 Power Supply Requirements A 7-15 VDC (12 VDC nominal), 50 mA power supply is required to externally power a 2D-ACM; a 7-35 VDC (12 VDC nominal), 50 mA power supply is required for a 3D-ACM or a 3D-ACM Wave. Higher current capacity is required when optional sensors are installed. A power supply of sufficient current capacity is available from FSI. (See “Optional Items” on page ix for the FSI part number.) If necessary, however, the instrument can be powered from it internal batteries. The Optional RS-485 Interface An optional RS-485 interface, instead of the standard RS-232 interface, can be installed on an ACM. If the instrument has been ordered with this option, a Converter Box is also included. In this configuration the test cable connects to the Converter Box, and the Converter Box connects to your computer. If a power supply is used, it connects to the Converter Box, where the Converter Box provides banana jacks that are used to connect power to the KS Switch Box. 3DACM97 Operating Manual June 2003 SECTION 4: Connecting the Instruments and Verifying Operation 4-3 Figure 4-1: Bulkhead Connector - Face View Instrument to Computer Connections Instrument Bulkhead Connector PIN WIRE COLOR LABEL FUNCTION 1 Black GND Ground 2 White RXD 4 Green TXD Signal Direction Computer DB-9 PIN LABEL FUNCTION 5 GND Ground Received Data Computer to Instrument 3 TXD Transmitted Data Transmitted Data Instrument to Computer 2 RXD Received Data Table 4-1: Instrument to Computer Connections Instrument to Power Supply Connections Instrument Bulkhead Connector Power Supply PIN WIRE COLOR LABEL FUNCTION 1 Black GND Ground Ground 3 Red Power (+) Instrument Power 12 VDC (nominal) 5 Orange KS Kick Start Ground Table 4-2: Instrument to Power Supply Connections June 2003 3DACM97 Operating Manual 4-4 SECTION 4: Connecting the Instruments and Verifying Operation Connecting the Instruments to Your Computer To connect an ACM to your computer, you must have a test cable; a power supply or an installed battery pack; an available serial port, which is typically COM1; and if the instrument includes the optional RS-485 interface, a Converter Box, a DC power cable, and a serial cable, which are included with this option. A typical setup, which includes a laptop computer, a 2D-ACM test cable and a power supply, is shown in Figure 4-2. Note: Although any serial port from COM1 to COM4 can be used, use COM1 if it is available, as it is the default serial port setting of 3DACM97. If you use any other serial port, you must select it in 3DACM97 as described in “Changing the Serial Port” on page 4-6. Figure 4-2: Typical Setup with a 2D-ACM 3DACM97 Operating Manual June 2003 SECTION 4: Connecting the Instruments and Verifying Operation 4-5 When Using the Standard RS-232 Interface To connect the instrument to your computer when the instrument includes the standard RS-232 interface: 1 Disconnect the dummy connector from the bulkhead connector on the instrument and connect the Subconn MCBH4M pigtail end of the test cable. 2 Connect the DB-9 connector end of the test cable to the selected serial port on your computer. 3 If using the power supply available from FSI, connect the power supply to the POWER connector on the KS switch Box of the test cable and to a 100-125 VAC or 220-250 VAC, 50-60 Hz power source. When Using the Optional RS-485 Interface To connect the instrument to your computer when the instrument includes the optional RS-485 interface; 1 Disconnect the dummy connector from the bulkhead connector on the instrument and connect the Subconn MCBH5M pigtail end of the test cable. 2 Connect the DB-9 connector end of the test cable to the DB-9 input connector on the Converter Box. 3 Connect the DB-9 output connector of the Converter Box to the selected serial port on the computer using the serial cable provided. 4 If using a power supply, connect the power supply to the POWER connector on the Converter Box and complete the remaining steps. 5 Connect the banana plugs of the DC power cable provided to the red (+) and black (-) banana jacks on the Converter Box, and connect the opposite end of the cable to the Power connector on the KS Switch Box of the Test cable. 6 If using the power supply available from FSI, connect the power supply to a 100-125 VAC or 220-250-VAC, 50-60 Hz power source. June 2003 3DACM97 Operating Manual 4-6 SECTION 4: Connecting the Instruments and Verifying Operation Selecting a Different Serial Port and Baud Rate The default serial port for 3DACM97 is COM1. And the default baud rate for the ACMs is 9600 bits/sec with one stop bit, eight data bits and no parity. Both the serial port and the baud rate can be selected in 3DACM97. Changing the Serial Port To select a different serial port: 1 Choose Start ➤ Programs ➤ FSI Applications ➤ 3DACM97. 3DACM97 starts and the 3DACM97 Main window opens. 2 Choose Communications ➤ Setup. The configuration COM Setup dialog box shown in Figure 4-3 opens. Figure 4-3: The Configuration COM Setup Dialog Box 3 Select the new serial port in the Communications Port area of the Configuration COM Setup dialog box. 4 Click OK to save the new serial port selection and close the Configuration COM Setup dialog box, 3DACM97 Operating Manual June 2003 SECTION 4: Connecting the Instruments and Verifying Operation 4-7 Changing the Baud Rate To select a different baud rate: 1 Choose Start ➤ Programs ➤ FSI Applications ➤ 3DACM97. 3DACM97 starts and the 3DACM97 Main window opens. 2 Choose Communications ➤ Communications Window. The Communications Window shown in Figure 4-4 opens. Figure 4-4: The Communications Window 3 Type ***O, and then press Enter. This places the instrument in Open mode. To verify this, press Enter again. The words “OPEN MODE” should be displayed. 4 Do one of the following to select the baud rate of the instrument: • Type SB30, and then press Enter to set the baud rate to 300 bits/sec. • Type SB30, and then press Enter to set the baud rate to 300 bits/sec. • Type SB96, and then press Enter to set the baud rate to 9600 bits/sec. • Type SB19, and then press Enter to set the baud rate to 19200 bits/sec. June 2003 3DACM97 Operating Manual 4-8 SECTION 4: Connecting the Instruments and Verifying Operation 5 Click Close to close the Communications Window. 6 Choose Communications ➤ Setup. The configuration COM Setup dialog box shown in Figure 4-3 on page 4-6 opens. 7 Select the new baud rate 300, 9600, or 19200 in the Baudrate area of the Configuration COM Setup dialog box. Caution: If you click Cancel in the next step, the instrument will not be able to communicate with your computer. 8 Click OK to save the new baud rate selection and close the Configuration COM Setup dialog box, or click Cancel to close the dialog box without saving the new selection. Verifying the Operation of the Instruments Once you have connected an ACM to your commuter’s serial port and to a power supply, you can verify that your computer is communicating with the instrument and that the instrument is functioning properly. This procedure is recommended when you connect an instrument to your computer for the first time. Verifying the Operation of a 2D-ACM or 3D-ACM To verify the operation of a 2D-ACM or 3D-ACM: 1 Switch the KS switch on the test cable to KS ON. Note: If you have fabricated your own test cable, be sure Pin 5 and Pin 1 of the instrument’s bulkhead connector are connected to power supply ground. This connection enables “Kick Start.” 2 Choose Start ➤ Programs ➤ FSI Applications ➤ 3DACM97. 3DACM97 starts and the 3DACM97 Main window opens. 3 Choose Communications ➤ Communications Window. The Communications Window shown in Figure 4-4 on page 4-7 opens. 3DACM97 Operating Manual June 2003 SECTION 4: Connecting the Instruments and Verifying Operation 4-9 Note: In the steps that follow you are instructed to type characters directly in the communications Window. Unless otherwise stated, letters can be typed in either upper case or lower case. Each series of characters, which are shown in bold type in the instructions, compose a single command. And unless otherwise stated, you must press Enter after typing the characters to execute the command. For detailed information on these commands and many other 2D-ACM and 3D-ACM commands, refer to the “2D-ACM and Coastal 3D-ACM Service Manual. 4 Type ***O, and then press Enter. This places the instrument in Open mode. To verify this, press Enter again. The words “OPEN MODE” should be displayed. 5 Type S/N, and then press Enter. The serial number of the instrument should be displayed. For example, S/N=1000. 6 Type AVGI, and then press Enter. 7 Type 00:00, and then press Enter. This sets the averaging interval to zero if it is not already zero. 8 Type TX=ON, and then press Enter. This selects the Tilt X instantaneous parameter. 9 Type TY=ON, and then press Enter. This selects the Tilt Y instantaneous parameter. 10 Type RDM, and then press Enter. The instantaneous and average parameters that have been selected to be output and stored by the instrument should be displayed. 11 Look for TX=ON and TY=ON and note which two adjacent columns they are located in. The columns are separated by commas. 12 Type ***R, and then press Enter. This places the instrument in Run mode and the following message should be displayed: “Logging Pointers Not Reset, Reset (N)o or (Y)es?” June 2003 3DACM97 Operating Manual 4-10 13 SECTION 4: Connecting the Instruments and Verifying Operation Type “N” or “n” without pressing Enter. A message, which varies in content depending on the current configuration of the instrument, should be displayed and should include the following: “Tilt Function of ON” 14 Type SC, and then press Enter. Data should output continuously from the instrument and should be displayed in the Communications Window. Look for the columns noted in Step 11. These are the X and Y components of the instrument’s tilt Tilt X and Tilt Y. (See “Selecting the Compass and Tilt Instantaneous Parameters” on page 5-8 for a description of these parameters.) 15 While observing the Tilt X and Tilt Y data, vary the vertical position of the instrument. The data should vary and be consistent with the vertical position of the instrument. Note: After a few minutes the data will appear to stop updating. This is because the window buffer is filled. However, data are still being output by the instrument. 16 To stop data from being output by the instrument, type an upper case S. It is not necessary to press Enter. Verifying the Operation of a 3D-ACM Wave To verify the operation of a 3D-ACM Wave: 1 Switch the KS switch on the test cable to KS ON. Note: If you have fabricated your own test cable, be sure Pin 5 and Pin 1 of the instrument’s bulkhead connector are connected to power supply ground. This connection enables “Kick Start.” 2 Choose Start ➤ Programs ➤ FSI Applications ➤ 3DACM97. 3DACM97 starts and the 3DACM97 Main window opens. 3 Choose Communications ➤ Communications Window. The Communications Window shown in Figure 4-4 on page 4-7 opens. 3DACM97 Operating Manual June 2003 SECTION 4: Connecting the Instruments and Verifying Operation 4-11 Note: In the steps that follow you are instructed to type characters directly in the Communications Window. Unless otherwise stated, letters can be typed in either upper case or lower case. Each series of characters, which are shown in bold type in the instructions, compose a single command. And unless otherwise stated, you must press Enter after typing the characters to execute the command. For detailed information on these commands and many other 3D-ACM Wave commands, refer to the “3D-ACM Wave Service Manual.” 4 Type ***O, and then press Enter. This places the instrument in Open mode. To verify this, press Enter again. The words OPEN MODE should be displayed. 5 Type S/N, and then press Enter. The serial number of the instrument should be displayed. For example, S/N=15000W. Type BMODE, and then press Enter. 6 The following message should be displayed: “burst mode only enabled” Type TX=ON, and then press Enter. 7 This selects the Tils X burst parameter. Type TY=ON, and then press Enter. 8 This selects the Tilt Y burst parameter. Type RDMB, and then press Enter. 9 The burst parameters that have been selected to be output and stored by the instrument should be displayed. 10 Look for TXB=ON and TYB=ON and note which two adjacent columns they are located in. The columns are separated by commas. 11 Type ***R, and then press Enter. This places the instrument in Run mode and a message, which varies in content depending on the current configuration of the instrument, should be displayed and should include the following: “Tilt Function is ON” June 2003 3DACM97 Operating Manual 4-12 12 SECTION 4: Connecting the Instruments and Verifying Operation Type SC, and then press Enter. Data should output continuously from the instrument and should be displayed in the Communications Window. Look for the columns noted in Step 10. These are the X and Y components of the instrument’s tilt Tilt X and Tilt Y. (See “Selecting the Compass and Tilt Burst Parameters” on page 5-31 for a description of these parameters.) 13 While observing the Tilt X and Tilt Y data, vary the vertical position of the instrument. The data should vary and be consistent with the vertical position of the instrument. Note: After a few minutes the data will appear to stop updating. This is because the window buffer is filled. However, data are still being output by the instrument. 14 To stop data from being output by the instrument, type an upper case S. It is not necessary to press Enter. Checking and Saving the Calibration Constants To a File 3DACM97 allows you to check the calibration constants of an ACM. In addition, you can save the calibration constants to a file. When saved, you can open the calibration constants file and load the calibration constants to the instrument’s internal memory. Note: Saving the calibration constants of an ACM to a file is highly recommended. Should the lithium battery that is used for memory backup of a 3D-ACM fail, or should the flash memory of a 2D-ACM or 3D-ACM Wave become corrupted, the calibration constants can be loaded to the instrument’s internal memory once the problem is corrected. To check and save the calibration constants to a file: 1 Switch the KS switch on the test cable to KS ON. Note: If you have fabricated your own test cable, be sure Pin 5 and Pin 1 of the instrument’s bulkhead connector are connected to power supply ground. This connection enables “Kick Start.” 3DACM97 Operating Manual June 2003 SECTION 4: Connecting the Instruments and Verifying Operation 2 4-13 Choose Start ➤ Programs ➤ FSI Applications ➤ 3DACM97 3DACM97 starts and the 3DACM97 Main window opens. 3 Choose Configure ➤ Check Instrument. 3DACM97 checks the instrument and displays which items are being checked during the check instrument process. (See “Checking the Instruments” on page 5-1 for more information on checking the instruments.) 4 Choose Help ➤ Check Constants. 3DACM97 checks the calibration constants, then the Calibration Constants window shown in Figure 4-5 opens. Figure 4-5: The Calibration Constants Window June 2003 3DACM97 Operating Manual 4-14 5 SECTION 4: Connecting the Instruments and Verifying Operation Click OK. The Save Calibration Constants dialog box opens: 6 Click Yes if you want to save the calibration constants to a file, or click No if you do not. If you click Yes, the Save As dialog box for CAL files shown in Figure 4-6 opens. This dialog box is used to create the file in which to save the calibration constants. If you click No, the Save Calibration Constants dialog box closes and the calibration constants are not saved. Figure 4-6: The Save As Dialog Box for CAL Files 7 Click the arrow in the Save in drop-down list box and select the folder in which to save the calibration constants file. 8 In the File name text box enter the name of the file in which to save the calibration constants. The extension .cal is added automatically. 3DACM97 Operating Manual June 2003 SECTION 4: Connecting the Instruments and Verifying Operation 9 4-15 Click Save to save the calibration constants to the specified file and close the Save As dialog box for CAL files, or click Cancel to close the dialog box without saving the calibration constants. Loading the Calibration Constants from a Saved File 3DACM97 allows you to load the calibration constants from a calibration constants file, a file with extension .cal that contains the instrument calibration constants, to the internal memory of an ACM. 1 To load the calibration constants from a saved file to the instrument’s internal memory: Switch the KS switch on the test cable to KS ON. Note: If you have fabricated your own test cable, be sure Pin 5 and Pin 1 of the instrument’s bulkhead connector are connected to power supply ground. This connection enables “Kick Start”. 2 Choose Start ➤ Programs ➤ FSI Applications ➤ 3DACM97. 3DACM97 starts and the 3DACM97 Main window opens. 3 Choose Configure ➤ Check Instrument. 3DACM97 checks the instrument and displays which items are being checked during the check instrument process. (See “Checking the Instruments” on page 5-1 for more information on checking the instruments.) 4 Choose Help ➤ Store Calibration Constants. The Warning window opens: June 2003 3DACM97 Operating Manual 4-16 5 SECTION 4: Connecting the Instruments and Verifying Operation Click Yes if you want to load the calibration constants to the instrument’s memory, or click No if you do not. If you click No, the Warning dialog box closes and the calibration constants are not loaded. If you click Yes, the Open dialog box for CAL files shown in Figure 4-7 opens. Although more than one file may be displayed, the example in the figure shows a single file named Cal Const01.cal. If the file you want to open is not visible, it may be in a different folder than the one shown. In this case, click the arrow in the Look in drop-down list box and select the folder in which the file is located. Figure 4-7: The Open Dialog Box for CAL Files 6 Click the file you want to load, and then click Open to load the calibration constants to the instrument’s internal memory. Or click Cancel to close the dialog box without loading the calibration constants. 3DACM97 Operating Manual June 2003 Section 5: Checking and Configuring the Instruments A fter you have connected a 2D-ACM, a 3D-ACM or a 3D-ACM Wave to your computer’s serial port and to a power supply as described in “Connecting the Instruments to Your Computer” on page 4-4, you are ready to check and configure the instrument. This section describes how to perform these tasks using the Configure menu. In addition, descriptions of each of the configuration settings and the instantaneous and vector averaged parameters are provided. Checking the Instruments Before you can configure an ACM, you must check the instrument. Checking the instrument established communications with the instrument and retrieves the instrument’s model number, serial number, firmware version, and calibration date required for display in the Instrument Identification window. (See “The Instrument Identification Window” on Page 3-3 for a description of this window.) In addition, 3DACM97 checks the instrument’s address and verifies the serial port to which it is connected. Note: 3DACM97 can be configured to automatically check the instrument after the program has completed its startup. (See “Checking the Instrument Automatically on Startup” on page 5-3 for instructions on how to perform this function.) Checking a 2D-ACM or 3D-ACM To check a 2D-ACM or 3D-ACM: 1 2 Connect the 2D-ACM or 3D-ACM to your computer’s serial port and switch the KS switch on the test cable to KS ON. Choose Start ➤ Programs ➤ FSI Applications ➤ 3DACM97. 3DACM97 starts and the 3DACM97 Main window shown in Figure 3-1 on page 3-1 opens. 3 Choose Configure ➤ Check Instrument. June 2003 3DACM97 Operating Manual 5-2 SECTION 5: Checking and Configuring the Instruments 3DACM97 displays which items are being checked during the check instrument process and then displays a graphic of a 2D-ACM or 3D-ACM in the display area of the Main window as shown in Figure 5-1, which shows a 3D-ACM. The instrument Identification window in the Main window displays the model and serial numbers, firmware version, and calibration date of the instrument. Figure 5-1: The Main Window after Checking a 3D-ACM Checking a 3D-ACM Wave To check a 3D-ACM Wave: 1 Connect the 3D-ACM Wave to your computer’s serial port and switch the KS switch on the test cable to KS ON. 2 Choose Start ä Programs ➤ FSI Applications ➤ 3DACM97. 3DACM97 starts and the 3DACM97 Main window shown in Figure 3-1 on page 3-1 opens. 3 Choose Configure ➤ Check Instrument. 3DACM97 Operating Manual June 2003 SECTION 5: Checking and Configuring the Instruments 5-3 3DACM97 displays which items are being checked during the check instrument process and then displays a graphic of a 3D-ACM Wave in the display area of the Main window as shown in Figure 5-2. The Instrument Identification window in the Main window displays the model and serial numbers, firmware version, and calibration date of the instrument. Figure 5-2: The Main Window after Checking a 3D-ACM Wave Checking the Instrument Automatically on Startup 2DACM97 can be configured to check the instrument automatically when you start the program. To configure 3DACM97 to automatically check the instrument on startup: 1 Choose Start ➤ Programs ➤ FSI Applications ➤ 3DACM97. 3DACM97 starts and the 3DACM97 Main windows shown in Figure 3-1 on page 3-1 opens. 2 Choose File ➤ Properties. June 2003 3DACM97 Operating Manual 5-4 SECTION 5: Checking and Configuring the Instruments The 3DACM97 Settings dialog box opens: 3 Select the Check for Instrument at Program Start check box. 4 Click OK to save the new setting and close the 3DACM97 Settings dialog box, or click Cancel to close the dialog box without saving the new setting. If you click OK, 3DACM97 will check the instrument automatically the next time the program completes its startup. In addition, the graphic for the instrument will be displayed in the display area of the Main window, and the Instrument Identification window will display the instrument’s model number, serial number, firmware version, and calibration date. Configuring a 2D-ACM or a 3D-ACM Configuring either a 2D-ACM or a 3D-ACM requires that you make the following settings: • Select the current velocity and optional instantaneous parameters to be output and stored. • Select the compass and tilt instantaneous parameters to be output and stored, and whether to use them in the current velocity calculations. • Select the vector averages to be output and tored and over what interval. • Enter the delay time and date, the interval time and the on time. • Select whether to log data to memory and whether to first reset memory. The Configure ACM Dialog Box Selecting the current velocity and optional parameters, the compass and tilt parameters and the vector average parameters to be output and stored by a 2D-ACM or 3D-ACM is performed using the Configure ACM dialog box shown in Figure 5-3. In addition, entering the running times, setting up memory and viewing the statistics is also performed using the Configure ACM dialog box. 3DACM97 Operating Manual June 2003 SECTION 5: Checking and Configuring the Instruments 5-5 Figure 5-3: The Configure ACM Dialog Box - Parameters Tab To open the Configure ACM dialog box: Choose Configure Configure Instrument. 3DACM97 first reads the current configuration of the instrument while displaying which items are being read, and then it opens the dialog box. Note: If the instrument has not been checked since starting 3DACM97, the Configure Instrument item in the Configure menu is grayed and cannot be chosen. (See “Checking the Instruments” on page 5-1 for instructions on how to check the instrument.) Selecting the Current Velocity and Optional Instantaneous Parameters Selecting the current velocity and optional parameters to be output and stored by a 2DACM or 3D-ACM is performed using the Parameters tab in the Configure ACM dialog box. The Parameters tab is the one shown in Figure 5-3. However, the Z Velocity and Up Velocity parameters are only available when a 3D-ACM is connected; they are grayed and cannot be selected for a 2D-ACM. All the parameters are instantaneous parametersparameters that are not averaged. Note: The number of selected parameters determines the number of bytes in each data record. The record length in bytes is shown in the Memory tab in the Configure ACM dialog box. (See “Setting Up Memory” on page 5-16 for information on the Memory tab.) Note: For a complete mathematical description of the instantaneous parameters, refer to the “3D-ACM & Coastal 3D-ACM Service Manual.” June 2003 3DACM97 Operating Manual 5-6 SECTION 5: Checking and Configuring the Instruments The instantaneous parameter selections are listed below, where X, Y, and Z Velocity parameters reflect the orientation of the ACM shown in Figure 5-4. X Velocity: The X component of the current velocity in cm/ sec relative to a reference notch on the velocity head of instrument. Y Velocity: The Y component of the current velocity in cm/ sec relative to a reference notch on the velocity head of instrument. Z Velocity: The Z component of the current velocity in cm/ sec relative to the longitudinal axis of the instrument. (3D-ACM only) North Velocity: The north/south (+/-) component of the current velocity in cm/sec relative to magnetic north and compensated for the instrument’s tilt. East Velocity: The east/west (+/-) component of the current velocity in cm/sec relative to magnetic north and compensated for the instrument’s tilt. Up Velocity: The up/down (+/-) vertical component of the current velocity in cm/sec relative to true vertical and compensated for the instrument’s tilt. (3D-ACM only) Sound Velocity:ound Velocity: The sound velocity in water in m/sec. CTD: The CTD outputs of conductivity in mmho/cm, temperature in °C and pressure in dBars. (CTD instrument is optional) Sea Temperature: The water temperature in °C. Pressure: The water pressure in dBars. (Optional and for a 3D-ACM only) Battery Voltage: The instrument battery voltage in volts. User A/D Channel 1: The output in counts, from 0 to 4095, of the Channel 1 A/D. User A/D Channel 2: The output in counts, from 0 to 4095, of the Channel 2 A/D. June 2003 3DACM97 Operating Manual SECTION 5: Checking and Configuring the Instruments 5-7 Index mark aligns with X axis Figure 5-4: Parameter Orientation Definitions of an ACM June 2003 3DACM97 Operating Manual 5-8 SECTION 5: Checking and Configuring the Instruments To select the instantaneous parameters: 1 Choose Configure ➤ Configure Instrument. After 3DACM97 reads the instrument configuration, the Configure ACM dialog box shown in Figure 5-3 on page 5-5 opens. 2 Select the Parameters tab. 3 Select the check boxes for the instantaneous parameters you want to output and store, and clear the check boxes for those you do not. 4 Do one of the following: • Click Save to save your selections and close the Configure ACM dialog box. • Click another tab. • Click Cancel to close the Configure ACM dialog box without saving any changed selections. Selecting the Compass and Tilt Instantaneous Parameters Selecting the compass and tilt parameters to be output and stored by a 2D-ACM or 3DACM is performed using the Compass tab in the Configure ACM dialog box. The Compass tab is shown in Figure 5-5. The compass and tilt parameters are instantaneous parametersparameters that are not averaged. In addition, you can select whether to use the compass and tilt parameters in the north, east and up (3DACM only) instantaneous current velocity calculations. Note: The number of selected parameters determines the number of bytes in each data record. The record length in bytes is shown in the Memory tab in the Configure ACM dialog box. (See “Setting Up Memory” on page 5-16 for information on the Memory tab.) Note: For a complete mathematical description of the compass and tilt parameters, refer to the “3D-ACM & Coastal 3D-ACM Service Manual.” 3DACM97 Operating Manual June 2003 SECTION 5: Checking and Configuring the Instruments 5-9 Compass Tab Figure 5-5: The Configure ACM Dialog Box The compass and tilt parameter selections are listed below and reflect the orientation of the ACM shown in Figure 5-4 on page 5-7. Compass X: The cosine of the instrument’s X axis rotation (Hx) relative to magnetic north. Compass Y: The cosine of the instrument’s Y axis rotation (Hy) relative to magnetic north. Compass Z: The cosine of the instrument’s Z axis rotation (Hz) relative to magnetic north. Tilt X: The X component of the instrument’s tilt (Tx) in degrees. Tilt Y: The Y component of the instrument’s tilt (Ty) in degrees. Direction (0-360): The instrument’s heading from 0° to 360° relative to magnetic north. You can also select whether to use the compass and tilt parameters in the north, east and up instantaneous current velocity parameter calculations: Use Compass in Velocity Calculation: Use Tilt in Velocity Calculations: June 2003 Select to use the X,Y and Z compass parameters Select to use the X and Y tilt parameters 3DACM97 Operating Manual 5-10 SECTION 5: Checking and Configuring the Instruments To select the compass and tilt instantaneous parameters and to select whether to use them in the north, east and up instantaneous current velocity calculations: 1 Choose Configure ➤ Configure Instrument. After 3DACM97 reads the instrument configuration, the Configure ACM dialog box shown in Figure 5-3 on page 5-5 opens. Select the Compass tab. Select the check boxes for the compass and tilt instantaneous parameters you want to output and store, and clear the check boxes for those you do not. Select whether you want to use the compass or tilt parameters, or both in the north, east and up (3D-ACM only) current velocity calculations. Do one of the following: • Click Save to save your selections and close the Configure ACM dialog box. • Click another tab. • Click Cancel to clcose the Configure ACM dialog box without saving any changed selections. Selecting Vector Averaged Current Velocity and Tilt Selecting the current velocity and tilt vector aaverages to be output and stored by a 2DACM or 3D-ACM is performed using the Average tab in the Configure ACM dialog box. The Average tab is shown in Figure 5-6. However, the Average Up Velocity is only available when a 3D-ACM is connected; it is grayed and cannot be selected for a 2DACM. The averaging interval for the selected current velocity and tilt vector averages is also entered in the Average tab. When one or more of the current velocity and tilt vector averages are selected along with an averaging interval, the vector averages and one record of the selected instantaneous parameters are stored at the end of every averaging interval. Hence the instrument’s memory will fill at a slower rate than it would if no vector averages were selected. This rate is displayed in the Statistics tab. (See “Reviewing the Statistics” on page 5-17 for information on the Statistics tab.) Note: Selecting the current velocity and tilt vector averages increases the number of bytes contained in each data record. The record length in bytes is shown in the Memory tab in the Configure ACM dialog box. (See “Setting Up Memory” on page 516 for information on the Memory tab.) 3DACM97 Operating Manual June 2003 SECTION 5: Checking and Configuring the Instruments 5-11 Average Tab Figure 5-6: The Configure ACM Dialog Box The current velocity and tilt vector averages selections are the following: Average North Velocity: The vector averaged north/south (+/-) component of the current velocity in cm/sec relative to magnetic north and compensated for the instrument’s tilt. Average East Velocity: The vector averaged east/west (+/-) component of the current velocity in cm/sec relative to magnetic north and compensated for the instrument’s tilt. Average Up Velocity: The vector averaged up/down (+/-) vertical component of the current velocity in cm/sec relative to true vertical and compensated for the instrument’s tilt. (3D-ACM only) Average Instrument Tilt: The vector average of the instrument’s tilt in degrees. Vector averaging of the selected parameters is performed at specified intervals. The averaging interval is entered in minutes and seconds (mm:ss) in the Average Interval text boxes. The minimum averaging interval is 15 seconds; the maximum, 59 minutes, 59 seconds. Note: If a value for the On Time is entered, the Average Interval should be set to an integer number that is evenly divisible into the On Time. (See “Setting the Run Times” on page 5-12 for information on the On Time.) For example, if the On Time is 10 minutes. Otherwise some averaging intervals will be shorter than the Average Interval. June 2003 3DACM97 Operating Manual 5-12 SECTION 5: Checking and Configuring the Instruments To select the current velocity and tilt vector averages and their averaging interval: 1 Choose configure ➤ Configure Instrument. After 3DACM97 reads the instrument configuration, the Configure ACM dialog box shown in Figure 5-3 on page 5-5 opens. 2 Select the Average tab. 3 Select the check boxes for the current velocity and tilt vector averages you want to output and store, and clear the check boxes for those you do not. 4 Enter the averaging interval in minutes and seconds (mm:ss) in the Average Interval text boxes. 5 Do one of the following: • Click Save to save your selections and close the Configure ACM dialog box. • Click another tab. • Click Cancel to close the Configure ACM dialog box without saving any changed selections. Setting the Run Times You can configure a 2D-ACM or 3D-ACM to run for specified periodsthe On Time, beginning at the start of specified intervalsthe Interval Time. When running, the instrument is on and collecting data. In addition, you can configure the instrument to delay running, hence remain off, until a specified time and datethe Delayed Time and the Delayed Date. These settings are made in the Time tab in the Configure ACM dialog box. The Time tab is shown in Figure 5-7. In addition, the Time tab displays and allows you to set the instrument’s current time and date and record a time stamp with each data record. The instrument run times are entered in the following text boxes: Interval Time: The time in hours, minutes and seconds between the start of each On Time. On Time: The time in hours, minutes and seconds beginning at the start of each Interval Time during which the instrument is on and collecting data. All data are output and stored. 3DACM97 Operating Manual June 2003 SECTION 5: Checking and Configuring the Instruments 5-13 Time Tab Figure 5-7: The Configure ACM Dialog Box Note: If the Interval Time is set to zero, or if the On Time is greater than the Interval Time, the instrument will begin collecting data continuously when it is turned on or at the specified Delayed Time and Delayed Date, as described below, after it is turned on. Note: if one or more of the current velocity and tilt vector averages are selected and a value for the Average Interval is entered, the On Time should be set to an integer number that is evenly divisible by the Average Interval. (See “Selecting Vector Averaged Current Velocity and Tilt” on page 5-10 for information on the Average Interval.) For example, if the Average Interval is 5 minutes, the On Time should be set to 5, 10, 15 or any multiple of 5 minutes. Otherwise some averaging intervals will be shorter than the Average Interval. Delayed Date: The date on which the instrument will turn on and begin collecting data at the Delayed Time. Delayed Time: The time of day on the Delayed Date the instrument will turn on and begin collecting data. You can also select whether you want to record a time stamp with each data record: Record Time in Memory: June 2003 Select to record a time stamp with each data record. 3DACM97 Operating Manual 5-14 SECTION 5: Checking and Configuring the Instruments To set the run times and select whether to record a time stamp with each data record: 1 Choose Configure ➤ Configure Instrument. After 3DACM97 reads the instrument configuration, the Configure ACM dialog box shown in Figure 5-3 on page 5-5 opens. 2 Select the Time tab. 3 Enter the Interval Time in hours, minutes and seconds (hh:mm:ss) in the Interval Time text box. 4 Enter the On Time in hours, minutes and seconds (hh:mm:ss) in the On Time text box. Be sure it is at least five seconds less than the Interval Time entered in Step 3. 5 Enter the Delayed Date as the month, day and year (mm-dd-yyyy) in the Delayed Date text box. 6 Enter the Delayed Time in hours, minutes and seconds (hh:mm:ss) in the Delayed Time text box. 7 Select the Record Time in Memory check box to record a time stamp with each data record, or clear the check box to not record a time stamp. 8 Do one of the following: • Click Save to save your selections and close the configure ACM dialog box. • Click another tab. • Click Cancel to close the configure ACM dialog box without saving any changed selections. The Time Tab also displays the instrument’s current time and date in the Instrument Time and Instrument Date displays. Caution: The displayed time and date is that which was read by 3DACM97 from the instrument when the instrument was checked. It is not updated while the dialog box is open. However, the time and date can be set using the Enter Local Time and Date dialog box as described below. 3DACM97 Operating Manual June 2003 SECTION 5: Checking and Configuring the Instruments 5-15 To set the instrument’s time and date: 1 Choose Configure ➤ Configure Instrument. After 3DACM97 reads the instrument configuration, the Configure ACM dialog box shown in Figure 5-3 on page 5-5 opens. 2 Select the Time tab. 3 Click Set. The Enter Local Time and Date dialog box opens: Caution: The displayed time and date in the Enter Local Time and Date dialog box is that which was ready be 3DACM97 from the computer on which 3DACM97 is running when the dialog box was opened. It is not updated while the dialog box is open. 4 Do one of the following: • Click OK to accept the displayed time and date, which was acquired from the computer on which 3DACM97 is running, and close the Enter Local Time and Date dialog box. • Enter a time in hours, minutes and seconds (hh:mm:ss) in the Time text box and a date as the month, day and year (mm-dd-yyyy) in the Date text box. Then click OK to save the new time and date and close the Enter Local Time and Date dialog box. • Click Cancel to close the Enter Local Time and Date dialog box without changing the time and date. The new time and date is shown in the Instrument Time and Instrument Date displays in the Time tab. 5 Click Save to save the entered time to the instrument and close the Configure ACM dialog box, or click Cancel to close the dialog box without saving the entered time. June 2003 3DACM97 Operating Manual 5-16 SECTION 5: Checking and Configuring the Instruments Setting Up Memory The internal memory of a 2D-ACM and a 3D-ACM is sequentially read from and written to. Therefore, to access memory requires a pointer, which always points to the location in memory being read from or written to. This pointer is called the Logging Pointer. The Logging pointer increments whenever the location to which it is pointing is either read from or written to. Hence if data are to be stored to the instrument’s internal memory, the Logging Pointer should be resetunless it is intentional to leave it as is. 3DACM97 automatically resets the Logging Pointer when data are retrieved from internal memory. You can select whether to store data to the instrument’s internal memory and whether to reset the Logging Pointer using the Memory tab in the Configure ACM dialog box. The Memory tab is shown in Figure 5-8. In addition, the Memory tab displays the length in bytes of each data record and the total memory in bytes available in the instrument. Memory Tab Figure 5-8: The Configure ACM Dialog Box The memory setup selections are the following: Log Data to Memory: Select to store data to the instrument’s internal memory. Reset Logging Pointer: Select to reset the Logging Pointer to zero, the first location in memory. 3DACM97 Operating Manual June 2003 SECTION 5: Checking and Configuring the Instruments 5-17 To set up memory: 1 Choose Configure ➤ Configure Instrument. 2 Select the Memory tab. 3 Select the Log Data to Memory check box to store data to the instrument’s internal memory, or clear the check box to not store data. 4 Select the Reset Logging Pointer check box to reset the Logging Pointer, or clear the check box to leave it as is. 5 Do one of the following: • Click Save to save your selections and close the Configure ACM dialog box. • Click another tab. • Click Cancel to close the Configure ACM dialog box without saving any changed selections. The Memory tab also displays the length in bytes of each data record in the Current Record Length display and the size of instrument’s memory in bytes in the Memory Size display. The length of a data record increases with the number of selections made in the Parameters, Compass and Average tabs. Reviewing the Statistics Reviewing the statistics for a 2D-ACM or 2D-ACM is performed using the Statistics tab in the Configure ACM dialog box. The Statistics tab is shown in Figure 5-9. The Statistics tab displays the instrument start date, the expected number of running days, the expected end date, the expected memory usage, and the number of days it will take to fill the instrument’s internal memory. These statistics depend directly on the selections and entries in most of the other tabs in the configure ACM dialog box. The selections in the Parameters, Compass and Average tabs affect the amount of memory usage; the selections in the Average tab also affect the speed in which the memory will fill; and the entries made in the Time tab determine the start date. In addition, the displayed statistics account for the battery type and the planned method of deployment, where these options are selected in the Statistics tab for the purpose of calculating the statistical values only. June 2003 3DACM97 Operating Manual 5-18 SECTION 5: Checking and Configuring the Instruments Statistics Tab Figure 5-9: The configure ACM Dialog Box The statistics displays are the following: Start Date: The date on which the instrument will turn on and begin collecting data. This date is the current date, or if the Delayed option is selected in the Method of Deployment area of the Statistics tab, it is the date entered in the Delayed Date text box in the Time tab. Expected Running Days: The approximate number of days the instrument will remain powered and capable of collecting data, and is based on the selected battery typelithium or alkalineand whether Coastal, which is only available for a 3D-ACM, is selected in the Battery area of the Statistics tab. Caution: Expected Running Days is an approximation of the battery life; hence the instrument’s internal memory can fill before the expected number of running days has been reached. Expected End Date: 3DACM97 Operating Manual The date on which the instrument will no longer be powered and is based on the Expected Running Days. June 2003 SECTION 5: Checking and Configuring the Instruments 5-19 Expected Memory Usage: The amount of the instrument’s internal memory in percent that is expected to be used during the Expected Running Days. Memory Will Fill in: The number of days it will take to fill the instrument’s internal memory. Caution: The instrument’s internal memory can fill before the expected number of running days shown in the Expected Running Days display has been reached. There are three operating modes: Continuous, Delayed and Interval. (See “Modes of Operation” on page 6-1 for information on the operating modes.) The operating mode selected determines the planned method of deployment. Selecting an operating mode in the Method of Deployment area of the Statistics tab only determines the values shown in the statistics displays; it does not determine the actual operating mode. The three method of deployment options are the following: Continuous: Once deployed, the instrument will immediately turn on and begin collecting data continuously. Interval: Once deployed, the instrument will immediately turn on and begin collecting data for the On Time and the Interval Time entered in the Time tab. Delayed: Once deployed, the instrument will turn on and begin collecting data on the date shown in the Start Date display. Data will be collected for the On Time and at the Interval Time entered in the Time tab. Delayed: Once deployed, the instrument will turn on and begin collecting data on the date shown in the Start Date display. Data will be collected for the On Time and at the Interval Time entered in the Time tab. The battery pack type options are only available when a 3D-ACM, including its “Coastal” version, is connected; they are grayed and cannot be selected for a 2D-ACM. The battery pack type options are selected in the Battery area of the Statistics tab and are the following: Lithium: Selected when a lithium battery pack is used in the instrument. Alkaline: Select when an alkaline battery pack is used in the instrument. Coastal: Select when the instrument is the “Coastal” version of the 3D-ACM June 2003 3DACM97 Operating Manual 5-20 SECTION 5: Checking and Configuring the Instruments To review the statistics: 1 Choose Configure ➤ Configure Instrument. After 3DACM97 reads the instrument configuration, the Configure ACM dialog box shown in the Figure 5-3 on page 5-5 opens. 2 Select the Statistics tab. 3 Select the planned method of deployment. 4 Select the battery type used if the instrument is a 3D-ACM, and select Coastal if the instrument is a “Coastal” version. 5 Verify the correct start date in the Start Date display. This date should be the date entered as the Delayed Date in the Time tab when the Delayed option in the Method of Deployment area of the Statistics tab is selected. Otherwise it should be the instrument’s date, which is typically the current date. Note: If the instrument’s date is not correct, see “Setting the Run Times: on page 512 for instructions on how to set the instrument’s time and date. 6 Verify that the expected running days shown in the Expected Running Days display is adequate. 7 Verify that the expected end date shown in the Expected End Date display is adequate. 8 Note the amount of the instrument’s internal memory that will be used in the Expected Memory Usage display. 9 Note how many days it will take to fill the instrument’s internal memory in the Memory will Fill in display. 10 Do one of the following: • Click Save to save your selections and close the Configure ACM dialog box. • Click another tab. • Click Cancel to close the configure ACM dialog box without saving any changed selections. 3DACM97 Operating Manual June 2003 SECTION 5: Checking and Configuring the Instruments 5-21 Configuring a 3D-ACM Wave Configuring a 3D-ACM Wave requires that you make the following settings: • Select the current velocity, pressure and optional instantaneous parameters to be output and stored. • Select the compass and tilt instantaneous parameters to be output and stored, and whether to use them in the current velocity calculations. • Select the vector averages to be output and stored and over what interval. • Select the burst parameters. • Enter the delay time and date, the interval time, and the average and burst on times. • Select the sampling rate. The settings are altogether made in three dialog boxes: the Average Configuration, Burst Configuration and configure Time dialog boxes. All three dialog boxes are opened from the Configure menu. Note: If the instrument has not been checked since starting 3DACM97, the Configure menu items that open the Average Configuration, Burst Configuration and Configure Time dialog boxes are not listed. (See “Checking the Instruments” on page 5-1 for instructions on how to check the instrument.) The Average Configuration Dialog Box Selecting the current velocity, pressure and optional parameters; the compass and tilt parameters; and the current velocity and tilt vector averages to be output and stored by a 3D-ACM Wave is performed using the Average Configuration dialog box shown in Figure 5-10. The Average Configuration dialog box also displays the length in bytes of each data record in the Current Record Length display and the available instrument memory in megabytes in the Memory Size 1 and Memory Size 2 displays, where each memory is a single 32 MB PCMCIA card. To open the Average Configuration dialog box: Choose Configure ➤ Configure Average Configuration. 3DACM97 first reads the current configuration of the instrument while displaying which items are being read, and then it opens the dialog box. Note: If the instrument has not been checked since starting 3DACM97, the Configure Average Configuration item in the Configure menu is not listed. (See “Checking the Instruments” on page 5-1 for instructions on how to check the instrument.) June 2003 3DACM97 Operating Manual 5-22 SECTION 5: Checking and Configuring the Instruments Parameters Tab Figure 5-10: The Average Configuration Dialog Box Selecting the Current Velocity, Pressure and Optional Instantaneous Parameters Selecting the current velocity, pressure and optional parameters to be output and stored by a 3D-ACM Wave is performed using the Parameters tab in the Average Configuration dialog box. The Parameters tab is the one shown in Figure 5-10. All the parameters are instantaneous parametersparameters that are not averaged. Note: The number of selected parameters determines the number of bytes in each data record. The record length in bytes is shown in the Current Record Length display in the Average Configuration dialog box. Note: For a complete mathematical description of the instantaneous parameters, refer to the “3D-ACM Wave Service Manual.” The instantaneous parameter selections are listed below, where the X, Y, and Z Velocity parameters reflect the orientation of the ACM shown in Figure 5-4 on page 5-7. X Velocity: The X component of the current velocity in cm/ sec relative to a reference notch on the velocity head of instrument. Y Velocity: The Y component of the current velocity in cm/ sec relative to a reference notch on the velocity head of instrument. 3DACM97 Operating Manual June 2003 SECTION 5: Checking and Configuring the Instruments 5-23 Z Velocity: The Z component of the current velocity in cm/ sec relative to the longitudinal axis of the instrument. North Velocity: The north/south (+/-) component of the current velocity in cm/sec relative to magnetic north and compensated for the instrument’s tilt. East Velocity: The east/west (+/-) component of the current velocity in cm/sec relative to magnetic north and compensated for the instrument’s tilt. Up Velocity: The up/down (+/-) vertical component of the current velocity in cm/sec relative to true vertical compensated for the instrument’s tilt. Sound Velocity: The sound velocity in water in m/sec. CTD: The CTD outputs of conductivity in mmho/cm, temperature in °C and pressure in dBars. (CTD instrument is optional) Sea Temperature: The water temperature in °C. Pressure: The water pressure in dBars. Battery Voltage: The instrument battery voltage in volts. User A/D Channel 1: The output in counts, from 0 to 4095, of the Channel 1 A/D. You can also select whether you want to record a time stamp with each data record: Record Time in Memory: June 2003 Select to record a time stamp with each data record. 3DACM97 Operating Manual 5-24 SECTION 5: Checking and Configuring the Instruments To select the instantaneous parameters and to select whether to record a time stamp with each data record: 1 Choose Configure ➤ Configure Average Configuration. After 3DACM97 reads the instrument configuration, the Average Configuration dialog box shown in Figure 5-10 on page 5-22 opens. 2 Select the Parameters tab. 3 Select the check boxes for the instantaneous parameters you want to output and store, and clear the check boxes for those you do not. 4 Select the Record Time in Memory check box to record a time stamp with each data record, or clear the check box to not record a time stamp. 5 Do one of the following: • Click Save to save your selections and close the Average configuration dialog box. • Click another tab. • Click Cancel to close the Average configuration dialog box without saving any changed selections. Selecting the Compass and Tilt Instantaneous Parameters Selecting the compass and tilt parameters to be output and stored by a 3D-ACM Wave is performed using the Compass tab in the Average Configuration dialog box. The Compass tab is shown in Figure 5-11. The compass and tilt parameters are instantaneous parametersparameters that are not averaged. In addition, you can select whether to use the compass and tilt parameters in the north, east and up instantaneous current velocity parameter calculations. Note: The number of selected parameters determines the number of bytes in each data record. The record length in bytes is shown in the Current Record Length display in the Average Configuration dialog box. Note: For a complete mathematical description of the compass and tilt parameters, refer to the “3D-ACM Wave Service Manual.” 3DACM97 Operating Manual June 2003 SECTION 5: Checking and Configuring the Instruments 5-25 Figure 5-11: The Average Configuration Dialog BoxCompass Tab The compass and tilt parameter selections are listed below and reflect the orientation of the ACM shown in Figure 5-4 on page 5-7. Compass X: The cosine of the instrument’s X axis rotation (Hx) relative to magnetic north. Compass Y: The cosine of the instrument’s Y axis rotation (Hy) relative to magnetic north. Compass Z: The cosine of the instrument’s Z axis rotation (Hz) relative to magnetic north. Tilt X: The X component of the instrument’s tilt (Tx) in degrees. Tilt Y: The Y component of the instrument’s tilt (Ty) in degrees. Direction (0-360): The instrument’s heading from 0° to 360° relative to magnetic north. You can also select whether to use the compass and tilt parameters in the north, east and up instantaneous current velocity parameter calculations: Use Compass in Velocity Calculation: Use Tilt in Velocity Calculations: June 2003 Select to use the X, & and Z compass parameters Select to use the X and Y tilt parameters 3DACM97 Operating Manual 5-26 SECTION 5: Checking and Configuring the Instruments To select the compass and tilt instantaneous parameters and to select whether to use them in the north, east and up instantaneous current velocity calculations: 1 Choose Configure ➤ Configure Average Configuration. After 3DACM97 reads the instrument configuration, the Average Configuration dialog box shown in Figure 5-10 on page 5-22 opens. 2 Select the Compass tab. 3 Select the check boxes for the compass and tilt instantaneous parameters you want to output and store, and clear the check boxes for those you do not. 4 Select whether you want to use the compass or tilt parameters, or both in the north, east and up current velocity calculations. 5 Do one of the following: • Click Save to save your selections and close the Average Configuration dialog box. • Click another tab. • Click Cancel to close the Average Configuration dialog box without saving any changed selections. Selecting Vector Averaged Current Velocity and Tilt Selecting the current velocity and tilt vector averages to be output and stored by a 3DACM Wave is performed using the Average tab in the Average Configuration dialog box. The Average tab is shown in Figure 5-12. In addition, the averaging interval for the selected current velocity and tilt vector averages is entered in the Average tab. When one or more of the current velocity and tilt vector averages are selected along with an averaging interval, the vector averages and one record of the selected instantaneous parameters are stored at the end of every averaging interval. Hence the instrument’s memory will fill at a slower rate tan it would if no vector averages were selected. Note: Selecting the current velocity and tilt vector averages increases the number of bytes contained in each data record. The record length in bytes is shown in the Current Record Length display in the Average Configuration dialog box. 3DACM97 Operating Manual June 2003 SECTION 5: Checking and Configuring the Instruments 5-27 Figure 5-12: The Average Configuration Dialog BoxAverage Tab The current velocity and tilt vector averages selections are the following: Average North Velocity: The vector averaged north/south (+/-) component of the current velocity in cm/sec relative to magnetic north and compensated for the instrument’s tilt. Average East Velocity: The vector averaged east/west )+/-) component of the current velocity in cm/sec relative to magnetic north and compensated for the instrument’s tilt. Average Up Velocity: The vector averaged up/down (+/-) vertical component of the current velocity in cm/sec relative to true vertical and compensated for the instrument’s tilt. Average Instrument Tilt: The vector average of the instrument’s tilt in degrees. Vector averaging of the selected parameters is performed at specified intervals. The averaging interval is entered in minutes and seconds (mm:ss) in the Average Interval text boxes. The minimum averaging interval is 15 seconds; the maximum, 59 minutes, 59 seconds. June 2003 3DACM97 Operating Manual 5-28 SECTION 5: Checking and Configuring the Instruments Note: If a value for the Average On Time is entered, the Average Interval should be set to an integer number that is evenly divisible into the Average On Time. (See “Setting the Run Times and the Sampling Rate” on page 5-33 for information on the Average On Time.) For example, if the Average On Time is 10 minutes, the Average Interval should be set to 1, 2, 5, or 10 minutes. Otherwise some averaging intervals will be shorter than the Average Interval. To select the current velocity and tilt vector averages and their averaging interval: 1 Choose Configure Configure Average Configuration. After 3DACM97 reads the instrument configuration, the Average Configuration dialog box shown in Figure 5-10 on page 5-22 opens. 2 Select the Average tab. 3 Select the check boxes for the current velocity and tilt vector averages you want to output and store, and clear the check boxes for those you do not. 4 Enter the averaging interval in minutes and seconds (mm:ss) in the Average Interval text boxes. 5 Do one of the following: • Click Save to save your selections and close the Average Configuration dialog box. • Click another tab. • Click Cancel to close the Average Configuration dialog box without saving any changed selections. The Burst Configuration Dialog Box You can configure a 3D-ACM Wave to output and store some parameters at a selectable sampling rate. This is the burst rate, where the burst rate parameters are selected using the Burst Configuration dialog box shown in Figure 5-13. You can configure the instrument to run at the burst rate at specified intervalsthe Interval Time, and for a specified period of timethe Burst On Time. (See “Setting the Run Times and the Sampling Rate” on page 5-33 for information on how to select the sampling rate and enter the Burst On Time and the Interval Time.) 3DACM97 Operating Manual June 2003 SECTION 5: Checking and Configuring the Instruments 5-29 Parameters Tab Figure 5-13: The Burst Configuration Dialog Box The Burst Configuration dialog box also displays the length in bytes of each data record in the Current Record Length display and the available instrument memory in megabytes in the Memory Size 1 and Memory Size 2 displays, where each memory is a single 32 MB PCMCIA card. To open the Burst Configuration dialog box: Choose Configure Configure Burst Configuration. 3DACM97 first reads the current configuration of the instrument while displaying which items are being read, and then it opens the dialog box. Note: If the instrument has not been checked since starting 3DACM97, the Configuration Menu does not list the Configure Burst Configuration item. (See “Checking the Instruments” on page 5-1 for instructions on how to check the instrument. Selecting the Current Velocity, Pressure and Optional Burst Parameters Selecting the current velocity, pressure and optional burst parameters to be output and stored by a 3D-ACM Wave is performed using the Parameters tab in the Burst Configuration dialog box. The Parameters tab is the one shown in Figure 5-13. The burst parameter selections comprise some of the instantaneous parameters described in “Selecting the Current Velocity, Pressure and Optional Instantaneous Parameters” on page 5-22. June 2003 3DACM97 Operating Manual 5-30 SECTION 5: Checking and Configuring the Instruments The burst parameter selections are the following: North Velocity East Velocity Up Velocity CTD Pressure User A/D Channel 1 You can also select whether you want to record a time stamp with each data record: Record Time in Memory: Select to record a time stamp with each data record. To select the current velocity, pressure and optional burst parameters and to select whether to record a time stamp with each data record: 1 Choose Configure Configure Burst Configuration. After 3DACM97 reads the instrument configuration, the Burst Configuration dialog box shown in Figure 5-13 on page 5-29 opens. 2 Select the Parameters tab. 3 Select the check boxes for the burst parameters you want to output and store, and clear the check boxes for those you do not. 4 Select the Record Time in Memory check box to record a time stamp with each data record, or clear the check box to not record a time stamp. 5 Do one of the following: • Click Save to save your selections and close the Burst Configuration dialog box. • Click another tab. • Click Cancel to close the Burst Configuration dialog box without saving any changed selections. 3DACM97 Operating Manual June 2003 SECTION 5: Checking and Configuring the Instruments 5-31 Selecting the Compass and Tilt Burst Parameters Selecting the compass and tilt burst parameters to be output and stored by a 3D-ACM Wave is performed using the Compass tab in the Burst Configuration dialog box. the Compass tab is shown in Figure 5-14. The burst parameter selections comprise some of the instantaneous parameters described in “Selecting the Compass and Tilt Instantaneous Parameters” on page 5-24. In addition, you can select whether to use the compass and tilt parameters in the north, east and up current velocity burst parameter calculations. Compass Tab Figure 5-14: The Burst Configuration Dialog Box The compass and tilt burst parameter selections are the following: Compass X Compass Y Compass Z Tilt X Tilt Y Direction (0-360) June 2003 3DACM97 Operating Manual 5-32 SECTION 5: Checking and Configuring the Instruments You can also select whether to use the compass and tilt parameters in the north, east and up current velocity burst parameter calculations: Use Compass in Velocity Calculation: Use Tilt in Velocity Calculations: Select to use the X, Y and Z compass parameters. Select to use the X and Y tilt parameters. To select the compass and tilt burst parameters and to select whether to use them in the north, east and up current velocity burst parameter calculations: 1 Choose Configure Configure Burst Configuration. After 3DACM97 reads the instrument configuration, the Burst Configuration dialog box shown in Figure 5-13 on page 5-29 opens. 2 Select the Compass tab. 3 Select the check boxes for the compass and tilt burst parameters you want to output and store, and clear the check boxes for those you do not. 4 Select whether you want to use the compass or tilt parameters, or both in the north, east and up current velocity calculations. 5 Do one of the following: • Click Save to save your selections and close the Burst Configuration dialog box. • Click another tab. • Click Cancel to close the Burst Configuration dialog box without saving any changed selections. 3DACM97 Operating Manual June 2003 SECTION 5: Checking and Configuring the Instruments 5-33 The Configure Time Dialog Box You can configure a 3D-ACM Wave to for specified periodsthe Average On Time or the Burst On Time, beginning at the start of specified intervalsthe Interval Time. When running, the instrument is on an collecting dataeither vector averaged data or data collected at the selected sampling rate, which is the burst rate, or both interleaved. In addition, you can configure a 3D-ACM Wave to delay running, hence remain off, until a specified time and datethe Delayed Time and the Delayed Date. These settings, including the sampling rate, are made in the Configure Time dialog box shown in Figure 5-15. In addition, the Configure Time dialog box displays and allows you to set the instrument’s current time and date. Figure 5-15: The Configure Time Dialog Box To open the Configure Time dialog box: Choose Configure ➤ Configure Time 3DACM97 first reads the current configuration of the instrument while displaying which items are being read, and then it opens the dialog box. Note: If the instrument has not been checked since starting 3DACM97, the Configuration Menu does not list the Configure Time item. (See “Checking the Instruments” on page 5-1 for instructions on how to check the instrument.) Setting the Run Times and the Sampling Rate Configuring the run times of a 3D-ACM Wave and setting the instrument’s current time and date and the sampling rate are performed using the configure Time dialog box shown in Figure 5-15. June 2003 3DACM97 Operating Manual 5-34 SECTION 5: Checking and Configuring the Instruments The instrument run times are entered in the following text boxes: Interval Time: The time in hours, minutes and seconds between the start of each Average On Time or Burst On Time. Average On Time: The time in hours, minutes and seconds beginning at the start of each Interval Time during which the instrument is on and collecting the selected vector averaged current velocity and tilt data. This data and one record of the selected instantaneous parameters are output and stored at the end of every averaging interval. Burst On Time: The time in hours, minutes and seconds beginning at the start of each Interval Time during which the instrument is on and collecting the selected burst parameter data at the selected sampling rate. All data are output and stored. Note: If the Interval Time is set to zero, or if the Average On Time or the Burst On Time is greater than the Interval Time, the instrument will begin collecting data continuously when it is turned on or at the specified Delayed Time and Delayed Date, as described below, after it is turned on. Note: If one or more of the current velocity and tilt vector averages are selected and a value for Average Interval is entered, the Average On Time should be set to an integer number that is evenly divisible by the Average Interval. (See “Selecting Vector Averaged Current Velocity and Tilt: on page 5-26 for information on the Average Interval.) For example, if the Average Interval is 5 minutes, the Average On Time should be set to 5, 10, 15 or any multiple of 5 minutes. Otherwise some averaging intervals will be shorter than the Average Interval. Delayed Date: The date on which the instrument will turn on and begin collecting data at the Delayed Time. Delayed Time: The time of day on the Delayed Date the instrument will turn on and begin collecting data. 3DACM97 Operating Manual June 2003 SECTION 5: Checking and Configuring the Instruments 5-35 To set the run times and the sampling rate: 1 Choose Configure ➤ Configure Time. After 3DACM97 reads the instrument configuration, the Configure Time dialog box shown in Figure 5-15 on page 5-33 opens. 2 Enter the Interval Time in hours, minutes and seconds (hh:mm:ss) in the Interval Time text box. 3 Enter the Average On Time in hours, minutes and seconds (hh:mm:ss) in the Average On Time text box. Be sure it is at least five seconds less than the Interval Time entered in Step 2. 4 Enter the Burst On Time in hours, minutes and seconds (hh:mm:ss) in the Burst On Time text box. Be sure it is at least five seconds less than the Interval Time entered in Step 2. 5 Enter the Delayed Date as the month, day and year (mm--dd-yyyy) in the Delayed Date text box. 6 Enter the Delayed Time in hours, minutes and seconds (hh:mm:ss) in the Delayed Time text box. 7 Select the sampling rate. 8 Do one of the following: • Click Save to save your selections and close the Configure Time dialog box. • Click another tab. • Click Cancel to close the Configure Time dialog box without saving any changed selections. The Time Tab also displays the instrument’s current time and date in the Instrument Time and Instrument Date displays. Caution: The displayed time and date is that which was read by 3DACM97 from the instrument when the instrument was checked. It is not updated while the dialog box is open. However, the time and date can be set using the Enter Local Time and Date dialog box as described below. June 2003 3DACM97 Operating Manual 5-36 SECTION 5: Checking and Configuring the Instruments To set the instrument’s time and date: 1 Choose Configure ➤ Configure Time. After 3DACM97 reads the instrument configuration, the Configure Time dialog box shown in Figure 5-15 on page 5-33 opens. 2 Click Set. The Enter Local Time and Date dialog box opens: Caution: The displayed time and date in the Enter Local Time and Date dialog box is that which was read by 3DACM97 from the computer on which 3DACM97 is running when the dialog box was opened. It is not updated while the dialog box is open. 3 Do one of the following: • Click OK to accept the displayed time and date, which was acquired from the computer on which 3DACM97 is running, and close the Enter Local Time and Date dialog box. • Enter a time in hours, minutes and seconds (hh:mm:ss) in the Time text box and a date as the month, day and year (mm-dd-yyyy) in the Date text box. Then click OK to save the new time and date and close the Enter Local Time and Date dialog box. • Click Cancel to close the Enter Local Time and Date dialog box without changing the time and date. The new time and date is shown in the Instrument Time and Instrument Date displays in the Configure Time dialog box. 4 Click Save to save the entered time to the instrument and close the configure Time dialog box, or click Cancel to close the dialog box without saving the entered time. 3DACM97 Operating Manual June 2003 SECTION 5: Checking and Configuring the Instruments 5-37 Saving the Instrument Configuration to a File Once you configure an ACM, you can save the instrument configuration to a file. When saved, you can open the instrument configuration file to configure the instrument with the saved settings instread of configuring the instrument manually. (See “Configuring an Instrument from a Saved File: on page 5-38 for instructions on how to open the configuration file and configure the instrument.) To save the instrument configuration to a file: 1 Choose File ➤ Save. The Save As dialog box for ACM files shown in Figure 5-16 opens. This dialog box is used to create the file in which to save the configuration settings. Figure 5-16: The Save As Dialog Box for ACM Files 2 Click the arrow in the Save in drop-down list box and select the folder in which to save the instrument configuration file. 3 In the File name text box enter the name of the file in which to save the configuration settings. The extension.acm is added automatically. 4 Click Save to save the configuration settings to the specified file and close the Save As dialog box for ACM files, or click Cancel to close the dialog box without saving the settings. June 2003 3DACM97 Operating Manual 5-38 SECTION 5: Checking and Configuring the Instruments Configuring an Instrument from a Saved File 3DACM97 allows you to open an ACM configuration file, a file with extension .acm that contains instrument configuration settingss. Once the file is opened, you can configure the instrument with the settings in the file. (See “Saving the Instrument Configuration to a File” on page 5-37 for instructions on how to save the instrument configuration to a file.) To open an instrument configuration file and configure the instrument: 1 Choose File ➤ Open. The Open dialog box for ACM files shwon in Figure 5-17 opens. Although more than one file may be displayed, the example in the figure shows a single file of filename 3D-ACM Wave Config.acm. If the file you want to open is not visible, it may be in a different folder than the one shown. In this case, click the arrow in the Look in drop-down list box and select the folder in which the file is located. Figure 5-17: The Open Dialog Box for ACM Files 2 Click the file you want open, and then click Open. For a 2D-ACM or 3D-ACM, the Configure ACM dialog box shown in Figure 5-3 on page 5-5 opens to the Parameters tab; for a 3D-ACM Wave, the Average configuration dialog box shown in Figure 5-10 on page 5-22 opens. 3 Click Save to close the Configure ACM or Average Configuration dialog box and configure the instrument, or click Cancel to close the dialog box without configuring the instrument. 3DACM97 Operating Manual June 2003 SECTION 5: Checking and Configuring the Instruments 5-39 Printing the Configuration File Once you have configured an ACM, either manually or from a saved file, the configuration file can be printed. To print an ACM configuration file: 1 Choose File ➤ Print Configuration. The Print dialog box opens. 2 Select the printer to use, and then click OK. The ACM configuration file is printed. An example of a printed 3D-ACM Wave configuration file is shown in Figure 5-18. June 2003 3DACM97 Operating Manual 5-40 SECTION 5: Checking and Configuring the Instruments Figure 5-18: Example 3D-ACM Wave Configuration File Printout 3DACM97 Operating Manual June 2003 Section 6:Deploying the Instruments O nce you have checked and configured an ACM, you can deploy the instrument under its own internal battery power and store all the data to the instrument’s internal memory for later retrieval. (See “SECTION 5: Checking and Configuring the Instruments,” for instructions on how to check and configure the instruments.) This section describes the various modes of operation in which the instruments can run under their own internal battery, and provides instructions on how to prepare the instruments for deployment. Caution: Before deploying an ACM, refer to the “3D-ACM and Coastal 3D-ACM Service Manual” for some important deployment considerations regarding near surface and near bottom fixed platform and moored installations. Similarly; for a 3DACM Wave refer to the “3D-ACM Wave Service Manual.” Modes of Operation Before you deploy and ACM under its own internal battery power, you must decide which method of deployment to use. The method of deployment is determined by which of the available modes of operation is selected. The 2D-ACM and 3D-ACM have three operating modes. The 3D-ACM Wave, however, has both running and operating modes, where each running mode functions with one or more operating modes. The 2D-ACM’s and the 3D-ACM’s three operating modes are the following: Continuous operating mode Interval operating mode Delayed operating mode The 3D-ACM Wave has three similarly named running modes: Continuous running mode Interval running mode Delayed running mode June 2003 3DACM97 Operating Manual 6-2 SECTION 6: Deploying the Instruments And each running mode functions with one or more of three operating modes: Average operating mode Burst operating mode Average and Burst Interleaved operating mode The different modes of operation allow you to deploy an instrument under its own battery power in a way that makes the most efficient use of the available memory and maximizes the battery life. 2D-ACM and 3D-ACM Modes of Operation The 2D-ACM and 3D-ACM have three operating modes: Continuous mode where the instrument continuously stores the selected current velocity and tilt vector averages and one record of the selected instantaneous parameters at the end of every averaging interval. Interval mode where the instrument stores the selected current velocity and tilt vector averages and one record of the selected instantaneous parameters at the end of every averaging interval for the On Time beginning at the start of every time interval. Delayed mode where the instrument commences the Interval mode beginning at the Delayed Time on the Delayed Date. Note: For any mode, if the Average Interval is less than 15 seconds, or if no current velocity or tilt vector averages are selected, or both, the selected instantaneous parameter data are stored at the 2Hz sampling rate of the instrument. Any selected vector averages are not stored. Note: For Delayed mode, if the Interval Time is zero, or if the On Time is greater than the Interval Time, the instrument commences Continuous mode beginning at the Delayed Time on the Delayed Date. 3D-ACM Wave Modes of Operation The 3D-ACM Wave has eight modes of operation where each comprises both a running mode and an operating mode: Average where the instrument continuously stores the Continuous mode selected current velocity and tilt vector averages and one record of the selected instantaneous parameters at the end of every averaging interval. 3DACM97 Operating Manual June 2003 SECTION 6: Deploying the Instruments 6-3 Burst where the instrument continuously stores the selected Continuous mode burst parameter data at the selected sampling rate. Average where the instrument stores the selected current velocity Interval mode and tilt vector averages and one record of the selected instantaneous parameters at the end of every averaging interval for the Average On Time beginning at the start of every time interval. Burst where the 3D-ACM Wave continuously stores the selected Interval mode burst parameter data at the selected sampling rate for the Burst On Time beginning at the start of every time interval. Average and Burst Interleaved where the instrument operates in Interval mode Interval modeAverage for a specified number of time intervals, and then beginning at the start of the next time interval and for that time interval only, stores the selected burst parameter data at the selected sampling rate for the Burst On Time. This cycle repeats continuously. Average where the instrument commences the Interval Delayed mode modeAverage beginning at the Delayed Time on the Delayed Date. Burst where the instrument commences the Interval modeBurst, Delayed mode beginning at the Delayed Time on the Delayed Date. Average and Burst Interleaved where the instrument commences Delayed mode the Interval modeAverage and Burst Interleaved beginning at the Delayed Time on the Delayed Date. Note: For any Average operating mode, including Average and Burst Interleaved, if the Average Interval is less than 15 seconds, or if no current velocity or tilt vector averages are selected, or both, the selected instantaneous parameter data are stored at the selected sampling rate. Any selected vector averages are not stored. Note: For all Delayed running modes, if the Interval Time is zero, or if the Average On Time or burst On Time is greater than the Interval Time, then beginning at the Delayed Time on the Delayed Date the instrument commences Continuous modeAverage if Average is selected for the operating mode or Continuous modeBurst if Burst is selected for the operating mode. June 2003 3DACM97 Operating Manual 6-4 SECTION 6: Deploying the Instruments Preparing the Instruments for Deployment After an ACM has been checked and configured, it can be deployed under its own internal battery power and the data stored to the instrument’s memory for later retrieval. (See “SECTION 5: Checking and Configuring the Instruments,” for instructions on how to check and configure the instruments.) Caution: Before deploying a 2D-ACM or 3D-ACM, refer to the “3D-ACM and Coastal 3D-ACM Service Manual” for some important deployment considerations regarding near surface and near bottom fixed platform and moored installations. In addition, the service manual also contains information on the expected battery life for the different running and operating modes as well as the effect on the battery life when optional instrumentation is installed. Similarly, for a 3D-ACM Wave refer to the “3DACM Wave Service Manual.” Preparing a 2D-ACM or 3D-ACM for Deployment Once checked and configured, a 2D-ACM or 3D-ACM can be prepared for deployment. However, before deploying the instrument, check and, if necessary, replace the battery pack. (See “SECTION 9: Replacing the Battery Packs,” for instructions on how to check and replace the battery pack.) Note: Because a 3D-ACM includes a lithium battery for memory backup and both the 2D-ACM and 3D-ACM each include two lithium batteries for the real time clock (RTC), which provides the instrument’s time and date, replacing the battery pack will not affect the instrument’s configuration, stored data or time and date settings. However, the lithium batteries must be able to provide the required power. Refer to the “3D-ACM and Coastal 3D-ACM Service Manual” for information on the lithium batteries and how to replace them. To prepare a 2D-ACM or 3D-ACM for deployment: 1 Connect the 2D-ACM or 3D-ACM to your computer’s serial port and switch the KS switch on the test cable to KS ON. 2 Choose Start ➤ Programs ➤ FSI Applications ➤ 3DACM97. 3DACM97 starts and the 3DACM97 Main window opens. 3 Choose Configure ➤ Check Instrument. 3DACM97 displays which items are being checked during the check instrument process and then displays a graphics of a 2D-ACM or 3D-ACM. 4 Do one of the following: 3DACM97 Operating Manual June 2003 SECTION 6: Deploying the Instruments 5 6-5 • Open an instrument configuration file as described in “Configuring an Instrument from a Saved File” on page 5-38. • Configure the instrument as described in “Configuring a 2D-ACM or 3D-ACM” on page 5-4. Choose Deploy. A Question window opens asking if you want to initialize memory logging: 6 Click Yes if you want to initialize memory logging, or click No if you do not. If you click Yes, 3DACM97 resets the Logging Pointer so that the parameter data will be stored to the instrument’s internal memory beginning at the first memory location. If you click No, the Logging Pointer is not reset and the parameter data will be appended to the data previously stored. The Select Operating Mode window opens: 7 Do one of the following: • Select Continuous, and then click OK to start running the instrument in the Continuous mode. • Select Interval, and then click OK to start running the instrument in the Interval mode. • Select Delayed, and then click OK to start running the instrument in the Delayed mode. • Click the Close button to close the Select Operating Mode dialog box without running the instrument. June 2003 3DACM97 Operating Manual 6-6 SECTION 6: Deploying the Instruments If you click OK, one of three windows opens: the Run Continuous Mode window if Continuous is selected; the Run Interval Mode window if Interval is selected; or the Run Delayed Mode window if Delayed is selected. 8 Click OK, remove the test cable and install the dummy plug. The instrument continues to run in the selected mode and is ready to be deployed. Caution: If you are not deploying the instrument and only want to verify that it is acquiring and storing data, you can leave the test cable connected. However, you must switch the KS switch on the test cable to KS OFF to ensure that the selected operating mode functions correctly. 3DACM97 Operating Manual June 2003 SECTION 6: Deploying the Instruments 6-7 Preparing a 3D-ACM Wave for Deployment Once checked and configured, a 3D-ACM Wave can be prepared for deployment. However, before deploying the instrument, check and if necessary, replace the battery pack. (See “SECTION 9: Replacing the Battery Pack,” for instructions on how to check and replace the battery pack.) Note: Because a 3D-ACM Wave uses PCMICIA cards for memory and a lithium battery for the real time clock (RTC), which provides the instrument’s time and date, replacing the battery pack will not affect the instrument’s configuration, stored data or time and date settings. However, the lithium battery for the RTC must be able to provide the required power. Refer to the “3D-ACM Wave Service Manual” for information on the lithium battery and how to replace it. To prepare a 3D-ACM Wave for deployment: 1 Connect the 3D-ACM Wave to your computer’s serial port and switch the KS switch on the test cable to KS ON. 2 Choose Start ➤ Programs ➤ FSI Applications ➤ 3DACM97. 3DACM97 starts and the 3DACM97 Main window opens. 3 Choose Configure ➤ Check Instrument. 3DACM97 displays which items are being checked during the check instrument process and then displays a graphic of a 3D-ACM Wave. 4 5 Do one of the following: • Open an instrument configuration file as described in “Configuring an Instrument from a Saved File” on page 5-38. • Configure the instrument as described in “Configuring a 3D-ACM Wave” on page 5-21. Choose Run Instrument Deploy The Deploy window opens: June 2003 3DACM97 Operating Manual 6-8 6 SECTION 6: Deploying the Instruments Do one of the following: • Select Continuous and Average, and then click OK to start running the instrument in Continuous modeAverage. • Select Continuous and Burst, and then click OK to start running the instrument in Interval modeAverage. • Select Interval and Average, and then click OK to start running the instrument in Interval modeAverage. • Select Interval and Burst, and then click OK to start running the instrument in Interval modeBurst. • Select Interval and Average and Burst, and enter the number of intervals in which to average the data between bursts in the Average for text box. Then click OK to start running the instrument in Interval modeAverage and Burst Interleaved. • Select Delayed and Average, and then click OK to start running the instrument in Delayed modeAverage. • Select Delayed and Burst, and then click OK to start running the instrument in Delayed modeBurst. • Select Delayed and Average and Burst, and enter the number of intervals in which to average the data between bursts in the Average for text box. Then click OK to start running the instrument in Delayed modeAverage and Burst Interleaved. • Click Cancel to close the Select Operating Mode window without running the instrument. 3DACM97 Operating Manual June 2003 SECTION 6: Deploying the Instruments 6-9 If you click OK, the Clear Memory window opens: Click Yes if you want to initialize memory logging, or click No if you do not. If you click Yes, 3DACM97 clears the instrument’s internal memory. This process takes several minutes during which the Initialize Memory window opens: 7 If you click No, the memory is not cleared and the parameter data will be appended to the data previously recorded. One of three windows opens: the Run Continuous Mode window if Continuous is selected; June 2003 3DACM97 Operating Manual 6-10 SECTION 6: Deploying the Instruments the Run Interval Mode window if Interval is selected; or the Run Delayed Mode window if Delayed is selected. 8 Click OK, remove the test cable and install the dummy plug. The instrument continues to run in the selected mode and is ready to be deployed. Caution: If you are not deploying the instrument and only want to verify that it is acquiring and storing data, you can leave the test cable connected. However, you must switch the KS switch on the test cable to KS OFF to ensure that the selected operating mode functions correctly. Changing the Mode of Operation After an ACM has been prepared for deployment and the test cable has been removed, it will remain in the selected mode until the battery is disconnected. To change the selected mode for a 2D-ACM or 3D-ACM, repeat the instructions in “Preparing a 2DACM or 3D-ACM for Deployment” on page 6-4; for a 3D-ACM Wave, the instructions in “Preparing a 3D-ACM Wave for Deployment” on page 6-7. However, when choosing check Instrument from the Configure menu, a menu, a Question window opens asking if you want to stop deployment: 3DACM97 Operating Manual June 2003 SECTION 6: Deploying the Instruments 6-11 If you want to change the mode of operation and redeploy the instrument, click Yes. 3DACM97 will check the instrument and stop the deployment. Click No if you want the instrument to remain in the selected mode. Checking the Delayed Time and Date Settings When a 2D-ACM or 3D-ACM has been deployed in Delayed mode, or a 3D-ACM Wave has been deployed in Delayed modeAverage, Delayed modeBurst or Delayed modeAverage and Burst Interleaved, you can check the Delayed Time and Delayed Date settings of the instrument at any time. Caution: Do not attempt to check the Delayed Date and Delayed Time settings by choosing Check Instrument or Configure Instrument from the Configure menu, as doing so requires that you stop the deployment. To check the Delayed Time and Delayed Date settings: 1 2 Connect the ACM to your computer’s serial port and switch the KS switch on the test cable to KS ON. Choose Start ➤ Programs ➤ FSI Applications ➤ 3DACM97. 3DACM97 starts and the 3DACM97 Main window opens. 3 Choose Configure ➤ Check Delayed Start. The Test Cable window opens: 4 Click OK. 3DACM97 displays which items are being checked and then opens the Delayed Start OK window: June 2003 3DACM97 Operating Manual 6-12 SECTION 6: Deploying the Instruments 16 After verifying the time and date information in the Delayed Start OK window, click Yes to go back to the selected mode. Or click No if you want to reconfigure or redeploy the instrument. If you click No, see “SECTION 5: Checking and Configuring the Instruments” if you want to reconfigure the instrument or “Preparing the Instruments for Deployment” on page 6-4 if you want to redeploy the instrument. If you click Yes, the Delayed Start Pass window opens: 6 Switch the KS switch to KS OFF, remove the test cable, and then Click OK. The instrument continues to run in the selected mode and is ready to be deployed. Caution: If you are not deploying the instrument and only want to verify that it is acquiring and storing data, you can leave the test cable connected. However, you must switch the KS switch on the test cable to KS OFF to ensure that the selected operating mode functions correctly. 3DACM97 Operating Manual June 2003 7-1 Section 7: Acquiring and Viewing Real-Time Data A fter an ACM has been checked and configured, it can be run directly from the test cable. (See “SECTION 5: Checking and Configuring the Instruments,” for instructions on how to check and configure the instruments.) Or the test cable can be replaced with a mooring cable, where the maximum length of the cable depends on the selected baud rate of the instrument. In both these configurations data can be acquired, viewed and savedall in real time, but only in Continuous mode: the Interval and Delayed modes are not available for real-time data acquisition. Viewing is either on a digital display (2D-ACM and 3D-ACM only or on a graphics display, and recording is directly to a text file or to the instrument’s internal memory or to both. In addition, for the 3D-Wave only, an additional six displays are provided for viewing current velocity, current speed and pressure data, also in real time. Data can also be saved to a text file or to the instrument’s internal memory. Note: Refer to the “3D-ACM and Coastal 3D-ACM Service Manual: or the “3D-ACM Wave Service Manual” for important information on the required external power supply, maximum mooring cable lengths and other important information regarding installations that use a direct connection to the instrument. Real-Time Acquisition Digital and Graphics Displays 3DACM97 provides a digital display for viewing real-time data from a 2D-ACM or a 3DACM. The digital display allows you to view instantaneous and average current velocities and current speed in cm/sec or knots, sea temperature, sea pressure, sound velocity and compass and CTD data, all on one display. In addition, 3DACM97 provides a graphics display for viewing real-time data from any ACM. The graphics display provides a combination of analog and digital displays of battery voltage, A/D channels, instrument time and other information. You can also change the graphics display settings such as full scale ranges and the colors of the needles in the analog displays. See “Changing the graphics Display Settings” on page 7-9 for instructions on how to change the graphics display. June 2003 3DACM97 Operating Manual 7-2 SECTION 7: Acquiring and Viewing Real-Time Data Viewing the Digital Display and Saving Data from a 2D-ACM or 3DACM Once configured, a 2D-ACM or 3D-ACM can be run and the parameter data acquired in real time while viewing the data on a digital display and saving the data to a text file or to the instrument’s internal memory or to both. When the text file is opened in a text editor, the data are listed under the parameter names. To commence data acquisition, and to view the digital display and save the data: 1 Choose Run Instrument ➤ Continuous Data Mode. The Log Data window opens: Click Yes if you want to save data to a file, or click No if you no not. If you click Yes, the Save As dialog box for log files shown in Figure 7-1 opens. This dialog box is used to create the file in which to save the parameter data. If you click No, a Log Data window opens asking if you want to record data to the instrument’s internal memory. Clicking either Yes or No in the Log Data window opens the ACM Run Continuous Mode window shown in Figure 7-2 on page 7-4. Figure 7-1: The Save As Dialog Box for Log Files 3DACM97 Operating Manual June 2003 SECTION 7: Acquiring and Viewing Real-Time Data 7-3 3 Click the arrow in the Save in drop-down list box and select the folder in which to save the parameter data file. 4 In the File name text box enter the name of the file in which to save the data. The extension is added automatically. 5 Click Save to create the file in which to save the data and close the Save As dialog box for log files, or click Cancel to close the dialog box without creating the file. If you click Save, a Log Data window opens asking if you want to record data to the instrument’s internal memory. Clicking either Yes or No in the Log Data window opens the Deployment Information window: If you click Cancel, a Log Data window opens asking if you want to record data to the instrument’s internal memory. Clicking either Yes or No in the Log Data window opens the ACM Run Continuous Mode window shown in Figure 7-2. 6 Enter the deployment information in the Deployment Information window. The deployment information is saved in the text file along with data. 7 Click OK to save the entries and close the Deployment Information window, or click Cancel to close the window without saving the entries. Note: Regardless whether you click OK or Cancel, the time and date at the start of data acquisition and the serial number of the instrument are saved. June 2003 3DACM97 Operating Manual 7-4 SECTION 7: Acquiring and Viewing Real-Time Data Figure 7-2: The ACM Run Continuous Mode Window The ACM Run Continuous Mode window displays in real time the data for all the parameters selected in the Parameters, Compass and average tabs in the Configure ACM dialog box. (See “SECTION 5: Checking and Configuring the Instruments,” for the parameter descriptions and units of measure.) Those parameters that have not been selected are displayed as “OFF.” The displays are updated at the end of every averaging interval. However, if the Average Interval is less than 15 seconds, or if no current velocity or tilt vector averages are selected or both, the displays are updated every second. Note: If the Average Interval is less than 15 seconds, zero is displayed for any selected current velocity or tilt vector averages and is saved to the text file or to the instrument’s internal memory or to both. 3DACM97 Operating Manual June 2003 SECTION 7: Acquiring and Viewing Real-Time Data 7-5 In addition to the parameter displays, the following displays are provided: Next Data Frame: Displays the number of seconds remaining before the end of the averaging interval. Note: If the Average Interval is less than 15 seconds, the Next Data Frame display is not shown. If the Average Interval is 15 seconds or greater and no current velocity or tilt vector averages are selected, the Next Data Frame displays the averaging interval in seconds. Logged Time and Date: Displays the instrument’s time and date in real time. Log Filename: Displays the name of the file in which the parameter data are being saved. Knots: Select to display velocity data in knots. Use up Velocities in Calculations: Select to include Up Velocity, along with North Velocity and East Velocity, in the current speed calculations. To close the ACM Continuous Mode window and to continue or stop data acquisition: 1 Click close. The ACM Continuous Mode window closes and the Running window opens: 2 Click Yes if you want to leave the instrument running. If you click Yes, the instrument continues to run while saving the selected parameter data to the text file or to the instrument’s internal memory or to both. If you click No, the instrument stops running. June 2003 3DACM97 Operating Manual 7-6 SECTION 7: Acquiring and Viewing Real-Time Data Viewing the Graphics Display and Saving Data from a 2D-ACM, 3DACM or 3D-Wave Once configured, an ACM can be run and the parameter data acquired in real time while viewing the data on a graphics display and saving the data to a text file or to the instrument’s internal memory or to both. When the text file is opened in a text editor, the data are listed under the parameter names. To commence data acquisition, and to view the graphics display and save the data: 1 Choose Run Instrument ➤ Graphics Mode. The Log Data window opens: 2 Click Yes if you want to save data to a file, or click No if you do not. If you click Yes, the Save As dialog box for log files shown in Figure 7-1 on page 7-2 opens. This dialog box is used to create the file in which to save the parameter data. If you click No, a Log Data window opens asking if you want to record data to the instrument’s internal memory. Clicking either Yes or No in the Log Data window opens the graphics display shown in Figure 7-3 on page 7-8. 3 Click the arrow in the Save in drop-down list box and select the folder in which to save the parameter data file. 4 In the File name text box enter the name of the file in which to save the data. The extension .dat is added automatically. 5 Click Save to create the file in which to save the data and close the Save As dialog box for log files, or click Cancel to close the dialog box without creating the file. If you click Cancel, a Log Data window opens asking if you want to record data to the instrument’s internal memory. Clicking either Yes or No in the Log Data window opens the graphics display shown in Figure 7-3 on page 7-8. If you click Save, the Deployment Information window opens: 3DACM97 Operating Manual June 2003 SECTION 7: Acquiring and Viewing Real-Time Data 6 7-7 Enter the deployment information in the Deployment Information window. The deployment information is saved in the text file along with the data. 7 Click OK to save the entries and close the Deployment Information window, or click Cancel to close the window without saving the entries. Note: Regardless whether you click OK or Cancel, the time and date at the start of data acquisition and the serial number of the instrument are saved. Clicking OK or Cancel opens a Log Data window asking if you want to record data to the instrument’s internal memory. Clicking either Yes or No in the Log Data window opens the graphics display shown in Figure 7-3 on page 7-8. The graphics display displays in real time the data for all the parameters selected in the Parameters, Compass and Average tabs in the Configure ACM dialog box for a 2D-ACM and 3D-ACM. For a 3D-ACM Wave the parameters selected in the Parameters and Compass tabs in the Burst Configuration dialog box are displayed. (See “SECTION 5: Checking and Configuring the Instruments,” for the parameter descriptions and units of measure.) Those parameters that have not been selected are displayed as “OFF” in the Parameters area of the graphics display or zero in the analog displays. For a 2D-ACM and 3D-ACM the displays are updated at the end of every averaging interval. However, if the Average Interval is less than 15 seconds, or if no current velocity or tilt vector averages are selected or both, the displays are updated every second. For a 3D-ACM Wave the displays are updated every second only. Note: for a 3D-ACM Wave the Current Time, Current Date, Next Time, and Next Date displays are not applicable for the burst parameter data and therefore are not shown. June 2003 3DACM97 Operating Manual 7-8 SECTION 7: Acquiring and Viewing Real-Time Data Figure 7-3: The Graphics Display In addition to the parameter displays, and for a 2D-ACM and 3D-ACM only, the following time and date displays, which are based on the set time and date of your computer, are provided: Current Time: Displays the time the last averaging interval ended. Current Date: Displays today’s date. Next Time: Displays the time the next averaging interval will start. Next Date: Displays the date the next averaging interval will start. Note: If the Average Interval is less than 15 seconds, the Current Time, Current Date, Next Time and Next Date displays are not shown. The time and date displays, which are based on the set time of the instrument, are also provided: Instrument Time: Displays the instrument time. Instrument Date: Displays the instrument date. 3DACM97 Operating Manual June 2003 SECTION 7: Acquiring and Viewing Real-Time Data 7-9 To close the graphics display and to continue or stop data acquisition: 1 Click Run Instrument ➤ End Graphics Mode. The graphics display closes and the Instrument Running window opens: 2 Click Yes if you want to leave the instrument running. If you click Yes, the instrument continues to run while saving the selected parameter data to the text file or to the instrument’s internal memory or to both. If you click No, the instrument stops running. Changing the Graphics Display Settings 3DACM97 allows you to change the full scale ranges and the needle colors of all the analog displays in the graphics display. The displays are organized into three groups: Velocity, Tilt and Speed, and Direction. Changing the Velocity Display Settings To change the settings of the Velocity displays: 1 Double-click anywhere in any one of the three Velocity displays. The Velocity Settings dialog box shown in Figure 7-4 opens. 2 In the Left Meter area of the Velocity Settings dialog box, enter the full scale range of the Velocity North display in the Maximum Velocity text box. 3 In the Left Meter area click the down arrow in the Needle Color drop-down list box and select a color for the display’s needle. 4 Repeat Steps 2 and 3 in the Center and Right Meter areas for the Velocity East and Velocity Up displays, respectively. 5 Click OK to save your changes and close the Velocity Settings dialog box, or click Cancel to close the dialog box without saving any changes. June 2003 3DACM97 Operating Manual 7-10 SECTION 7: Acquiring and Viewing Real-Time Data Figure 7-4: The Velocity Settings Dialog Box Changing the Tilt Display Settings To change the settings of the Tilt displays: 1 Double-click anywhere in either of the two Tilt displays. The Tilt settings dialog box shown in Figure 7-5 opens. Figure 7-5: The Tilt Settings Dialog Box 2 In the X Tilt area of the Tilt Settings dialog box, enter the full scale range of the X Tilt display in the Maximum Tilt text box. 3 In the X Tilt area click the down arrow in the Needle Color drop-down list box and select a color for the display’s needle. 4 Repeat Steps 2 and 3 in the Y Tilt area for the Y Tilt display. 5 Click OK to save your changes and close the Tilt Settings dialog box, or click Cancel to close the dialog box without saving any changes. 3DACM97 Operating Manual June 2003 SECTION 7: Acquiring and Viewing Real-Time Data 7-11 Changing the Speed and Direction Display Settings To change the settings of the Speed and Direction display: Double-click anywhere in the Speed and Direction display. The Speed and Direction Settings dialog box shown in Figure 7-6 opens. Figure 7-6: The Speed and Direction Settings Dialog Box 2 In the Maximum Magnitude text box, enter the full scale range of the Speed and Direction display. 3 In the Needle Color area of the Speed and Direction Settings dialog box, click the down arrow in the 0 to 39% drop-down list box and select a color for the display’s needle. The color of the needle in the Speed and Direction display will be the selected color when the displayed speed and direction is anywhere in the range 0 to 39% of the Maximum Magnitude entered in Step 2. 4 Repeat Step 3 for the 40 to 79% and 80 to 100% drop-down list boxes. The color of the needle in the Sped and Direction display will be the selected color when the displayed speed and direction is within the corresponding range of the Maximum Magnitude. 5 Click OK to save the new graph setup and close the Speed and Direction Settings dialog box, or click Cancel to close the dialog box without saving the new setup. June 2003 3DACM97 Operating Manual 7-12 SECTION 7: Acquiring and Viewing Real-Time Data Real-Time Acquisition 3D-ACM Wave Graphics Displays 3DACM97 provides six graphics displays specifically designed for viewing real-time data from a 3D-ACM Wave: Time Series, Speed and Direction, Progressive Vector, Distribution, Pressure Analysis, and Wave Direction. The graphics displays can be viewed only during real-time data acquisition, and the data can be simultaneously saved to a text file or to the instrument’s internal memory or to both. The graph scales, the colors of the plots and graph backgrounds, and various other graphics displays settings can be changed from the default or previous setup. See “Setting up the 3D-ACM Wave Graphics Displays” on page 7-20 for instructions on how to set up the graphics displays. Viewing the Graphics Displays and Saving Data from a 3D-ACM Wave Once configured, a 3D-ACM Wave can be run and the parameter data acquired in real time while viewing the data on a graphics display and saving the data to a text file or to the instrument’s internal memory or to both. When the text file is opened in a text editor, the data are listed under the parameter names. The graph plots are updated once a second; however, all the selected parameter data are saved. Note: Although all the selected parameter data are saved, only the selected burst parameters are plotted. (See “Selecting the Current Velocity, Pressure and Optional Burst Parameters” on page 5-29 for instructions on how to select the burst parameters.) To commence data acquisition, and to view the graphics displays and save the data: 1 Choose Run Instrument Real-Time Wave Acquisition. The Log Data window opens: 2 Click Yes if you want to save data to a file, or click No if you do not. 3DACM97 Operating Manual June 2003 SECTION 7: Acquiring and Viewing Real-Time Data 7-13 If you click Yes, the Save As dialog box for log files shown in Figure 7-1 on the page 7-2 opens. This dialog box is used to create the file in which to save the parameter data. If you click No, a Log Data window opens asking if you want to record data to the instrument’s internal memory. Clicking either Yes or No in the Log Data window opens the Time Series graphics display shown in Figure 7-8 on page 7-15. Click the arrow in the Save in drop-down list box and select the folder in which to save the parameter data file. In the File name text box enter the name of the file in which to save the data. The extension .dat is added automatically. Click Save to create the file in which to save the data and close the Save As dialog box for log files, or click Cancel to close the dialog box without creating the file. The Deployment Information window opens: 6 Enter the deployment information in the Deployment Information window. The deployment information is saved in the text file along with the data. 7 Click OK to save the entries and close the Deployment Information window, or click Cancel to close the window without saving the entries. Note: Regardless whether you click OK or Cancel, the time and date at the start of data acquisition and the serial number of the instrument are saved. June 2003 3DACM97 Operating Manual 7-14 SECTION 7: Acquiring and Viewing Real-Time Data A Log Data window opens asking if you want to record data to the instrument’s internal memory. Clicking either Yes or No in the Lot Data window opens the Time Series graphics display shown in Figure 7-8 on page 7-15. To open any of the other available displays, click the corresponding option button in the upper left corner of the Time Series graphics display. You can set up any of the graphics displays to provide depth correction to compensate for wave frequency attenuation as a function of the depth of the 3D-ACM Wave. The setup is done in the Depth Settings dialog box shown in Figure 7-7. The Depth Settings dialog box is opened by clicking Depth in any of the graphics displays. Figure 7-7: The Depth Settings Dialog Box To set up the depth correction: 1 Click Depth in the graphics display. The Depth Settings dialog box shown in Figure 7-7 opens. 2 Select the Enable Depth Correction check box to enable depth correction. 3 Enter the actual water depth in meters in the Water Depth text box. 4 Enter the depth in meters of the 3D-ACM Wave in the Instrument Depth text box. 5 Click OK to save the new depth settings and close the Depth Settings dialog box, or click Cancel to close the dialog box without saving the new settings. The depth correction is applied to all the graphics displays. 3DACM97 Operating Manual June 2003 SECTION 7: Acquiring and Viewing Real-Time Data 7-15 The Time Series Graphics Display The Time Series graphics display, which is shown in Figure 7-8, displays plots of instantaneous north, east and up current velocities in m/sec verses time in seconds or number of scans. Whether you choose scans or time for the horizontal scale, the scale is updated continuously during data acquisition. Although the Time Series graphics display opens first by default, to open the Time Series graphics display from any of the other graphics displays, click the Time option. Figure 7-8: The Time Series Graphics Display The Speed and Direction Graphics Display The Speed and Direction graphics display, which is shown in Figure 7-9, provides a stick plot of current speed and direction, where the speed is calculated from the square root of the sum of the squares of the vector averaged horizontal current velocities and the direction is calculated from the arctangent. The current speed is represented as the length of a lineone line for each scan, and the direction as the orientation of each line0° to 360° clockwise from straight up, where 0° is true north. You can also choose to include the up velocities, along with the horizontal velocities, in the current speed calculations. To open the Speed and Direction graphics display, click Speed Dir. June 2003 3DACM97 Operating Manual 7-16 SECTION 7: Acquiring and Viewing Real-Time Data Figure 7-9: The Speed and Direction Graphics Display The Progressive Vector Graphics Display The Progressive Vector graphics display, which is shown in Figure 7-10, provides a vector plot of current speed and direction on a polar graph, where the speed is calculated from the square root of the sum of the squares of the vector averaged horizontal current velocities and the direction is calculated from the arctangent. You can also choose to include the up velocities, along with the horizontal velocities, in the current speed calculations. The current speed is represented as the length of a lineone line for each scan, and the direction as the orientation of each line, where 0° is true north. To open the Progressive Vector graphics display, click the Prog. Vector option. The Distribution Graphics Display The Distribution graphics display provides a histogram of the current speed in m/sec, the current direction or both verses number of scans. The current speed is calculated from the square root of the sum of the squares of the vector averaged horizontal current velocities and the direction is calculated from the arctangent, where 0° is true north. The Distribution graphics display shown in Figure 7-11 show both current speed and direction. You can also choose to include the up velocities, along with the horizontal velocities, in the current speed calculations. The vertical scales, which are in number of scans, are adjusted continuously during data acquisition. To open the Distribution graphics display, click the Distribution option. 3DACM97 Operating Manual June 2003 SECTION 7: Acquiring and Viewing Real-Time Data 7-17 Figure 7-10: The Progressive Vector Graphics Display Figure 7-11: The Distribution Graphics Display June 2003 3DACM97 Operating Manual 7-18 SECTION 7: Acquiring and Viewing Real-Time Data The Pressure Analysis Graphics Display The Pressure Analysis graphics display, which is shown in Figure 7-12, provides both a plot of pressure in dBars verses number of scans and a frequency spectrum of wave height in m2/Hz. The horizontal scale of the pressure graph is in number of scans and is adjusted continuously during data acquisition. Five selectable full scale frequencies from 0.25 Hz to 2.00 Hz are available for the horizontal scale of the wave height frequency spectrum, which can be shown as a bar graph, a continuous line or X marks, and any one of these as a 3-D plot. To open the Pressure Analysis graphics display, click the Press. Analysis option. Figure 7-12: The Pressure Analysis Graphics Display The Wave Direction Graphics Display The Wave Direction graphics display, which is shown in Figure 7-13, provides a display of wave direction, frequency and relative height. The frequency scale is along the vertical axis and the direction scale is along the horizontal axis. Relative wave height is represented by the color of the plot at each of the displayed graph coordinates, where the color scale is shown in the upper right corner of the display. The color of each coordinate is continuously adjusted during data acquisition to be relative to the highest (red) and lowest (yellow) measured wave height. The Wave Direction graphics display also allows you to display the coefficients of the equation that determines the directional wave spectra. The Coefficients display is shown in Figure 7-14. The wave spectra equation is based on the U.S. Army Corps of Engineers’ Instruction Report CERC-95-1 of the “Field Wave Gaging Program, Wave Data Analysis Standard.” 3DACM97 Operating Manual June 2003 SECTION 7: Acquiring and Viewing Real-Time Data 7-19 Figure 7-13: The Wave Direction Graphics DisplayDirection Figure 7-14: The Wave Direction Graphics DisplayDirection Coefficients June 2003 3DACM97 Operating Manual 7-20 SECTION 7: Acquiring and Viewing Real-Time Data Setting up the 3D-ACM Wave Graphics Displays 3DACM97 allows you to set up the full scale ranges of the graph scales, the colors of the plots and graph backgrounds and other setup parameters for each of the graphics displays. The setups are performed in six dialog boxes corresponding to the six graphics displays. See “Real-Time Acquisition 3D-ACM Wave Graphics Displays’ on page 7-12 for information on each of the graphics displays. Setting up the Time Series Graphics Display The Time Series graphics display can be set up to plot any combination of North Velocity, East Velocity and Up Velocity. 3DACM97 also allows you to adjust the full scale velocity shown on the vertical axis in m/sec and select either time in seconds or number of scans for the horizontal axis. In addition, the background color of the graph can be selected from a number of available colors and a grid can be added. To set up the Time Series graphics display: 1 Double-click anywhere in the graph, or right-click and then choose Graph Setup from the shortcut menu that opens. The Time Graph Setup dialog box shown in Figure 7-15 opens. Figure 7-15: The Time Graph Setup Dialog Box 3DACM97 Operating Manual June 2003 SECTION 7: Acquiring and Viewing Real-Time Data 2 7-21 In the Velocity Axis area of the Time Graph Setup dialog box, do one or both of the following to adjust the full scale velocity for the vertical axis: • Enter the maximum velocity in m/sec in the Maximum text box. • Enter the minimum velocity in m/sec in the Minimum text box. 3 In the X Axis Units area select Scans to scale the horizontal axis in number of scans or Time to scale the axis in seconds. 4 In the Display Velocities area select the velocities you want to display. 5 In the Graph Background Color drop-down list box, select a color for the graph background. 6 Select the Use Grid check box if you want to place a grid over the graph. 7 Click OK to save the new graph setup and close the Time Graph Setup dialog box, or click Cancel to close the dialog box without saving the new setup. Setting up the Speed and Direction Graphics Display The Speed and Direction graphics display can be set up to provide three different colors for the stick plots, depending on the range in percent of full scale in which the calculated speed falls for each scan. In addition, 3DACM97 allows you to adjust the full scale speed shown on the vertical axis in m/sec and to choose whether to include the up velocities, along with the horizontal velocities, in the current speed calculations. You can also select to have each stick plot represent the average current speed and direction over a specified number of scans. To set up the Speed and Direction graphics display: 1 Double-click anywhere in the graph, or right-click and then choose Graph Setup from the shortcut menu that opens. The Speed and Direction Graph Options dialog box shown in Figure 7-16 opens. 2 In the Maximum Velocity, Y Axis text box, enter the full scale current speed for the vertical axis. 3 Enter the number of scans over which to average the speed and direction data for each stick plot in the Average Length text box. Enter zero if you do not want to display averages. June 2003 3DACM97 Operating Manual 7-22 SECTION 7: Acquiring and Viewing Real-Time Data Figure 7-16: The Speed and Direction Gr aph Options Dialog Box 4 In the Graph Needle Color area of the Speed and Direction Graph Options dialog box, click the down arrow in the 0 to 39% drop-down list box and select a color for the stick plots. The color of the sticks in the plot will be the selected color when the current speed is anywhere in the range 0 to 39% of the Maximum Velocity, Y Axis entered in Step 2. 5 Repeat Step 4 for the 40 to 79% and 80 to 100% drop-down list boxes. The colors of the sticks in the plot will be the selected colors when the current speed is within the corresponding range of the Maximum Velocity, Y Axis. 6 Select the Use Up Velocity in calculations check box if you want to include the up velocities, along with the horizontal velocities, in the current speed calculations. 7 Click OK to save the new graph setup and close the Speed and Direction Graph Options dialog box, or click Cancel to close the dialog box without saving the new setup. 3DACM97 Operating Manual June 2003 SECTION 7: Acquiring and Viewing Real-Time Data 7-23 Setting up the Progressive Vector Graphics Display The Progressive Vector graphics display can be set up to provide three different colors for the vector plots, depending on the range in percent of full scale in which the calculated speed falls for each scan. In addition, 3DACM97 allows you to adjust the full scale speed shown on the polar graph in m/sec and to choose whether to include the up velocities, along with the horizontal velocities, in the current speed calculations. You can also choose to sum the vector plots and to select to have each vector plot represent the average current speed and direction over a specified number of scans. To set up the Progressive Vector graphics display: 1 Double-click anywhere in the graph, or right-click and then choose Graph Setup from the shortcut menu that opens. The Progressive Vector Graph Options dialog box shown in Figure 7-17 opens. Figure 7-17: The Progressive Vector Graph Options Dialog Box June 2003 3DACM97 Operating Manual 7-24 SECTION 7: Acquiring and Viewing Real-Time Data 2 In Maximum Magnitude text box, enter the full scale current speed for the polar graph. 3 Enter the number of scans over which to average the speed and direction data for each vector plot in the Average Length text box. Enter zero if you do not want to display averages. 4 In the Graph Needle Color area of the Progressive Vector Graph Options dialog box, click the down arrow in the 0 to 39% drop-down list box and select a color for the vector plots. The color of the vectors in the plot will be the selected color when the current speed is anywhere in the range 0 to 39% of the Maximum Magnitude entered in Step 2. 5 Repeat Step 4 for the 40 to 79% and 80 to 100% drop-down list boxes. The colors of the vectors in the plot will be the selected colors when the current speed is within the corresponding range of the Maximum Magnitude. 6 Select the Sum Vectors on Progressive Plot check box if you want to sum the vector plots. 7 Select the Use Up Velocity in calculations check box if you want to include the up velocities, along with the horizontal velocities, in the current speed calculations. 8 Click OK to save the new graph setup and close the Progressive Vector Graph Options dialog box, or click Cancel to close the dialog box without saving the new setup. Setting up the Distribution Graphics Display The Distribution graphics display can be set up to display current speed, current direction or both verses number of scans. In addition, you can choose whether to include the up velocities, along with the horizontal velocities, in the current speed calculations. To set up the Distribution graphics display: 1 Double-click anywhere in the graph, or right-click and then choose Graph Setup from the shortcut menu that opens. The Distribution Graph Options dialog box shown in Figure 7-18 opens. 3DACM97 Operating Manual June 2003 SECTION 7: Acquiring and Viewing Real-Time Data 7-25 Figure 7-18: The Distribution G raph Options Dialog Box 2 In the Plotting Options area of the Distribution Graph Options dialog box, select the Speed, the Direction or the Plot Both option. 3 Select the Use Up Velocity in calculations check box if you want to include the up velocities, along with the horizontal velocities, in the current speed calculations. 4 Click OK to save the new graph setup and close the Distribution Graph Options dialog box, or click Cancel to close the dialog box without saving the new setup. Setting up the Pressure Analysis Graphics Display The Pressure Analysis graphics display displays both a plot of pressure and a frequency spectrum of wave height and can be set up to display the wave frequency spectrum in any of five frequency scales and in any of three available spectrum display styles. In addition, any of the spectrum display styles can be displayed in 3D. To set up the Pressure Analysis graphics display: 1 Double-click anywhere in the graph, or right-click and then choose Graph Setup from the shortcut menu that opens. The Pressure Analysis Setup dialog box shown in Figure 7-19 opens. June 2003 3DACM97 Operating Manual 7-26 SECTION 7: Acquiring and Viewing Real-Time Data Figure 7-19: The Pressure Analysis Setup Dialog Box 2 In the Spectrum Display area of the Pressure Analysis Setup dialog box, select the Bar Graph, the continuous Line or the X Marks option. 3 In the Spectrum Display area select 3D Display of you want to display the wave height frequency spectrum in 3D. 4 In the Frequency Scale area select a frequency scale for the wave height frequency spectrum. The selected frequency scale determines full scale for the horizontal axis of the wave height frequency spectrum. 5 Click OK to save the new graph set up and close the Pressure Analysis Setup dialog box, or click Cancel to close the dialog box without saving the new setup. Setting up the Wave Direction Graphics Display The Wave Direction graphics display displays wave direction, frequency and relative height, where any of five frequency scales can be selected. To set up the Wave Direction graphics display: 1 Double-click anywhere in the graph, or right-click and then choose Graph Setup from the shortcut menu that opens. 2 The direction setup dialog box shown in Figure 7-20 opens. 3DACM97 Operating Manual June 2003 SECTION 7: Acquiring and Viewing Real-Time Data 7-27 Figure 7-20: The Direction Setup Dialog Box 2 In the Plot Type area of the Direction Setup dialog box, select the Direction or the coefficients option. 3 In the Frequency Scale area select a frequency scale for the wave height frequency spectrum. The selected frequency scale determines full scale for the horizontal axis of the wave height frequency spectrum. 4 Click OK to save the new graph setup and close the Direction Setup dialog box, or click Cancel to close the dialog box without saving any changes. June 2003 3DACM97 Operating Manual 7-28 SECTION 7: Acquiring and Viewing Real-Time Data 3DACM97 Operating Manual June 2003 8-1 Section 8: Retrieving and Saving Data from the Instruments A fter recovering a 2D-ACM, a 3D-ACM or a 3D-ACM Wave and connecting it to your computer’s serial port and to a power supply as described in “Connecting the Instruments to Your computer” on page 4-4, parameter data that are stored in the instrument’s internal memory can be retrieved and saved to a text file. When the text file is opened in a text editor, the data are shown listed under the parameter names. The File can also be opened using View Data File from the File menu. This section describes how to retrieve and save the parameter data from the instruments and how to view the data using View Data File. Caution: Before retrieving data from a 2D-ACM or 3D-ACM that has been deployed, refer to the “3D-ACM and Coastal 3D-ACM Service Manual” for instructions on how to inspect the instrument for any damage. Similarly, for a 3D-ACM Wave refer to the “3D-ACM Wave Service Manual.” Retrieving and Saving data from a 2D-ACM or 3D-ACM To retrieve the parameter data from a 2D-ACM or 3D-ACM: 1 Connect the 2D-ACM or 3D-ACM to your computer’s serial port and switch the KS switch on the test cable to KS ON. 2 Choose Start ➤ Programs ➤ FSI Applications ➤ 3DACM97. 3DACM97 starts and the 3DACM97 Main window opens. 3 Choose Configure ➤ Check Instrument. 3DACM97 displays which items are being checked during the check instrument process and then displays a graphic of a 2D-ACM or 3D-ACM. 4 Choose Retrieve Data ➤ Retrieve Data. 3DACM97 reads the current configuration of the instrument while displaying which items are being read. In addition, it resets the Logging Pointer. Then the Retrieve Memory dialog box shown in Figure 8-1 opens. June 2003 3DACM97 Operating Manual 8-2 SECTION 8: Retrieving and Saving Data from the Instruments Figure 8-1: The Retrieve Memory Dialog Box 5 Click Options. The Download Options dialog box shown in Figure 8-2 opens. Note: The Options button in the Retrieve Memory dialog box is available only if both instantaneous North Velocity and East Velocity or both average North Velocity and East Velocity are selected; it is grayed out and cannot be selected otherwise. Figure 8-2: The Download Options Dialog Box 6 In the Store Options area of the Download Options dialog box, select the Calculate Speed check box if you want 3DACM97 to calculate and save current speed; select the Calculate Direction check box if you want 3DACM97 to calculate and save current direction. 7 In the Calculate Speed and Direction area, select one of the following options: 3DACM97 Operating Manual June 2003 SECTION 8: Retrieving and Saving Data from the Instruments 8-3 • Use Average Velocities (AVN, AVE, AVU) to calculate speed and direction using the average velocity selections. This option is available only if both average North Velocity and East Velocity are selected. • Use Burst Velocities (VN, VE, VU) to calculate speed and direction using the instantaneous velocity selections. This option is available only if both instantaneous North Velocity and East Velocity are selected. • Use Both to calculate speed and direction for both the average and instantaneous velocity selections. This option is available only if both average North Velocity and East Velocity and both instantaneous North Velocity and East Velocity are selected. 8 In the Calculate Speed and Direction area, selected the Use Up Velocities check box to include Up Velocity, along with North Velocity and East Velocity, in the current speed calculations. 9 Click OK to close the Download Options dialog box and apply the selections, or click Cancel to close the dialog box without applying the selections. 10 Click Browse. The Save As dialog box for ASCII files shown in Figure 8-3 opens. This dialog box is used to create the file in which to save the retrieved parameter data. Figure 8-3: The Save As Dialog Box for ASCII Files Click the arrow in the Save in drop-down list box and select the folder in which to save the parameter data file. June 2003 3DACM97 Operating Manual 8-4 SECTION 8: Retrieving and Saving Data from the Instruments 12 In the File name text box enter the name of the file in which to save the data. The extension .dat is added automatically. 13 Click Save. The Save As dialog box for ASCII files closes. 14 Click Download to retrieve the parameter data from the instrument and close the Retrieve Memory dialog box, or click Cancel to close the dialog box without retrieving the data. If you click Download, the Deployment Information window opens: 15 Enter the deployment information in the Deployment Information window. The deployment information is saved in the text file along with the data. 16 Click OK to save the entries and close the Deployment Information window, or click Cancel to close the window without saving the entries. Note: Regardless whether you click OK or Cancel, the time and date at the start of data retrieval and the serial number of the instrument are saved. 3DACM97 downloads the data in binary format from the instrument’s internal memory. Then the Download window opens: 17 Click OK to close the Download window. 3DACM97 Operating Manual June 2003 SECTION 8: Retrieving and Saving Data from the Instruments 8-5 Retrieving and Saving Data from a 3D-ACM Wave To retrieve the parameter data from a 3D-ACM Wave: 1 2 Connect the 3D-ACM Wave to your computer’s serial port and switch the KS switch on the test cable to KS ON. Choose Start ➤ Programs ➤ FSI Applications 3DACM97. 3DACM97 starts the 3DACM97 Main window opens. 3 Choose Configure ➤ Check Instrument. 3DACM97 displays which items are being checked during the check instrument process and then displays a graphic of a 3D-ACM Wave. 4 Choose Retrieve Data ➤ Retrieve Data. The Retrieve Data window opens. 5 Do one of the following: • Select Average Data, and then click OK to retrieve the selected current velocity and tilt vector averages, where each record also contains one scan of the selected instantaneous parameters. • Select Burst Data, and then click OK to retrieve the selected burst parameter data. • Click the Close button to Close the Retrieve Data window without selecting a data type. If you click OK, 3DACM97 reads the current configuration of the instrument while displaying which items are being read. In addition, it resets the Logging Pointer. Then the Retrieve Memory dialog box shown in Figure 8-1 on page 8-2 opens. If you click the Close button, data will not be retrieved. June 2003 3DACM97 Operating Manual 8-6 6 SECTION 8: Retrieving and Saving Data from the Instruments Click Options. The Options dialog box shown in Figure 8-2 on page 8-2 opens. Note: The Options button in the Retrieve Memory dialog box is available only if both instantaneous North Velocity and East Velocity or both average North Velocity and East Velocity are selected; it is grayed out and cannot be selected otherwise. 7 In the Store Options area of the Download Options dialog box, select the Calculate Speed check box if you want 3DACM97 to calculate and save current speed; select the Calculate Direction check box if you want 3DACM97 to calculate and save current direction. 8 In the Calculate Speed and Direction area, select one of the following options: • Use Average Velocities (AVN, AVE, AVU) to calculate speed and direction using the average velocity selections. This option is available only if both average North Velocity and East Velocity are selected. • Use Burst Velocities (VN, VE, VU) to calculate speed and direction using the instantaneous velocity selections. This option is available only if both instantaneous North Velocity and East Velocity are selected. • Use Both to calculate speed and direction for both the average and instantaneous velocity selections. This option is available only if both average North Velocity and East Velocity and both instantaneous North Velocity and East Velocity are selected. 9 In the Calculate Speed and Direction area, select the Use Up Velocities check box to include Up Velocity, along with North Velocity and East Velocity, in the current speed calculations. 10 Clear OK to close the Download Options dialog box and apply the selections, or click Cancel to close the dialog box without applying the selections. 11 Click Browse. The Save As dialog box for ASCII files shown in Figure 8-3 on page 8-3 opens. This dialog box is used to create the file in which to save the retrieved parameter data. 12 Click the arrow in the Save in drop-down list box and select the folder in which to save the parameter data file. 3DACM97 Operating Manual June 2003 SECTION 8: Retrieving and Saving Data from the Instruments 8-7 13 In the File name text box enter the name of the file in which to save the data. The extension .dat is added automatically. 14 Click Save. The Save As dialog box for ASCII files closes. 15 Click Download to retrieve the parameter data from the instrument and close the Retrieve Memory dialog box, or click Cancel to close the dialog box without retrieving the data. If you click Download, the Deployment Information window opens: 16 Enter the deployment information in the Deployment Information window. The deployment information is saved in the text file along with the data. 17 Click OK to save the entries and close the Deployment Information window, or click Cancel to close the window without saving the entries. Note: Regardless whether you click OK or Cancel, the time and date at the start of data retrieval and the serial number of the instrument are saved. 3DACM97 downloads the data in binary format from the instrument’s internal memory. Then the Download window opens: 18 Click OK to close the Download window. June 2003 3DACM97 Operating Manual 8-8 SECTION 8: Retrieving and Saving Data from the Instruments Viewing the Data The parameter data from a saved data file can be viewed at any time from the File menu. Furthermore, it is not necessary to have an instrument connected to your computer to view the data. Before you can view the parameter data, the specific DAT file that contains the parameter data must be known. To view the parameter data: 1 Choose File ➤ View Data File. The Open dialog box for data files shown in Figure 8-4 opens. Although more than one file may be displayed, the example in the figure shows a single file of filename 3D-ACM Wave data 01.dat. Figure 8-4: The Open Dialog Box for Data Files If the file you want to open is not visible, it may be in a different folder than the one shown. In this case, click the arrow in the Look in drop-down list box and select the folder in which the file is located. 2 Click the file you want to view, and then click Open. The View Data window shown in Figure 8-5 opens. This window lists all the parameter data in the data file as well as the deployment information if any were saved. 3DACM97 Operating Manual June 2003 SECTION 8: Retrieving and Saving Data from the Instruments 8-9 Figure 8-5: The View Data Window To view columns that are not shown, drag the scroll box in the horizontal scroll bar to the right. This scroll box is shown only if one or more columns are hidden. To view scans that are not shown, click the up or down arrow in the vertical scroll boar to scroll through the scans one scan at a time. Or drag the scroll box up or down to quickly scroll through the scans. This scroll box is shown only if one or more scans are hidden. 3 To close the View Data window, click Close. The column headings for all the parameters that can be viewed in the View Data window are the following: AVN: Vector averaged north current velocity in cm/sec AVE: Vector averaged east current velocity in cm/sec AVU: Vector averaged up current velocity in cm/sec ATLT: Vector averaged tilt in degrees ASPD: Calculated vector averaged current speed in cm/sec AVDIR: Calculated average direction in degrees TIME: Time in hours, minutes and seconds DATE: Date in month, day and year COND: Conductivity in mmho/cm from optional CTD June 2003 3DACM97 Operating Manual 8-10 SECTION 8: Retrieving and Saving Data from the Instruments TEMP: Water temperature in °C from optional CTD PRES: Water pressure in dBars from optional CTD DIR: Current direction in degrees BATT: Battery voltage in volts VX: X current velocity in cm/sec VY: Y current velocity in cm/sec VZ: Z current velocity in cm/sec TX: Tilt X in degrees TY: Tilt Y in degrees HX: Compass X HY: Compass Y HZ: Compass Z VN: Instantaneous north current velocity in cm/sec VE: Instantaneous east current velocity in cm/sec VU: Instantaneous up current velocity in cm/sec STEMP: Sea temperature in °C SPD: Calculated instantaneous current speed in cm/sec VDIR: Calculated instantaneous current direction in degrees SV: Calculated sound velocity in water in m/sec SPRES: Sea pressure in dBars AUX1: Auxiliary channel 1 A/D output, 04095 counts for 05 volts AUX2: Auxiliary channel 2 A/D output, 04095 counts for 05 volts Note: For more information on the parameters listed and how to select them, see “SECTION 5: Checking and Configuring the Instruments.” 3DACM97 Operating Manual June 2003 9-1 Section 9: Replacing the Battery Packs B efore deploying a 2D-ACM, a 3D-ACM or a 3D-ACM Wave, you should check the instrument’s battery pack and, if necessary, replace the battery pack. In addition, when you replace a battery pack, you should degauss the battery pack first. This minimizes the effect the magnetic materials contained in the battery pack have on the instrument’s compass. (See “Optional Items” on page ix for the FSI part numbers of the battery packs.) This section provides instructions on how to degauss a battery pack and how to check and replace the ACM battery packs. To check or replace an ACM battery pack, you must first remove the mooring frame and then the instrument’s end cap. After these items are removed, the battery pack can be checked while it is connected to the instrument. And if necessary, the battery pack can be disconnected and replaced with a fresh pack. The battery check and replacement procedures in this section comprise disassembling the instruments to check the battery packs, installing fresh battery packs, and reassembling the instruments. Degaussing a Battery Pack Before installing a new battery pack in an ACM, the battery pack should be degaussed. This is especially important for alkaline battery packs, which contain magnetic materials that may adversely affect the performance of the instrument’s compass. Degaussing reduces these magnetic effects. To degauss the battery packs, a degaussing coil is required, which is simply a large coil that is energized with an AC current. The battery pack is passed through the coil and then slowly removed. Degaussing coils are typically used to eliminate the magnetic fields that affect picture tube alignment and are available from a number of sources including the following: Butler Tool & Design 641 South Newton Street Gooland, IL 47948 A battery pack is shown being passed through a Butler Tool & Design degaussing coil in Figure 9-1. This degaussing coil is also the unit used in the instructions that follow. June 2003 3DACM97 Operating Manual 9-2 SECTION 9: Replacing the Battery Packs Figure 9-1: Degaussing a Battery Pack with a Degaussing Coil To degauss a battery pack: 1 With the degaussing coil directly in front of you, hold the battery pack in your hand and pass it through the degaussing coil lengthwise approximately 12 inches to the other side. 2 While pressing the red button, slowly pull the battery through the degaussing coil until it is approximately 24 inches in front of the coil. Then release the button. 3 Turn the battery pack around and repeat Steps 1 and 2. 3DACM97 Operating Manual June 2003 SECTION 9: Replacing the Battery Packs 9-3 Checking and Replacing a 2D-ACM Battery Pack In procedures that follow refer to Figure 9-2, which shows the 2D-ACM with its mooring frame, and to Figure 9-3 on page 9-4, which shows the disassembled 2D-ACM and its battery pack. To disassemble the 2D-ACM and check the battery pack: 1 Unscrew and remove the zinc anode on the top of the mooring frame. A threaded rod and nut will be visible when the zinc anode is removed. Zinc anode Mooring frame “Fingers” Velocity head Band clamp nut and bolt Band clamp Housing Figure 9-2: 2D-ACM with Mooring Frame 2 Remove the nut on the threaded rod. 3 Remove the nut and bolt on the band clamp that secures the mooring frame to the instrument housing. June 2003 3DACM97 Operating Manual 9-4 SECTION 9: Replacing the Battery Packs 4 Carefully spread the band clamp and lift the mooring frame until it is clear of the threaded rod. Then slowly thread the band clamp around the “fingers” of the velocity head until the frame and band clamp are free of the velocity head. Set the mooring frame aside. 5 Carefully pull the end cap straight out from the housing and lay it on its side. If required, rotate the end cap slightly while pulling. 6 Locate the battery wires where they attach to the battery connector, which plugs into a PC board on the end cap. Leave the connector plugged in and tough the probes of a digital voltmeter to the exposed pins on the back of the connectorthe (+) probe to the blue wire’s pin and the (-) probe to the black wire’s pin. The voltage should be 2.6 VDC or higher. Caution: If the 2D-ACM has been deployed for some time, it is recommended that the battery pack be replaced regardless of the voltage reading. Battery wire (black) Housing Foam pad Battery connector Alkaline battery pack Battery wire (red) Endcap Figure 9-3: 2D ACM Disassembled for Battery Pack Replacement 3DACM97 Operating Manual June 2003 SECTION 9: Replacing the Battery Packs 9-5 To install a fresh 2D-ACM battery pack: 1 Unplug the battery connector from the PC board. 2 Remove the foam pad and them remove the battery pack by sliding it out of the housing. 3 Install a fresh battery pack into the housing. 4 Plug the battery connector into the PC board. To reassemble the 2D-ACM: 1 Clean the O-ring on the end cap with a lint-free cloth or paper towel, and after carefully inspecting the O-ring for any nicks or scratches, apply a thin coat of silicone grease. If nicks or scratches are found on the O-ring, replace the O-ring. When replacing the O-ring, first clean the O-ring surface on the end cap with a lint-free cloth or paper towel. Then lightly lubricate the new O-ring with silicone grease and install it onto the end cap. 2 Insert the foam pad between the battery pack and the PC boards. 3 Press the end cap into the housing, being careful not to pinch the battery wires. 4 Carefully thread the band clamp of the mooring frame around the “fingers” of the velocity head until it is over the end cap, and the slide the top of the mooring frame over the threaded rod on the velocity head. 5 Attach the band clamp to the end cap, and then align the mooring frame with the “fingers” as shown in Figure 9-2 on page 9-3. 6 Secure the band clamp with the band clamp nut and bolt and tighten the bolt to 1 N•m. 7 Secure the mooring frame to the velocity head with the threaded rod nut. 8 Screw the zinc anode onto the threaded rod until it is secure. June 2003 3DACM97 Operating Manual 9-6 SECTION 9: Replacing the Battery Packs Checking and Replacing a 3D-ACM Battery Pack In procedures that follow refer to Figure 9-4, which shows the 3D-ACM with its mooring frame, and to Figure 9-5 on page 9-7, which shows the disassembled 3D-ACM and its battery pack. To disassemble the 3D-ACM and check the battery pack: 1 Loosen the self-locking nut on the Voss clamp and unlatch the clamp. 2 Remove the Voss clamp by spreading the band slightly and sliding it past the velocity head, and then remove the isolator on the end cap. Mooring frame Socket head set screws (4) “Fingers” Velocity head Voss clamp Isolator (under Voss clamp) Band clamp nut and bolt Zinc anode Housing Band clamp Figure 9-4: 3D-ACM with Mooring Frame 3DACM97 Operating Manual June 2003 SECTION 9: Replacing the Battery Packs 9-7 3 Using a 3/32” Allen wrench loosen the four socket head set screws that secure the mooring frame to the velocity head. 4 Unscrew and remove the zinc anode on the band clamp that secures the mooring frame to the instrument housing. 5 Remove the nut and bolt on the band clamp. 6 Carefully lift the mooring frame from the velocity head, and then slowly thread the band clamp around the “fingers” of the velocity head until the frame and band clamp are free of the velocity head. Set the mooring frame aside. 7 Carefully pull the end cap straight out from the housing and lay it on its side. If required, rotate the end cap slightly while pulling. Housing End Cap in-line connector Foam pad Battery pack in-line connector End Cap Alkaline battery pack Figure 9-5: 3D-ACM Disassembled for Battery Pack Replacement June 2003 3DACM97 Operating Manual 9-8 8 SECTION 9: Replacing the Battery Packs Locate the battery wires where they attach to the in-line battery connector, which plugs into the end cap in-line connector. Leave the connectors plugged in and touch the probes of a digital voltmeter to the exposed pins on the back of the connectorthe (+) probe to the blue wire’s pin for an alkaline battery pack or the red wire’s pin for a lithium battery pack, and the (-) probe to the black wire’s pin. The voltage for an alkaline battery pack should be 2.6 VDC or higher. The voltage for a lithium pack should be 6.8 VDC or higher. Caution: If the 3D-ACM has been deployed for some time, it is recommended that the battery pack be replaced regardless of the voltage reading. To install a fresh 3D-ACM battery pack: 1 Unplug the battery pack in-line connector from the end cap in-line connector. 2 Remove the foam pad and then remove the battery pack by sliding it out of the housing. 3 Install a fresh battery pack into the housing. 4 Plug the in-line battery connector into the in-line end cap connector. To reassemble the 3D-ACM: 1 Clean the O-ring on the end cap with a lint-free cloth or paper towel, and after carefully inspecting the O-ring for any nicks or scratches, apply a thin coat of silicone grease. If nicks or scratches are found on the O-ring, replace the O-ring. When replacing the O-ring, first clean the O-ring surface onthe end cap with a lint-free cloth or paper towel. Then lightly lubricate the new O-ring with silicone grease and install it onto the end cap. 2 Insert the foam pad between the battery pack and the electronics chassis. 3 Press the end cap into the housing, being careful not to pinch the battery wires. 3DACM97 Operating Manual June 2003 SECTION 9: Replacing the Battery Packs 4 5 9-9 Install the isolator over the end cap, leaving only a small gap as shown. Small gap only Carefully thread the band clamp of the mooring frame around the “fingers” of the velocity head until it is over the end cap, and then slide the top of the mooring frame onto the velocity head. Isolator 6 Attach the band clamp to the end cap, and then align the mooring frame with the “fingers” as shown in Figure 9-4 on page 9-6. 7 Secure the band clamp with the band clamp nut and bolt and tighten the bolt to 1 N•m. 8 Screw the zinc anode onto the threaded rod until it is secure. 9 Secure the mooring frame to the velocity head with the four socket head set screws. 10 Spread the Voss clamp slightly, and then slide it past the velocity head and onto the end cap. 11 Position the Voss clamp over the gap in the isolator, latch the clamp, and then tighten the self locking nut. Caution: To ensure the Voss clamp does not make contact with the end cap, the clamp must be positioned directly over the gap in the isolator as shown. Caution: Do not overtighten the Voss clamp. June 2003 3DACM97 Operating Manual 9-10 SECTION 9: Replacing the Battery Packs Checking and Replacing a 3D-ACM Wave Battery Pack In procedures that follow refer to Figure 9-6, which shows the 3D-ACM Wave with it mooring frame, and to Figure 9-7 on page 9-11, which shows the disassembled 3DACM Wave and its battery pack. To disassemble the 3D-ACM Wave and check the battery pack: 1 Loosen the self-locking nut on the Voss clamp and unlatch the clamp. 2 Remove the Voss clamp by spreading the band slightly and sliding it past the velocity head, and then remove the isolator on the end cap. Mooring frame Socket head set screws (4) Velocity head “Fingers” Voss clamp Isolator (under Voss clamp) Band clamp nut and bolt Zinc anode Band clamp Housing Figure 9-6: 3D-ACM Wave with Mooring Frame 3DACM97 Operating Manual June 2003 SECTION 9: Replacing the Battery Packs 9-11 3 Using a 3/32” Allen wrench loosen the four socket head set screws that secure the mooring from to the velocity head. 4 Unscrew and remove the zinc anode on the band clamp. 5 Remove the nut and bolt on the band clamp. 6 Carefully lift the mooring frame from the velocity head, and then slowly thread the band clamp around the “fingers” of the velocity head until the frame and band clamp are free of the velocity head. Set the mooring frame aside. 7 Carefully pull the end cap straight out from the housing and lay it on its side. If required, rotate the end cap slightly while pulling. Battery pack in-line connector Housing End cap in-line Foam pad connector Alkaline Battery pack End cap Figure 9-7: 3D-ACM Wave Disassembled for Battery Pack Replacement June 2003 3DACM97 Operating Manual 9-12 8 SECTION 9: Replacing the Battery Packs Locate the battery wires where they attach to the in-line battery connector, which plugs into the end cap in-line connector. Leave the connectors plugged in and tough the probes of a digital voltmeter to the exposed pins on the back of the connectorthe (+) probe to the blue wire’s pin for an alkaline battery pack or the red wire’s pin for a lithium battery pack, and the (-) probe to the black wire’s pin. The voltage for an alkaline battery pack should be 2.6 VDC or higher. The voltage for a lithium pack should be 6.8 VDC or higher. Caution: If the 3D-ACM Wave has been deployed for some time, it is recommended that the battery pack be replaced regardless of the voltage reading. To install a fresh 3D-ACM Wave battery pack: 1 Unplug the battery pack in-line connector from the end cap in-line connector. 2 Remove the foam pad and then remove the battery pack by sliding it out of the housing. 3 Install a fresh battery pack into the housing. 4 Plug the in-line battery connector into the in-line end cap connector. To reassemble the 3D-ACM Wave: 1 Clean the O-ring on the end cap with a lint-free cloth or paper towel, and after carefully inspecting the O-ring for any nicks or scratches, apply a thin coat of silicone grease. If nicks or scratches are found on the O-ring, replace the O-ring. When replacing the O-ring, first clean the O-ring surface on the end cap with a lint-free cloth or paper towel. Then lightly lubricate the new O-ring with silicone grease and install it onto the end cap. 2 Insert the foam pad between the battery pack and the electronics chassis. 3 Press the end cap into the housing, being careful not to pinch the battery wires. 3DACM97 Operating Manual June 2003 SECTION 9: Replacing the Battery Packs 4 Install the isolator over the end cap, leaving only a small gap as shown. 5 Carefully thread the band clamp of the mooring frame around the “fingers” of the velocity head until it is over the end cap, and then slide the top of the mooring frame onto the velocity head. 9-13 Small gap only Isolator 6 Attach the band clamp to the end cap, and then align the mooring frame with the “fingers” as shown in Figure 9-4 on page 9-6. 7 Secure the band clamp with the band clamp nut and bolt and tighten the bolt to 1 N•m. 8 Screw the zinc anode onto the threaded rod until it is secure. 9 Secure the mooring frame to the velocity head with the four socket head set screws. 10 Spread the Voss clamp slightly, and then slide it past the velocity head and onto the end cap. 11 Position the Voss clamp over the gap in the isolator, latch the clamp, and then tighten the self locking nut. Caution: To ensure the Voss clamp does not make contact with the end cap, the clamp must be positioned directly over the gap in the isolator as shown. Caution: Do not overtighten the Voss clamp. June 2003 3DACM97 Operating Manual 9-14 SECTION 9: Replacing the Battery Packs 3DACM97 Operating Manual June 2003 A-1 ADDENDUM A: 3DACM Status Command (STAT) Introduction This application note describes the new Status Command (STAT) for the 3DACM. The Status Command is a summary command that describes the run-time configuration of the 3DACM. Its primary use is to monitor the 3DACM just before deployment. Command Description The Status command is used to display the run-time configuration of the 3DACM. To use the Status command type STAT followed by the enter key. This command can be used with any terminal program or with the Communication window in 3DACM97. STAT The 3DACM will respond with the following information… Running Mode Logging Pointer Logging Flag Interval Time On Time Average Time Delayed Date Delayed Time Instrument Date Instrument Time Channel Configuration Data Set Running Mode - This will be one of the following “Continuous, Interval, Delayed” Logging Pointer - This will indicate the number of bytes recorded to memory. Zero until after the first on time. Logging Flag - This will be “Set or Cleared” Interval Time - in the following format “hh:mm:ss” On Time - in the following format “hh:mm:ss” Average Time - in the following format “mm:ss” Delayed Date - in the following format “mm-dd-yyyy” Delayed Time - in the following format “hh:mm:ss” Instrument Date - in the following format “mm-dd-yyyy” Instrument Time - in the following format “hh:mm:ss” Channel Configuration - This will be the same as the RDM command. It will display which channels are on and how they appear in the data set. Data Set - One complete scan of raw data. June 2003 3DACM97 Operating Manual A-2 ADDENDUM A: 3DACM Status Command (STAT) Here is an example of the command: STAT Interval Logging Pointer=39 Logging Ops Set Interval Time = 00:01:00 ON Time = 00:00:30 Averaging Interval Time = 00:30 Delayed Start Date = 07-01-2003 Delayed Start Time = 20:50:00 Time = 15:34:53 Date = Thr 07-03-2003 AVN = ON, AVE = ON, AVU = ON, ATLT = ON, ATIME = ON, DIR = ON, BATT = ON, STEMP = ON, SV = ON, 39 -82.04, 367.44, -140.91, 43.20, 15:34:53, 07-03-2003, 107.25, 7.58, 21.62, 152578.00 Note: When you deploy the instrument interval mode, the Logging Pointer will remain at zero until the 3DACM logs one data set. If the user issues the STAT command before any data is logged, the logging pointer will remain at zero. In order to see the logging pointer increment, wait for the first on time to complete. Make sure the Kick Start Switch is OFF at the Start of any interval. Kick Start Warning When the 3DACM is in Delayed Start or Interval Operations, care must be taken to avoid missing either the Delayed Start turn on time or missing the start of an interval. If the 3DACM is in Delayed Start Mode then you will need to use the Kick Start Switch to communicate with the 3DACM. When the 3DACM is in Delayed Start mode it removes power and relies on the real-time clock to turn power on. If the Kick Start switch (or using the old test cable that connects kick start to ground when connected to the 3DACM) is in the ON position, when the delayed time expires, it will miss the Delayed Start Event and will not operate properly from Delayed Start. If you need to communicate to the 3DACM while in Delayed Start, make sure the Delayed Time is out far enough in time so that you will not connect to the 3DACM around the time it was supposed to turn on. Then you will not disturb the correct turn on time. After you communicate with the 3DACM, turn off the Kick Start Switch and the 3DACM will return to Delay Start Mode. 3DACM97 Operating Manual June 2003 ADDENDUM A: 3DACM Status Command (STAT) A-3 This also applies to Interval Mode. You can connect the test cable to the 3DACM at any time as long as the Kick Start Switch is in the OFF position. If you know that the 3DACM is in Interval Mode and is running the On Time you can communicate with the 3DACM without the Kick Start Switch in the ON position. If the 3DACM is in the OFF portion of the Interval, then you will need to use the Kick Start Switch. If the Kick Start Switch in ON you must make sure the Kick Start Switch is turned OFF before the next On Time occurs otherwise the 3DACM will miss the next On Time. June 2003 3DACM97 Operating Manual A-4 ADDENDUM A: 3DACM Status Command (STAT) 3DACM97 Operating Manual June 2003