1
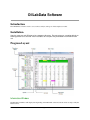
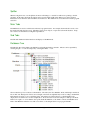
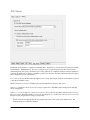
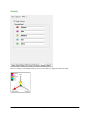
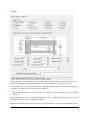
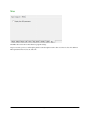
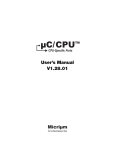
OilLabData
User Manual
January 2010
OilLabData
MJR Technologies LLC
1
Introduction................................................................................................................................................................3
How To Use This Manual ......................................................................................................................................3
OilLabData Software ................................................................................................................................................4
Introduction ...............................................................................................................................................................4
Installation .................................................................................................................................................................4
Program Layout .........................................................................................................................................................4
Trend .........................................................................................................................................................................9
Data I/O ...................................................................................................................................................................15
Setup ........................................................................................................................................................................17
OilLabData
MJR Technologies LLC
2
Introduction
How To Use This Manual
This manual describes the operation of OilLabData software.
Manual Conventions
These conventions are used throughout this manual to call attention to the adjacent text:
Note: The Note paragraph indicates special comments or instructions.
OilLabData
MJR Technologies LLC
3
OilLabData Software
Introduction
The OilLabData software is used to store, retrieve, analyze, and report oil lab sample test results.
Installation
Copy the setup.exe and OilSetup.msi to a temporary directory. Execute setup.exe, accepting defaults or
entering preferences as desired. After installation, the setup files may be deleted or archived for future
use.
Program Layout
Information Window
The Information Window will display data depending on the Main Tab selection, Sub tab selection, and possibly the
Database Tree.
OilLabData
MJR Technologies LLC
4
Splitter
When moving the mouse over the Splitter, the mouse will change to a vertical bar with arrows pointing to the left
and right. At this time, the left mouse button can be pressed and the width of the database tree can be adjusted.
Release the mouse when the desired width has been achieved. This width will be stored and used for future program
activation.
Main Tabs
The Main Tabs are used to switch between the major program features. For example, the Trend tab is used to view
the sample data and generate reports. The Import tab is used to import or export data to/from the database. Setup
tab is used to set miscellaneous configuration parameters.
Sub Tabs
The Sub Tabs further divide the functions and displays of the Main Tabs.
Database Tree
The Database Tree is the primary mechanism for navigating the database structure. The tree can be expanded by
selecting the plus “+” icon and collapsed by selecting the minus “-“ icon.
Observe that the top level of the tree is the Database, followed by the Area, Machine, Point, and Sample. Each level
has an “ID” and “Description” field of various lengths. The items are alphabetically sorted according to the ID field.
Each database level has a color coded alarm gauge. The alarms are rolled up the tree so that the higher levels
display the worse alarm level. For the example above, the level for the most recent sample is rolled up to the Point.
This level is equal to or worse than the other points under this Machine, so the alarm is rolled to the Machine level.
There other Machines under the area with worse alarms, so the Sample alarm is not propagated further.
OilLabData
MJR Technologies LLC
5
By right-clicking the mouse on any level of the Database Tree, a menu can be displayed.
For example, selecting Add at the Area level will display a menu to add a Machine.
Selecting Edit will display a screen similar to the Add that will permit modification of the selected level ID and
Description.
Note: If you are using an import technique that automatically creates the database structure the ID field
should not be modified. For example, if the Area ID ‘A1’ is changed to ‘A2’, the next time data is imported for
A1, the level will not be found, and A1 and its Machines and Points will be recreated.
Selecting Delete will delete the selected level and all sub levels in the database. A confirmation prompt will be
displayed before this operation is carried out.
Import Tree
There is an Imports level at the same level as the Database. The Import tree is used to conveniently review sample
results without having to locate samples in the database hierarchy. Each time data is imported, a Batch is created
under the Year, Month, and Day of the import. If more than 99 samples are present, new Batches are created as
necessary. If the same Sample data is imported multiple times, multiple Batches are created.
Note: The Imports tree is solely for the convenience of the user. Once import data has been reviewed, the
Import construct may no longer be useful. As with the Database tree, the levels of the Import tree can be
OilLabData
MJR Technologies LLC
6
deleted. Deleting Import tree items will NOT delete the Sample data. Only the Import ‘link’ to the Sample is
deleted.
Action Required Tree
There is an Action Required level at the same level as the Database. The Action Required tree is used to
conveniently create a ‘to do’ list without having to locate samples in the database hierarchy. Samples may be added
to the Action Required tree by right clicking a sample and selecting ‘Action Required’.
Note: The Action Required tree is solely for the convenience of the user. Once action is taken right click the
sample under Action Required and select ‘Delete’. Deleting Action Required tree items will NOT delete the
Sample data. The Sample is only removed from the Action Required list.
OilLabData
MJR Technologies LLC
7
Main Menu
Various drop down menu items may be selected from the Main Menu by left clicking the menu and item. Options to
open and create a database are available, along with items to change printer settings and exit the program.
Toolbar
Toolbar items can be invoked with a single click of the mouse. If the mouse ‘hovers’ over a toolbar item, a brief
‘tool tip’ description is displayed. From left to right, the toolbar items are “Open Database”, “Print Report”,
“Preview Report”, “Close Report Preview”, and “Save Report to PDF File”.
OilLabData
MJR Technologies LLC
8
Trend
The Trend tab is the primary source for Sample results. This screen will update depending on the item selected in
the Database or Import tree. Results are displayed at the ‘Point’ ‘Sample’ and ‘Batch’ level. For other levels the
screen will be ‘empty’. If comments are present, and Sample is selected from the tree, the comments will be
displayed at the bottom of the screen. Samples are arranged according to sample date from left to right.
Note: You may modify editable fields such as “Unit Usage”, “Oil Usage”, “Oil Added”, and “Comments” by
selecting them with the mouse and typing the new values. The “Sample Date” and “Sample #” may also be
modified by right clicking the Sample and selecting “Edit”.
If you wish, you can also add your own comments to the reports. This can be useful for recording oil and filter
changes or if you want to add specific information for management and production personnel. Your comments are
automatically saved when you enter them.
The cells of individual parameters are color coded according to the alarm level assigned by the lab. Additionally,
parameters have been assigned to the ‘Wear’, ‘Contamination’, or ‘Chemistry’ category. The highest alarm level (0100 range) and color for each category is rolled to the summary ‘Status’ rows.
OilLabData
MJR Technologies LLC
9
Detail Trend
Right click on a parameter name to display a detail trend plot. The ‘<’ and ‘>’ buttons will display the previous
and next parameters. Holding down the ‘shift’ and left mouse button will move the plot. The ‘Crtl’ mouse
combination will change the axis scale. ‘Alt’ mouse will allow you to select a box. Releasing the mouse button
will plot the selected region. When ‘Finished’ is selected, the display returns to the Trend spreadsheet.
OilLabData
MJR Technologies LLC
10
Sample Trend Report
Selecting the Preview button from the Toolbar will display the Sample Trend Report in a preview window. The
Sample displayed depends upon the Sample selected on the tree. The selected Sample is the leftmost Sample on
the report, followed by the up to 4 prior Samples. If the Point is selected, the most recent Sample is considered
the selected Sample. The comments and vector summary are for the leftmost Sample. Also, the Plot data starts
at this Sample. The number of data points plotted depends on setting on the ‘Trend’ sub-tab of the ‘Setup’ tab.
The report can be printed or saved as a PDF file with the toolbar buttons. Select ‘Close’ from the toolbar to
return to the trend display.
OilLabData
MJR Technologies LLC
11
Wear/Contamination/Chemistry Sub-Tabs
Selecting the Wear/Contamination/Chemistry Sub-Tabs displays an array of trend charts for the selected category.
As with the Sample Trend report, the number of data points plotted depends on setting on the ‘Trend’ sub-tab of the
‘Setup’ tab.
OilLabData
MJR Technologies LLC
12
Wear/Contamination/Chemistry Trend Report
Selecting the Preview button from the Toolbar will display the Sample Trend Report in a preview window. The
number of data points plotted depends on setting on the ‘Trend’ sub-tab of the ‘Setup’ tab. The report can be printed
or saved as a PDF file with the toolbar buttons. Select ‘Close’ from the toolbar to return to the trend display.
OilLabData
MJR Technologies LLC
13
Sample Trend Report at Batch Level
A Sample Trend report can be generated for an entire import batch by selecting the batch and the Preview
button. Navigation keys on the preview allow for quick review of the reports.
Note: Up to 99 samples on 99 pages may be included in this report. Selecting Print will queue all pages to
the printer.
OilLabData
MJR Technologies LLC
14
Data I/O
Import
The Import tab allows you import test results from your oil analysis lab. Status messages, along with any warnings
or errors are listed as the import progresses.
Import Type - Currently supported import formats.
Import File - Select to "browse" to the file that is to be imported.
Import Into - This can be used with the “Lab Unit ID” method of import to limit the search to the current database
instead of all databases.
Start - Click on the Start button to begin the import process.
OilLabData
MJR Technologies LLC
15
Export
Export can be used to create a text file with the Sample test results. Status messages, along with any warnings or
errors are listed as the import progresses.
Note: The Samples exported will depend on the current selection on the database tree. All Samples at and
below the selection will be exported. This applies to the Import tree also. For example, by selecting the Month
level, all sample data imported for that Month would be exported.
Save As - The name of the file that will contain the exported data.
Export Format
• CSI Generic (.zip) using the Lab Unit ID as the key for data import
• Area, Equipment, Point (.zip) codes as keys for import. This option automatically creates the Area,
Equipment or Point in the target database if they do not exist. Note, “DB Name” must be provided.
• Comma Delimited output data separated by comma’s.
DataFilter - Check the Enabled box to limit the export to the tree selection and Sample dates that fall on or within
the selectable Start End dates. ta will be imported into the Oil Reference database.
OilLabData
MJR Technologies LLC
16
Setup
Report - Global/Report – DB
Reports can be customized with your desired contact information. The “Report – Global” settings are stored in a
configuration file and apply to all databases. “Report – DB” settings are stored in the database and apply only to the
current database. When generating reports, the existence of DB settings are checked first and used if present.
“Large Logo” will generate a large logo that covers the address information.
OilLabData
MJR Technologies LLC
17
Trend
3 Alarm Colors will change the alarm colors on the tree, cell, and reports to 3 levels from the original 5. For 3 color,
magenta becomes red and cyan becomes yellow.
Trend Plot Display can be used to reduce the number of data points plotted. This may be desirable if the quantity
begins to obscure the trend or if data becomes too old to be relevant.
• All - All data points are displayed.
• Last - Enter the number of data points to display.
•
Since Date - Data since the entered date will be plotted.
Display Plot Alarms will display the data point using its alarm color.
OilLabData
MJR Technologies LLC
18
SQL Server
The default Access database is adequate for individual users. SQL Server is a better choice for LAN users and web
based databases. With SQL Server, the server system processes a request and passes back the selected records
rather than passing all records to the client for processing. SQL Server or SQL Server Express must be installed on
your network and the Server must be configured to permit access from the client PCs. Information Systems support
may be required for proper configuration.
Server Name is the system name where the SQL server is located. Selecting the down arrow will initiate a search on
your LAN for available servers.
Windows Authentication mode is the Microsoft preferred authentication mode for SQL server.
SQL Server and Windows Authentication mode may be required for compatibility with existing network and SQL
server configurations.
SQL Server account for SQL Server Authentication mode is used to enter the User Name and Password for access to
the server system. The Name and Password are only used if SQL Server and Windows Authentication mode is used.
The password is encrypted before storage to assure safety.
Note: Windows Workgroup networks may require mirrored accounts on the server and the client. The
username and password must be identical.
OilLabData
MJR Technologies LLC
19
Note: Windows XP defaults to "simple file sharing" when using Workgroup networking. In this case, all users
come through as the "Guest" user. The Guest user should be enabled and password protected, and added to the SQL
Server users.
http://kbalertz.com/831133/Server-clients-authenticated-guests-Simple-Sharing-enabled.aspx
http://kbalertz.com/304040/Description-Sharing-Permissions-Windows.aspx
Note: For domain networks, you can speed the initial setup and configuration by adding the user “domain\domain
users” to SQL Server users, and granting access to your database. Adding individual users would be more secure.
OilLabData
MJR Technologies LLC
20
Severity
The vector display on the Sample Trend report may be customized to display Severity level names.
OilLabData
MJR Technologies LLC
21
Labels
Sample labels may be customized by selecting the desired fields. The barcode may be omitted if the lab cannot
interpret the embedded Area/Equipment/Point information. The Cust ID value is assigned by the oil lab.
Label dimensions may be set by typing in the fields or selecting the up/down arrows. Try printing on scrap paper as
it may take several iterations to determine the proper dimensions.
Note: The label dimensions are for sheet labels only. Settings for single label printers should be set through
Windows.
Preprogrammed labels can be selected from the Labels dropdown list. Verify that the dimensions will work for your
label/printer combination before printing large quantities.
If the Windows default printer is not used for labels, the label printer can be selected with the Label Printer button.
OilLabData
MJR Technologies LLC
22
Misc
The Misc sub tab is used for miscellaneous program settings.
Display New ISO parameters will replace particle count descriptions such as Cnts >2, Cnts >5, Cnts >15 with new
ISO equivalents Cnts >4, Cnts >6, Cnts >14.
OilLabData
MJR Technologies LLC
23