1
CALSoft 5 Help
© 2012 TechniCAL Inc
2
CALSoft 5 Help
Table of Contents
Foreword
0
Part I CALSoft Basics
7
Part II Main CALSoft Dashboard
9
Part III Background
11
Part IV Collect Data- Heat Penetration
13
1 What
...................................................................................................................................
is heat penetration?
13
2 Overview...................................................................................................................................
Main HP Dashboard
13
Running a.........................................................................................................................................................
new heat penetration test w ith CALPlex datalogger
14
HP Test Documentation
..................................................................................................................................................
tab
15
HP Data Collection
..................................................................................................................................................
Equipment tab
16
CALPlex Connection
........................................................................................................................................... 17
RTemp Connection
........................................................................................................................................... 18
HP Formulation
..................................................................................................................................................
tab
22
HP CritiCAL
..................................................................................................................................................
tab
22
HP Calibration
..................................................................................................................................................
Tab
23
HP Start Data
..................................................................................................................................................
Collection
24
HP Data Collection
..................................................................................................................................................
- Main screen
25
HP Data Collection
..................................................................................................................................................
- Time Temperature grid
26
HP Data Collection..................................................................................................................................................
Bar Graph
27
HP Data Collection..................................................................................................................................................
Zoom plotting during data collection
28
Entering event
..................................................................................................................................................
readings during HP test
29
Entering Log
..................................................................................................................................................
Data
29
Alert To Enter
...........................................................................................................................................
Log Entries
30
Ending a test
.................................................................................................................................................. 31
Losing Communication
..................................................................................................................................................
w ith CALPlex during a text
32
Losing Pow
..................................................................................................................................................
er during data collection
33
Opening/editing
.........................................................................................................................................................
existing CALSoft files
34
Test Documentation
..................................................................................................................................................
tab
34
Data Collection
..................................................................................................................................................
Equipment tab
35
Formulation
..................................................................................................................................................
tab
36
CritiCAL tab
.................................................................................................................................................. 37
Calibration..................................................................................................................................................
Tab
38
Time/Temperature
..................................................................................................................................................
Tab
39
Reset Start...........................................................................................................................................
End Time
40
Log Data tab
.................................................................................................................................................. 43
Summary Tab
.................................................................................................................................................. 44
Im porting.........................................................................................................................................................
Files into CALSoft 5
45
Importing DataTrace
..................................................................................................................................................
and Ellab files
45
Importing Excel
..................................................................................................................................................
Files
46
Importing Comma
..................................................................................................................................................
Separated Files
50
Manual File
.........................................................................................................................................................
Creation
53
Calibration......................................................................................................................................................... 56
Backup File
......................................................................................................................................................... 57
3 HP...................................................................................................................................
File Command Options (Ribbon Menu Commands)
58
© 2012 TechniCAL Inc
Contents
3
Save/Save.........................................................................................................................................................
As
58
Export Data
.........................................................................................................................................................
to Com m a Seperated Value
59
Reports and
.........................................................................................................................................................
Report Form ats (PDF, Excel, Word, CSV)
59
Em ail CALSoft
.........................................................................................................................................................
File
60
Zoom plotting
......................................................................................................................................................... 61
Part V Collect Data- Temperature
Distribution
64
1 What
...................................................................................................................................
is Temperature Distribution
64
2 Overview...................................................................................................................................
- Main TD Dashboard
64
Running a.........................................................................................................................................................
new Tem perature Distribution test w ith CALPlex datalogger_2
65
TD Test Documentation
..................................................................................................................................................
tab
66
TD Data Collection
..................................................................................................................................................
Equipment tab
67
TD Lead Location
..................................................................................................................................................
tab
68
TD Calibration
..................................................................................................................................................
tab
69
TD Start Data
..................................................................................................................................................
Collection
70
TD Data Collection..................................................................................................................................................
Main Screen
70
TD Data Collection
..................................................................................................................................................
Time Temperature grid
71
TD Data Collection..................................................................................................................................................
Bar Graph
72
TD Data Collection..................................................................................................................................................
Zoom plotting during data collection
73
Entering event
..................................................................................................................................................
readings during TD test
73
Entering Log
..................................................................................................................................................
Data
75
Ending a test
.................................................................................................................................................. 75
Losing Communication
..................................................................................................................................................
w ith CALPlex during a test
76
Losing Pow
..................................................................................................................................................
er during data collection
76
Opening/editing
.........................................................................................................................................................
existing CALSoft TD files
76
Test Documentation
..................................................................................................................................................
tab
76
Data Collection
..................................................................................................................................................
Equipment tab
77
Lead Location
..................................................................................................................................................
tab
78
Calibration..................................................................................................................................................
Tab
78
Time/Temperature
..................................................................................................................................................
Tab
79
Log Data tab
.................................................................................................................................................. 79
Summary Tab
.................................................................................................................................................. 80
Im porting.........................................................................................................................................................
Files into CALSoft 5
81
Importing DataTrace
..................................................................................................................................................
and Ellab files
81
Importing Excel
..................................................................................................................................................
Files
82
Importing Comma
..................................................................................................................................................
Separated Files
82
Manual File
.........................................................................................................................................................
Creation TD
82
Calibration......................................................................................................................................................... 85
Zoom plotting
......................................................................................................................................................... 85
Backup File
......................................................................................................................................................... 85
3 TD...................................................................................................................................
File Command Options (Ribbon Menu Commands)
86
Save/Save.........................................................................................................................................................
As
86
Export Data
.........................................................................................................................................................
to Com m a Separated Value
87
Reports and
.........................................................................................................................................................
Report Form ats (PDF, Excel, Word, CSV)
87
Em ail CALSoft
.........................................................................................................................................................
File
88
Zoom plotting
......................................................................................................................................................... 89
Part VI Evaluate Data- Set a Process
91
1 What
...................................................................................................................................
is Setting A Process?
91
2 Calculation
...................................................................................................................................
Methods
92
© 2012 TechniCAL Inc
4
CALSoft 5 Help
Ball Form ula
.........................................................................................................................................................
Method
92
General Method
......................................................................................................................................................... 93
3 Overview...................................................................................................................................
Main Set A Process Dashboard
94
The Process
.........................................................................................................................................................
Calculation (ProCal) Data-Base
94
Set a New .........................................................................................................................................................
Process
95
Loading Heat
..................................................................................................................................................
Penetration files to evaluate
96
Set up Basic
..................................................................................................................................................
Process Information
97
View ing/printing/Editing
..................................................................................................................................................
Time/Temperature data
97
Check for Zero
...........................................................................................................................................
Scans
98
View ing/Printing/Editing
..................................................................................................................................................
the formulation information
99
View ing/Printing/Editing
..................................................................................................................................................
CritiCAL
99
Establishing
..................................................................................................................................................
Ball Formula plotting defaults
99
Plotting data
.................................................................................................................................................. 101
Plotting Heating
...........................................................................................................................................
data to get Ball Formula heating factors
102
Plotting Tips
...................................................................................................................................... 104
Plotting Cooling
...........................................................................................................................................
data to get Ball Formula cooling factors
105
Lethal Rate
...........................................................................................................................................
plots
107
Using CALSoft to compare factors from multiple HP files for Ball Formula
calculation
.................................................................................................................................................. 109
Calculating
..................................................................................................................................................
a Process using Ball Formula
109
Process calculation
........................................................................................................................................... 110
Assignment
...........................................................................................................................................
of Critical Factors
111
Lethality Calculation
........................................................................................................................................... 112
Generating
...........................................................................................................................................
Final Process report
114
Open Existing
.........................................................................................................................................................
Process Calculation
115
Delete a ProCal
.........................................................................................................................................................
Record
117
Quick Ball.........................................................................................................................................................
Form ula Calculation
117
Reports availalbe
.........................................................................................................................................................
to help Set A Process
118
Print Lethal
..................................................................................................................................................
Rate report
118
Print Accumulated
..................................................................................................................................................
F report
120
Print Time/Temperature
..................................................................................................................................................
report
122
Print Formulations
.................................................................................................................................................. 123
Print Plots.................................................................................................................................................. 125
Part VII Evaluate Data- Set a CUT/Vent
127
1 What
...................................................................................................................................
is Setting a CUT / Vent?
127
2 Overview...................................................................................................................................
Main Set A CUT/Vent Dashboard
128
The CUT/Vent
.........................................................................................................................................................
(TDCal) Data-Base
128
New CUT/Vent
......................................................................................................................................................... 129
Loading TD
..................................................................................................................................................
files to evaluate
129
Set up Basic
..................................................................................................................................................
TD Information
130
View ing/printing/Editing
..................................................................................................................................................
Time/Temperature data
131
View ing/Printing/Editing
..................................................................................................................................................
Lead location diagrams
132
View ing Plotted
..................................................................................................................................................
data
132
Min/Max Plotted
...........................................................................................................................................
data
133
Add Log......................................................................................................................................
Entries to Min/Max printout
134
Pre-CUT Plotted
...........................................................................................................................................
data
135
Zoom Plot........................................................................................................................................... 136
Using CALSoft
..................................................................................................................................................
to conduct a Min/Max analysis of all TD data
136
Establishing
..................................................................................................................................................
a Vent/CUT scheudle
137
Venting Schedule
........................................................................................................................................... 138
Come-Up ...........................................................................................................................................
schedule
139
Adding Temperature
...........................................................................................................................................
Distribution Conditions
140
© 2012 TechniCAL Inc
Contents
5
Generating
...........................................................................................................................................
Final Vent/CUT schedule report
141
Open Existing
.........................................................................................................................................................
CUT/Vent
143
Delete a CUT/Vent
.........................................................................................................................................................
Record
144
3 Reports
...................................................................................................................................
availalbe to help Establish a Vent or CUT
145
Print
Print
Print
Print
Print
Print
Lethal
.........................................................................................................................................................
Rate report
145
Accum
.........................................................................................................................................................
ulated F report
147
Tim.........................................................................................................................................................
e/Tem perature report
148
Lead
.........................................................................................................................................................
Locations
149
Plots
......................................................................................................................................................... 150
MinMax
......................................................................................................................................................... 151
Part VIII Evaluate a Deviation
154
1 What
...................................................................................................................................
is Evaluating a Deviation?
154
2 The
...................................................................................................................................
Deviation (DevCal) Data-Base
155
3 Evaluating
...................................................................................................................................
a Deviation using CALSoft
155
Main Deviation
.........................................................................................................................................................
Evaluation page
156
Use Existing
.........................................................................................................................................................
ProCal record to evaluate Deviation
156
Enter inform
.........................................................................................................................................................
ation about deviation
158
Using Ball.........................................................................................................................................................
Form ula calculation to evaluate deviation
158
Deviation.........................................................................................................................................................
Evaluation Results
159
Generating
.........................................................................................................................................................
Final Deviation Evaluation report
160
Part IX Other Tools/Features
163
1 Software
...................................................................................................................................
Security/Activation Code
163
Autom atic
.........................................................................................................................................................
updates
164
2 File
...................................................................................................................................
management
164
Heat Penetration
.........................................................................................................................................................
and Tem perature Distribution Data Files:
164
Calibration
.........................................................................................................................................................
Files
165
Process .........................................................................................................................................................
Database
165
3 Fh
...................................................................................................................................
Conversion
166
4 Temperature
...................................................................................................................................
Conversion
167
5 Lethal
...................................................................................................................................
Rate table
169
6 CALPlex
...................................................................................................................................
diagnostic
170
7 Quick
...................................................................................................................................
Viewer
171
8 CritiCAL
...................................................................................................................................
Template
172
9 Beep
...................................................................................................................................
When Scanning During Data Collection
173
10 Delay
...................................................................................................................................
Start of Data Collection
174
11 Collect
...................................................................................................................................
HP Set Default Free Leads
175
Index
© 2012 TechniCAL Inc
177
Part
I
CALSoft Basics
1
7
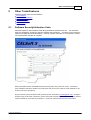
CALSoft Basics
Select the icon below to view Help topics available for each CALSoft section
OTHER HELP ITEMS:
CALSoft Background
Main CALSoft Dashboard
Other Tools/Features
www.tcal.com
© 2012 TechniCAL Inc
Part
II
Main CALSoft Dashboard
2
9
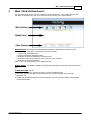
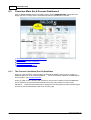
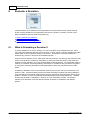
Main CALSoft Dashboard
The CALSoft5 home page is the main “dashboard” for the application. This screen gives the user
the ability to navigate to any part of the program and access any of the “other features”.
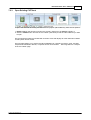
MAIN SECTION: The CALSoft5 dashboard MAIN SECTION is divided into five sections, which
represent the five major tasks conducted by a Process Authority:
1. Collect Heat Penetration Data
2. Collect Temperature Distribution Data
3. Evaluate HP data and establish a Thermal Process
4. Evaluate TD data and establish a Come Up time or Vent Schedule
5. Evaluate a Processing Deviation
Click on any one of the section icons to begin that task.
MIDDLE PANEL: The MIDDLE PANEL will then display task-specific commands and recently used
files.
OTHER FEATURES include:
Customize Preferences, CritiCAL Template, or Create a Calibration File
TechniCAL Support including contact information for TechniCAL Support and a CALPlex
Diagnostic tool
Utilities that include the ability to email CALSoft files, check for CALSoft updates, and the ability
to uninstall CALSoft.
© 2012 TechniCAL Inc
Part
III
Background
3
11
Background
The objective of thermal processing is to deliver temperature into a package of product
(referred to as “Canned Foods”) in a quantity sufficient to cause the death or destruction of all
microorganisms of public significance as well as those of economic spoilage concern. To
accomplish this objective, the packaged, hermetically sealed product (in metal cans, glass jars,
flexible pouches, semi-rigid plastic) is loaded into large sterilizer machines (also called retorts
or autoclaves). These retorts utilize steam or water as the heating medium under pressure
to achieve a high temperature environment in which the product is ultimately sterilized.
Simply put, canned food products must be properly sterilized in order to ensure the safety of
that product to the consumer.
Processing Authorities undertake the task of determining what a “safe process” is and ensure
that the retort can actually deliver that process time/temperature in a safe and effective
manner. These two tasks are further explained as follows:
(1) Thermal Processes for specific canned food products are developed by conducting
heat penetration testing, evaluating the collected data, and using calculation methods
to determine time, temperature, and lethality values.
(2) Our ability to accurately determine the time/temperature history of the entire retort
is vitally important to ensuring the thermal process is delivered to each and every
container. The temperature distribution test is used for documenting this time/
temperature history under a set of controlled retort processing conditions.
Regulatory agencies require that Process Authorities “have facilities, instrumentation, and
equipment adequate to determine the heat processing requirements of the food product”,
“use acceptable scientific methods of establishing heat sterilization processes”, and
“maintain records which cover all aspects of the process establishment”.
The CALSoft™ software was designed by TechniCAL (the leading independent Process
Authority) as a tool to be used specifically for assisting experienced, knowledgeable Process
Authorities with the task of conducting this testing and evaluation of canned foods and retort
sterilizers.
© 2012 TechniCAL Inc
Part
IV
Collect Data- Heat Penetration
4
13
Collect Data- Heat Penetration
CALSoft allows you to conduct a Heat Penetration test and collect the time/temperature data-file on
your computer.
What is Heat Penetration
Overview- Main HP Dashboard
HP File Command Operations (Ribbon Menu)
4.1
What is heat penetration?
“The purpose of a heat penetration study is to determine the heating and cooling behavior of a
product/package combination in a specific retort system for the establishment of safe thermal
processes and evaluating process deviations. The study must be designed to adequately and
accurately examine all critical factors associated with the product, package and process which
affect heating rates. Numbers of containers per test run, and number of test runs to account for
statistical variability are important considerations. Before commencing a heat penetration study, an
evaluation of retort temperature and heat transfer uniformity, at times referred to as a heat or
temperature distribution study, should have been completed. A goal in conducting these studies is
to identify the worst case temperature response expected to occur in commercial production as
influenced by the product, package and process.”
Institute for Thermal Processing Specialists
Protocol For Carrying Out Heat Penetration Studies (November 10, 1995)
CALSoft is a tool used to conduct these heat penetration tests. The resulting CALSoft “Heat
Penetration Data File” contains the recorded time/temperature data from the test, in addition to
pertinent information such as product formulation, critical factor measurements, temperature and
lethality setpoints, etc.
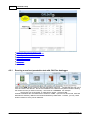
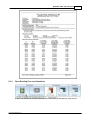
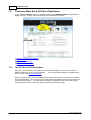
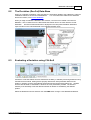
4.2
Overview- Main HP Dashboard
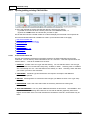
Click on “Heat Penetration” button in the Main Section and the MIDDLE PANEL will populate with
information relevant to conducting a heat penetration test. The middle panel will display the last 5
“recently used” Heat Penetration Data Files that were opened in CALSoft.
© 2012 TechniCAL Inc
14
CALSoft 5 Help
Running a New Heat Penetration Test
Opening/Editing existing CALSoft data file
Importing DataTrace and Ellab Files
Importing Excel Files
Manual File Creation
Calibration
Backup File
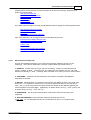
4.2.1
Running a new heat penetration test with CALPlex datalogger
Click on the “NEW” button to begin a new Heat Penetration (HP) test. CALSoft will then ask you to
name and save to HP data file. The file name defaults to the date and sequential number indicating
the number of tests you have run that day. The format is YYMMDD##. For example:
The first test run on December 15, 2009 will be named... 09121501.chp
All Heat Penetration files are saved with the extension “.CHP”. Upon first use of CALSoft, these HP
data files are stored by default in the CALSoft subdirectory titled “Data”. However, you may chose
another location to store your HP data files.
© 2012 TechniCAL Inc
Collect Data- Heat Penetration
15
CALSoft allows you five sections to enter information about the HP test design, equipment and
product that will be tested:
Test Documentation tab
Data Collection Equipment tab
Formulation tab
CritiCAL tab
Calibration tab
Start Data Collection
Once Data Collection begins, CALSoft provides different views to display the time/temperature data.
Main HP Data Collection Screen
Time Temperature Grid
Bar Graph
Zoom Plotting during Data Collection
Also, other information can be logged into the CALSoft file during the test..
Entering Event readings during HP test
Entering Log Data during HP test
Ending a test
Losing Communication with CALPlex
Losing Power during data collection
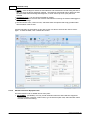
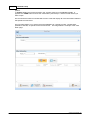
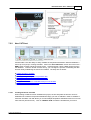
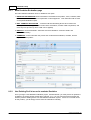
4.2.1.1
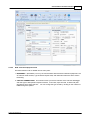
HP Test Documentation tab
The test documentation tab allows you to document information related to the test you are
conducting. The screen is divided into 5 sections (required fields are marked with an *)
1. PRODUCT- Product name and "type" that you are testing. Chose Low Acid Canned Food
(LACF), Acidified, or Other. Choosing LACF or Acidified will automatically set the z and Tref
values for the sterility "F" value. Choosing "other" will allow you to enter your own z and Tref values.
2. CONTAINER- Container type and dimensions are required. Description and additional
information are optional.
3. RETORT- Choosing Batch or Continuous retort will give you different choices in the "type" dropdown menu. It is important to note that the m+g factor is determined based on our selection of
retort. The m+g is the factor used in the Ball Formula that represents the difference between the
retort temperature and cooling water. Traditionally, for Steam retorts, the m+g = 180oF (100oC) and
for Water retorts, the m+g = 130oF (72.2oC).
4. PROCESSOR - This is the name and location of the factory where the HP testing was
conducted.
5. TEST INFORMATION- Enter information about this specific test such as:
Test Type: you can designate this test as a Confirmation HP test, or a "cold spot study"
© 2012 TechniCAL Inc
16
CALSoft 5 Help
Targets: enter the target F and RT for data-collection and CALSoft will use that during the test to
alert you when the targets have been reached. The target RT entered will help to determine when
the Free Leads reach the designated target RT, or when "Come Up Time" (CUT) has been
achieved.
Temperature Type: you can chose Fahrenheit or Celsius.
Scan intervals: This is the time that CALSoft waits between scanning the CALPlex datalogger for
Temperature readings.
The Technician's name, reason for test, and Notes fields are optional and simply provide further
documentation of the HP test
CALSoft will retain the information on this page for the next test to eliminate the need to enter it
again. To clear the fields, click "CLEAR ALL" button.
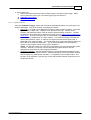
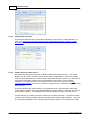
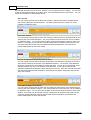
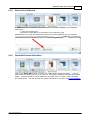
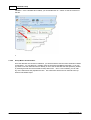
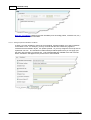
4.2.1.2
HP Data Collection Equipment tab
The Data Collection Tab is divided into two main parts:
1. EQUIPMENT: (OPTIONAL) You may record information about the data-collection equipment
such as CALPlex or RTemp, serial number, type of thermocouples used, and information about
the wires used in the testing.
© 2012 TechniCAL Inc
Collect Data- Heat Penetration
17
2. Data Logger Type
Data can be collected with the CALPlex Data Logger or the RTemp Data Logger. Make
sure to select the correct type in the Data Logger Type pull down box.
a) CALPLEX Connections
b) RTemp Connections
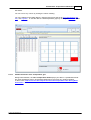
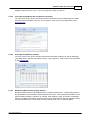
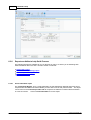
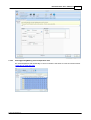
4.2.1.2.1 CALPlex Connection
Click the "SCAN Data Logger" button and CALSoft will automatically detect the connection to the
CALPlex datalogger, scan all 32 channels, and display the results:
Lead Type: A channel can be designated as either a Thermocoupled container, Free Lead,
Open Channel, or Bad Lead. Different icons represent each type. CALSoft scans
CALPlex and determines which of the 32 channels have something connected. CALSoft
will determine which leads are by default "Free Leads" from the Collect HP Set Default Free
Leads Utility , all other connections are "Thermocoupled Containers". If nothing is detected
in a channel, it is displayed as an "Open Channel". If you have something connected to a
channel designated as "Open", it could be an indication that the thermocouple, lead, or
datalogger is not working properly. You should either fix the equipment before beginning the
test or set the channel to a "Bad Lead". Any channel designation can be changed by
clicking on that channel until the correct type is displayed.
NOTE: CALSoft will actually scan and record temperatures on all 32 channels during datacollection. However, you will only see the channels during data collection that are
designated as Free Leads or Thermocoupled Containers.
Temperature Reading: CALSoft will also display the current temperature readings for each
Free Lead and Thermocoupled container. CALSoft averages all of the temperature readings
and will display any readings that are within +/- 5 degrees from the average in RED. This
will help you to determine if you have any issues with the data-collection equipment prior to
starting the HP test.
© 2012 TechniCAL Inc
18
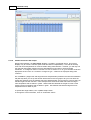
CALSoft 5 Help
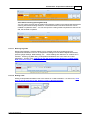
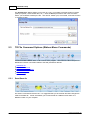
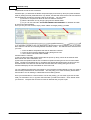
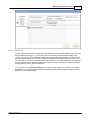
4.2.1.2.2 RTemp Connection
Collecting data with the RTemp system requires an additional setup that is accomplished by
following these easy steps.
1) Ready the RTemp System by turning on the DAM Unit(s):
(a)For DAM units with a toggle On-Off Switch, move the switch to On. For those units
without an On-Off toggle switch (silver canister models) simply plug one end of the
external charger into a properly wired 110-240 volt circuit, and plug the other end, which
is the end installed with the white miniature style female connector into the white spade
style connector on top of the unit. This will turn on the DAM. Now unplug the charger
connector from the DAM, and the unit will stay on for up to 4 hours. If no
communication is established between the DAM and the Poller after 4 hours, the DAM
powers down. You can now connect the antenna supplied with the DAM, and you are
ready to start testing.
2) Connect the poller to the computer.
3) Select RTemp for the Data Logger Type on the HP (Or TD) Data Collection Equipment Tab.
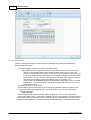
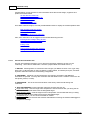
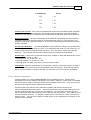
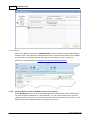
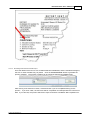
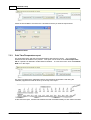
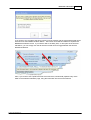
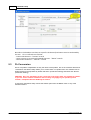
4) Click on the Scan Data Logger button. You will be shown a form with two choices New
Config or Load Config
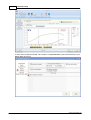
(a)New Config
Enter the DAM Unit ID number in the first field in the data grid. Click on the Check Status
button in the center column. If the Poller and DAM units are communicating, you should receive
the "Passed" Reply in the Status column. If the units are not communicating, the reply will be
failed. For each DAM unit to be used in the test, repeat this process. This picture shows two
© 2012 TechniCAL Inc
Collect Data- Heat Penetration
19
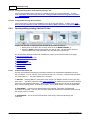
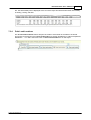
units in this test.
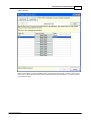
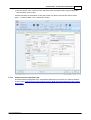
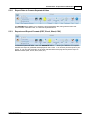
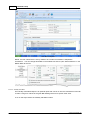
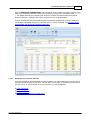
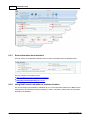
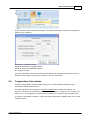
Click the Next button to configure the DAM Channels to the desired CALSoft Channels. The picture below show s
the form for tw o DAM units being configured to be mapped to different CALSoft Channels. You can associate up
to 32 CALSoft Channels.
© 2012 TechniCAL Inc
20
CALSoft 5 Help
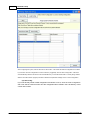
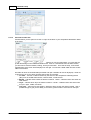
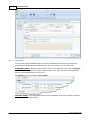
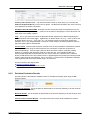
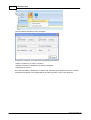
After configuring the system, click the Send Scan Table button. This sends the desired configuration to the Poller.
If you w ant to save the configuration for future reference (suggested), click the Save Config button. CALSoft 5
w ill automatically name the file and save it to the data directory for the CALSoft file that is currently being created.
Click the OK button and the program proceeds to detect the temperature readings for this current configuration.
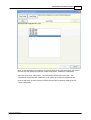
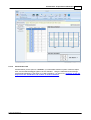
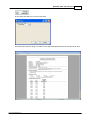
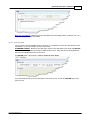
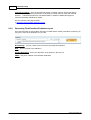
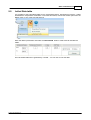
(b)Load Config
If you have already saved a DAM configuration and desire to use it, Click the Load Config button
and a form will be shown that lists all of the configuration files created in the sub-directory of this
current files location.
© 2012 TechniCAL Inc
Collect Data- Heat Penetration
21
Click on the Next button (Or double-click on the file name in the grid) The program will move to
the next step and display the previously saved Configuration. Review the configuration.
Select the Send Scan Table button. The configuration will be sent to the Poller. The
configuration has already been saved so it is not needed to re-save the configuration file.
Click the OK button and the program proceeds to detect the temperature readings for this
current configuration.
© 2012 TechniCAL Inc
22
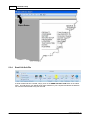
4.2.1.3
CALSoft 5 Help
HP Formulation tab
OPTIONAL. The formulation tab allows you the option of entering information about the formula of
the product that you are testing in the heat penetration test. This information is permanently saved
into the CALSoft data-file for future reference. Enter the CODE and/or FORMULATION NUMBER
for the product. Then enter the ingredients, recording the amount used in NORMAL PRODUCTION
and also the amount used in the HEAT PENETRATION TEST.
This information can be entered before, during, or after the actual test is conducted.
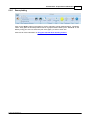
4.2.1.4
HP CritiCAL tab
The CritiCAL Tab allows you the option of entering CRITICAL FACTORS associated with each
thermocoupled container in the heat penetration test. The default CritiCAL template grid includes
many common critical factors. You may remove/add Critical Factors by clicking "Customize
CritiCAL Factors" and then turning on/off any factors you wish to display. The "Cell Copy" feature
allows you to enter a value and then click "Cell Copy" to copy that information into each cell in that
column.
Using this CritiCAL feature allows you to (a) permanently record the critical factors for each
© 2012 TechniCAL Inc
Collect Data- Heat Penetration
23
thermocoupled container tested, and (b) use that data when using CALSoft to evaluate the HP test
data and establish a thermal process.
This information can be entered before, during, or after the actual test is conducted.
4.2.1.5
HP Calibration Tab
CALSoft allows you the option to calibrate your entire data-collection system of thermocouples,
wires, and CALPlex datalogger against a known standard in order to zero-out any possible errors.
This is typically accomplished by bundling the thermocouples/wires inside the retort near the
temperature sensor of the calibrated Temperature Indicating Device (MIG or Digital Temperature
Gauge), brining the retort up to a temperature normally used during production (i.e. 250 degrees F),
and holding the temperature steady. Once the retort has "equilibrated" at the setpoint temperature,
you can use CALSoft to capture OFFSETS for each of the 32 channels. This is referred to as
"calibration" within CALSoft.
To Calibrate your data-collection system, enter a REFERENCE TEMPERATURE and chose NEW
FILE. CALSoft will scan the CALPlex datalogger and capture an offset (difference) against the
reference temperature for each of the 32 channels. The collection of these offsets are referred to as
a calibration file. Calibration files can be saved on your computer (by default, Calibration files are
saved in the CALSoft/CALIBRATION directory) and APPLIED to your test by clicking on "APPLY
FACTORS TO FILE". To apply an already created calibration file, click on the file from the list or
click"Find and Copy...". Once the file is located, click "APPLY FACTORS TO FILE. When a
Calibration File is set to be APPLIED, the offsets will be applied to all data collected during the test.
To remove the offsets (calibration factors), click on REMOVE FACTORS FROM FILE.
© 2012 TechniCAL Inc
24
CALSoft 5 Help
NOTE TO CALSoft 32 users- if you used a calibration file during a test, CALSoft 5 saves the
calibration offsets in the data-file and no longer requires that the calibration file be present.
4.2.1.6
HP Start Data Collection
The final screen in the setup process is the "Data Collection" tab. This allows you three options:
1. SCAN ONCE: Test the data-collection setup by Scanning the CALPlex datalogger once to see
what the reading are
2. SCAN MULTIPLE TIMES: This option will begin scanning (but not recording) the CALPlex box
continuously. This can help you test your data collection equipment setup prior to formally
starting the test.
3. START DATA COLLECTION: This option will begin the Heat Penetration test. The timer for the
test will start and data logging will begin.
© 2012 TechniCAL Inc
Collect Data- Heat Penetration
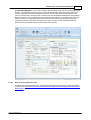
4.2.1.7
25
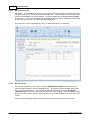
HP Data Collection - Main screen
The default view during Data Collection is called the "Main Data Collection Screen". This screen
displays only all "active" channels (Free Leads and Thermocoupled leads). CALSoft will actually
scan and record temperatures on all 32 channels during data-collection. However, you will only see
the channels during data collection that are designated as Free Leads or Thermocoupled
Containers. To change the status of channel or to turn a channel on or off, go to the Data Collection
Equipment tab and click on a channel to change it's type. It will then be displayed during data
collection.
This screen displays the channel number, type (graphically shows Thermocouple or Free Lead),
current reading, previous reading, the difference between the two ("Delta T"), the lethal rate, and the
accumulated F (Total F). Any calibration factors that are applied are shown in the last column.
CALSoft will help you visually know which channel is the highest and lowest. The Thermocoupled
container with the highest reading is displayed in RED and the lowest reading in BLUE. Since this
is a Heat Penetration test, Free Leads are not considered in the high-low feature.
You can sort on any column by clicking the column heading.
You can navigate to other data views by using the tabs across the top for Time/Temperature, Bar
Plot, and Log Data... or view the data on a time/temperature graph by clicking the "Zoom Plot"
© 2012 TechniCAL Inc
26
CALSoft 5 Help
button
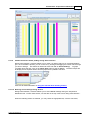
4.2.1.8
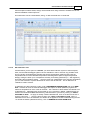
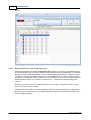
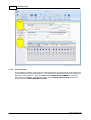
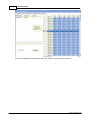
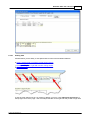
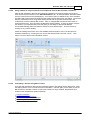
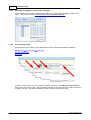
HP Data Collection - Time Temperature grid
During Data Collection, the "Time Temperature Grid" displays your data in a spreadsheet format.
This screen displays only all "active" channels (Free Leads and Thermocoupled leads). CALSoft will
actually scan and record temperatures on all 32 channels during data-collection. However, you will
only see the channels during data collection that are designated as Free Leads or Thermocoupled
Containers. To change the status of channel or to turn a channel on or off, go to the Data Collection
Equipment tab and click on a channel to change it's type. It will then be displayed during data
collection.
By default, the most recent scan is displayed at the top of the grid. To reverse this order, simply
click on the "Time" column heading.
Channels with "Free Leads" are marked graphically under the Channel number and are displayed as
BLUE columns to visually assist you in determining which channels are Free Leads and which are
Thermocoupled Containers.
© 2012 TechniCAL Inc
Collect Data- Heat Penetration
4.2.1.9
27
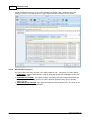
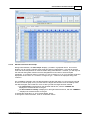
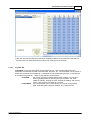
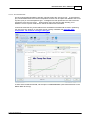
HP Data Collection- Bar Graph
During Data Collection, the "Bar Graph" displays your data in a graphical format. This screen
displays only all "active" channels (Free Leads and Thermocoupled leads). CALSoft will actually
scan and record temperatures on all 32 channels during data-collection. However, you will only see
the channels during data collection that are designated as Free Leads or Thermocoupled
Containers. To change the status of channel or to turn a channel on or off, go to the Data Collection
Equipment tab and click on a channel to change it's type. It will then be displayed during data
collection.
The "TARGETS" entered in the Test Documentation tab (first tab) when you set up the HP test will
be used on this bar graph to let you know when the targets are reached. Once the readings reach
the desired targets, the bar will turn colors to alert you that the target has been reached.
The Temperature is displayed on the left-hand vertical axis, with the "TARGET RT"
displayed as a horizontal line on the gird.
The Accumulated Lethality is displayed on the right-hand vertical axis, with the "TARGET F
" displayed as a horizontal line on the grid.
To update the Target RT or F, click "Update Graph" button.
To change the colors of the bars, click on "Customize" button
© 2012 TechniCAL Inc
28
CALSoft 5 Help
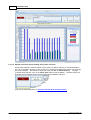
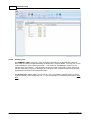
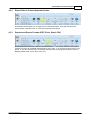
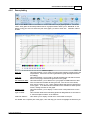
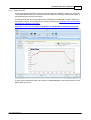
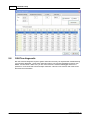
4.2.1.10 HP Data Collection- Zoom plotting during data collection
During Data Collection, CALSoft enables you to graph your data in real-time on a time/temperature
grid. Once the data is plotted, you can "zoom in" by clicking and dragging the mouse over the range
you wish to enlarge. This feature is referred to within CALSoft as "Zoom Plotting". To graph
your data during the test, click on the "Zoom Plot" button at the top Ribbon. The Zoom Graph will
be displayed in a separate window and the graph will be updated in real-time.
Click here for more information on using the CALSoft Zoom Plotting Feature
© 2012 TechniCAL Inc
Collect Data- Heat Penetration
29
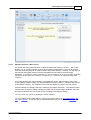
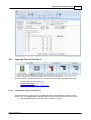
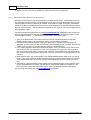
4.2.1.11 Entering event readings during HP test
During Data Collection, CALSoft enables you to enter "Event" readings during the Heat Penetration
test. To enter these events, use the tabs at the top of the screen during data-collection. .
CUT: The Come Up Time (CUT) is logged automatically as the time that each Free Lead reached
the Target RT. CALSoft will alert you automatically by displaying a message and changing the color
of the "CUT Reached" tab to GOLD when all Free Leads have reached the target Retort Temperature
(which is displayed under the tab). The CUT can be changed later when the data file is evaluated.
Cooling Reached:
Once the Cook Phase is completed and the retort goes into the Cooling Cycle, chose the "Cooling
Reached" tab and then click on Entered Cooling. The current time will be displayed, but you can
edit that accordingly. Enter the Cooling Water temperature (optional) which will be used if you plot
cooling data in the Ball Formula.
4.2.1.12 Entering Log Data
During Data Collection, CALSoft enables you to manually enter other readings during the Heat
Penetration test such as temperature readings from the MIG or Digital thermometer, pressure gauge
readings, RPM readings, etc. These readings are referred to as "LOG-DATA" in CALSoft. Use
the "LOG-DATA" tab across the top of the screen to quickly enter LOG readings during the test.
Chose the type of reading you want to log from the drop-down menu, Click "NEW" and CALSoft will
time-stamp your entry (you can change the time as necessary). Enter the reading and click "ADD".
The reading will be logged into the CALSoft datafile.
NOTE: Log Data can be entered after the test is complete.
Click here to learn how to set CALSoft to Alert you when to enter Log Entries during an HP or
TD test,
© 2012 TechniCAL Inc
30
CALSoft 5 Help
You can view your log entries by clicking on the Log Data tab. This will display a grid showing you
all the log-data that has been entered. You may also enter log readings here by choosing the type
(created in the "LOG LABELS" sub-tab), entering the time, entering the reading, and clicking "ADD".
The Log Entry will show up on the list.
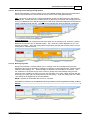
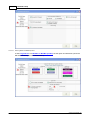
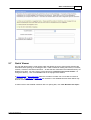
4.2.1.12.1 Alert To Enter Log Entries
CALSoft can alert you during the HP or TD test when it is time to record a "Log Entry". (click here
for more on Log Entries). To set this, go to PREFERENCES (in the Ribbon menu of any section,
or on the main Dashboard) and chose the COLLECT tab on the right. Then check "Reminder to Add
Log Entries During Data Collection" and enter a time interval (hours, minutes, seconds) that you
want to be reminded (i.e.. every 2 minutes would be 00:02:00). To turn off this feature, un-check
"Reminder to Add Log Entries During Data Collection"
© 2012 TechniCAL Inc
Collect Data- Heat Penetration
31
4.2.1.13 Ending a test
To End a test, click the "STOP" button at the top. CALSoft will display a message asking you to
confirm that you want to stop data collection. If you chose YES, CALSoft will stop scanning and
receiving data from CALPlex. The file will be "closed" and the Summary Page will be displayed.
Once data-collection is stopped, it cannot be re-started without beginning a new test.
Note For Data Collection where the Data Logger Type is the RTemp system:
At the end of Data Collection CALSoft 5 checks to see if there are any missing scans that can be
recovered from the RTemp DAM Units. RTemp stores data collection on each individual DAM unit.
It is possible that the RTemp poller might not be able to communicate with the DAM units during
data collection. At the end of test CALSoft and the RTemp poller will re-poll for these missed scans;
if the DAM unit is back in range the Poller will be able to recapture the missing scan information.
After about 30 seconds of polling for the missing DAM units the user can select to ignore the
missing scans and complete this test.
© 2012 TechniCAL Inc
32
CALSoft 5 Help
4.2.1.14 Losing Communication with CALPlex during a text
If your computer loses connection to the CALPLex datalogger during a test, CALSoft will display a
RED message notifying you to "Please Check CALPlex". The CALPlex may be off, the battery may
have run our of power, or the communication cable may have come unplugged.
Once the connection is re-established, data-collection is resumed at the current time and the RED
message will disappear. All data collected during the communication failure will be logged as
ZEROs.
© 2012 TechniCAL Inc
Collect Data- Heat Penetration
33
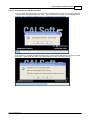
4.2.1.15 Losing Power during data collection
If your computer loses power during a test and the CALSoft program is closed, your data is not lost.
CALSoft saves the data-file after each scan. Once CALSoft is re-opened, you will be notified that
a HP test was in progress and asked you if you would like to recover the data....
If you chose Yes, CALSoft will determine how many scans were missed and ask you how you want
to precede. CALSoft will then open to the data-collection screen and resume the test.
© 2012 TechniCAL Inc
34
4.2.2
CALSoft 5 Help
Opening/editing existing CALSoft files
To open and view/edit an existing CALSoft HP data file, there are two options:
(1) double click on the file in the “recently used” list in the MIDDLE PANEL, or
(2) Click the “OPEN button and find the file you want to open.
The file will then load into CALSoft Collect HP mode and display all of the data in that specific file.
The Heat Penetration Data File is divided into "Tabs" (on the left-hand side of the page).
Test Documentation tab
Data Collection Equipment tab
Formulation tab
CritiCAL tab
Calibration Tab
Time/Temperature Tab
Log Data tab
Summary Tab
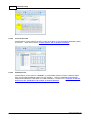
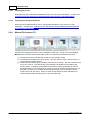
4.2.2.1
Test Documentation tab
The test documentation tab displays information related to the Heat Penetration test that was
conducted. You can edit any of the information that is in a "text box". Note that required fields are
mark ed with an *. This tab is divided into 5 sections:
1. PRODUCT- Product name and "type" that was testing. You can edit this section. For the type,
you can choose Low Acid Canned Food (LACF), Acidified, or Other. Choosing LACF or Acidified
will automatically set the z and Tref values for the sterility "F" value. Choosing "other" will allow
you to enter your own z and Tref values.
2. CONTAINER- Container type and dimensions are required. Description and additional
information are optional.
3. RETORT- Choosing Batch or Continuous retort will give you different choices in the "type" dropdown menu.
4. PROCESSOR- This is the name and location of the factory where the HP testing was
conducted.
5. TEST INFORMATION- You may enter additional information in this section. The TARGET F and
RT are the values used during data-collection as CALSoft will indicate graphically when these
targets are achieved. If this is an older CALSoft file converted to CALSoft 5, these values may be
blank.
© 2012 TechniCAL Inc
Collect Data- Heat Penetration
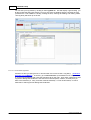
4.2.2.2
35
Data Collection Equipment tab
The Data Collection Tab is divided into two main parts:
1. EQUIPMENT: (OPTIONAL) You may record information about the data-collection equipment such
as CALPlex serial number, type of thermocouples used, and information about the wires used in
the testing.
2. CALPLEX CONNECTIONS: This section shows you the 32 channels of the CALPlex datalogger
and what type of lead (Thermocoupled container, Free Lead, Open Channel, or Bad Lead) was
plugged into each during the test. You can change the type of lead by clicking on the channel to
rotate through the options.
© 2012 TechniCAL Inc
36
CALSoft 5 Help
c
4.2.2.3
Formulation tab
The formulation tab allows you the option of entering information about the formula of the product that
you are testing in the heat penetration test. This information is permanently saved into the CALSoft
data-file for future reference. Enter the CODE and/or FORMULATION NUMBER for the product.
Then enter the ingredients, recording the amount used in NORMAL PRODUCTION and also the
amount used in the HEAT PENETRATION TEST.
© 2012 TechniCAL Inc
Collect Data- Heat Penetration
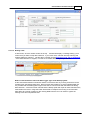
4.2.2.4
37
CritiCAL tab
The CritiCAL Tab allows you the option of entering CRITICAL FACTORS associated with each
thermocoupled container in the heat penetration test. The default CritiCAL template grid includes
many common critical factors. You may remove/add Critical Factors by clicking "Customize
CritiCAL Factors" and then turning on/off any factors you wish to display. The "Cell Copy" feature
allows you to enter a value and then click "Cell Copy" to copy that information into each cell in that
column.
Using this CritiCAL feature allows you to (a) permanently record the critical factors for each
thermocoupled container tested, and (b) use that data when using CALSoft to evaluate the HP test
data and establish a thermal process.
© 2012 TechniCAL Inc
38
4.2.2.5
CALSoft 5 Help
Calibration Tab
CALSoft allows you the option to "calibrate" your entire data-collection system of thermocouples,
wires, and CALPlex datalogger against a known standard. See HP Calibration for more information
on using CALSoft to collect calibration files.
© 2012 TechniCAL Inc
Collect Data- Heat Penetration
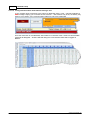
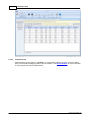
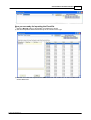
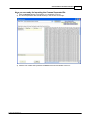
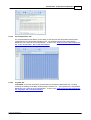
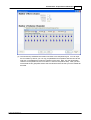
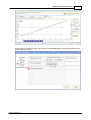
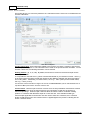
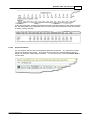
4.2.2.6
39
Time/Temperature Tab
The Time/Temperature Tab allows you the ability to view and print the temperature data that was
collected during the Heat Penetration test.
By default, only Thermocoupled Containers and Free Leads are displayed in the grid ("BAD" leads
and "OPEN" channels are not displayed by default).
Click the checkbox "Show All Leads" to display all 32 channels.
Click on the "Time" column heading to sort the time from ascending to descending.
Under each channel number is a graphical indication of the TYPE of lead (Free Lead or
Thermocoupled lead).
Free Leads are also shown as BLUE columns to help differentiate them from Thermocoupled
leads.
Use the Delete Scan button to Delete a scan (row) of data in the file. (Note: Use Reset Start/End
Time to Delete scans from the start of the file.)
Use the Reset Start/End Time button to delete one or multiple rows from the Start or End of the
Data File
Check for Zero Scans utility to check the file for any zero readings in the file. This utility allows
the user to replace the zero value with another value.
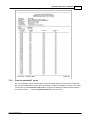
Lethal Rate Report returns the cumulated lethality for a selected Lead.
Accumulated F Report calculates the General Method F for all of the leads in the file.
Raw Data Report prints the Time/Temperature data for the file.
© 2012 TechniCAL Inc
40
CALSoft 5 Help
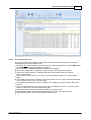
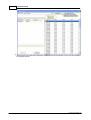
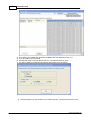
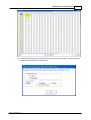
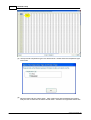
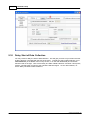
4.2.2.6.1 Reset Start End Time
The Reset Start/End Time utility allows the CALSoft user to remove data scans (rows) of data from
the Start or End of a File.
From the Time Temperature control select the Reset Start/End Time Button
CALSoft 5 will ask you if you want to Reset the Start/End Time for the file.
CALSoft 5 will make a backup of the current file and tell you the file name and location.
© 2012 TechniCAL Inc
Collect Data- Heat Penetration
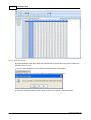
41
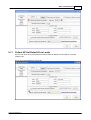
The Reset Start/End Time form will be shown. This form displays the Time/Temperature
information for the given file in the right panel. The new Start and End Time will be established in
the left panel.
In the Right Panel double click on the row selector to select the new Start Time.
© 2012 TechniCAL Inc
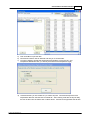
42
CALSoft 5 Help
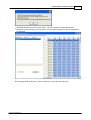
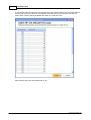
Next in the Right Panel double-click on the row selector to select the new End Time.
© 2012 TechniCAL Inc
Collect Data- Heat Penetration
43
After the new Start and End Time have been established Select OK and CALSoft 5 will save the
file with these new Start and End Time values and modify the file accordingly.
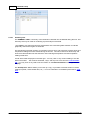
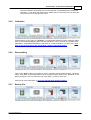
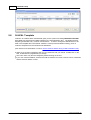
4.2.2.7
Log Data tab
"LOG-DATA" is the other information recorded during a test. This includes readings that are
periodically recorded from the MIG, Chart Recorder, Pressure, etc. CALSoft allows you the option to
record this information into the data-file. LOG-DATA can be entered during the test, or after the test
is completed using this tab. There are two sub-tabs in this section:
- LOG-GRID this shows you all the log-data that has been entered. You may also
enter log readings here by choosing the type (created in the "LOG
LABELS" sub-tab), entering the time, entering the reading, and clicking
"ADD". The Log Entry will show up on the list.
- LOG LABELS - this sub-tab allows you to create WHAT you want to monitor/record
(MIG, Chart Recorder, Pressure, Rotation, etc.) during the test.
© 2012 TechniCAL Inc
44
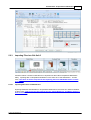
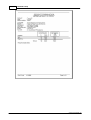
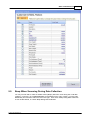
4.2.2.8
CALSoft 5 Help
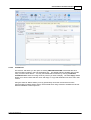
Summary Tab
The SUMMARY TAB is a summary of the information collected into the data-file during the test.
Free Leads and Thermocoupled Containers are displayed in separate tables. You may click on any
column heading to sort the data on that table. The column for "TC Position" comes from the
CritiCAL factor "TC Position". This Summary tab may be useful in conducting a quick analysis of
the data, especially in helping to determine the "cold spot" in the container for future thermocouple
placement for subsequent Heat Penetration tests.
The "Backup File" feature allows you to back up a copy of your data to another location or device
(USB "jump drive", external hard drive, etc.). For more informaiton on the Backup File feature, click
here
© 2012 TechniCAL Inc
Collect Data- Heat Penetration
4.2.3
45
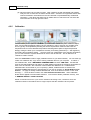
Importing Files into CALSoft 5
CALSoft 5 allows a number of data files to be imported into the Collect Heat Penetration Utility.
Importing DataTrace and Ellab Files
Importing Excel Files
Importing Comma Separated Values (CSV)
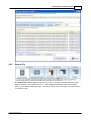
4.2.3.1
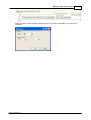
Importing DataTrace and Ellab files
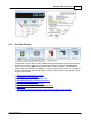
CALSoft5 allows for a direct import of HP data files collected with DataTrace or Ellab systems.
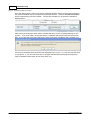
Simply click on the Import button and follow these steps:chose the file type you want to import
(1) click the Browse button to find the file you would like to import
© 2012 TechniCAL Inc
46
CALSoft 5 Help
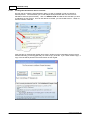
(2)
(3)
(4)
(5)
(6)
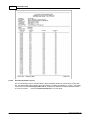
The time-temperature data should show up in the section on the right
Find the row of data that represents the Start of the test and double click on it.
Then find the row of data that represents the End of the test and double click on it
Then click OK to import the data
CALSoft will create a new HP data file that you can name/save as you wish
CALSoft will import the time/temperature data from the Data Trace or Ellab file. After creating a file
with the Import utility the user is taken into the Collect HP or TD file viewer. CALSoft 5 now
populates the file with Test Documentation information from the last collected or Imported/Manually
Created file information. If the values that were input by default are not correct the user can select
the Clear All button at the top right of the form. The final result will be a new CALSoft Heat
Penetration Data File containing the time/temperature data.
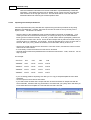
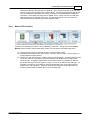
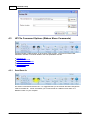
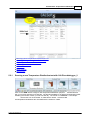
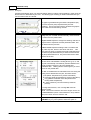
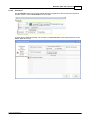
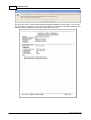
4.2.3.2
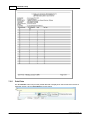
Importing Excel Files
Excel data files are imported using the same procedures as importing DataTrace and Ellab files.
However, the format of the Excel file must be set up correctly for the import to work. The format is
as follows:
- You must put your Time/Temperature data in the first Sheet of the Excel Spreadsheet.
- The first column of the spreadsheet must include the TIME in the format of HH:MM:SS. Excel
will try to convert your entry into an actual date/time format (you do not want this format). To fix
this, you will need to add an apostrophe (‘) before the time you enter into each cell in Excel.
Excel will then interpret this as plain text and will not try to convert the entry to a date/time. For
example... Excel will translate 00:10:10 as 12:10 am and 10 seconds. But if you put a (‘) before
the numbers, Excel will read it directly as 00:10:10
- The first row should include the term “ScanTime” in the first column, and then the number of each
channel in the next columns.
- It is necessary to have the ScanTime in this format: ''00:00:30'
- The lead names should be represented with CH before the lead number : CH01, CH22 etc. Do not
skip any leads.
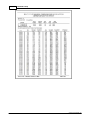
For example:
ScanTime
CH1
CH2
CH3
CH4
'00:00:00'
114.7
114.71
114.74
114.76
'00:00:15'
114.72
114.71
114.73
114.76
'00:00:30'
114.71
114.67
114.71
114.75
'00:00:45'
114.73
114.71
114.72
114.77
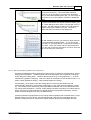
- If you are having problems importing Excel files you can copy a sample/template file from within
CALSoft 5.
- On the Import form there are two link labels.
- If you select either of these links: Sample File with 30 second intervals or Sample File with 60
second intervals, CALSoft 5 will copy these files to a location that you specify which will allow you
to use these files as a template for an Excel file that CALSoft 5 will read.
© 2012 TechniCAL Inc
Collect Data- Heat Penetration
47
-
-
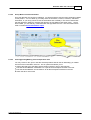
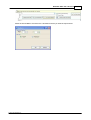
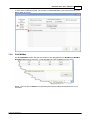
Now you are ready for importing the Excel file.
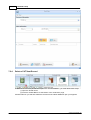
1) Click the Browse button to find the file you would like to import
2) The time-temperature data should show up in the section on the right
3) Find the row of data that represents the Start of the test and double click on the row selector to
set the Start Time.
© 2012 TechniCAL Inc
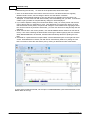
48
CALSoft 5 Help
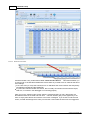
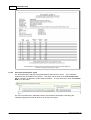
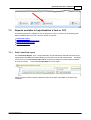
4) Then find the row of data that represents the End of the test and double click on the Row Selector
to set the End Time.
© 2012 TechniCAL Inc
Collect Data- Heat Penetration
5)
6)
7)
49
Then click Ok to import the data
CALSoft will create a new HP data file and ask you to save that file.
You will be asked to provide the Temperature and Product Type for the file. (For
Temperature Distribution files you will only be asked for the Temperature Type.)
8) CALSoft will take you into Collect HP (or Collect TD) next. CALSoft will import the time/
temperature data from the Data Trace or Ellab file. After creating a file with the Import utility
the user is taken into the Collect HP or TD file viewer. CALSoft 5 now populates the file with
© 2012 TechniCAL Inc
50
CALSoft 5 Help
Test Documentation information from the last collected or Imported/Manually Created file
information. If the values that were input by default are not correct the user can select the
Clear All button at the top right of the form. The final result will be a new CALSoft Heat
Penetration Data File containing the time/temperature data.
4.2.3.3
Importing Comma Separated Files
Comma Separated Files (CSV) data files are imported using the same procedures as importing
DataTrace and Ellab files. However, the format of the CSV file must be set up correctly for the
import to work. The format is as follows:
- The first column of the spreadsheet must include the TIME in the format of HH:MM:SS. If you
create your CSV file in Excel then Excel will try to convert your entry into an actual date/time
format (you do not want this format). To fix this, you will need to add an apostrophe (‘) before the
time you enter into each cell in Excel. Excel will then interpret this as plain text and will not try to
convert the entry to a date/time. For example... Excel will translate 00:10:10 as 12:10 am and 10
seconds. But if you put a (‘) before the numbers, Excel will read it directly as 00:10:10
- The first row should include the term “ScanTime” in the first column, and then the number of each
channel in the next columns.
- It is necessary to have the ScanTime in this format: ''00:00:30'
- The lead names should be represented with CH before the lead number : CH01, CH22 etc. Do not
skip any leads.
For example:
ScanTime
CH1
CH2
CH3
CH4
'00:00:00'
114.7
114.71
114.74
114.76
'00:00:15'
114.72
114.71
114.73
114.76
'00:00:30'
114.71
114.67
114.71
114.75
'00:00:45'
114.73
114.71
114.72
114.77
- If you are having problems importing CSV files you can copy a sample/template file from within
CALSoft 5.
- On the Import form there are two link labels.
- If you select either of these links: Sample File with 30 second intervals or Sample File with 60
second intervals, CALSoft 5 will copy these files to a location that you specify which will allow you
to use these files as a template for a CSV file that CALSoft 5 will read.
-
© 2012 TechniCAL Inc
Collect Data- Heat Penetration
-
Now you are ready for importing the Comma Seperated file.
1) Click the Browse button to find the file you would like to import
2) The time-temperature data should show up in the section on the right
3) Find the row of data that represents the Start of the test and double click on it.
© 2012 TechniCAL Inc
51
52
CALSoft 5 Help
4)
5)
6)
7)
Then find the row of data that represents the End of the test and double click on it
Then click Ok to import the data
CALSoft will create a new TD data file that you can name/save as you wish
You will be asked to provide the Temperature and Product Type for the file.
8) CALSoft will take you into Collect HP (or Collect TD) next. CALSoft will import the time/
© 2012 TechniCAL Inc
Collect Data- Heat Penetration
53
temperature data from the Data Trace or Ellab file. After creating a file with the Import utility
the user is taken into the Collect HP or TD file viewer. CALSoft 5 now populates the file with
Test Documentation information from the last collected or Imported/Manually Created file
information. If the values that were input by default are not correct the user can select the
Clear All button at the top right of the form. The final result will be a new CALSoft Heat
Penetration Data File containing the time/temperature data.
4.2.4
Manual File Creation
CALSoft users starting with Version 5.05 can Manually create files. Simply click on the Import/
Manual button and then select the Manually Create a HP File button and follow these steps:
(1) Choose the file name and save that file that you will manually create.
(2) The Manual File Creation form will be shown. This form has two steps. The first step is to
set the Number of Rows (Scans).
(3) Please input the Heating Scans, Cooling Scans and Scan Interval. The Scan interval can be
as low as 1 second. The Total Scans is automatically calculated from the Heating plus
Cooling Scans. In Addition please select the number of Columns (Channels) for the test.
By double-clicking on the Lead Type key image you can set all leads to that lead type. For
example if you want to set all leads to Open Channel double click on the Open Channel
image in the Lead Type panel. When you have set the Number of Rows and Number of
Columns please select the Next button to go to the Next step.
© 2012 TechniCAL Inc
54
CALSoft 5 Help
(4) The second step of Manual File Creation will show a time temperature grid. You can input
the new values by hand or you can copy a spreadsheet of temperature data from Excel and
right click in the datagrid to Paste the contents into the Grid. Note: only the temperature
columns can be pasted into; the time column is set from the previous step. After you have
set the data for this grid please select Save and Finish and the file that you have created will
be saved.
© 2012 TechniCAL Inc
Collect Data- Heat Penetration
55
(5) The Import File Temperature Type and Product Type form will be shown. Please select the
temperature and product type for this test.
© 2012 TechniCAL Inc
56
CALSoft 5 Help
(6) Next the Collect HP form will be shown. After creating a file with the Manual File Creation
utility the user is taken into the Collect TD file viewer. CALSoft 5 now populates the file with
Test Documentation information from the last collected or Imported/Manually Created file
information. If the values that were input by default are not correct the user can select the
Clear All button at the top right of the form.
4.2.5
Calibration
CALSoft allows you the option to "calibrate" your entire data-collection system of thermocouples,
wires, and CALPlex datalogger against a known standard in order to zero-out any possible errors.
This is typically accomplished by bundling the thermocouples/wires inside the retort near the
temperature sensor of the calibrated Temperature Indicating Device (MIG or Digital Temperature
Gauge), brining the retort up to a temperature normally used during production (i.e. 250 degrees F),
and holding the temperature steady. Once the retort has "equilibrated" at the setpoint temperature,
you can use CALSoft to capture OFFSETS for each of the 32 channels. This is referred to as
"calibration" within CALSoft.
Click the "Calibration" button to apply calibration factors to your data-collection, You can either (a)
collect new calibration file, or (b) use an existing calibration file from your computer. To collect a
new calibration file, enter a REFERENCE TEMPERATURE and chose "NEW FILE". CALSoft will
scan the CALPlex datalogger and capture an offset (difference) against the reference temperature for
each of the 32 channels. The collection of these offsets are referred to as a "calibration file".
Calibration files can be saved on your computer (by default, Calibration files are saved in the
CALSoft/CALIBRATION directory) and APPLIED to your test by clicking on "Set As Default Calib
Factors". To apply an already created calibration file, click on the file from the list or click "Find
and Copy...". Once the file is located, click "Set As Default Calib Factors". These calibration
factors will be applied to all future data-collection. To remove the offsets (calibration factors), click
on REMOVE DEFAULT CALIB FACTORS.
NOTE TO CALSoft 32 users- if you used a calibration file during a test, CALSoft 5 saves the
calibration offsets in the data-file and no longer requires that the calibration file be present.
© 2012 TechniCAL Inc
Collect Data- Heat Penetration
4.2.6
57
Backup File
The "Backup File" feature allows you to back up a copy of your data to another location or device
(USB "jump drive", external hard drive, etc.). Click the Backup File button and chose a location
where you would like to backup the file. This will not MOVE your, but instead, it will save a COPY
to another location.
© 2012 TechniCAL Inc
58
4.3
CALSoft 5 Help
HP File Command Options (Ribbon Menu Commands)
CALSoft includes a “Ribbon Menu” in all sections of the program. The menu for Collect Heat
Penetration includes commands related to the heat penetration data file.
Save/Save As
Export Data to Excel
Reports & Report Formats
Email CALSoft File
Zoom Plotting
4.3.1
Save/Save As
The SAVE command will save the file. It is suggested that you click SAVE whenever changes are
made to the data file. SAVE AS enables you to save the file as a different name and/or to a
different location on your computer.
© 2012 TechniCAL Inc
Collect Data- Heat Penetration
4.3.2
59
Export Data to Comma Seperated Value
The EXPORT button allows you to export the time temperature data, along with the basic test
documentation information text, to a Comma Separated Value format.
4.3.3
Reports and Report Formats (PDF, Excel, Word, CSV)
All available reports are listed under the “REPORTS” button.
When you chose to run a report in
CALSoft, the report is generated and displayed on the screen. You can then print the report to your
printer, or you can click the button in the upper left-hand side of the page and export the report to
different formats (PDF, Excel, Word, RTF, etc.).
© 2012 TechniCAL Inc
60
4.3.4
CALSoft 5 Help
Email CALSoft File
To email a Data File from CALSoft, simply click on the SEND CALSOFT FILE button in the ribbon
menu. This will launch your default email client software on your computer and attach the
data file. You can then send the file to anyone via email.
© 2012 TechniCAL Inc
Collect Data- Heat Penetration
4.3.5
61
Zoom plotting
Click on the “Zoom" button in the ribbon to access CALSoft’s unique graphing feature. CALSoft’s
“Zoom” utility plots the time/temperature data on a graph and then allows you to “ZOOM IN” on the
data by using your cursor to select the part of the graph you want to zoom into. Features of Zoom
Include:
Click to expand.
Zoom To:
Lead Info:
Plot Additional Data:
Custom Lines:
Type of Leads:
Lead Plot Selector:
This feature allows you to create your own grid by entering specific times and
temperatures. Zoom will use this to generate the graph and replot the data
accordingly.
This feature allows you to toggle on and off the lead type and selector at the
bottom of the page, and also the grid lines on the graph.
This feature allows you to add a line to your graphs for additional times that
were recorded into the data file during the test, such as time vent closed,
drain closed, steam on, etc. When selected these will show as vertical lines
on the graph. If no data has been entered into the data file for these specific
events, nothing will show on the graph.
This feature allows you to display a custom time or temperature line on the
graph
This indicates whether the lead being plotted is designated as a “free lead” or
a “thermocoupled container” in the data file.
This allows you to display or hide one or more leads on the plot.
TO “ZOOM” into a specific part of the graph, click and drag your mouse to highlight the area that you
© 2012 TechniCAL Inc
62
CALSoft 5 Help
wisht Zoom into. When you let go of the mouse button, the graph will redraw the graph and zoom
into the plotted data, using the coordinates you selected.
© 2012 TechniCAL Inc
Part
V
64
5
CALSoft 5 Help
Collect Data- Temperature Distribution
CALSoft allows you to conduct a Temperature Distribution test and collect the time/temperature
data-file on your computer.
What is Temperature Distribution
Overview- Main TD Dashboard
TD File Command Operations (Ribbon Menu)
5.1
What is Temperature Distribution
Temperature distribution is the thorough documentation of the process delivery system as it is
installed and operated in any given facility. This documentation includes, but is not limited to,
surveys of the utility piping to the retort(s), boiler type and capacity, air compressor type and
capacity, water pressure and quality, type of control system, temperature profile, and temperature
uniformity/stability within the vessel as well as operational and performance repeatability.
The measurement of the temperature exposure is generally accomplished by installing
thermocouples throughout the retort load, and testing the sterilizer under the most adverse
conditions anticipated during normal production. Once the vessel's temperature distribution has
been determined to be acceptable, any alterations to the process delivery system as documented at
the time of testing should be reviewed by a competent process authority before the alterations are
made. Additionally, any changes to the operation of the retort (i.e., change in the vent schedule or
required come-up time) must be reviewed prior to adoption.
CALSoft is a tool used to conduct these Temperature Distribution tests. The resulting CALSoft
Temperature Distribution Data File” contains the recorded time/temperature data from the test, in
addition to pertinent information such as retort information, lead location diagram, temperature
setpoints, etc.
5.2
Overview- - Main TD Dashboard
Click on "Temperature Distribution button in the Main Section and the MIDDLE PANEL will
populate with information relevant to conducting a temperature distribution test. The
middle panel will display the last 5 “recently used” Temperature Distribution Data Files that
were opened in CALSoft.
© 2012 TechniCAL Inc
Collect Data- Temperature Distribution
65
Running a New Temperature Distribution Test
Opening/Editing existing CALSoft data file
Importing DataTrace and Ellab Files
Importing Excel Files
Calibration
Zoom plotting
Backup Files
5.2.1
Running a new Temperature Distribution test with CALPlex datalogger_2
Click on the “NEW” button to begin a new Temperature Distribution (TD) test. CALSoft will then
ask you to name and save to TD data file. The file name defaults to the date and sequential number
indicating the number of tests you have run that day. The format is YYMMDD##. For example:
The first test run on December 15, 2009 will be named... 09121501.ctd
All Temperature Distribution files are saved with the extension “.CTD”.
© 2012 TechniCAL Inc
66
CALSoft 5 Help
CALSoft allows you five sections to enter information about the TD test design, equipment and
product that will be tested:
TD Test Documentation tab
TD Data Collection Equipment tab
TD Lead Location tab
TD Calibration tab
TD Start Data Collection
Once Data Collection begins, CALSoft provides different views to display the time/temperature data.
Main TD Data Collection Screen
Time Temperature Grid
Bar Graph
Zoom Plotting during Data Collection
Also, other information can be logged into the CALSoft file during the test..
Entering Event readings during TD test
Entering Log Data during TD test
Ending a test
Losing Communication with CALPlex
Losing Power during data collection
5.2.1.1
TD Test Documentation tab
The test documentation tab allows you to document information related to the test you are
conducting. The screen is divided into 4 sections (required fields are marked with an *)
1. RETORT- Choosing Batch or Continuous retort will give you different choices in the "type" dropdown menu. Add information on the # of baskets, loading pattern, # container per layers, and other
important information about the retort/loading configuration.
2. CONTAINER- Container type and dimensions are required. Description and additional
information are optional. You may also document what was filled into the containers used in the TD
test (water, product, or other).
3. PROCESSOR - This is the name and location of the factory where the TD testing was
conducted.
4. TEST INFORMATION- Enter information about this specific test such as:
Target Vent Temp: enter the target Vent Temperature and CALSoft wil alert you during the TD
test when all Free Leads have reach the designated target.
Target Process Temp: enter the target Process Temperature and CALSoft will alert you during
the TD test when all Free Leads have reach the designated target.
Temperature Type: you can chose Fahrenheit or Celsius.
Scan intervals: This is the time that CALSoft waits between scanning the CALPlex datalogger for
Temperature readings.
© 2012 TechniCAL Inc
Collect Data- Temperature Distribution
67
The Technician's name, reason for test, and Notes fields are optional and simply provide further
documentation of the TD test
CALSoft will retain the information on this page for the next test to eliminate the need to enter it
again. To clear the fields, click "CLEAR ALL" button.
5.2.1.2
TD Data Collection Equipment tab
The Data Collection Equipment tab in Temperature Distribution is the same as in Heat Penetration.
To learn more, click here to see the help file for the "Data-Collection Equpment" tab in Heat
Penetration
© 2012 TechniCAL Inc
68
5.2.1.3
CALSoft 5 Help
TD Lead Location tab
CALSoft allows you the option to record or "map" the location of your Temperature Distribution leads
in the retort.
Before you can use this feature, you must have set
up the retort design on the test documentation tab. If this is a CALSoft file from an earlier version,
you will need to enter the Basket, loading, and layer information. Once that is setup, a schematic
representation of the retort will be displayed on the right. You will see a SIDE VIEW and also a TOP
VIEW of the basket.
The table will show all ACTIVE leads (bad leads and open channels will not be displayed). There are
4 columns for you to use when recording the location of each lead:
1. On TID? -- use this if a lead is located by the sensor of the Temperature Indicating Device
(TID) such as an MIG thermometer, Chart recorder, or RTD sensor.
2. Basket -- indicate which basket the lead is located in. NOTE: crateless retorts are shown as
ONE basket
3. Layer -- indicate which layer the lead is located in. NOTE: crateless retorts are shown with
3 layers- upper, middle, and lower
4. Top View -- using the top-view graphic, determine which section the lead is located. This is
provided simply to give you the ability to record the general location of the lead on the layer.
© 2012 TechniCAL Inc
Collect Data- Temperature Distribution
5.2.1.4
69
TD Calibration tab
CALSoft allows you the option to "calibrate" your entire data-collection system of thermocouples,
wires, and CALPlex datalogger against a known standard. Using the Calibration feature duringn
Temperature Distribution is the same as in Heat Penetration. To learn more, click here to see the
help file for the "Calibration Tab" feature in Heat Penetration
© 2012 TechniCAL Inc
70
5.2.1.5
CALSoft 5 Help
TD Start Data Collection
The Start Data Collection tab in Temperature Distribution is the same as in Heat Penetration. To
learn more, click here to see the help file for the "Start Data-Collection" feature in Heat
Penetration
5.2.1.6
TD Data Collection- Main Screen
The default view during Data Collection is called the Main Data Collection Screen. This screen
displays only all "active" channels (Free Leads and Thermocoupled leads). CALSoft will actually
scan and record temperatures on all 32 channels during data-collection. However, you will only see
the channels during data collection that are designated as Free Leads or Thermocoupled
Containers. To change the status of a channel or to turn a channel on or off, go to the Data
Collection Equipment tab and click on a channel to change it's type. It will then be displayed during
data collection.
This screen displays the channel number, type (graphically shows Thermocouple or Free Lead),
current reading, previous reading, the difference between the two ("Delta T"), the lethal rate, and the
accumulated F (Total F). Any calibration factors that are applied are shown in the last column.
CALSoft will help you visually know which channel is the highest and lowest. The Thermocoupled
container with the highest reading is displayed in RED and the lowest reading in BLUE. Since this
is a Temperature Distribution test, Thermocoupled Container Leads are not considered in the high-
© 2012 TechniCAL Inc
Collect Data- Temperature Distribution
71
low feature.
You can sort on any column by clicking the column heading.
You can navigate to other data views by using the tabs across the top for Time/Temperature, Bar
Plot, and Log Data... or view the data on a time/temperature graph by clicking the Zoom Plot button
5.2.1.7
TD Data Collection Time Temperature grid
During Data Collection, the Time Temperature Grid displays your data in a spreadsheet format.
The Time Temperature view in Temperature Distribution is the same as in Heat Penetration.
To learn more, click here to see the help file for the Time Temperature view during Heat
Penetration
© 2012 TechniCAL Inc
72
5.2.1.8
CALSoft 5 Help
TD Data Collection- Bar Graph
During Data Collection, the "Bar Graph" displays your data in a graphical format. This screen
displays only all "active" channels (Free Leads and Thermocoupled leads). CALSoft will actually
scan and record temperatures on all 32 channels during data-collection. However, you will only see
the channels during data collection that are designated as Free Leads or Thermocoupled
Containers. To change the status of channel or to turn a channel on or off, go to the Data Collection
Equipment tab and click on a channel to change it's type. It will then be displayed during data
collection.
The "TARGETS" (Target Vent and Target Process Temperatures) entered in the Test Documentation
tab (first tab) when you set up the TD test will be used on this bar graph to let you know when the
targets are reached. Once the readings reach the desired targets, the bar will turn colors to alert you
that the target has been reached. In the example below some of the leads are below the Target
Vent temperature and are drawn in yellow. Other leads have reached the Target Vent but not the
Target Process temperature and are drawn in green. One lead has reached the Target Process
temperature and is drawn in pink.
To update the Target Values, click "Update Graph" button.
To change the colors of the bars, click on "Customize" button
© 2012 TechniCAL Inc
Collect Data- Temperature Distribution
5.2.1.9
73
TD Data Collection- Zoom plotting during data collection
During Data Collection, CALSoft enables you to graph your data in real-time on a time/temperature
grid. Once the data is plotted, you can "zoom in" by clicking and dragging the mouse over the range
you wish to enlarge. This feature is referred to within CALSoft as "Zoom Plotting". To graph
your data during the test, click on the "Zoom Plot" button at the top Ribbon. The Zoom Graph will
be displayed in a separate window and the graph will be updated in real-time.
Click here for more information on using the CALSoft Zoom Plotting Feature
5.2.1.10 Entering event readings during TD test
During Data Collection, CALSoft enables you to enter "Event" readings during the Temperature
Distribution test. To enter these events, use the tabs at the top of the screen during data-collection. .
When the following events are reached, you may chose the appropriate tab, click the check-box,
© 2012 TechniCAL Inc
74
CALSoft 5 Help
and CALSoft will stamp the current time. However, you may edit the time accordingly. You can also
record the temperature reading on the MIG, Chart, and controller/RTD at time of the event. You can
record this information for the following events:
Drain Closed
You can specify the time that the Drain was closed by selecting the Drain Time Reached tab
and checking the Drain Closed Checkbox. The Drain Closed Time time control box can be
modified to update this value.
Vent Valve Closed
You can specify the time that the Vent was closed by selecting the Vent Time Reached tab and
checking the Vent Closed Checkbox. The Vent Closed Time time-control box can be modified
to update this value. You can also input the MIG, Chart and RTD values at the time of the Vent
Closed. To the right you will see that CALSoft 5 determines the Slowest Lead at the time the
Vent was closed and shows both the slowest lead and the temperature of the lead at the
nearest reading after the Vent was closed.
Process Temperature Reached (Come Up Time)
You can specify the time that the Process Temperature was reached by selecting the Process
Temp tab and checking the Process Temp Reached Checkbox. The Process Temp Reached
Time time-control box can be modified to update this value. You can also input the MIG, Chart
and RTD values at the time of the Process Temp Reached. To the right you will see that
CALSoft 5 determines the Slowest Lead at the time the Process Temp was reached and shows
both the slowest lead and the temperature of the lead at the nearest reading after the Process
Temp was reached.
Cook Started (Begin Cook Phase)
You can specify the time that the Cook was was started by selecting the Cook Started tab and
checking the Cook Started Checkbox. The Cook Started Time time-control box can be modified
to update this value. You can also input the MIG, Chart and RTD values at the time of the Cook
Started. To the right you will see that CALSoft 5 determines the Slowest Lead at the time the
Cook was started and shows both the slowest lead and the temperature of the lead at the
nearest reading after the Cook was started.
© 2012 TechniCAL Inc
Collect Data- Temperature Distribution
75
Time Entered Cooling (Cooling Reached)
You can specify the time that the Cooling was started by selecting the Cooling Reached tab and
checking the Entered Cooling Checkbox. The Entered Coolin Time time-control box can be
modified to update this value. You can also input the Cooling Water Temperature at this time as
well; that however is Optional.
5.2.1.11 Entering Log Data
During Data Collection, CALSoft enables you to manually enter other readings during the
Temperature Distribution test such as temperature readings from the MIG or Digital thermometer,
pressure gauge readings, RPM readings, etc. These readings are referred to as "LOG-DATA" in
CALSoft. Entering Log Data during a Temperature Distribution test is the same as in Heat
Penetration. To learn more, click here to see the help file for the Entering Log Data during
Data-Collection feature in Heat Penetration
5.2.1.12 Ending a test
Ending a Temperature Distribution test is the sames as in Heat Penetration. To learn more, click
here to see the help file for the "Ending a Test" in Heat Penetration
© 2012 TechniCAL Inc
76
CALSoft 5 Help
5.2.1.13 Losing Communication with CALPlex during a test
Losing Communication during a TD test is handled the same as in Heat Penetration. To learn
more, click here to see the help file for the "Losing Communication during data collection"
in Heat Penetration
5.2.1.14 Losing Power during data collection
Losing Power during a TD test is handled the same as in Heat Penetration. To learn more, click
here to see the help file for the "Losing Power During Data Collection" in Heat Penetration
5.2.2
Opening/editing existing CALSoft TD files
To open and view/edit an existing CALSoft TD data file, there are two options:
1. Double click on the file in the “recently used” list in the MIDDLE PANEL, or
2. Click the “OPEN” button and find the file you want to open. The file will then load into
CALSoft Collect HP mode and display all of the data in that specific file.
The Temperature Distribution Data File is divided into "Tabs" (on the left-hand side of the page).
Test Documentation tab
Data Collection Equipment tab
Lead Location tab
Calibration Tab
Time/Temperature Tab
Log Data tab
Summary Tab
5.2.2.1
Test Documentation tab
The test documentation tab displays information related to the Temperature Distribution test that
was conducted. You can edit any of the information that is in a "text box". Note that required fields
are mark ed with an *. This tab is divided into 4 sections:
1. RETORT - Choosing Batch or Continuous retort will give you different choices in the "type" dropdown menu. The retort schematic under Lead Location tab is created using the information entered
here for the # of baskets and # layers. Other important information from the TD test is documented
here, such as loading pattern, # container per layers, use of divider sheets, and control parameters.
2. CONTAINER - Container type and dimensions are required. Description and additional
information are optional. You may also document what was filled into the containers used in the TD
test (water, product, or other).
3. PROCESSOR - This is the name and location of the factory where the TD testing was
conducted.
© 2012 TechniCAL Inc
Collect Data- Temperature Distribution
77
4. TEST INFORMATION - This section contains other information that was documented during the
TD test. The TARGET Vent Close and Process Temperature were used during data-collection to
indicate graphically when these targets are achieved. The Grid showing the Drain Closed, Vent
Closed, Process temp, and Cook start contains times and temperature readings that were entered
during the TD test. You may also enter this information after the test. The "Slow Lead" and "Slow
Temp" will show the actual lead that was the slowest to reach that target temperature and the
temperature reading of that lead. The Technician's name, reason for test, and Notes fields are
optional and simply provide further documentation of the TD test
5.2.2.2
Data Collection Equipment tab
The Data Collection Equipment tab in Temperature Distribution is the same as in Heat Penetration.
To learn more, click here to see the help file for the "Data-Collection Equpment" tab in Heat
Penetration
© 2012 TechniCAL Inc
78
CALSoft 5 Help
c
5.2.2.3
Lead Location tab
CALSoft allows you the option to record or "map" the location of your Temperature Distribution leads
in the retort. Click here to see the "Lead Location" tab in TD Data Collection.
5.2.2.4
Calibration Tab
CALSoft allows you the option to "calibrate" your entire data-collection system of thermocouples,
wires, and CALPlex datalogger against a known standard. Using the Calibration feature duringn
Temperature Distribution is the same as in Heat Penetration. To learn more, click here to see the
help file for the "Calibration Tab" feature in Heat Penetration
© 2012 TechniCAL Inc
Collect Data- Temperature Distribution
5.2.2.5
79
Time/Temperature Tab
The Time/Temperature Tab allows you the ability to view and print the temperature data that was
collected during the Temperature Distribution test. The Time/Temperature tab in Temperature
Distribution is the same as in Heat Penetration. To learn more, click here to see the help file for
the "Time Temperature" tab in Heat Penetration
5.2.2.6
Log Data tab
"LOG DATA" is the other information recorded during a Temperature Distribution test, including
recording the readings of the MIG, Chart Recorder, Pressure, etc. The Log Data tab in Temperature
Distribution is the same as in Heat Penetration. To learn more, click here to see the help file for
the "Log Data" tab in Heat Penetration
© 2012 TechniCAL Inc
80
5.2.2.7
CALSoft 5 Help
Summary Tab
The SUMMARY TAB is a summary of the information collected into the data-file during the test. This
Summary tab may be useful in conducting a quick analysis of the data.
The TARGET Vent Close and Process Temperature were used during data-collection to indicate
graphically when these targets are achieved.
The Grid showing the Drain Closed, Vent Closed, Process temp, and Cook Start contains times and
temperature readings that were entered during the TD test. The "Slow Lead" and "Slow Temp" will
show the actual lead that was the slowest to reach that target temperature and the temperature
reading of that lead.
All TD "Free Leads" displayed in the lower grid. You may click on any column heading to sort the
data on that table. The columns for Basket, Layer, and Top View come from the Lead Location
tab. You may click on any lead to see it's location on the Retort Schematic on the right side of
the page.
The "Backup File" feature allows you to back up a copy of your data to another location or device
(USB "jump drive", external hard drive, etc.). For more informaiton on the Backup File feature, click
here
© 2012 TechniCAL Inc
Collect Data- Temperature Distribution
5.2.3
81
Importing Files into CALSoft 5
CALSoft 5 allows a number of data files to be imported into the Collect Temperature Distribution
Utility. Importing files in Temperature Distribution is the same as in Heat Penetration. To learn
more, click here to see the help file for the Importing Files into CALSoft 5 feature in Heat
Penetration
5.2.3.1
Importing DataTrace and Ellab files
Importing DataTrace and Ellab files in Temperature Distribution is the same as in Heat Penetration.
To learn more, click here to see the help file for the "Import DataTrace and Ellab" feature in
Heat Penetration
© 2012 TechniCAL Inc
82
5.2.3.2
CALSoft 5 Help
Importing Excel Files
Importing Excel files in Temperature Distribution is the same as in Heat Penetration. To learn more,
click here to see the help file for the Import Excel Files feature in Heat Penetration
5.2.3.3
Importing Comma Separated Files
Importing Comma Separated files (CSV) in Temperature Distribution is the same as in Heat
Penetration. To learn more, click here to see the help file for the Import Comma Separated
Files feature in Heat Penetration
5.2.4
Manual File Creation TD
CALSoft users starting with Version 5.05 can Manually create files. Simply click on the Import/
Manual button and then select the Manually Create a TD File button and follow these steps:
(1) Choose the file name and save that file that you will manually create.
(2) The Manual File Creation form will be shown. This form has two steps. The first step is to
set the Number of Rows (Scans).
(3) Please input the Heating Scans, Cooling Scans and Scan Interval. The Scan interval can be
as low as 1 second. The Total Scans is automatically calculated from the Heating plus
Cooling Scans. In Addition please select the number of Columns (Channels) for the test.
By double-clicking on the Lead Type key image you can set all leads to that lead type. For
example if you want to set all leads to Open Channel double click on the Open Channel
image in the Lead Type panel. When you have set the Number of Rows and Number of
Columns please select the Next button to go to the Next step.
© 2012 TechniCAL Inc
Collect Data- Temperature Distribution
83
(4) The second step of Manual File Creation will show a time temperature grid. You can input
the new values by hand or you can copy a spreadsheet of temperature data from Excel and
right click in the datagrid to Paste the contents into the Grid. Note: only the temperature
columns can be pasted into; the time column is set from the previous step. After you have
set the data for this grid please select Save and Finish and the file that you have created will
be saved.
© 2012 TechniCAL Inc
84
CALSoft 5 Help
(5) The Import File Temperature Type Form will be shown. Please select the temperature type
for this test.
(6) Next the Collect TD form will be shown. After creating a file with the Manual File Creation
utility the user is taken into the Collect TD file viewer. CALSoft 5 now populates the file with
© 2012 TechniCAL Inc
Collect Data- Temperature Distribution
85
Test Documentation information from the last collected or Imported/Manually Created file
information. If the values that were input by default are not correct the user can select the
Clear All button at the top right of the form.
5.2.5
Calibration
CALSoft allows you the option to "calibrate" your entire data-collection system of thermocouples,
wires, and CALPlex datalogger against a known standard in order to zero-out any possible errors.
Calibration in Temperature Distribution is the same as in Heat Penetration. To learn more, click
here to see the help file for the "Calibration" button in Heat Penetration,
5.2.6
Zoom plotting
Click on the “Zoom" button in the ribbon to access CALSoft’s unique graphing feature. CALSoft’s
“Zoom” utility plots the time/temperature data on a graph and then allows you to “ZOOM IN” on the
data by using your cursor to select the part of the graph you want to zoom into.
Click here for more information on using the CALSoft Zoom Plotting Feature
5.2.7
Backup File
© 2012 TechniCAL Inc
86
CALSoft 5 Help
The "Backup File" feature allows you to back up a copy of your data to another location or device
(USB "jump drive", external hard drive, etc.). Click the Backup File button and chose a location
where you would like to backup the file. This will not MOVE your, but instead, it will save a COPY
to another location.
5.3
TD File Command Options (Ribbon Menu Commands)
CALSoft includes a Ribbon Menu in all sections of the program. The menu for Collect Temperature
Distribution includes commands related to the heat penetration data file.
Save/Save As
Export Data to Excel
Reports & Report Formats
Email CALSoft File
Zoom Plotting
5.3.1
Save/Save As
The SAVE command will save the file. It is suggested that you click SAVE whenever changes are
made to the data file. SAVE AS enables you to save the file as a different name and/or to a
different location on your computer.
© 2012 TechniCAL Inc
Collect Data- Temperature Distribution
5.3.2
87
Export Data to Comma Separated Value
The EXPORT button allows you to export the time temperature data, along with the basic test
documentation information text, to a Comma Seperated format.
5.3.3
Reports and Report Formats (PDF, Excel, Word, CSV)
All available reports are listed under the “REPORTS” button.
When you chose to run a report in
CALSoft, the report is generated and displayed on the screen. You can then print the report to your
printer, or you can click the button in the upper left-hand side of the page and export the report to
different formats (PDF, Excel, Word, RTF, etc.).
© 2012 TechniCAL Inc
88
5.3.4
CALSoft 5 Help
Email CALSoft File
To email a Data File from CALSoft, simply click on the SEND CALSOFT FILE button in the ribbon
menu. This will launch your default email client software on your computer and attach the data file.
You can then send the file to anyone via email.
© 2012 TechniCAL Inc
Collect Data- Temperature Distribution
5.3.5
89
Zoom plotting
Click on the “Zoom" button in the ribbon to access CALSoft’s unique graphing feature. CALSoft’s
“Zoom” utility plots the time/temperature data on a graph and then allows you to “ZOOM IN” on the
data by using your cursor to select the part of the graph you want to zoom into.
Click here for more information on using the CALSoft Zoom Plotting Feature
© 2012 TechniCAL Inc
Part
VI
Evaluate Data- Set a Process
6
91
Evaluate Data- Set a Process
CALSoft enables you to evaluate heat penetration data and "Set A Process" using the Ball Formula
Method or the General Method.
What is Setting A Process?
Calculation Methods
Overview- Main Set A Process Dashboard
6.1
What is Setting A Process?
The objective of thermal processing is to deliver temperature into a package of product (referred to as
“Canned Foods”) in a quantity sufficient to cause the death or destruction of all microorganisms of
public significance as well as those of economic spoilage concern. Processing Authorities undertake
the task of determining what a “safe process” is and ensure that the retort can actually deliver that
process time/temperature in a safe and effective manner.
"Setting a Process" refers to the task of establishing a safe Thermal Processes for specific canned
food products. This is accomplished by by conducting heat penetration testing, evaluating the
collected data, and using calculation methods to determine time, temperature, and lethality values.
The objective of a thermal process must be designed to destroy all pathogenic microbial spores
capable of outgrowth in the food under non-refrigerated storage and deviation conditions, which is
required by federal law.
CALSoft enables you to Set A Process using heat penetration data and the Ball Formula Method.
General Method evaluation reports are also available in CALSoft. The procedures to accomplish this
using the Ball Formula are designed into CALSoft as follows:
1.
2.
3.
4.
5.
Establish a ProCal record
Load Heat Penetration (HP) Files to be evaluated
For each HP file, review time/temperature data, product formulations, critical factor information
Set plotting defaults and plot data for each HP data file
Compare the results of evaluated heat penetration data and chose the heating factors to use in
the process calculation
6. Assign critical factors to the final process
7. Calculate & print a thermal process schedule
© 2012 TechniCAL Inc
92
6.2
CALSoft 5 Help
Calculation Methods
CALSoft was designed to primarily use the Ball Formula method to calculate a thermal process
using your heat penetration data. However, Reports are also available within CALSoft to determine
accumulated lethality values using the General Method. Click on either of these to learn more
about the methods.
6.2.1
Ball Formula Method
In 1923, C. Olin Ball proposed a formula method which would allow for the extrapolation of process
time independent of a required direct thermocouple measurement once time and temperature data
were collected by direct measurement (heat penetration test). This mathematical calculation
method is known today as the "Ball Formula Method" and is the most often used method in the
United States for both process evaluation and process design for retorted canned foods.
The Ball Formula method uses heating factors to calculate process times. These Heating Factors
are generated from the evaluation of heat penetration test data. The time/temperature data for each
thermocoupled container is plotted on an inverted, semi-logrithmic graph which is developed based
on the Retort Temperature and the Come Up Time experienced by the test containers during the
heat penetration test. Heating Factors are derived from the graphed data for each thermocoupled
container. The factors from a single container are chosen by the process authority for use in the
Ball Formula, along with the desired Retort Temperature, Product Initial Temperature,and Fo value.
The resulting calculated thermal process time applies to the product and processing conditions in
the heat penetration test.
CALSoft offers users the ability to easily evaluate/plot the heat penetration data to generate heating
factors and to calculate a thermal process using the Ball Formula method.
It is important to understand that basic assumptions are made in the Ball Method result from
empirically defined terms in the method which allow for an “estimation” of both process time or
sterilizing value. Unfortunately, these assumptions often overestimate process lethality and,
although conservative, do not accurately define the actual lethality delivered in the process. The Ball
Method utilizes heating and cooling factors to predict the internal product slowest heating zone
temperature. The following assumptions are fixed within the method for your products:
BASIC ASSUMPTIONS:
jc = 1.41 (hyperbolic cooling lag)
fc = fh (slope of linear logarithmic heating = slope of linear logarithmic cooling)
RT-Tw or m+g = 180°F (steam) or 130°F (water)
42% correction of come up time in calculation of jh value.
No further product heating after cooling starts.
A constant retort temperature method only.
These assumptions make Ball Method flexible but also very conservative, over-estimating the actual
lethality delivered to the product (mostly occurring in cooling). In the case of conduction heating
products, there is often as much as a 100% increase in resulting lethality than that targeted in the
scheduled process. Sometimes this is unacceptable to product quality and the Ball Formula is not
the most appropriate process calculation method.
© 2012 TechniCAL Inc
Evaluate Data- Set a Process
6.2.2
93
General Method
The General Method is used to determine lethality equivalents at known internal container
temperatures measured directly by the use of thermocouples positioned within the test container.
The General Method is a procedure used to integrate the lethal effects of a time/temperature history
resulting from a thermal process at a position located in the slowest heating zone in the container.
The General Method is the basic direct method for calculating the Fo value. Since the General
Method uses the physically measured product temperature directly, it is the most accurate method
available.
First, the time-temperature data at the slowest heating zone of a canned food must be obtained
through a heat penetration test. If General Method calculation is to be used, it is very important to
be aware of the following:
1. The heat penetration test must be designed properly. For example, the condition of the
thermocoupled containers must meet or exceed the "worst case" of fill, formulation, thermocouple
placement, etc.
2. Test containers must be located in the slowest heating zone of the retort (which is determined
through Temperature Distribution Testing).
3. The accuracy of the data-collection equipment is also very important since direct temperature
measurement is critical if the General Method is used.
Then for each measured product temperature (thermocoupled container) in the heat penetration test,
a corresponding lethal rate value is calculated using the General Method and the appropriate z-value
and Tref. During the entire cycle of the retort process, the calculated lethal rate is accumulated for
each thermocoupled container. The Fo value delivered to the product at the slowest heating zone is
the equivalent sterilization value of that specific process condition.
CALSoft provides reports that use the General Method to determine accumulated lethality during a
heat penetration test. CALSoft uses the "trapezoidal method" of the General Method. However,
you must use the appropriate z value and Tref in the calculation according to the product that is
tested.
© 2012 TechniCAL Inc
94
6.3
CALSoft 5 Help
Overview- Main Set A Process Dashboard
Click on "Set A Process" button in the Main Section and the MIDDLE PANEL will populate and
display the last 5 “recently used” ProCal Records that were established in CALSoft.
The Process Calculation (“ProCal”) Data-Base
New Process
Open Existing Process Calculation
Delete a ProCal Record
Quick Ball Formula Calculation
6.3.1
The Process Calculation (ProCal) Data-Base
When you "Set a Process" using CALSoft, the information related to the process is stored in a
database referred to as the "ProCal Database".
For more information related to the database file
and it's location, see Process Database.
When you begin to Set A Process with CALSoft, a new record is created in the ProCal Database.
This is referred to as the ProCal Record Number and is the main reference to that Process
Calculation. The ProCal Record Number is displayed on the final printed Process Schedule report
and also on the main dashboard of the Set A Process page.
© 2012 TechniCAL Inc
Evaluate Data- Set a Process
6.3.2
95
Set a New Process
CALSoft offers users the ability to easily evaluate/plot the heat penetration data to generate heating
factors and to calculate a process using the Ball Formula Method. Chose the "Set A Process"
section and click on the "NEW" button to begin a NEW Process Calculation. CALSoft will then
create a NEW Pro-Cal record in the database. Once the ProCal record is set up, you can begin the
process of evaluating the data and then finally calculating a thermal process using the Ball Formula.
The steps are as follows:
Loading Heat Penetration files to evaluate
Set up Basic Process Information
Viewing/printing/Editing Time/Temperature data
Viewing/Printing/Editing the formulation information
Viewing/Printing/Editing CritiCAL
Establishing Ball Formula plotting defaults
Plotting data to get Ball Formula heating/cooling factors
Plotting Tips
Using CALSoft to compare factors from multiple HP files for Ball Formula calculation
© 2012 TechniCAL Inc
96
6.3.2.1
CALSoft 5 Help
Loading Heat Penetration files to evaluate
The first step is to load the heat penetration file(s) you wish to evaluate in order to calculate a
thermal process. CALSoft allows you to load multiple heat penetration files into one Process
Calculation exercise (ProCal record). Click on "SELECT FILE" and find the HP data files you wish
to evaluation for this process. Once an HP data file is loaded, you can Double Click on "VIEW" to
see the contents of that file.
If the data file you selected has already been used in another Process Calculation (ProCal record),
CALSoft will notify you and suggest that you create a copy of the file. If you chose "Create Copy", a
copy of the file will be placed in the same location as the original.
T
© 2012 TechniCAL Inc
Evaluate Data- Set a Process
6.3.2.2
97
Set up Basic Process Information
Once the data files are chosen for evaluation, you will be asked to enter the basic information related
to this product. You can either (a) manually enter the Processor, Product, Container, and Retort
information, or you can (b) chose to use the information that is already in one of the HP data files
that was previously loaded by selecting that file from the File Selector drop-down menu. Once a
file is loaded, you can edit any of the information that populates the form. This information will be
used on the final Process Schedule report.
6.3.2.3
Viewing/printing/Editing Time/Temperature data
You may chose to view, print or edit the Time/Temperature data for the HP data file(s) you loaded
into the Process Calculation exercise. This is optional and allows you to:
Change the lead types (free lead, thermocoupled container, open or bad channel)
Print the General Method "Lethal Rate" for a specific thermocoupled container in the test
Print the General Method "Accumulated F" for all thermocoupled containers in the test
Check the file for zero scans
© 2012 TechniCAL Inc
98
CALSoft 5 Help
6.3.2.3.1 Check for Zero Scans
CALSoft includes a very useful feature called "Check for Zero Scans". This feature enables you
to scan an HP or TD data file and determine if there were any missed scans or channels that show
zero readings.
If an entire scan (or more) was missed, this is an indication that communication was temporarily
lost between CALSoft and the Datalogger.
If a particular channel includes zero-scans, this is usually an indication that the thermocouple,
lead wire, or channel in the datalogger is not working properly.
After you run the "Check for Zero Scans" feature, CALSoft will alert you if any Zero Scans are
discovered and list the channel and scan time. CALSoft will then give you the opportunity to fix
them or simply leave the file as-is with the zero scans unchanged. If you chose to "FIX" the zero
scans, CALSoft will average the 3 scans prior and the 3 scans after the zero scan and suggest an
© 2012 TechniCAL Inc
Evaluate Data- Set a Process
99
average to replace the zero scan. You can accept this or enter your own fix.
6.3.2.4
Viewing/Printing/Editing the formulation information
You may chose to view, print or edit the Formulation information for the HP data file(s) you loaded
into the Process Calculation exercise. This is optional. Click here for more information on the
Formulation tab.
6.3.2.5
Viewing/Printing/Editing CritiCAL
You may chose to view, print or edit the Critical factor information (CritiCAL) for the HP data file(s)
you loaded into the Process Calculation exercise. This is optional. Click here for more information
on the CritiCAL tab.
6.3.2.6
Establishing Ball Formula plotting defaults
The Ball Formula method uses heating factors to calculate process times. These Heating Factors
are generated from the evaluation of heat penetration test data. The time/temperature data for each
thermocoupled container is plotted on an inverted, semi-logrithmic graph. This graph is developed
based on the Retort Temperature and the Come Up Time experienced by the test containers during
the heat penetration test. "Free Leads" are used during the HP test to record the Retort
© 2012 TechniCAL Inc
100
CALSoft 5 Help
Temperature around the test containers.
CALSoft helps you determine the Retort Temperature (RT) and Come-Up Time (CUT) that should be
used for plotting the heat penetration data. By default, CALSoft will chose the RT and CUT based on
the temperatures recorded by the Free Leads in the HP test. You can either:
(a) choose to accept these values for each HP data file selected
(b) edit the RT and/or CUT by simply typing over the default values
(c) or you can use CALSoft's "PLOTTING DEFAULTS ASSISTANT" to drill-down and look
at each Free Lead seperately.
Once you set your CUT and RT, simply chose "NEXT" and begin plotting your data
If you would like CALSoft to help you determine the RT and CUT to use for plotting, click on a certain
file to select it and then click "Plotting Defaults Assistant" button. This will launch the assistant and
you must:
1. Enter the Retort Temperature that the HP data was collected
2. Enter the Time the retort Entered Cooling during the HP test
3. Then chose EVALUATE FREE LEADS
CALSoft will then calculate
(1) the time that each FREE LEAD reached the RT (Come Up Time), which will be listed for each
Free Lead as the "CUT Calculated", and
(2) the Retort Temperature that the test containers experienced during the HP test for each FREE
LEAD. CALSoft accomplishes this by calculating the average temperature from the time CUT was
achieved at that Free Lead until the time that the retort went into Cooling during the HP test.
CALSoft will display the "RT Calculated" for each Free Lead.
You can evaluate the information even further by using the Zoom Plotting feature to look at a graph of
this time/temperature data for each free lead. This may help you to more accurately decide which
CUT and RT to use for Plotting to obtain Ball Formula Heating factors.
Once you have decided on a CUT and RT to use for the plotting, you can either (a) check the Free
Lead you would like to use, or (b) enter the information yourself at the bottom. Click "SAVE" when
you are done. Complete this exercise for each HP data file that you plan to plot.
© 2012 TechniCAL Inc
Evaluate Data- Set a Process
6.3.2.7
101
Plotting data
CALSoft allows you the ability to view plotted data for each Heat Penetration data file:
Plotting Heating data to get Ball Formula heating factors
Plotting Tips
Plotting Cooling data to get Ball Formula cooling factors
Lethal Rate plots
To get the most efficient use of your monitor to display your plot, chose "Maximize Form Area" in
the top-right corner of the page. This will collapse the tabs on the right side and provide a larger area
© 2012 TechniCAL Inc
102
CALSoft 5 Help
to display your plot. Uncheck to disable this option and return to the regular view.
6.3.2.7.1 Plotting Heating data to get Ball Formula heating factors
The Ball Formula method uses heating factors to calculate process times. These Heating Factors
are generated from the evaluation of heat penetration test data The time/temperature data for each
thermocoupled container is plotted on an inverted, semi-logrithmic graph. This graph is developed
based on the Retort Temperature and the Come Up Time experienced by the test containers during
the heat penetration test. The temperatures are plotted on the graph as one or two straight lines on
semi-logarithmic paper.
CALSoft generates the graph based on the PLOTTING DEFAULTS established in the previous tab,
and then automatically plots the heat penetration data and generates the Heating Factors for each
thermocoupled container. To review all of the plotted data, follow these steps:
1. Click on the lead number at the bottom of the Plot screen. The lead numbers are originally
identified in Blue circles, but will change to Green once that lead is "reviewed".
2. CALSoft will automatically attempt to plot your data using an algorithm that TechniCAL has
developed. In most cases CALSoft will accurately and conservatively plot your data. If CALSoft is
unable to plot your data an Autoplot Difficulty dialog box will be displayed.
3. If you need to adjust the line(s) that CALSoft has drawn, move your mouse pointer over the endpoint of the line that you would like to move. Click-drag-drop to move the line. When you click
and hold the left mouse pointer, the pointer will change to a four-headed arrow signifying that the
line can be moved in any direction. Remember, you must click and hold to drag and drop the line
end-point.
4. When the lines are in the correct position, click the REVIEWED button under PLOT STATUS at
the top. The circle containing the lead number will change to Green signifying that it is reviewed.
When REVIEWED status is selected, CALSoft will automatically advance to plotting the next
lead.
5. If the data for a particular thermocouple is Bad, click the Bad Data option on the right side of the
screen. When Bad data is clicked, CALSoft will not automatically advance to plotting the next
lead. You have to select the next lead to plot by clicking on that lead number at the bottom.
For more help with plotting, see the PLOTTING TIPS help section.
© 2012 TechniCAL Inc
Evaluate Data- Set a Process
103
To Print TWO PLOTS PER PAGE, set the option in PREFERENCES (click Edit Preferences in the
Ribbon Menu at the top).
© 2012 TechniCAL Inc
104
CALSoft 5 Help
6.3.2.7.1.1 Plotting Tips
CALSoft automatically plots your heat penetration data on inverted, semi-logarithmic graph using the
RT and CUT as determined by the user. The following tips will help you better understand how you
can use this function in CALSoft:
The graph is generated using the Retort Temperature (RT)
and Come Up time (CUT) experienced by the test
containers. The RT and CUT used to generate the graph is
sown under the "Plotted Using" section.
Toggle between "Simple" or "Broken" under PLOT TYPE. to
change the plot. CALSoft will automatically chose the bestfit of the line for the plotted data.
Simple Curves represent "straight line heating" and have a
single red line to represent the heat penetration data. This
line determines the jh and fh.
Broken Curves represent heating inside a container that
may start very fast, but then slow down over time. This
curve uses two lines to represent the heat penetration data.
The first line (red) determines the jh and fh and the second
line (blue) determines the f2. The point where the two lines
intersect is the xbh.
The Ball Formula method uses heating factors to calcualte
process times and lethalities. Heating factors (j, fh, fx, and
xbh) are automatically calculated by CALSoft based on the
Simple or Broken line that is fit to the plotted heat
penetration data. Heating factors will change as you move
the line on the plotted data.
The "Bb" is the Ball Formula calculated cook time using the
heating factors derived from the plot, and other factors:
RT (Retort Temperature for process calculation)
IT (product Initial Temperature for process calcualtion)
m+g (difference between retort temperature and
cooling water temperature)
F value (chosen by Process Authority based on
product)
To change these factors, click "Change Ball Formula
Factors" button.
NOTE: The Process Factors and RT/IT ranges can be set
in PREFERENCES (chose "edit Preferences at top Ribbon
Menu) and chose "Process Factors" tab.
To quickly review plots, you can chose the option to use the
CONTROL key on your keyboard. When this option is
© 2012 TechniCAL Inc
Evaluate Data- Set a Process
105
selected, the plot/lead will be marked as REVIEWED if you
pressing the Control key. This makes data evaluation
quicker as you do not have to point and click "Reviewed"
after you are finished reviewing each plot, you can simply hit
the Control key on your keyboard. Uncheck to disable this
option.
To get the most efficient use of your monitor to display your
plot, chose "Maximize Form Area" in the top-right corner of
the page. This will collapse the tabs on the right side and
provide a larger area to display your plot. Uncheck to
disable this option and return to the regular view.
CALSoft enables you to use your mouse to adjust the lines
on the plotted heat penetration data... or you can use the
Arrow Keys on your keyboard for a more precise movement
of the lines. Hover your mouse over the "Special Function
Keys' link and you will see instructions on how to chose the
line to move with your Arrow Keys.
6.3.2.7.2 Plotting Cooling data to get Ball Formula cooling factors
The Ball Formula Method utilizes heating and cooling factors to predict the internal product slowest
heating zone temperature. The Ball method makes the assumption that a hyperbolic cooling lag
exists during the cooling phase. Therefore, Ball assumes the jc (cooling lag factor) = 1.41 which
represents a hyperbolic cooling lag. Ball also makes the assumption in the calculation that fc = fh
(slope of linear logarithmic heating = slope of linear logarithmic cooling).
CALSoft gives you the option to plot the cooling data from each heat penetration test and
mathematically determine a more specific coolling lag (jc) and slope of linear logarithmic cooling
(fc). The cooling curve is obtained by plotting the difference between the product temperature and
the cooling water temperature. However, unlike plotting heat data, the graph is not inverted and the
bottom line of the log scale is labeled one degree above the cooling water temperature, thus the
product temperature against time may be plotted directly.
CALSoft generates the graph based on the cooling water temperature that is entered and the "Time
Entered Cooling" from the HP test, and then automatically plots the heat penetration data and
generates Cooling Factors for each thermocoupled container (assuming cooling data has been
© 2012 TechniCAL Inc
106
CALSoft 5 Help
collected during the HP test). To review all of the plotted data, follow these steps:
1. Click on the lead number at the bottom of the Plot screen. The lead numbers are originally
identified in Blue circles, but will change to Green once that lead is "reviewed".
2. CALSoft will automatically attempt to plot your data using an algorithm that TechniCAL has
developed. In most cases CALSoft will accurately and conservatively plot your data. If CALSoft is
unable to plot your data an Autoplot Difficulty dialog box will be displayed.
3. If you need to adjust the line(s) that CALSoft has drawn, move your mouse pointer over the endpoint of the line that you would like to move. Click-drag-drop to move the line. When you click
and hold the left mouse pointer, the pointer will change to a four-headed arrow signifying that the
line can be moved in any direction. Remember, you must click and hold to drag and drop the line
end-point.
4. When the lines are in the correct position, click the REVIEWED button under PLOT STATUS at
the top. The circle containing the lead number will change to Green signifying that it is reviewed.
When REVIEWED status is selected, CALSoft will automatically advance to plotting the next
lead.
5. If the data for a particular thermocouple is Bad, click the Bad Data option on the right side of the
screen. When Bad data is clicked, CALSoft will not automatically advance to plotting the next
lead. You have to select the next lead to plot by clicking on that lead number at the bottom.
To Print TWO PLOTS PER PAGE, set the option in PREFERENCES (click Edit Preferences in the
Ribbon Menu at the top).
© 2012 TechniCAL Inc
Evaluate Data- Set a Process
107
6.3.2.7.3 Lethal Rate plots
CALSoft automatically plots the temperature and lethal rate of each thermocoupled container in each
heat penetration test using x, y, and z axes. The x-axis is time (total test duration (heating and
cooling)), the y-axis is the temperature reading from that thermocoupled container, and the z-axis is
the accumulated lethality (Fo). The plot contains the plotted thermocouple selected over time, and
the cumulative Fo over time. This plot is linear, not logarithmic. The General Method z and Tref used
in the accumulated F calculation are listed on the right of the plot, along with the total accumulated
F during heating, cooling, and the entire test.
You may also print a "Lethal Rate Report" for a specific thermocouple. This report is for a single
lead within an HP data file and shows Time/Temperature/Lethal Rate/Cumulative Lethality for each
data scan for that particular lead.
© 2012 TechniCAL Inc
108
CALSoft 5 Help
To Print TWO PLOTS PER PAGE, set the option in PREFERENCES (click Edit Preferences in the
Ribbon Menu at the top).
© 2012 TechniCAL Inc
Evaluate Data- Set a Process
6.3.2.8
109
Using CALSoft to compare factors from multiple HP files for Ball Formula calculation
After all heat penetration data has been plotted and reviewed, CALSoft will display the results of
each thermocoupled container on the "Ball Method Eval" tab. All heat penetration data files loaded
into the current ProCal record are displayed. You have the option to hide/show any of the data files.
The Main Grid shows all thermocouples and the heating factors derived from the plotted. Cook times
(Bb) are calculated for each using those heating factors and the process factors listed in the
"Preferences Used to Calculate Bb" section. Click on "Change Ball Formula Factors" button to
change these factors. Once changed, the Bb values will be updated. To help you further compare
the results of your evaluated data, CALSoft gives you the ability to add General Method
Accumulated lethality values and CritiCAL factors for each thermocouple. Sort the results by
clicking on any column heading.
Chose the heating factors from one of the available theromocouples to use in the final process
schedule calculation by checking the box next to that thermocouple in the first column. Click
"Next" to move to the Process Calculation section.
6.3.2.9
Calculating a Process using Ball Formula
Once the heat penetration data has been evaluated, plotted, and heating factors determined, chose
the heating factors to use in the final Process Calculation. CALSoft gives you the ability to use the
Ball Formula to calculate a matrix of cook times based on a range of Retort Temperatures and
Product Initial Temperatures (within limitations).
Process calculation
Assignment of Critical Factors
Optional Lethality Calculation Report
Generating Final Process report
© 2012 TechniCAL Inc
110
CALSoft 5 Help
6.3.2.9.1 Process calculation
The heating factors you chose are passed to the "Calculate Process" tab for use in the Ball Formula
Process Calculation.
Click Here to Expand
Product Information: Enter information related to the Product, Processor, Container, and retort for
which the process applies to. This information will be used on the printed Process Schedule. On the
Process Values tab, the following information can be entered:
Heating Factors: (jh, fh, f2, xbh). By default, these factors came from the thermocouple chosen
from the previous tab.
It is important to note that the m+g factor is determined based on your selection of retort. The m+g
is the factor used in the Ball Formula that represents the difference between the retort temperature
and cooling water. Traditionally, for Steam retorts, the m+g = 180oF (100oC) and for Water retorts,
the m+g = 130oF (72.2oC).
The Process Factors and RT/IT ranges can be set in PREFERENCES (chose "edit Preferences at
top Ribbon Menu) and chose "Process Factors" tab.
TC Correction: Thermocouple Correction corrects errors in heat penetration measurement caused
by conduction of heat along the thermocouple by the introduction of heat into the product by
thermocouple fittings. Thermocouple correction values should be used for conduction heating
products in containers with diameters equal to or less than 307. If the standard needle type
thermocouples applicable for these size cans are used in other size containers, then correction
factors should still be used. The correction factor is applied against the jh value. Following are the
known correction factors:
© 2012 TechniCAL Inc
Evaluate Data- Set a Process
111
Can Diameter Correction Factor
202
1.36
211
1.16
300
1.10
307
1.06
Come Up Time Credit: 42% of the time entered here will be used in the Ball Formula calculation.
Caution should be used when applying Come Up Time credit as limitations exist and should be
understood. The application of Come Up Time Credit will be printed on the final Process Schedule.
Process Correction: The value entered here will be treated as a percentage and will extend the
calculated cook time by that percentage (a 10 entered here will result in a cook time that is 10%
longer than the actual calculated cook time). This correction percentage will be printed on the final
Process Schedule.
Process Time Extension : The value entered here will be treated as "minutes" and will extend the
calculated cook time by that amount of time (a 10 entered here will result in a cook time that is 10
minutes longer than the actual calculated cook time). You must enter a reason for the process
extension. This extension and the reason will be printed on the final Process Schedule.
Product Type: Chose Low Acid Canned Food (LACF), Acidified, or Other will automatically set the
z and Tref for the sterility "F" value.
- Choosing LACF: z= 18 and Tref = 250
- Choosing Acidified: z= 16 and Tref = 200
- Choosing "other" will allow you to enter your own z and Tref values.
IT/RT Range: The Ball Formula allows you to calculate a matrix of cook times based on a range of
Retort Temperatures and Product Initial Temperatures (within limitations). Enter the high and low
values, and the intervals, for the RT and IT that you would like to use in the process calculations.
6.3.2.9.2 Assignment of Critical Factors
CALSoft enables you to assign Critical Factors to the calculated process. Critical Factors
assigned by the Process Authority are related to the product, container, or retort must be controlled
within their limits in order to ensure the safety of the calculated process time. Click on the Critical
Factors tab to assign the factors related to this process.
CALSoft transfers the Critical Factors that were recorded in the CritiCAL section for the
thermocouple selected as shown below. The Critical factors and their recorded readings from the
HP test are listed (in the grey columns) for your reference. You may enter the text in the "Text
Used" column (the white column) that you wish to describe the critical factor. Click "ADD" to add a
new Critical Factor to the list. To assign the Critical Factor to the process, click the check-box in
the first column. You can also re-order the critical factors as you would like them to appear on the
printed Process Schedule.
© 2012 TechniCAL Inc
112
CALSoft 5 Help
Click Here to Expand
NOTE: the first critical factor is set by default to be "Product Formulation & Preparation
Procedures". You can change this default in the Preferences section (click "Edit Preference" in the
Ribbon Menu at the top).
6.3.2.9.3 Lethality Calculation
The Lethality Calculation Report is an optional report that can be run from the Calculate Process Tab
to return a range of F values for the given Ball Heating factors for a specific Cook Time.
To run this report select the Lethality Calculation button.
© 2012 TechniCAL Inc
Evaluate Data- Set a Process
113
The report then asks for an Actual Cook Time.
The report then returns a range of F values for the given Ball Heating factors for the input Cook Time.
© 2012 TechniCAL Inc
114
CALSoft 5 Help
6.3.2.9.4 Generating Final Process report
Once the heating factors and process factors have been defined, and the Critical Factors assigned,
the process schedule may be calculated using the Ball Formula. Click the "Print Process Time"
button to generate the process schedule. The process schedule can be printed in Standard or
Detailed format.
After clicking "Print Process Time" button, CALSoft will ask if you are completed working on this
process. If you click "YES", the process will be "completed" and stamped with the current time/
date. If you click NO, the process will remain "Open" and will be considered "Not Completed Yet".
The Process Schedule will be generated and displayed on the screen. You can then print the report
to your printer, or you can click the button in the upper left-hand side of the page and export the
report to different formats (PDF, Excel, Word, RTF, etc.).
© 2012 TechniCAL Inc
Evaluate Data- Set a Process
6.3.3
Open Existing Process Calculation
To open and view/edit an existing CALSoft Process Calculation (ProCal Record), there are two
© 2012 TechniCAL Inc
115
116
CALSoft 5 Help
options:
(1) double click on the ProCal record # in the “recently used” list in the MIDDLE PANEL, or
(2) Click the “OPEN” button and use the "Find Fileter" (see below) to find the ProCal Record you
want to open.
The record will then load into CALSoft Set Process mode and display all of the information related to
that specific ProCal record.
The Find Filter allows you to search the ProCal database for a specific product, CALSoft Heat
penetration data file, or specific ProCal record number. The image below is a sample of the "Find
Filter" page.
© 2012 TechniCAL Inc
Evaluate Data- Set a Process
6.3.4
117
Delete a ProCal Record
To DELETE a Process Calculation (ProCal Record) from the ProCal DataBase, you must follow
these steps:
(1) open the ProCal record
(2) Click the "Delete Button" at the bottom of the "Find Filter" page.
CALSoft will warn you and then delete the record from the ProCal database upon your approval.
6.3.5
Quick Ball Formula Calculation
Click on the “QUICK BALL” button to quickly run a Ball Formula method calculation.
You will
need to enter the heating factors (j, fh, f2, xbh), Fo, and Retort Temperature and Initial Temperature
ranges. Optional information can be added such as product name, container, retort information,
and critical factors. CALSoft will save this process calculation as a record in the ProCal database
.
© 2012 TechniCAL Inc
118
6.3.6
CALSoft 5 Help
Reports availalbe to help Set A Process
The following Reports are available for to you view/print in order to to assist you in evaluating each
Heat Penetration data in the Set A Process section of CALSoft:
Lethal Rate report
Accumulated F (lethality) report
Time/Temperature report
Formulations print
6.3.6.1
Print Lethal Rate report
The "Lethal Rate Report" is for a single lead within an Heat Penetration data file and shows Time/
Temperature/Lethal Rate/Cumulative Lethality for each data scan for that particular lead. This report
can be found on the Time/Temperature tab for a specific HP data file in Collect-Heat Penetration...
or in Set A Process.
Click on Print Lethal Rate to run this report
© 2012 TechniCAL Inc
Evaluate Data- Set a Process
119
Chose the lead you wish to view the lethal rate report for and the Z and TREF to be used in the
calculation.
© 2012 TechniCAL Inc
120
6.3.6.2
CALSoft 5 Help
Print Accumulated F report
The "Accumulated F report" will calculate the total cumulative lethality for each lead in a given data
file. The total lethality will be broken down into lethality in heating and lethality in cooling. This report
can be found on the Time/Temperature tab for a specific HP data file in Collect-Heat Penetration...
or in Set A Process.
Click on Print Accumulated F to run this report
© 2012 TechniCAL Inc
Evaluate Data- Set a Process
Chose the Z and TREF to be used in the calculation and how you want the report sorted.
© 2012 TechniCAL Inc
121
122
6.3.6.3
CALSoft 5 Help
Print Time/Temperature report
The "Raw Data report" will print the time/temperature data from the HP test. Any LOG-DATA
entered will also be inluded on the printout. This report can be found on the Time/Temperature
tab for a specific HP data file in Collect-Heat Penetration... or in Set A Process. Click on Print Raw
Data to run this report
The TYPE of Lead and any Calibration Factors (and reference temperature used during the
calibration) applied to this file will show up at the top of the report.
© 2012 TechniCAL Inc
Evaluate Data- Set a Process
123
At the end of the report, CALSoft will calculate the total cumulative lethality for each lead in that data
file. The total lethality will be displayed at the end of the report and will be broken down into lethality
in heating, cooling, and total.
6.3.6.4
Print Formulations
The "Formulation" will print the time/temperature data from the HP test. Any LOG-DATA entered
will also be inluded on the printout. This report can be found on the Time/Temperature tab for a
specific HP data file in Collect-Heat Penetration... or in Set A Process. Click on Print Raw Data to
run this report
© 2012 TechniCAL Inc
124
CALSoft 5 Help
© 2012 TechniCAL Inc
Evaluate Data- Set a Process
6.3.6.5
125
Print Plots
The "Print Plots" button will print the plotted data that is displayed on the PLOTS tab in the Set A
Process section. Click on Print Plots to run this report.
To Print TWO PLOTS PER PAGE, set the option in PREFERENCES (click Edit Preferences in the
Ribbon Menu at the top).
© 2012 TechniCAL Inc
Part
VII
Evaluate Data- Set a CUT/Vent
7
127
Evaluate Data- Set a CUT/Vent
CALSoft enables you to evaluate temperature distribution data and Set A Come Up Time (CUT) or
Venting Schedule.
What is Setting a CUT / Vent?
Overview- Main Set A Process Dashboard
Reports available to help Establish a Vent or CUT
7.1
What is Setting a CUT / Vent?
Retort sterilizers must operate properly in order to deliver a safe thermal process to canned foods.
In order to accomplish this successfully:
(1) the adequate removal of air from the retort must be accomplished prior to the cook phase
starting... and...
(2) Temperature uniformity/stability must be achieved and maintained during the cook phase
"Setting a Come Up Time (CUT) or Venting Schedule" refers to the task evaluating Temperature
Distribution data in order to validate these two items are successfully achieved in the retort. .
CALSoft enables you to Set a CUT or Vent schedule by providing tools that assist you in evaluating
temperature distribution data as follows:
1.
2.
3.
4.
5.
6.
7.
8.
9.
Establish a TD ProCal record
Load Temperature Distribution (TD) Files to be evaluated
For each TD file, review time/temperature data,
For each TD file, review the lead locations
For each TD file, review lethal rate plots
For each TD file, evaluate the temperatures using Zoom Plotting
Compare the minimum and maximum readings from the TD tests
Assign conditions to the final CUT/Vent schedule
Determine & print a CUT/Vent schedule
© 2012 TechniCAL Inc
128
7.2
CALSoft 5 Help
Overview- Main Set A CUT/Vent Dashboard
Click on "Set A CUT/Vent" button in the Main Section and the MIDDLE PANEL will populate and
display the last 5 “recently used” Records that were established in CALSoft.
The CUT/Vent (TD-Cal) Database
New CUT/Vent
Open Existing CUT/Vent
Delete a CUT/Vent Record
7.2.1
The CUT/Vent (TDCal) Data-Base
When you "Set a CUT/Vent" using CALSoft, the information related to the process is stored in a
database referred to as the "TD-Cal Database".
For more information related to the database file
and it's location, see Process Database.
When you begin to Set A CUT/Vent establishment project with CALSoft, a new record is created in
the TD-Cal Database. This is referred to as the TD-Cal Record Number and is the main reference to
that Process Calculation. The TD-Cal Record Number is displayed on the final printed Process
Schedule report and also on the main dashboard of the Set A Process page.
© 2012 TechniCAL Inc
Evaluate Data- Set a CUT/Vent
7.2.2
129
New CUT/Vent
CALSoft offers users the ability to easily evaluate the temperature distribution data and establish a
Come Up Time (CUT) or Venting Schedule. Chose the "Set A CUT/Vent" section and click on the "
NEW" button to begin a NEW CUT/Vent project. CALSoft will then create a NEW TD-Cal record in
the database. Once the TD-Cal record is set up, you can begin the process of evaluating the data
and then finally establishing the CUT/Vent schedule. The steps are as follows:
Loading TD files to evaluate
Set up Basic TD Informtion
Viewing/printing/Editing Time/Temperature data
Viewing/Printing/Editing Lead location diagrams
Viewing Plotted data
Using CALSoft to conduct a Min/Max analysis of all TD data
Establishing a Vent/CUT scheudle
7.2.2.1
Loading TD files to evaluate
When starting a NEW CUT/Vent establishment project, the first step after the TD-CAL record is
established is to load the temperature distribution file(s) you wish to evaluate in order to establish a
CUT/Vent Schedule. CALSoft allows you to load multiple temperature distribution files into one CUT/
Vent exercise (TD-Cal record). Click on "SELECT FILE" and find the TD data files you wish to
© 2012 TechniCAL Inc
130
CALSoft 5 Help
evaluation. Once a TD data file is loaded, you can Double Click on "VIEW" to see the contents of
that file.
T
7.2.2.2
Set up Basic TD Information
Once the data files are chosen for evaluation, you will be asked to enter the basic information related
to this Retort. You can either (a) manually enter the Processor and Retort information, or you can
(b) chose to use the information that is already in one of the TD data files that was previously loaded
by selecting that file from the File Selector drop-down menu. Once a file is loaded, you can edit
any of the information that populates the form. This information will be used on the final Come Up
Time/Vent Schedule report.
© 2012 TechniCAL Inc
Evaluate Data- Set a CUT/Vent
7.2.2.3
131
Viewing/printing/Editing Time/Temperature data
The Time/Temperature tab functionality in Set A CUT/Vent is the same as in Set A Process section.
Click here to view the help.
© 2012 TechniCAL Inc
132
7.2.2.4
CALSoft 5 Help
Viewing/Printing/Editing Lead location diagrams
CALSoft allows you the option to review the location of your Temperature Distribution leads in the
retort. Click here to see the "Lead Location" tab in TD Data Collection.
7.2.2.5
Viewing Plotted data
CALSoft allows you the ability to view plotted data for each Temperature Distribution data file:
Min/Max Plot
Pre-CUT Plot
Pre-CUT Plotted data
Zoom Plot
Zoom Plot
To get the most efficient use of your monitor to display your plot, chose "Maximize Form Area" in
the top-right corner of the page. This will collapse the tabs on the right side and provide a larger area
to display your plot. Uncheck to disable this option and return to the regular view.
© 2012 TechniCAL Inc
Evaluate Data- Set a CUT/Vent
133
7.2.2.5.1 Min/Max Plotted data
For each Temperature Distribution data file, CALSoft will plot the "Min/Max" readings for each scan.
This plotted data will help you to visually evaluate the difference in the high and low temperatures in
the retort during the cycle that was tested.
It should be noted that only those leads that are classified as free leads will be used in performing
the Min/Max analysis. If your leads are not correctly classified, then go to the Time Temperature
Tab and click "Change Lead Type".
Click here to learn how to include "Log Entries" on the Min/Max or Min/Min printed plots
To Print TWO PLOTS PER PAGE, set the option in PREFERENCES (click Edit Preferences in the
Ribbon Menu at the top).
© 2012 TechniCAL Inc
134
CALSoft 5 Help
7.2.2.5.1.1 Add Log Entries to Min/Max printout
To add "Log Entries" to a Min/Max or Min/Min printout, set the option in Preferences (chose the
Edit Preferences option in the Ribbon Menu)...
© 2012 TechniCAL Inc
Evaluate Data- Set a CUT/Vent
135
7.2.2.5.2 Pre-CUT Plotted data
For each Temperature Distribution data file, CALSoft will plot the "Pre-CUT" Plot. To generate this
plot, CALSoft determines the minimum temperature at each scan and plots that related to the Come
Up Time (CUT) on a time/temperature grid. A straight-line is then plotted from the start of the test
through the Come Up Time (CUT). When properly used, this Pre-CUT plot will help you to
determine if come up time credit can be used in the ball formula calculation.
It should be noted that only those leads that are classified as free leads will be used in performing
the "Pre-Come Up" analysis. If your leads are not correctly classified, then go to the Time
Temperature Tab and click "Change Lead Type".
To Print TWO PLOTS PER PAGE, set the option in PREFERENCES (click Edit Preferences in the
Ribbon Menu at the top).
© 2012 TechniCAL Inc
136
CALSoft 5 Help
7.2.2.5.3 Zoom Plot
Click on the “Zoom" tab and then th ZOOM BUTTON to access CALSoft’s unique graphing feature.
CALSoft’s “Zoom” utility plots the time/temperature data on a graph and then allows you to “ZOOM
IN” on the data by using your cursor to select the part of the graph you want to zoom into.
Click here for more information on using the CALSoft Zoom Plotting Feature
7.2.2.6
Using CALSoft to conduct a Min/Max analysis of all TD data
On the Min/Max tab, CALSoft will combine all TD data files loaded into the current TD-Cal record.
You have the option to hide/show any of the data files. You can chose to display the 2 minimum
readings from each scan (min/min) or the minimum and maximum from each scan (min/max). The
Main Grid shows each reading (min/min or min/max) at each scan.
© 2012 TechniCAL Inc
Evaluate Data- Set a CUT/Vent
137
Enter a "REFERENCE TEMPERATURE" and CALSoft will scan the data and visually mark the scans
where that temperature has been reached or exceeded by marking them in a different color (Orange
). This feature will help you to determine at what time a certain temperature has been achieved
during the TD tests. Multiple Files may be analyzed at once using this feature.
It should be noted that only those leads that are classified as free leads will be used in performing
the Min/Max and Min/Min analysis. If your leads are not correctly classified, then go to the Time
Temperature Tab and click "Change Lead Type".
7.2.2.7
Establishing a Vent/CUT scheudle
Once the temperature distribution data has been evaluated, you can establish the Come Up Time or
Venting schedule to assign to the retort. CALSoft gives you the ability to generate and print a Come
Up Time (CUT) or Vent Schedule using the information you have established.
Venting Schedule
Come-Up schedule
Adding “conditions”
Generating Final Vent/CUT schedule report
© 2012 TechniCAL Inc
138
CALSoft 5 Help
7.2.2.7.1 Venting Schedule
You can either use the standard format for a Venting Schedule and enter the Vent Closed time/
temperature and Start Process time/temperature, or you can create your own custom text.
STANDARD FORMAT: Based on the retort type chosen in the drop-down menu under the RETORT
section, the bottom section will change to either VENT or CUT. Enter the times and temperatures
that you have established for the Vent or CUT.
For STEAM retorts, this section is labeled "VENT"
CUSTOM FORMAT: If you would rather enter your own description of the Vent schedule, chose the
CUSTOM option and type your text.
© 2012 TechniCAL Inc
Evaluate Data- Set a CUT/Vent
139
Enter the "Conditions" related to the Vent Schedule (such as loading pattern, container size, etc.)
and then print/save the Vent Schedule.
7.2.2.7.2 Come-Up schedule
You can either use the standard format for a Come Up Schedule and enter the Start Process time/
temperature, or you can create your own custom text.
STANDARD FORMAT: Based on the retort type chosen in the drop-down menu under the RETORT
section, the bottom section will change to either VENT or CUT. Enter the times and temperatures
that you have established for the Vent or CUT.
For WATER retorts, this section is labeled "Come Up Time (CUT)"
If you would rather enter your own description of the Vent or CUT, chose the CUSTOM option and
type your text.
© 2012 TechniCAL Inc
140
CALSoft 5 Help
Enter the "Conditions" related to the Vent Schedule (such as loading pattern, container size, etc.)
and then print/save the Vent Schedule.
7.2.2.7.3 Adding Temperature Distribution Conditions
To finish your Vent Schedule or Come Up Time schedule, CALSoft enables you to add "conditions"
to the VENT or CUT. For example, you may conclude that the vent schdule only applies to
containers that are loaded in layers, not "jumble" packed. Or you may assign the Come Up Time to
a particular can size. The Conditions include several pre-defined options that you can apply (use
the check box) and add your specific text. Five CUSTOM fields are available at the end of the list.
These "Conditions" will appear on the printed Vent or CUT schedule.
© 2012 TechniCAL Inc
Evaluate Data- Set a CUT/Vent
141
7.2.2.7.4 Generating Final Vent/CUT schedule report
Once the details of the Vent or CUT schedule have been established, and the Conditions assigned,
the CUT or VENT schedule may be printed. Click the "Print CUT/Vent" button to generate the
process schedule. The process schedule can be printed in Standard or Detailed format.
After clicking "Print CUT/Vent" button, CALSoft will ask if you are completed working on this
process. If you click "YES", the CUT/Vent will be "completed" and stamped with the current time/
date. If you click NO, the process will remain "Open" and will be considered "Not Completed Yet".
© 2012 TechniCAL Inc
142
CALSoft 5 Help
The Come Up Time or Vent Schedule will be generated and displayed on the screen. You can then
print the report to your printer, or you can click the button in the upper left-hand side of the page and
export the report to different formats (PDF, Excel, Word, RTF, etc.).
© 2012 TechniCAL Inc
Evaluate Data- Set a CUT/Vent
7.2.3
143
Open Existing CUT/Vent
To open and view/edit an existing CALSoft CUT/Vent project (TD-Cal Record), there are two options:
1. Double click on the TD-Cal record # in the “recently used” list in the MIDDLE PANEL, or
2. Click the “OPEN” button and use the "Find Filter" (see below) to find the TD-Cal Record you want
to open.
The record will then load into CALSoft Set CUT/Vent mode and display all of the information related
to that specific TD-Cal record.
The Find Filter allows you to search the TD-Cal database for a specific processor, retort, CALSoft
Temperature Distribution data file, or specific TD-Cal record number. The image below is a sample
of the "Find Filter" page.
© 2012 TechniCAL Inc
144
7.2.4
CALSoft 5 Help
Delete a CUT/Vent Record
To DELETE a CUT/Vent (TD-Cal Record) from the TD-Cal DataBase, you must follow these steps:
(1) open the TD-Cal record
(2) Click the "Delete Button" at the bottom of the "Find Filter" page.
CALSoft will warn you and then delete the record from the TD-Cal database upon your approval.
© 2012 TechniCAL Inc
Evaluate Data- Set a CUT/Vent
7.3
145
Reports availalbe to help Establish a Vent or CUT
The following Reports are available for to you view/print in order to to assist you in evaluating each
Heat Penetration data in the Set A Process section of CALSoft:
Lethal Rate report
Accumulated F (lethality) report
Time/Temperature report
Formulations print
7.3.1
Print Lethal Rate report
The "Lethal Rate Report" is for a single lead within an Heat Penetration data file and shows Time/
Temperature/Lethal Rate/Cumulative Lethality for each data scan for that particular lead. This report
can be found on the Time/Temperature tab for a specific HP data file in Collect-Heat Penetration...
or in Set A Process.
Click on Print Lethal Rate to run this report
Chose the lead you wish to view the lethal rate report for and the Z and TREF to be used in the
calculation.
© 2012 TechniCAL Inc
146
CALSoft 5 Help
© 2012 TechniCAL Inc
Evaluate Data- Set a CUT/Vent
7.3.2
147
Print Accumulated F report
The "Accumulated F report" will calculate the total cumulative lethality for each lead in a given data
file. The total lethality will be broken down into lethality in heating and lethality in cooling. This report
can be found on the Time/Temperature tab for a specific HP data file in Collect-Heat Penetration...
or in Set A Process.
Click on Print Accumulated F to run this report
© 2012 TechniCAL Inc
148
CALSoft 5 Help
Chose the Z and TREF to be used in the calculation and how you want the report sorted.
NEED REPORT IMAGE
7.3.3
Print Time/Temperature report
The "Raw Data report" will print the time/temperature data from the HP test. Any LOG-DATA
entered will also be inluded on the printout. This report can be found on the Time/Temperature
tab for a specific HP data file in Collect-Heat Penetration... or in Set A Process. Click on Print Raw
Data to run this report
The TYPE of Lead and any Calibration Factors (and reference temperature used during the
calibration) applied to this file will show up at the top of the report.
At the end of the report, CALSoft will calculate the total cumulative lethality for each lead in that data
© 2012 TechniCAL Inc
Evaluate Data- Set a CUT/Vent
149
file. The total lethality will be displayed at the end of the report and will be broken down into lethality
in heating, cooling, and total.
7.3.4
Print Lead Locations
The "Print Lead Locations" button will print the location of the leads as recorded in the TD file.
This report can be found on the Lead Location tab for a specific TD data file in Collect-Temperature
Distribution ... or in Set A CUT/Vent. Click on Print Lead Location to run this report
© 2012 TechniCAL Inc
150
7.3.5
CALSoft 5 Help
Print Plots
The "Print Plots" button will print the plotted data that is displayed on the PLOTS tab in the Set A
CUT/Vent section. Click on Print Plots to run this report.
© 2012 TechniCAL Inc
Evaluate Data- Set a CUT/Vent
151
To Print TWO PLOTS PER PAGE, set the option in PREFERENCES (click Edit Preferences in the
Ribbon Menu at the top).
7.3.6
Print MinMax
The "Print Min/Max" button will print the contents of the data grid from the Min/Max (or Min/Min)
Evaluation tab in Set A CUT/Vent. On the Min/Max tab, click on Print to run this report
NOTE: The scan will turn BOLD on the printed report when the referenced temperature is met or
exceeded.
© 2012 TechniCAL Inc
152
CALSoft 5 Help
© 2012 TechniCAL Inc
Part
VIII
154
8
CALSoft 5 Help
Evaluate a Deviation
CALSoft enables you to evaluate processing deviations using the Ball Formula method, heating
factors properly derived from heat penetration data from the product in question, and the actual
Retort Temperature (RT) and Initial Temperature (IT).
What is Evaluating a Deviation?
The Deviation (DevCal) Data-Base
Evaluating a Deviation using CALSoft
8.1
What is Evaluating a Deviation?
A process deviation is an error or change, in a critical condition of the scheduled process, which
may reduce the sterilizing value the product receives, or which raises a question regarding the public
health safety and/or commercial sterility of the product. FDA defines a Process Deviation as "...
Whenever any process is less than the scheduled process.....".
When a Process Deviation occurs, FDA states that the processor may either (a) fully reprocess that
portion of the production involved or, alternatively, (b) shall set aside that portion of the production
involved for further evaluation as to any potential public health significance. Such evaluation shall be
made by a competent processing authority and shall be in accordance with procedures recognized
by competent processing authorities as being adequate to detect any potential hazard to public
health.
"Evaluating a Deviation" refers to the evaluation made by the Process Authority to determine if the
product is safe. CALSoft enables Process Authorities the ability to evaluate processing deviations
using the Ball Formula method, heating factors properly derived from heat penetration data from the
product in question, and the actual Retort Temperature (RT) and Initial Temperature (IT). The Ball
Formula will calculate an estimated Fo value for the cook parameters provided. The Process
Authority must ultimately make the decision whether to release or hold/destroy the affected
product.
© 2012 TechniCAL Inc
Evaluate a Deviation
8.2
155
The Deviation (DevCal) Data-Base
When you "Evaluate A Deviation" using CALSoft, the information related to the evaluation is stored in
a database referred to as the "Dev-Cal Database".
For more information related to the database
file and it's location, see Process Database.
When you begin to Evaluate a Deviation with CALSoft, a new record is created in the Dev-Cal
Database. This is referred to as the Dev-Cal Record Number and is the main reference to that
Evaluation. The Dev-Cal Record Number is displayed on the final printed Deviation Evaluation
report and also on the main dashboard of the Evaluate Deviation page.
8.3
Evaluating a Deviation using CALSoft
CALSoft is a tool that enables Process Authorities the ability to evaluate processing deviations using
the Ball Formula method, heating factors properly derived from heat penetration data from the
product in question, and the actual Retort Temperature (RT) and Initial Temperature (IT). The Ball
Formula will calculate an estimated Fo value for the cook parameters provided. The Process
Authority must ultimately make the decision whether to release or hold/destroy the affected
product.
Select the Deviations section and then click the NEW button to begin a new Deviation Evaluation.
© 2012 TechniCAL Inc
156
8.3.1
CALSoft 5 Help
Main Deviation Evaluation page
The main Deviation Evaluation Form is divided into four parts:
1. DEVIATION INFORMATION- Enter information here related to the product, retort, container, Date
of deviation, codes affected, and an explanation of what happened. This information will be used
on the printed Evaluation report.
2. BALL FORMULA EVALUATION - Enter the ball formula heating factors to be used in the
sterility calculation, along with the ACTUAL Retort Temerature, Product Initial Temperature, and
Come Up Time (if Come Up Time credit can be applied).
3. RESULTS- Enter the desired F value that must be achieved for "minimum health" and
"commercial sterility"
4. COMMENTS - Enter information the person who conducted the evaluation, the date, and the
disposition of the product.
8.3.2
Use Existing ProCal record to evaluate Deviation
Once you begin a new Deviation Evaluation project, CALSoft will ask you if the product in question is
included in an existing ProCal record within CALSoft. If so, you can chose that ProCal record and
load the product's heating factors into the Deviation Evaluation system. If there is no ProCal record
for this product, you will simply have to enter the information manually.
© 2012 TechniCAL Inc
Evaluate a Deviation
157
If you chose to use a product that has a ProCal record in CALSoft, find the associated ProCal record
and load it into the Evaluate Deviation feature. The ProCal record will be loaded as a separate tab
BEHIND the Deviation record. If you need to refer to the data, plots, or other parts of the Process
Calculation, you can simply click the tab with the ProCal record to toggle between that and the
Deviation Evaluation.
Also, if you chose to use a product that has a ProCal record, CALSoft will populate many of the
fields on the Deviation Evaluation page, using the information from that ProCal Record.
© 2012 TechniCAL Inc
158
CALSoft 5 Help
.
8.3.3
Enter information about deviation
The first section of the Deviation evaluation tab is to enter information about the Deviation itself.
The next sections of the page include:
Using the Ball Formula to evaluate the Deviations
Deviation Evaluation Results
Generating Final Deviation Evaluation report
8.3.4
Using Ball Formula calculation to evaluate deviation
The second section of the Deviation evaluation tab is to enter information relative to the Ball Formula
heating factors and actual processing conditions in order to calculate a sterility value for the product
affected by the Deviation.
© 2012 TechniCAL Inc
Evaluate a Deviation
159
Come Up Time Credit: NOTE: only add the ACTUAL Come Up Time (CUT) if you are sure that
credit can be given for lethality in the Come Up phase. The Ball Formula allows 42% of hte Come up
to be applied to the sterility calculation.
ACTUAL IT & RT & COOK TIME: Enter the Actual IT and RT and Cook Time experienced by the
affected product during the deviation. Caution must be taken in assigning the correct RT and IT and
Cook Time to the sterility equation.
m+g: The m+g is the factor used in the Ball Formula that represents the difference between the
retort temperature and cooling water. Traditionally, for Steam retorts, the m+g = 180oF (100oC) and
for Water retorts, the m+g = 130oF (72.2oC). If an existing ProCal record is being used for this
evaluation, the m+g is assigned based on the type of retort used for the Heat Penetration test from
which the heating factors were derived.
TC Correction: Thermocouple Correction corrects errors in heat penetration measurement caused
by conduction of heat along the thermocouple by the introduction of heat into the product by
thermocouple fittings. Thermocouple correction values should be used for conduction heating
products in containers with diameters equal to or less than 307. If the standard needle type
thermocouples applicable for these size cans are used in other size containers, then correction
factors should still be used. The correction factor is applied against the jh value.If an existing ProCal
record is being used for this evaluation, the TC Correctoin is carried over to the Deviation evaluation
if the original ProCal record was created using a TC Correction.
The next section of the page include:
Deviation Evaluation Results
Generating Final Deviation Evaluation report
8.3.5
Deviation Evaluation Results
The third section of the Deviation evaluation tab is to calculate the Sterility value using the Ball
Formula method.
Commercial Sterility: this is the value as determined by the Process Authority to be the minimum
limit for "Commercial Sterility".
Minimum Health: this is the value as determined by the Process Authority to be the minimum limit
for "Minimum Health"
Include in Report (Check Boxes): the check boxes next to each value will determine if those
values print on the Evaluation report.
© 2012 TechniCAL Inc
160
CALSoft 5 Help
Calculated Lethality: when the CALCULATE button is clicked, CALSoft will use the heating
factors and actual processing parameters to calculate the sterility value (F value) with the Ball
Formula. It will be displayed if the calculated lethality is OVER or UNDER the targets for
Commercial Sterility and Minimum health.
The next section of the page includes:
Generating Final Deviation Evaluation report
8.3.6
Generating Final Deviation Evaluation report
Once the information for the Deviation has been recorded and the sterility calculation conducted, you
may print a report of the Evaluation for your files.
Evaluated By: You may chose to document who conducted this evaluation.
Date: This is the date of the evaluation.
Product Disposition: Enter your disposition of the product in this text box.
PRINT: this prints a Report of the Deviation Evaluation.
© 2012 TechniCAL Inc
Evaluate a Deviation
© 2012 TechniCAL Inc
161
Part
IX
Other Tools/Features
9
163
Other Tools/Features
CALSoft includes other tools and features:
Fh Conversion
Temperature Conversion
Lethal Rate table
CALPlex diagnostic
Quick Viewer
9.1
Software Security/Activation Code
CALSoft5 requires a valid Activation Code during installation and before first use. This Activation
Code was supplied by TechniCAL when the software was purchased. Connection to the internet is
required to activate the CALSoft5 software. However, internet connection is not required to actually
run CALSoft5 after activation is complete.
Each purchased license of CALSoft5 may be used by only one person at a time. Therefore,
your CALSoft 5 Activation Codes has limited use and can only be used to install CALSoft on up
to two (2) of your computers.
If you misplace your Activation Code, please contact TechniCAL ([email protected]) to obtain
another copy of the code. However, please note that each activation code can only be used to
install CALSoft on up to two (2) computers. Each user should have their own individual
© 2012 TechniCAL Inc
164
CALSoft 5 Help
activation code.
9.1.1
Automatic updates
CALSoft5 includes a feature to automatically check for updates if an internet connection is detected.
If an update is available, you will be notified and given the choice to install the update or skip and
not install. To ensure that you have the most current working version of CALSoft, it is
recommended that you install any updates that are available.
9.2
File management
CALSoft creates three different types of files:
1. Heat Penetration and Temperature Distribution Data Files (data files xxx.CHP ...... or xxx.CTD)
2. Calibration Files: (data files xxx.CLB)
3. Process & Vent/CUT Calculations and Deviation Evaluation (Records in a ProCal Database)
9.2.1
Heat Penetration and Temperature Distribution Data Files:
CALSoft5 separate creates separate files for each Heat Penetration (HP) and Temperature
Distribution (TD) test that is conducted. CALSoft5 uses different file extensions to differentiate
between HP and TD files:
Heat Penetration = xxx.CHP
Temperature Distribution= xxxxx.CTD
Upon first use of CALSoft, these data files are stored by default in the CALSoft subdirectory titled
“Data”.
However, data files can be stored in any location you desire. Each time a new HP or TD test is
conducted, the location will default to the last location in which a file was saved.
© 2012 TechniCAL Inc
Other Tools/Features
9.2.2
165
Calibration Files
Calibration files can be collected using CALSoft. These files include offsets for each of the 32
channels based on a reference temperature. By default, calibration files are stored in the CALSoft
subdirectory titled “Calibration”.
CALSoft5 uses the file extension "clb" for Calibration files:
NOTE: older Calibration files from previous versions of CALSoft may be used with CALSoft 5.
These files can be viewed in the Calibration feature.
9.2.3
Process Database
CALSoft keeps the following information in a database:
- When a new thermal process is calculated using CALSoft
- When a new Come-up time or vent schedule is established using CALSoft
- When a deviation evaluation is conducted using CALSoft
The information related to these results is stored in a “calculation” database which is named the
“ProCal5.mdb” database. Upon first use of CALSoft, the ProCal5.mdb database is created and
stored in the CALSoft subdirectory. However, you can move and set the location of the ProCal5.
mdb database under the “Preferences”.
© 2012 TechniCAL Inc
166
CALSoft 5 Help
Records in the database correlate to a specific calculation/evaluation exercise conducted by
the user. This is referred to as follows:
- Process Calculations – “ProCAL” records
- Come Up time or Vent Schedule Establishments- “TDCAL” records
- Deviation Evaluations – “DevCAL” records
9.3
Fh Conversion
The fh of a product is dependent not only the nature of the product, but on the container dimensions.
CALSoft’s fh Conversion Utility allows you to convert the fh of a product from one container size to
another based on the equations by Shultz and Olson (convection heating) and Olson and Jackson
(conduction heating).
CAUTION: there are limitations on the conversion of fh values from one product to another.
If you are unsure of these limitation and how they may apply to your product, please
consult a competent Process Authority for advice.
To use the fh Conversion Utility choose the TOOLS option from the Ribbon menu in any of the
CALSoft sections.
© 2012 TechniCAL Inc
Other Tools/Features
167
The fh Conversion Utility worksheet will appear. The following information needs to be completed to
perform the fh conversion:
Convection / Conduction heating
Container dimensions of original container
Container dimensions of desired container
fh of original container
Once this information is entered, the estimated converted fh will automatically be listed in the fh of
Desired Container field. To print this fh Conversion, click the Print button.
9.4
Temperature Conversion
CALSoft’s Temperature Conversion Utility allows you to convert individual temperatures from
Fahrenheit to Celsius and vice-versa.
The utility also allows the conversion of a number of degrees from Fahrenheit to Celsius. For
example, z-values are not temperatures, but a number of degrees. A z-value of 18 F° converts to a zvalue of 10 C°. The temperature conversion utility will allow you to perform these conversions also.
To perform a temperature conversion, choose the TOOLS option from the Ribbon menu in any of the
CALSoft sections. .
© 2012 TechniCAL Inc
168
CALSoft 5 Help
The Temperature Conversion Utility will appear.
To perform a conversion you must specify the following information:
Scale to convert from or scale to convert to
Whether conversion is Temperature or Number of Degrees
Temperature to convert
Once this information is entered the conversion will automatically be performed and the converted
temperature will appear in the shaded field in the lower right hand corner of the dialog box.
© 2012 TechniCAL Inc
Other Tools/Features
9.5
169
Lethal Rate table
It is possible to print Lethal Rate tables for any Temperature Range, Temperature Increment, z Value
and Reference Temperature combination. To access this feature, choose the TOOLS option from the
Ribbon menu in any of the CALSoft sections. .
Enter the desired parameters and select the CALCULATE button to have CALSoft calculate the
tables.
The Lethal Rate table will be generated by CALSoft. You can view or Print the table.
© 2012 TechniCAL Inc
170
9.6
CALSoft 5 Help
CALPlex diagnostic
Run the CALPlex Diagnositc report to gather information that may be required when troubleshooting
your CALPlex datalogger. Enter basic information about your CALPlex Datalogger and then click
EMAIL TO TechniCAL. Make sure you are connected to the CALPlex datalogger and that it is
powered on and connected to thermocouple containers. This will scan CALPlex and create a text
file of technical information.
© 2012 TechniCAL Inc
Other Tools/Features
9.7
171
Quick Viewer
The CALSoft QuickViewer is a file opening utility that allows the user to view imortant CALSoft file
information before opening (or including) the File. Fields included for viewing are Product, Processor,
Location, Container, and Retort information. All files that are contained in the selected directory are
displayed in a table. You may sort any of the columns by clicking on the column header. To
change the directory, click on the Folder icon in the top-right of the window.
In Set a Process or Set a CUT/Vent select the checkbox to select one or more files to include in
your project. In Collect HP or Collect TD the checkbox is not available because those utilities only
allow for review of one file at a time.
To switch back to the standard "Windows view" for opening files, click "Use Windows File Open".
© 2012 TechniCAL Inc
172
9.8
CALSoft 5 Help
CritiCAL Template
"CritiCAL" is a feature within CALSoft that gives you the option of recording CRITICAL FACTORS
associated with each thermocoupled container in the heat penetration test. The default CritiCAL
template grid includes many common critical factors. To view or change the default factors to be
used in the template when the CritiCAL Feature is used (in Heat Penetration testing), click on
"CritiCAL Template" from the CALSoft main dashboard.
(click here for more information on how to use the CritiCAL feature during a Heat Penetration test).
There are 5 "Custom ingredients" that you can customize to fit your needs. Double click on the
blue, underlined text ("Ingredient#") to change.
The "units used" may also be changed by double-clicking on the unit.
If you click "Save as Default", these factors will be used the next time a new HP test is conducted
and the CritiCAL feature is used
© 2012 TechniCAL Inc
Other Tools/Features
9.9
173
Beep When Scanning During Data Collection
You may set CALSoft to make an audible sound ("Beep") after each scan during HP or TD data
collection. To do this, go to PREFERENCES (in the Ribbon menu of any section, or on the main
Dashboard) and chose the COLLECT tab on the right. Then check "Beep During Data Collection".
To turn off this feature, un-check "Beep During Data Collection"
© 2012 TechniCAL Inc
174
9.10
CALSoft 5 Help
Delay Start of Data Collection
You may chose to delay the start of data-collection. This will give you time to synchronize the start
of data-collection in CALSoft with the start of the retort. To delay the start of data-collection, go to
PREFERENCES (in the Ribbon menu of any section, or on the main Dashboard) and chose the
COLLECT tab on the right. Then check "Delay The Start of Data Collection" and enter a time (hours,
minutes, seconds) that you want to wait until data collection begins. To turn off this feature, uncheck "Delay The Start of Data Collection"
© 2012 TechniCAL Inc
Other Tools/Features
9.11
Collect HP Set Default Free Leads
The user can know set in their preferences which leads will default to Free leads for a new HP
collection file.
This is set in the Preferences Collect tab.
© 2012 TechniCAL Inc
175
176
CALSoft 5 Help
To change this value from the first two channels select the Change Default Free Lead Channels link.
This link will launch the Collect HP: Set Default Free Leads Form and on this form the user can
select which channels will be the default free leads for a Collect HP test.
After selecting Apply the new defaults will be set.
© 2012 TechniCAL Inc
Index
Index
-PPlotting data
101
Process calculation
-A-
110
-Q-
Assignment of Critical Factors
111
Quick Ball Formula Calculation
-B-
117
-R-
Backup File
57, 85
Ball Formula Method
92
RTemp Data Collection
-C-
18
-S-
Calibration
56, 85
CALPlex Data Collection
17
Collect Data- Heat Penetration
13
Collect HP Set Default Free Leads
175
Software Security/Activation Code
163
-TTemperature Conversion
167
The Process Calculation (ProCal) Data-Base
-FFh Conversion
177
-W-
166
-GGeneral Method
93
Generating Final Process report
What
What
What
What
114
-I45
Zoom plotting
-LLethal Rate table
169
Lethality Calculation Report (Optional)
-M-
© 2012 TechniCAL Inc
Evaluating a Deviation?
154
heat penetration?
13
Setting a CUT / Vent?
127
Setting A Process?
91
-Z-
Importing Files into CALSoft 5
Manual File Creation HP
Manual File Creation TD
is
is
is
is
53
82
112
61, 85
94
178
CALSoft 5 Help
Endnotes 2... (after index)
© 2012 TechniCAL Inc
Back Cover