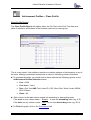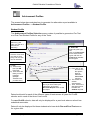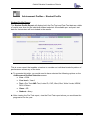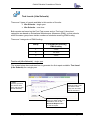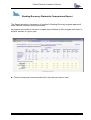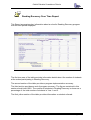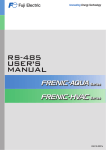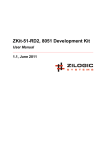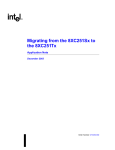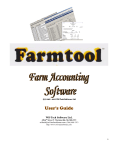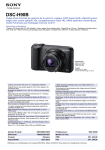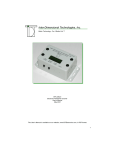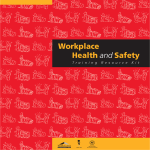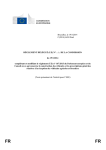
1
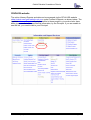
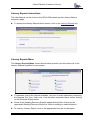
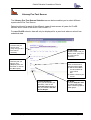
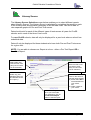
Catholic Education Commission of Victoria
Literacy Reports
(Primary Schools)
User Manual
Version 1.2
July 2005
Catholic Education Commission of Victoria
Literacy Reports for Primary Schools
Literacy Data
From the beginning of 2005 your school is responsible for recording literacy assessment
data in your school’s administrative software system. The data will be automatically
uploaded to the CEOM’s Information System (CIS) database.
The uploaded data are then used by the online Literacy Report facility on the CEVN–ISS
website to generate reports for your school to use.
Contents
Page No
CEVN–ISS website
Literacy Reports Menu
Pre-Test Scores
Post-Test Scores
Pre- and Post Test Scores
Literacy Scores
Literacy Achievement Profiles
• Year or Class Profile
• Student Profile
Literacy Text Level (Like Schools)
• Text Level (Like Schools – single year
• Text Level (Like Schools – over time
Literacy Value Added Measures
Reading Recovery Menu
Reading Recovery Tentative Selection List
Reading Recovery Provision
Reading Recovery Student Profile
Reading Recovery Statewide Comparison
Reading Recovery over Time
2
3
4
6
8
10
12
14
16
18
20
21
22
23
24
25
26
This manual has been written to provide you with:
•
the list of Literacy Reports that can be generated
•
instructions on how to generate your school Literacy Reports
•
information on what the Literacy reports represent.
School Literacy Reports – User Manual
Page 1
Catholic Education Commission of Victoria
CEVN-ISS website
The online Literacy Reports and data can be accessed via the CEVN–ISS website
<http://admin.ceo.melb.catholic.edu.au> under Profiles & Reports, as shown below. The
hyperlink Literacy Reports will only be visible to those people in your school who have
been given access to this confidential information, by the Principal. If you are unable to
see the link, you need to talk to your Principal.
School Literacy Reports – User Manual
Page 2
Catholic Education Commission of Victoria
Literacy Reports Instructions
This User Manual can be found on the CEVN-ISS website on the Literacy Reports
Instruction page.
► To access the Literacy Reports Menu screen, click on the Literacy Reports link.
Literacy Reports Menu
The Literacy Reports Menu screen shown below provides you with links to all of the
Literacy Reports available for your school.
Demonstration Primary School
► To generate most of the Reports available, you have to make selections concerning
the required Test Type, Year Level, Year and other associated items, before clicking
on the Generate Report button.
► Some of the Reading Recovery Reports appear directly after clicking on the
appropriate Reading Recovery Menu link, without needing to make selections.
► To view any Literacy Report, click on the appropriate blue link for that report.
School Literacy Reports – User Manual
Page 3
Catholic Education Commission of Victoria
Literacy Pre-Test Scores
The Literacy Pre-Test Scores Selection screen below enables you to select different
reports about Pre-Test Scores.
Data should exist for each of the different types of tests across all years for CLaSS
schools and in each of the three Year Levels P–2.
For non-CLaSS schools, data will only be displayed for a year level where a school has
submitted data.
1. Test
Click the test you
want to view.
(Only one type at a
time can be
selected.)
Demonstration Primary School
3. Year Level
Click the Year Level you
want to view. (Only one
at a time can be
selected.)
2. Year
Click the year you
want to view.
(Multiple years can
be ticked or choose
the ALL option.)
4. Class
Click on the arrow to
see the options listed.
a) Either select All to
see all students at
your school,
OR
b) select a class at your
school.
6. Generate Report
Once you have made your
selections, click on the
Generate Report button to
see your school’s Pre-test
Scores Report.
School Literacy Reports – User Manual
5. Graph
Tick the Swap X/Y axis
to change the Report
from a Column graph to
a Bar graph.
Page 4
Catholic Education Commission of Victoria
Literacy Pre-Test Report
Demonstration Primary School
The Report, as shown above, includes a column graph and a frequency table that will be
generated after you have made your selection on the Pre-Test Selection screen.
The vertical axis displays the number of students with scores, while the horizontal axis
displays the actual scores.
► To generate this report, you would need to have selected the following options on the
Pre-Test Scores Selection screen:
➤ Test = Text
➤ Year = 2004
➤ Year level = Year 1
➤ Class = All
► To Print this screen, click on the Print Report link.
► If multiple years are selected, you will see a <Previous Year | Next Year> link to
enable you to move between years.
►.For schools with a large number of students, it is possible to rotate the axis of the
graph, giving a bar chart rather than a column graph.
School Literacy Reports – User Manual
Page 5
Catholic Education Commission of Victoria
Literacy Post-Test Scores
The Literacy Post-Test Scores Selection screen below enables you to select different
reports about Post-Test Scores.
Data should exist for each of the different types of tests across all years for CLaSS
schools and in each of the three Year Levels P–2.
For non-CLaSS schools, data will only be displayed for a year level where a school has
submitted data.
1. Test
Click the type of test
you want to view.
(Only one at a time
can be selected.)
Demonstration Primary School
2. Year
Click the year you
want to view.
(Multiple years can
be selected OR
choose the ALL
4. Class
Click on the arrow to
see the options listed.
a) Either select All to
see all students at
your school,
OR
b) select a class at
your school.
6. Generate Report
Once you have made your
selections, click on the
Generate Report button to
see your school’s PostTest Scores Report.
School Literacy Reports – User Manual
3. Year Level
Click the Year Level
you want to view.
(Only one at a time
can be selected.)
5. Graph
Tick the Swap X/Y
axis to change the
Report from a Column
graph to a Bar graph.
Page 6
Catholic Education Commission of Victoria
Literacy Post Test Report
Demonstration Primary School
The Report above includes a column graph and frequency table that will be generated
after you have made your selection on the Post-Test Selection screen.
The vertical axis displays the number of students with scores, while the horizontal axis
displays the actual scores.
► To generate this graph, you would need to have selected the following options on the
Post-Test Scores Selection screen:
➤ Test = Text
➤ Year = 2004
➤ Year level = Year 1
➤ Class = All
► To Print this graph, click on the Print Report link.
► If multiple years are selected, you will see a <Previous Year | Next Year> link to
enable you to move between years.
► For schools with a large number of students, it is possible to rotate the axis of the
graph, giving a bar chart rather than a column graph.
School Literacy Reports – User Manual
Page 7
Catholic Education Commission of Victoria
Literacy Pre and Post Test Scores
The Literacy Pre & Post-Test Scores Selection screen below enables you to select
different reports about Pre and Post-Test scores.
Data should exist for each of the different types of tests across all years for CLaSS
schools and in each of the three Year Levels.
For non-CLaSS schools, data will only be displayed for a year level where a school has
submitted data.
Data will only be displayed for those students who have both Pre and Post Test scores
for a given test.
1. Test
Click the type of test
you want to view.
(Only one type at a
time can be
selected.)
Demonstration Primary School
2. Year
Select any year.
(Multiple years can
be selected OR
choose the ALL
option.)
4. Class
Click on the arrow to
see the options listed.
a) Either select All to
see all students at
your school,
OR
b) select a class at
your school.
6. Generate Report
Once you have made your
selections, click on the
Generate Report button to
view the report.
School Literacy Reports – User Manual
3. Year Level
Click the Year Level
you want to view.
(Only one at a time
can be selected.)
5. Graph
Tick the Swap X/Y
axis to change the
Report from a
Column graph to a
Bar graph
Page 8
Catholic Education Commission of Victoria
Literacy Pre and Post Test Report
Demonstration Primary School
The Report above includes a column graph and frequency table that will be generated
after you have made your selection on the Pre and Post-Test Selection screen.
The vertical axis displays the number of students with scores, while the horizontal axis
displays the actual scores.
► To generate this graph, you would need to have selected the following options on the
Pre and Post-Test Scores Selection screen:
➤ Test = Text
➤ Year = 2004
➤ Year level = Year 1
➤ Class = All
► To Print this graph, click on the Print Report link in the top right-hand corner of the
screen.
► If multiple years are selected, you will see a <Previous Year | Next Year> link to
enable you to move between years.
► For schools with a large number of students, it is possible to rotate the axis of the
graph, giving a bar chart rather than a column graph.
School Literacy Reports – User Manual
Page 9
Catholic Education Commission of Victoria
Literacy Scores
The Literacy Scores Selection screen below enables you to select different reports
about Literacy Scores. The Literacy Score is calculated by weighting the results on each
of the literacy tests and provides a summary of all the tests used. You will be able to
view separate graphs for Pre and Post-Test scores.
Data should exist for each of the different types of tests across all years for CLaSS
schools and in each of the three Year Levels.
For non-CLaSS schools, data will only be displayed for a year level where a school has
submitted data.
Data will only be displayed for those students who have both Pre and Post-Test scores
for a given test.
NOTE: You are able to choose one Report at a time - either a Pre-Test Report OR a
Post-Test Report.
1. Administration
Select either PreTest OR Post-Test.
(Only one at a time
can be selected.)
Demonstration Primary School
2. Year
Select any year.
(Multiple years can
be selected OR the
ALL option.)
3. Year Level
Click the Year Level
you want to view.
(Only one at a time
can be selected.)
4. Class
Click on the arrow to
see the options listed.
a) Either select All to
see all students at
your school,
OR
b) select a class at
your school.
5. Generate Report
Once you have made
your selections, click on
the Generate Report
button to see the report.
School Literacy Reports – User Manual
Page 10
Catholic Education Commission of Victoria
Literacy Scores Report
Demonstration Primary School
The column graph Report will display either the Pre-Test or the Post-Test Literacy
Scores depending on which one you chose under Administration on the Literacy Scores
Selection screen.
The vertical axis displays the number of students with scores, while the horizontal axis
displays the actual scores.
► To generate this graph, you would need to have selected the following options on the
Literacy Scores Selection screen:
➤ Administration = Pre-Test
➤ Year = 2004
➤ Year level = Year 1
➤ Class = All
► To Print this graph, click on the Print Report link.
► After viewing the Pre-Test report, view the Post-Test report where you would see the
progression for the year.
► If multiple years are selected, you will see a <Previous Year | Next Year> link to
enable you to move between years.
► For schools with a large number of students, it is possible to rotate the axis of the
graph, giving a bar chart rather than a column graph.
► NOTE: Data will only be shown for those students with both Pre and Post-Test
scores.
School Literacy Reports – User Manual
Page 11
Catholic Education Commission of Victoria
Achievement Profiles
There are 2 types of reports available with this data:
Class Profile –a table of results for all students in the year level or a class group
Student Profile –a table of results for an individual student over time.
Class Profile
The Achievement Profiles Selection screen below enables you to generate a Pre-Test
or a Post-Test Class Profile for any of the Tests available.
1. Year
Select any year.
(Only one year at a
time can be
selected.)
Demonstration Primary School
2. Year Level
Select the Year
Level you want to
view. (Only one at a
time can be
selected.)
3. Test
Select either PreTest OR Post-Test.
6. Generate Report
Once you have made your
selections, click on the
Generate Report button to
see the report.
4. Select All
Select any test
type, OR
click on the Select
All link to select all
test types, OR click
on Clear All to
deselect all test
types.
5. Class
Click on the arrow
to see the options
listed.
a) Either select All
to see all
students at your
school,
OR
b) select a class at
your school.
Data should exist for each of the different types of tests across all years for CLaSS
schools and in each of the three Year Levels.
For non-CLaSS schools, data will only be displayed for a year level where a school has
submitted some data.
Data will only be displayed for those students who have both Pre and Post Test scores
for a given test.
NOTE:
As Peters spelling is applicable for Year 2 Level only, if it is selected for Prep
or Year 1, -1 will be displayed in the report table.
School Literacy Reports – User Manual
Page 12
Catholic Education Commission of Victoria
Achievement Profiles – Class Profile
Class Profile Report
The Class Profile Report will display either the Pre-Test or the Post-Test data as a
table of results for all students in the selected year level or class group.
Demonstration Primary School
This is a new report that enables a teacher to consider patterns of performance in any of
the tests. Making connections across tests is critical in identifying needs of students.
► To generate this table, you would need to have selected the following options on the
Achievement Profiles Selection screen:
➤ Year = 2004
➤ Year level = Year 1
➤ Test = Pre-Test AND Text, Letter ID, CAP, Word, Burt, Write Vocab, HRSW,
ROL & Peters
➤ Class = All
► Each column in the table can be sorted into ascending or descending order.
Click once on any column name – Student - to sort into ascending order (eg. A–Z)
Click twice on any column name – Text – to sort into descending order (eg. 28–0)
► To Print this graph, click on the Print Report link.
School Literacy Reports – User Manual
Page 13
Catholic Education Commission of Victoria
Achievement Profiles
The screen below demonstrates how to generate the alternative report available in
Achievement Profiles – a Student Profile.
Student Profile
The Achievement Profiles Selection screen makes it possible to generate a Pre-Test
or a Post-Test Student Profile for any of the Tests.
1. Year
Select any year.
(Only one year at a
time can be
selected.)
Demonstration Primary School
2. Year Level
Click the Year Level
you want to view.
(Only one at a time
can be selected.)
3. Test
a) Select either
Pre-Test OR
Post-Test.
b) Then select the
tests you want
included.
(Multiple
selections are
possible here.)
3R
Kerry
6. Generate Report
Once you have made your
selections, click on the
Generate Report button to see
the report.
4. Select All
Select any test type,
OR
click on the Select All
link to select all test
types, OR click on
Clear All to deselect
all test types.
5. Class & Student
a) First, click on the
arrow to see
the options
listed, &
select the
class name
required.
b) The screen will
refresh
automatically.
c) Then, click on the
drop-down arrow
to select the
student required.
Data should exist for each of the different types of tests across all years for CLaSS
schools and in each of the three Year Levels.
For non-CLaSS schools, data will only be displayed for a year level where a school has
submitted some data.
Data will only be displayed for those students who have both Pre and Post Test scores
for a given test.
School Literacy Reports – User Manual
Page 14
Catholic Education Commission of Victoria
Achievement Profiles – Student Profile
Student Profile Report
The Student Profile Report will display both the Pre-Test and Post-Test data as a table
of results over time for the individual student selected. All available pre- and post- test
data for that student will be included in the results.
Demonstration Primary School
Kerry
16.06.97
This is a new report that enables a teacher to consider an individual student’s pattern of
performance across any of the tests.
► To generate this table, you would need to have selected the following options on the
Achievement Profiles Selection screen:
➤ Year = 2004
➤ Year level = Year 1
➤ Test = Pre-Test AND Text, Letter ID, CAP, Word, Burt, Write Vocab, HRSW,
ROL & Peters
➤ Class = 3R
➤ Student = Kerry
► After viewing the Pre-Test report, view the Post-Test report where you would see the
progression for the year.
School Literacy Reports – User Manual
Page 15
Catholic Education Commission of Victoria
Text Levels (Like Schools)
There are 2 types of reports available in this section of the site:
• Like Schools - single year
• Like Schools - over time
Both reports are based on the Post-Test scores and on Text level. Like school
categories are based on Educational Maintenance Allowance (EMA), so that schools
within the same group have similar numbers of students receiving EMA funding.
There are 3 categories of EMA funding:
Group
% of Students receiving
EMA funding
1
<12%
2
12–25%
3
>25%
Text Level (Like Schools) - single year
The screen below demonstrates how to generate the first report available: Text Level
(Like Schools) for a single year.
1. Year
Click the year that
you want to view.
(Only one at a time
can be selected.)
Demonstration Primary School
2. Year Level
Click the Year Level
you want to view.
(Only one at a time
can be selected.)
3. Generate Report
Once you have made your
selections, click on the
Generate Report button
to see the report.
School Literacy Reports – User Manual
Page 16
Catholic Education Commission of Victoria
Text Levels (Like Schools)
The Text Level (Like Schools) Report for a single year will display a comparative table
of results:
Demonstration Primary School
2
Top Table
The first row shows the percentage of students for the selected year level at the
school in the indicated score ranges. (Only students with pre and post-test scores
are counted.)
The second row indicates the same frequencies for all students in the same category
of ‘Like School’ for year and year level.
The third row displays the same frequencies for all students in all schools for year
and year level.
Bottom Table
The same calculations are repeated for the bottom table but with different score
ranges, namely 0, 1-28, 5-28, 15-28, 20-28, 26-28, and >=28.
In the second table, the columns are shaded for Minimum (yellow) and Target
(green) for that Year Level.
School Literacy Reports – User Manual
Page 17
Catholic Education Commission of Victoria
Text Levels (Like Schools)
Text Level (Like Schools) - over time
This report is also based on the Post-Test scores and only on Text level. It also
compares schools in similar EMA categories.
Only students with valid pre and post-test scores will be included in the results displayed
in the Report.
► The Text Level (Like Schools) over time Report is generated by selecting the ALL
option under Year.
1. Year
Demonstration Primary School
Select the All option.
2. Year Level
Click the Year Level
you want to view.
(Only one at a time
can be selected.)
3. Generate Report
Once you have made your
selections, click on the
Generate Report button to see
the report.
NOTE: the data for Year 1 level is the most reliable.
School Literacy Reports – User Manual
Page 18
Catholic Education Commission of Victoria
Text Levels (Like Schools)
The Text Level (Like Schools) Report over time will display a table of results in 3
sections: 1 - Our School, 2 - Like Schools and 3 - All Schools.
Demonstration Primary School
This Like Schools Over Time Report demonstrates ‘a like school report’ where All
years was selected. It compares the Post-Test text level results with schools that fall
within the same EMA category, and in the same time period.
Results are displayed in the following score range 0, 1-28, 5-28, 15-28, 20-28, 26-28,
and >=28
The first section Our School presents the range of frequencies for all students at this
school across the years displayed.
The second section Like Schools presents the same frequencies for all students in the
same EMA category across the years displayed for the CECV.
The All School section presents the same frequencies for all students in all schools
across the years displayed.
The columns are again shaded for Minimum (yellow) and Target (green) Standards for
the Year Levels as shown in the legend below:
Year Level
Minimum Standard
Target Standard
Prep
Level 1
Level 5
Year 1
Level 15
Level 20
Year 2
Level 26
Level 28
School Literacy Reports – User Manual
Page 19
Catholic Education Commission of Victoria
Value Added
The Value Added Report displays directly from the Literacy Report Menu screen,
without needing any options selected.
‘To estimate the value added for Literacy Advance schools, an overall measure of
Literacy derived from adding together post-test results on the Burt Word Reading Test,
Text Level, and the various components of the Observation Survey, was adjusted
statistically for student background characteristics Gender, NESB, EMA, Aboriginal and
Torres Strait Islander, and Special Education and student performance on the same pretest measures.
Great care needs to be taken in interpreting the results, since they can be affected by
factors that do not actually reflect the effectiveness of the school. These include variables
that were not measured, such as extended teacher absence or critical events affecting
student performance. In addition, if students pre-tests results were over-stated, or
students post-test results were somewhat under-stated, the value-added estimate will be
low and understate the value-added of the school. Conversely, if students pre-test results
were under-stated or the post-test results were over-stated, the value-added estimate will
be high and overstate the value-added of the school.’
Demonstration Primary School
The Value Added table displays all years from 1998 to the current year and each of the
three Year Levels P-2, where there is data available.
The symbols in the body of the table represent:
Value
Meaning
–-
Below Average-
0
Average
+
Above average+
The table will display Value Added estimates for all schools for Year 1 and will include
Year P for CLaSS schools only.
School Literacy Reports – User Manual
Page 20
Catholic Education Commission of Victoria
Reading Recovery
The Reading Recovery link will take you to the Reading Recovery Menu screen shown
below. These are all new reports.
► To view any of the five Reading Recovery Reports, click on the appropriate blue link
for that report.
► These Reading Recovery reports are designed to inform discussions between the
Literacy Coordinator, Literacy Team and Reading Recovery teachers.
School Literacy Reports – User Manual
Page 21
Catholic Education Commission of Victoria
Reading Recovery Tentative Selection List Report
This Report is generated from the student data file at the beginning of each year. It can
assist with the prompt selection of students needing Reading Recovery, so that teachers
can begin instruction in the first week of the school year.
Tentative Selection List
The table displays a list of tentative selections based on the Post-Test scores which the
current Year 1 students achieved in the previous year (Prep). The scores are those
recorded for Text level. The students with scores in the lowest 20% of the class are
listed.
In some instances the percentage will be greater than 20% as all students in the class
reading at the same text level as the 20% sub–group are included in the list. (If the
maximum text level scored by the lowest 20% is 8 then all other students operating at
Text level 8 or below will be included on the list.)
Still-on-Program List
Year 2 students who were still on Reading Recovery when the post-test period occurs
are listed in the second table.
Demonstration Primary School
School Literacy Reports – User Manual
Page 22
Catholic Education Commission of Victoria
Reading Recovery Provision Report
This Report provides a summary of the school’s Reading Recovery Provision at a
specified point of time in the current year.
Demonstration Primary School
School Literacy Reports – User Manual
Page 23
Catholic Education Commission of Victoria
Reading Recovery Student Profile Report
This Report provides information about the Reading Recovery Students’ Profile of entry
and exit scores across all types of tests.
It would be updated after each CECV data collection period.
Demonstration Primary School
School Literacy Reports – User Manual
Page 24
Catholic Education Commission of Victoria
Reading Recovery Statewide Comparisons Report
This Report provides a comparison of a school’s Reading Recovery program against all
other Catholic schools in the year selected.
Its purpose is to enable a school to compare key indicators of their program with those in
all other schools in a given year.
Demonstration Primary School
► Click the drop down arrow and select the Year that you want to view.
School Literacy Reports – User Manual
Page 25
Catholic Education Commission of Victoria
Reading Recovery Over Time Report
This Report summarises key information about a school’s Reading Recovery program
over the time period displayed.
Demonstration Primary School
The first two rows of the table provides information details about the number of students
at the school participating in Reading Recovery.
The second section of the table provides a program implementation summary.
The third section provides an end-of-program summary. The figures contained in this
section should total 100%. The number of students in Reading Recovery is shown as a
percentage of the total number of students in Year 1 and 2.
The final yellow section of the table provides information on student referrals.
School Literacy Reports – User Manual
Page 26