1
4000189C.qxp
10/21/2004
7:50 AM
Page CVR1
microarray systems
VersArray Analyzer 5.0 Image Analysis Software
®
User Manual
4000189C.qxp
10/21/2004
7:50 AM
Page a
VersArray™ Analyzer 5.0 Software
User’s Guide
The VersArray Analyzer Software is for research purposes only. It is not intended or
approved to be used for diagnostic purposes.
4000189C.qxp
10/21/2004
7:50 AM
Page b
Copyright Notice
©2004 Developed for Bio-Rad Laboratories, Inc. by BioDiscovery, Inc. All Rights
Reserved.
Printed in the United States of America.
The software described in this book is furnished under a license agreement and may
be used only in accordance with the terms of the agreement.
Every effort has been made to ensure the accuracy of this manual. However, Bio-Rad
Laboratories makes no warranties with respect to this documentation and disclaims
any implied warranties of merchantability and fitness for a particular purpose. Bio-Rad
shall not be liable for any errors or for any incidental or consequential damages in
connection with the furnishing, performance, or use of this manual or the examples
herein. The information within this manual is subject to change.
Notice
No part of this publication may be reproduced or transmitted in any form or by any
means, electronic or mechanical, including photocopy, recording, or any information
storage or retrieval system, without written permission in writing from Bio-Rad.
VersArray is a trademark of Bio-Rad Laboratories. All other trademarks and registered
trademarks are of their respective companies.
Limitations and Liability:
Bio-Rad is not responsible for the misinterpretation of results obtained by following the
instructions in this guide. As with all scientific studies, we recommend that you repeat
your experiment at least once before making any significant conclusions for presentation or publication.
Copyright © 2002 By Bio-Rad Laboratories. All rights reserved.
Bio-Rad Listens
The staff at Bio-Rad is receptive to your suggestions. Many of the new features are
enhancements in this version of VersArray™ Analyzer 5.0 system software and are a
direct result of conversations with our customers. Please let us know what you would
like to see in the next version of VersArray Analyzer software by faxing, calling, or
e-mailing our Technical Services staff.
4000189C.qxp
10/21/2004
7:50 AM
Page c
Contents
Quick Start Guide
Part 1: Lab Users Guide....................................................................................1
1.1
1.2
1.3
1.4
1.5
1.6
1.7
VersArray Analyzer 5.0 Software Main Window Overview ......................................1
Control Tabs............................................................................................................6
1.2.1
Main Tab ..................................................................................................6
1.2.2
Preview Tab ............................................................................................17
Image Display Panel ............................................................................................25
VersArray Analzyer 5.0 Software Parameter Settings Window ..............................32
VersArray Analyzer 5.0 Software Wizard ..............................................................37
Reviewing Results ................................................................................................38
1.6.1
The Snapshot File (sst file) ....................................................................38
1.6.2
Loading Results to Review......................................................................39
VersArray Analyzer 5.0 Software Tools..................................................................39
1.7.1
Auto Alignment Tool ................................................................................39
1.7.2
Auto Grid Placement Tool........................................................................39
1.7.3
Save Display Image Tool ........................................................................40
1.7.4
Zoom Tool ..............................................................................................40
1.7.5
Scroll Tool ..............................................................................................41
1.7.6
Ruler Tool................................................................................................41
1.7.7
Intensity Tool ..........................................................................................41
1.7.8
Flagging Tool ..........................................................................................41
1.7.9
Undo and Redo Tools ............................................................................42
1.7.10 Grid Tools ..............................................................................................43
Part 2: VersArray Analyzer 5.0 Software Tutorials .........................................45
2.1
2.2
Basic Analysis ......................................................................................................45
Premanufactured Array Analysis ..........................................................................52
Part 3: Licensing .............................................................................................56
Part 4: Appendices..........................................................................................65
4.1
4.2
4.3
File Specifications ................................................................................................65
4.1.1
Gene ID File ..........................................................................................65
4.1.2
Output File ..............................................................................................66
4.1.3
ConFIGuration File ................................................................................69
Technical Support ................................................................................................71
Warranty Information ............................................................................................71
4000189C.qxp
10/21/2004
7:50 AM
Page i
Introduction to VersArray Analyzer 5.0 Software
VersArray Analyzer 5.0 Software is Bio-Rad Laboratories solution for a fast and accurate
microarray image analysis software system. With VersArray Analyzer 5.0 Software,
researchers can generate quantified data within seconds or minutes while at the same
time generating extensive quality control information.
VersArray Analyzer 5.0 Software performs microarray image analysis for researchers.
Microarray image analysis is used to quantify the relative expression levels that exist
within a microarray scan. VersArray Analyzer 5.0 Software is used in the post
hybridization and scanning step of the microarray process. The results of VersArray
Analyzer 5.0 are quantified expression values that are saved to a text file. These results
can then be used in a data analysis package, such as Bio-Rad's GeneGazer™
Software for further analysis.
4000189C.qxp
10/21/2004
7:50 AM
Page ii
Quick Start Guide
VersArray Analyzer 5.0 Software is designed to be the fasted and easiest software
solution for quantification of microarray images. The description below outlines the
essential steps required to setup VersArray Analyzer 5.0 Software. For additional
information, please view the remaining sections of this user manual.
To setup VersArray Analyzer 5.0 Software:
1.
Install VersArray Analyzer 5.0 Software
2.
Submit registration information and request a license from Bio-Rad
3.
Start VersArray Analyzer 5.0 Software
4.
Load an image
5.
Establish Settings
6.
Perform grid placement
7.
Quantify the Image
4000189C.qxp
10/21/2004
7:50 AM
Page 1
Part 1: Lab Users Guide
Part 1 – Lab Users Guide
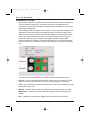
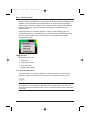
1.1 VersArray Analyzer 5.0 Software Main Window Overview
The VersArray Analyzer 5.0 Software Main window is the primary program interface. It
serves as the focal point of all work within VersArray Analyzer 5.0. You use this window
to load images, place grids, produce quantified data and review results. This chapter
identifies the components of this window and explains how each area fits into the array
analysis and data extraction process.
•
Menu Bar – Located along the top of the window. Click on one of the menus (File, Grid,
Spot, Tools, or Help) to view the program commands available on that menu. The
following options are available from the Menu Bar.
Page 1
4000189C.qxp
10/21/2004
7:50 AM
Page 2
Part 1: Lab Users Guide
File
•
Load Images – Allows selection of images to be loaded from the file system.
•
Remove Selected Image – The image which is selected, or highlighted, from within
the images panel is removed, or unloaded, from analysis. Multiple images can be
removed by highlighting several images then selecting Remove Selected Images.
•
Review Results – Allows selection of a snapshot, or sst file, which will allow for the
results of previous analysis to be reviewed or reexamined. Simply browse to and select
the desired sst file and VersArray Analyzer 5.0 Software will load previously created
settings, data, segmentation and flagging information.
•
Batch Editor – Allows creation of batches to automatically process data. Selecting this
option will open the Batch Editor Window allowing for entries to be added to a batch.
•
Save Display Image – Allows a 24-bit tiff image of the composite overlay to be created
and saved to the file system. The image can be useful in post processing or generation
of publication.
•
Settings – The Settings option opens the VersArray Analyzer 5.0 Software Parameter
Settings Window. This window and the tabs within the window contain all the parameters
within VersArray Analyzer 5.0 Software for Quality Measures, Spot Finding and Alert
Logging.
•
Exit – Closes the VersArray Analyzer 5.0 Software program.
Grid
•
Load Grid – Displays the Load Grid dialog box. Use this interface to select and open a
previously saved grid (.grd) file.
•
Save Grid – Displays the Save Grid dialog box. Use this interface to save a grid.
•
Clear Grid – Removes all displayed grids from the Image Display Panel.
•
Load Gene IDs – Displays the Load Gene ID File dialog box. Use this interface to
select and open a gene ID (.txt) file.
•
Clear Gene Ids – Displays the Confirm Deletion dialog box. Use this interface to verify
that you want to remove the displayed gene ID information.
•
Load Template – Displays the Load Template dialog box. Use this interface to select
and open a template (.tpl) file. A template is a grid file, which contains gene ID
information. Gal files are loaded through this option.
•
Save Template – Displays the Save Template dialog box. Use this interface to save a
template.
Spot
•
Adjust Metagrid – Allows you to select and move an entire metagrid.
Page 2
4000189C.qxp
10/21/2004
7:50 AM
Page 3
•
Part 1: Lab Users Guide
Adjust Subgrid – Allows you to select and move an individual portion of the metagrid
(subgrid).
•
Adjust Spot – Allows you to select and move one spot in a metagrid.
•
Lasso Adjust – Allows you to select and move a specific (free form) area of the
metagrid.
•
Rectangle Adjust – Allows you to select and move a specific rectangular area of the
metagrid.
•
Auto Adjust Spots – Tells VersArray Analyzer 5.0 Software to automatically adjust
each spot to better align them with the corresponding image.
•
Wrangle – Enforces new local spot flexibility parameters. Essentially, reduces the distance used in spot finding without requiring spot finding to be reapplied.
Tools Menu
•
Zoom – Turns the cursor into a magnifying glass. Use this tool to adjust the on-screen
display size of images.
•
Scroll – Turns the cursor into a hand. Use this tool to scroll all images and grids at the
same time.
•
Undo – Cancels the last executed command. For example, if you moved a spot, you
could select Tools > Undo to cancel this action and, in effect, deselect the spot.
•
Redo – Restores the last canceled command. For example, if you used the Undo command to cancel a spot movement, you could select Tools > Redo to move the spot
again.
•
Translate Images – Turns the cursor into a cross with arrows. Use this tool to move
selected images.
•
Rotate Images –Turns the cursor into a circle. Use this tool to move selected images in
a circular path based on a manually set anchor point in the image.
•
Ruler – Turns the cursor into a small ruler. Use this tool to measure the size of spots or
distances between them.
•
Image Intensities – Turns the cursor into a small light bulb. Use this tool to measure
the intensity of spots.
•
Tag Spots – Turns the cursor into the letter X. Use this tool to manually flag spots.
Right click with this tool to see a list of available flagging options.
Help
•
VersArray Analyzer 5.0 Software Help – Displays the VersArray Analyzer 5.0
Software Online Help documentation.
Page 3
4000189C.qxp
10/21/2004
7:50 AM
Page 4
Part 1: Lab Users Guide
• Wizard On/Off – Turns on and off the VersArray Analyzer 5.0 Software wizard. The wizard provides guidance on the proper steps to be performed within VersArray Analyzer
5.0 Software.
•
Change Skins – launches a dialog for choosing between different skins for VersArray
Analyzer 5.0 Software interface (using skinlf). When a specific skin is selected, the
change takes effect next time you launch VersArray Analyzer 5.0 Software.
•
Support Center – launches Web Browser with customer support page for VersArray
Analyzer. Through that web-site you can access latest technical documentation,
request a new feature, obtain sample images or templates etc.
•
About VersArray Analyzer 5.0 Software – Displays the About VersArray Analyzer 5.0
Software dialog box. This interface contains information (license number, mode, etc.)
about your copy of VersArray Analyzer 5.0 Software.
•
Toolbar – Located directly beneath the menu bar. This region is composed of multiple
buttons that provide a one-click method for executing program commands.
•
Context Menu – Context Menus are created by right clicking on the various elements
within the VersArray Analyzer 5.0 Software graphical user interface (GUI). Not all
elements support context menus. Elements which do support this feature are listed
below:
Images Panel
Grid Panel
Image Display Panel
Gene ID Selector
Flagging Tool
Page 4
4000189C.qxp
10/21/2004
7:50 AM
Page 5
Part 1: Lab Users Guide
•
Control Tabs – Located to the left of the window. The control tabs provide information
immediately relevant to the images being quantified. Please see section 1.2 for
additional information on the control tabs.
•
Image Display Panel – Located to the right of the window. This panel displays loaded
images and is where grid placement takes place.
Page 5
4000189C.qxp
10/21/2004
7:50 AM
Page 6
Part 1: Lab Users Guide
• Status Bar – Located at the bottom of the window. The status bar provides feedback to
the user regarding loading and handling of images. Also, other tools such as the Ruler
and Image Intensity display their information here.
1.2 Control Tabs
Located along the left of the main VersArray Analyzer 5.0 Software window are two
tabs containing essential information about the analysis.
1.2.1 Main Tab
The Main Tab is used to perform the essential steps of microarray image analysis,
loading the image(s) to be processed and placing a grid on the image and its corresponding structure. The following Panels are contained within the Main Tab.
Images Panel
The images panel displays the names of images currently loaded within VersArray
Analyzer 5.0 Software. Each loaded image is listed here as well as its corresponding
Composite color. The Composite Color is the color the image is displayed as when
seen within the Composite Tab of the Main Image Panel.
Page 6
4000189C.qxp
10/21/2004
7:50 AM
Page 7
Part 1: Lab Users Guide
The Images Panel fully supports context menus and as a result provides the following
menu choices:
•
Load Images – Allows browsing to and selection of images from the file system.
•
Remove Selected Images – The images which are selected, or highlighted, from
within the images panel are removed, or unloaded, from analysis.
•
Select Color – Select the color to be used for the select image when seen under the
Composite Tab. The default color for the first two images are red and green; however,
these can be changed to any color desired. Changing the colors here in no way affects
the resulting quantified values.
•
Invert Values – This will invert all pixel intensities within the selected image. When the
image is loaded, VersArray Analyzer 5.0 Software automatically determines which end
of the grayscale spectrum is the high value. This information is typically available within
the image file itself. However, in rare cases, this information is not present within the file
and as a result, VersArray Analyzer 5.0 Software requires this information to be manually
set. Should you determine the expected values for the signal and the background
measurement to be opposite to what is expected, selecting Invert Values will solve the
problem.
•
Hide – The selected image will no longer be visible under the Composite Tab. While not
visible, if quantified, data will be generated for the image.
•
Rotate – Rotates the image 90, 180 or 270 degrees around the top, left of the image.
Page 7
4000189C.qxp
10/21/2004
7:50 AM
Page 8
Part 1: Lab Users Guide
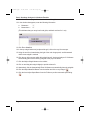
How to Load an Image(s)
The following steps describe the process of loading Images within VersArray Analyzer
5.0 Software:
From the menu bar, select File followed by Load Images. Alternatively, click the first
icon on the toolbar or right click on the Images Panel and select Load Images.
From the Load Images dialog that appears, browse to and select the desired file.
Multiple files may be selected by holding the <shift> or <ctr> keys and left clicking on
the image name.
Note: VersArray Analyzer 5.0 Software supports the following image file formats:
Tiff – The file extension is tif
MD Gel – The file extension is gel
Fuji Bas – This is a two file format with one file ending in inf and the other ending in
either img or bas.
•
Reverse Display Colors – Mark this check box to reverse the displayed colors of all
open images. Activating this feature has no affect on the Composite tab. Changing the
appearance of an image does not affect the pixel intensity of your original data. This
tool just makes it easier to see dim spots in an image.
Display Control
The Display Control allows adjustment of how the images are displayed. By moving the
triangle located at the top and bottom the display control, the image can be lighted and
darkened. The tool is designed solely to enhance viewing of the image and does not
affect the quantified values generated by VersArray Analyzer 5.0 Software. When
adjustments are made to the Display Control, these are applied only to the Image(s)
selected within the Images Panel.
Page 8
4000189C.qxp
10/21/2004
7:50 AM
Page 9
Part 1: Lab Users Guide
The specific elements of the Display Control are and perform the following:
•
Top Triangle – This sets the minimum intensity to be displayed.
•
Middle Triangle – Allows the rate of change of pixel intensities to be specified by
changing the curvature of display curve.
•
Bottom Triangle – This sets the maximum intensity to be displayed.
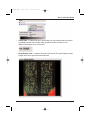
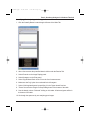
Grid Panel
The Grid Panel lists all fields that have been created and placed on the image.
Typically, only a single field will be required; however, depending on the design of the
array being quantified, several fields may be required. As a new field is created, it is
added to the list.
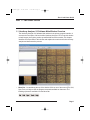
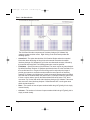
Before explaining how and why to create a Field, let us explore some of the definitions
and structures of a field. A field is the largest design element within a slide. A field
typically consists of the arraying done by a single print head on the slide. For example,
if the arrayer has a print head with 8 pins in a 2 x 4 conFIGuration, the region of the
slide containing the resulting printing is a field. The metagrid in this example would be
2 x 4 as the resulting printing would generate 2 rows by 4 columns of subgrids. The
subgrid is not defined here, but would be whatever rows and columns of spots are
printed by a single pin, 12 x 12 for example. The accompanying diagram demonstrates
the relationship between the three levels of structure.
Page 9
4000189C.qxp
10/21/2004
7:50 AM
Page 10
Part 1: Lab Users Guide
The Grid Panel like other components of VersArray Analyzer 5.0 Software fully
supports context sensitive menus. Right clicking on the Grid Panel provides the
following options:
•
Create Grid – The option launched the Grid Creation Window where the essential
information about the design of the grid must be entered. Remember that within
VersArray Analyzer 5.0 Software the grid is the most elemental structure, followed by
the metered and finally field. The following parameters must be specified:
•
Field Name – Specify the name of the field here. The name may be any name desired.
By default VersArray Analyzer 5.0 Software provides the letter ‘A’ to the first fields, ‘B’ to
the next field and so on. If a gene ID file is being used in conjunction the image to
provide gene names or accession numbers within the text output file of VersArray
Analyzer 5.0 Software, the fields name, if used, must match between what is specified
here and what is contained within the Gene ID file. For example, within the gene ID file,
if I have a column where I specify the field and that field has the name “Top”, then I
must enter “Top” for the field name within VersArray Analyzer 5.0 Software. If the name
does not match, then VersArray Analyzer 5.0 Software will NOT use the gene name
within the data output file.
•
Rows – The number of rows of spots contained within the grid. Typically, this is simply
counted visually.
•
Columns – The number of columns of spots contained within the grid. Typically, this is
simply counted visually.
Page 10
4000189C.qxp
•
10/21/2004
7:50 AM
Page 11
Part 1: Lab Users Guide
Min Diameter – This specifies the minimum expected diameter of the spot and is
measured in pixels. The size of the spot can best be determined by use of the Ruler
Tool. Due to the variety of array types and the variability of individual arrays there is no
set procedure for determining the minimum diameter here. The most common rule of
thumb is to specify the size of approximately the 10 % of the smallest spots of the array.
Depending on the type of array, if the spots are highly uniform, then the minimum
diameter specified here will be close or equal to the maximum diameter specified next.
•
Max Diameter – Similar to the Min Diameter specified above, this parameter reflects
the maximum anticipated spot size measured in pixels. As with the minimum diameter
this value can be approximated by using the top 10% of large spots and measuring the
sizes with the Ruler Tool.
•
Spot Orientation – Spot Orientation reflects how each row is located relative to the
row that preceded it. The selections here reflect how the row above the subsequent row
is positioned. While rectangular is the most common, selections possible include:
Rectangular
Staggered Left Grid
Staggered Right rid
•
Create MetaGrid – This selection allows subgrids to be used to form a metagrid
structure. Before creating a metagrid, at least one subgrid must be created. To create a
metagrid, first highlight the desired subgrid, then select “Create Metagrid”. The Create
MetaGrid Window appears and requires the following parameters to be specified.
•
Metarows – The number of rows of subgrids.
•
Metacolumns – The number of columns of subgrids
•
Delete Selected Fields – The currently highlighted field will be removed.
•
Clear Grid – All fields that have been created will be removed.
•
Convert to single Subgrid – If a metagrid structure exists and has been used to “grid”
the image, selecting this option will convert the metagrid structure to a simpler subgrid
structure. For example, if we have a 2 x 2 meta grid with 15 x 10 subgrids, after selecting
this conversion, the resulting subgrid size will be 30 x 10. During this conversion nothing
changes except for the how the individual spot location are represented. This feature is
option and may used if required to construct a multi-level metagrids for example.
•
Properties – This option opens a window, which displays the parameters for the
currently selected field. Only certain options can be changed while the remainder
required the grid to be deleted then recreated a new. The following parameters are
displayed within the properties window:
•
Field – The name of the field. This value may be changed.
•
Metarows – The number of metarows previously specified.
Page 11
4000189C.qxp
10/21/2004
7:50 AM
Page 12
Part 1: Lab Users Guide
• Metacolumns – The number of metacolumns previously specified.
•
Rows – The number of rows of spots within the subgrid that was previously specified.
•
Columns – The number of columns of spots within the subgrid that was previously
specified.
•
Min Diameter – The minimum expected diameter of the spots to be used during spot
finding. This value may be changed but the results will not be visible until spot finding
has been performed again.
•
Max Diameter – The maximum expected diameter of the spots to be used during spot
finding. This value may be changed but the results will not be visible until spot finding
has been performed again.
Page 12
4000189C.qxp
10/21/2004
7:50 AM
Page 13
Part 1: Lab Users Guide
How to create Grid
Perform the following steps to create a subgrid within VersArray Analyzer 5.0 Software:
1. Load the desired images into VersArray Analyzer 5.0 Software
2. Right click with the mouse on the Grid Panel and select Create Grid
3. Specify the parameters within the create grid window. If a Gene ID file is being
used then the field name must match the name of the field within the gene ID file.
The min and max diameter can be calculated with the Ruler Tool.
4. Click the Place Grid Button and click on the four corners of a subgrid. If you make a
mistake, right click with the mouse to remove the last placement.
5. Perform the following steps to create a metagrid within VersArray Analyzer 5.0
Software:
6. Click on and select the desired subgrid to use as a basis for the metagrid. This can
be done by left clicking on the grid within the Grid Panel.
7. Right click and select Create MetaGrid from the menu.
8. In the Metagrid Parameters Window, specify the number of rows and columns of
subgrids contained within the metagrid.
9. Click Place Metagrid and click on the top left spot in each of the corner subgrids.
Typically, this process will require four clicks, but never more.
Page 13
4000189C.qxp
10/21/2004
7:50 AM
Page 14
Part 1: Users Guide
How to Save a Grid
Once a grid has been created the following steps will save the grid for later use.
1. From the menu bar select Grid followed by Save Grid.
2. In the Save as Dialog browse to the location where you wish to save the grid file.
3. Specify a file name. VersArray Analyzer 5.0 Software will automatically add the .grd
file extension to the end of the name.
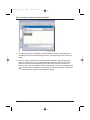
How to Load a Grid
To load a previously created grid, perform the following steps:
1. From the menu bar select Grid followed by Load Grid.
2. From the Load Grid Dialog that appears, browse to and select the desired grid file.
3. Click on one of the following radio buttons to select a grid placement method:
•
Place Manually – Select this option to set the location and size of the saved grid
yourself. This is useful when images have been scanned at different resolutions or the
overall position of the array shifted between scans. To place the grid manually, left-click
on the four corners of the entire array structure. The grid will then be resized and positioned based on this information.
•
Place in Saved Position – Select this option to place the grid in the identical position
of the original grid. Use this option if the size and resolution of the images has not
changed
Finally, click the Open Button to place the grid.
Gene ID
The Gene ID file allows you to track information about the genetic material spotted at
each location within the array. This information will be saved along with the quantified
values in the text output file and visualization tools.
If a Gene ID has been selected the name of the corresponding file is displayed here.
The Gene ID also supports right click context menus with the following options:
Page 14
4000189C.qxp
•
•
10/21/2004
7:50 AM
Page 15
Part 1: Lab Users Guide
Load Gene ID's – Selecting this option will open a window allowing for the selection of
the gene ID file to be used. Likewise, you may also select "Grid" from the File Menu
followed by "Load Gene IDs" to accomplish the same task. Note that while advantageous
for a number of reasons, loading a Gene ID file is not mandatory. Please see the section
of Gene IDs later within this manual for additional information on Gene IDs as well as
appropriate file format.
Clear Gene ID's – If a gene ID has already been selected, this option will remove the
selected file from use. Likewise, you may also select "Grid" from the File Menu followed
by "Clear Gene IDs" to accomplish the same task.
Template
You can load and save a template file that will contain both grid structure and
corresponding gene IDs. For this purpose you can use VersArray's serialized data
format *.tpl, or you can import and export the template using several well-known
formats.
•
GAL – tab-delimited text file containing location and structure of every subgrid (called
"Block" within this format) and gene IDs.
•
GEML (v 1.0) – XML standard representing a "pattern" that can not fully describe a grid
structure, but rather provides location and gene ID info for every spot.
•
MAGE-ML – the most complete XML format, imported/exported file will contain
DesignElement_package and ArrayDesign_package of MAGE standard. This format
can support multiple subgrids and metagrids.
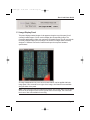
Map View Panel
The Map View provides a comprehensive and unabridged view of the image while indicating exactly where within the image the primary image display panel is zoomed to.
The Map View displays the entire image exactly as it appears along the main image
display's composite view. Any corrections to contrast or rotation will likewise be visible
within the Map Window. The Map View allows users with large arrays to more easily
scan the image for proper gridding and segmentation.
Page 15
4000189C.qxp
10/21/2004
7:50 AM
Page 16
Part 1: Lab Users Guide
The part of the image currently being displayed within the main image display is bound
by a yellow rectangle within the Map View. You may also zoom using the Map View by
left clicking and dragging with the mouse to select the desired region. To zoom
completely out and display the entire image within the main image panel, double right
click with the mouse.
Quantify
The act of quantification coverts the visual pixel intensities into numerical values to be
used later in expression analysis. The Quantify Button starts this computation within
VersArray Analyzer 5.0 Software and should be performed after all other parameters
have been set and the grid has been placed. The amount of time quantification takes is
directly proportional to the speed of the computer hardware. Once quantification is
completed, the Preview Tab becomes highlighted and the numerical values become
visible.
Additionally, after quantification is complete, an additional tab for each image becomes
available over the main image panel. This tab is the segmentation tab and displays the
segmentation, which has been performed across the entire image.
Page 16
4000189C.qxp
10/21/2004
7:50 AM
Page 17
Part 1: Lab Users Guide
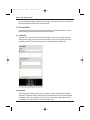
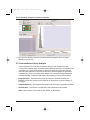
1.2.2 Preview Tab
The Preview Tab displays information about the image both prior to and after quantification.
Numerical values and segmentation can easily be viewed and reviewed to determine that
optimum settings are established.The Preview Tab is divided into two primary parts:
•
Segmentation Preview
•
Quantification Preview
Page 17
4000189C.qxp
10/21/2004
7:50 AM
Page 18
Part 1: Lab Users Guide
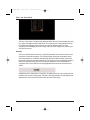
Segmentation Preview
Segmentation involves the partitioning of a microarray image into a set of regions that
convey a specified meaning. For microarrays, the purpose of segmentation is to
decompose a scanned optical image into regions that are meaningful in terms of spot
signal versus background.
Use the Segmentation Preview to view the effects of current parameter settings on the
segmentation both before and after quantifying the data. You select the spot to view
and the corresponding information about the spot displays in the segmentation panel.
At the same time the selected spot can be seen on the image and two of the plots
(Scatter plot and Box plot). This interface also supports dynamic analysis within
VersArray Analyzer 5.0 Software. You can adjust settings, such as the maximum and
minimum signal values, and see the effects of these changes in real time in the dialog
box.
The following textual spot information is available via the Segmentation Preview:
•
Gene ID – Lists the corresponding information, typically name or accession, from the
Gene ID file (if you imported a Gene ID file into VersArray Analyzer 5.0 Software.
•
Field – Lists the field that the selected spot belongs to. This name is specified when the
grid was first constructed.
•
Metarow – Identifies the row within the metagrid where the selected spot is located.
•
Metacolumn – Identifies the column within the metagrid where the selected spot is
located.
•
Row – Identifies the row within the subgrid where the selected spot is located.
Page 18
4000189C.qxp
•
•
10/21/2004
7:50 AM
Page 19
Part 1: Lab Users Guide
Column – Identifies the column within the subgrid where this spot is located.
Diameter – Lists the diameter, measured in pixels, of the selected spot. The diameter is
determined during spot finding when various spot sizes are attempted.
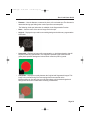
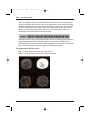
The following visual spot information is available via the Segmentation Preview:
•
Name – Lists the name of the source image file for the spot.
•
Original – Displays the spot and its surrounding background without any segmentation
information.
•
Segmented – Displays an image of the segmentation, or pixel determination, that will
be performed during quantification. The red pixels represent signal values and the
green pixels represent background values. Black means the pixel is ignored.
•
Composite – Displays an overlay between the Original and Segmented images. This
image is key to determining if the best settings have been entered on the
Measurements tab. Use this view to modify the settings until the desired signal and
background values are included while removing contaminants.
Page 19
4000189C.qxp
10/21/2004
7:50 AM
Page 20
Part 1: Lab Users Guide
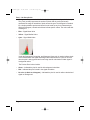
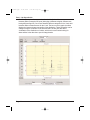
• Histogram – Represents the distribution of pixels along the intensity scale for the spot.
The y-axis (vertical) represents the number of pixels and the x-axis (horizontal)
represents the range of intensities of pixels across the spot. The histogram is intended
for a simple qualitative preview and should not be used for any form of data analysis.
Within the histogram, colored vertical bars indicate specific values. The colors and their
meaning are:
•
Blue – Signal Mean Value
•
Yellow – Signal Median Value
•
Cyan – Signal Mode Value
Under the Segmented, Composite, and Histogram Views color is used to indicate pixels
to be included within the signal and background measurements. If a pixel is not color,
then the pixel is being ignored and is not being used for calculation of either signal or
background values.
The Preview Panel colors include:
•
Green – Indicated the pixel is used in the background calculation
•
Red – Indicated the pixel is used in the signal calculation
•
No color (or black on histogram) – Indicated the pixel is used in neither calculation of
signal nor background
Page 20
4000189C.qxp
10/21/2004
7:50 AM
Page 21
Part 1: Lab Users Guide
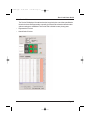
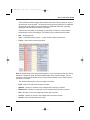
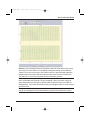
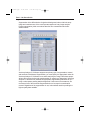
Quantification Table
The Quantification Table displays the quantified numerical intensity values for each of
the spots prior to being saved. =All measurements previously selected to be quantified,
including all quality measures are indicated here. Additional information regarding
flagging and spot location information is provided.
Each section of the data, as presented by a grouping of columns, is color coded to
facilitate easy review of the analysis. The following color codes describe the table:
•
Red – Quality flag code
•
Cyan – Quantified intensity values -– mean, median, quality measures etc
•
Purple – Spot location related information
Note: By default these colors are grouped together, but you can drag and drop the column
headers to change this order. Should the default order of the columns change, you can
restore the columns to the default order by using "Restore default column order" button in
the bottom of the table.
The default measurement order in the table is as follows.
•
Field – Name of a field where the spot is located
•
Metarow – Number of metarow in the metagrid where the spot is located
•
Metacolumn – Number of metacolumn in the metagrid where the spot is located
•
Row – Number of row in the subgrid where the spot is located
•
Column – Number of column in the subgrid where the spot is located
•
GeneID – Gene ID information for the spot
Page 21
4000189C.qxp
10/21/2004
7:50 AM
Page 22
Part 1: Lab Users Guide
• Flag – Numeric code of the flag for the spot (0 - no flag, flag codes 1,…,4)
•
Signal Mean – Pixel intensity averaged over the local signal region
•
Background Mean – Pixel intensity averaged over the local background region
•
Signal Median – Median pixel intensity computed over the local signal region
•
Background Median – Median pixel intensity computed over the local background
region
•
Signal Mode – Mode pixel intensity computed over the local signal region (mode
corresponds to the pick location in intensity distribution)
•
Background Mode – Mode pixel intensity computed over the local background region
•
Signal Area – Number of pixels in the local signal region
•
Background Area – Number of pixels in the local background region
•
Signal Total – Total pixel intensity summed over the local signal region
•
Background Total – Total pixel intensity summed over the local background region
•
Signal Stdev – Standard deviation of pixel intensities over the local signal region
•
Background Stdev – Standard deviation of pixel intensities over the local background
region
•
Shape Regularity – First signal area of a spot is inscribed into a circle. Than number of
non-signal pixels that fall within this circle is computed and divided by circle's area. This
ratio is subtracted from 1 as is called "shape regularity"
•
Ignored Area – Area of ignored regions directly neighboring ("touching") the signal
area is computed
•
Spot Area – Signal Area plus Ignored Area
•
Ignored Median – Median pixel intensity computed over the local ignored region
•
Area To Perimeter – This quality measure defines spot's circularity. Area of a spot is
divided by a square of spot perimeter and multiplied by. As a result, this measure
ranges from 0 (highly non-circular shape) to 1 (a perfect circle)
•
Open Perimeter – Computes the proportion of signal perimeter that touches the border of rectangular snip around the spot
•
XCoord – X coordinate (in pixels) of grid circle corresponding to the spot
•
YCoord – Y coordinate (in pixels) of grid circle corresponding to the spot
•
Diameter – Diameter (in pixels) of grid circle corresponding to the spot
•
Position Offset – Offset (in pixels) of the center of the grid circle from the expected
position in the grid
Page 22
4000189C.qxp
•
10/21/2004
7:50 AM
Page 23
Part 1: Lab Users Guide
Offset X – X offset (in pixels) of the center of the grid circle from the expected position
in the grid
•
Offset Y – Y offset (in pixels) of the center of the grid circle from the expected position
in the grid
•
Expected X – X coordinate of expected position of the circle in the grid. Expected
position in the grid is computed fitting least square lines to circle centers in every row
and column
•
Expected Y – Y coordinate of expected position of the circle in the grid. Expected
position in the grid is computed fitting least square lines to circle centers in every row
and column
•
CM-X – X coordinate of the center of the mass of spot's signal region
•
CM-Y – Y coordinate of the center of the mass of spot's signal region
•
CM Offset – Offset (in pixels) of the spot's center of the mass from the expected position in the grid
•
CM Offset-X – X offset (in pixels) of the spot's center of the mass from the expected
position in the grid
•
CM Offset-Y – Y offset (in pixels) of the spot's center of the mass from the expected
position in the grid
•
Min Diam – Diameter of the circle inscribed into the spot's signal region
•
Max Diam – Diameter of the circle, the spot's signal region can be inscribed in
Some of the measures can be excluded from or added to the table at any moment
through "Measurements" panel of Settings dialog box.
Individual spots can be selected for review, either by selecting the row from within the
Quantification Table or by selecting the spot within the image. If the spot is selected
from the image, the Quantification table will automatically scroll to the proper location
and the corresponding spot row will be highlighted. Notice also that the Segmentation
Preview automatically updates and displays the segmentation information for the
selected spot.
Save
Once the data has been quantified and you are satisfied with the results, the final step
is to Save the data. VersArray Analyzer 5.0 Software will save the data to common tab
delimited test files, which can easily be opened in other programs such as Microsoft
Excel or Notepad. VersArray Analyzer 5.0 Software will save each image's data to a
separate file and will automatically name the file based upon the name of the image.
Page 23
4000189C.qxp
10/21/2004
7:50 AM
Page 24
Part 1: Lab Users Guide
Note: By default, VersArray Analyzer 5.0 Software does not compute ratio values
between images; however, there is access to ratio data directly from VersArray
Analyzer 5.0 Software through the Histogram plot under the "Plots" tab in the Image
Display Panel. To compute ratio information, please use VersArray GeneGazer
Software. If additional and more advanced computations are required, Bio-Rad
recommends VersArray GeneGazer Software for full data analysis and visualization.
Export to XML
Before saving the data you also can export the measurements in GEML or MAGE-ML
format.
•
GEML (v 1.0) format – GEML profile export, only four values per spot are available
(signal/background value and standard deviation). User can choose between mean,
median, mode for export as signal/background value. For more details go to
http://www.rosettabio.com/products/conductor/geml/default.htm.
•
MAGE format (XML) – the most complete format, exported file will contain
QuantificationType_package, BioAssay_package and BioAssayData_package of
MAGE standard. All VersArray Analyzer 5.0 Software measurements will be exported.
For more details go to http://www.mged.org.
Note: once you export the data, the results table will not be closed, you can continue
analyzing the data or save the results in usual format.
Cancel
Cancel clears the quantified data values without saving them. Once the quantification is
cancelled, the image will need to be reprocessed before the data may be saved again.
Upon selecting Cancel, you will be prompted to verify your action. Clicking yes will then
clear the data. The Quantification table will no longer be visible.
Selection
VersArray Analyzer 5.0 Software allows multiple spot selection. You can select several
spots at a time pressing "Ctrl" or "Shift" keys when making selections in the results
table. The indicator in the bottom of the table will show you how many spots are selected.
You can also "freeze" the selection using corresponding buttons. When "frozen", table
rows will be highlighted in dark blue and will have a flag "Selected" in the right-hand
end of the table turned assigned as "1". When you "freeze" the spots you can analyze
them inividually by selecting only one row at a time. You can "unfreeze" the selection at
any time and the spots will become highlighted with the usual selection color. This
feature is useful if you selected the spots using one of the plots (selected regulated
genes using Histogram, for instance) and want to analyze their images, segmentations
and quantifications results. You also can Save the frozen rows into .txt file.
Page 24
4000189C.qxp
10/21/2004
7:50 AM
Page 25
Part 1: Lab Users Guide
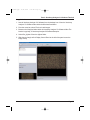
1.3 Image Display Panel
This panel displays loaded images. A tab appears along the top of the panel for all
currently loaded images. Click on a tab to display the corresponding image. The
Composite tab displays a false color overlay for all loaded images. You can use this tab
to overlay multiple images prior to analysis. The number of images which VersArray
Analyzer 5.0 Software can load is limited based upon the computer hardware
specifications.
All image manipulation tools, such as zoom and rotation, can be applied within the
image panel. Once zoomed into a region of the image, scroll bars become available
along the sides of the panel.
Note: There is a Zoom slide bar located at the bottom of the panel. Move it to the left to
zoom out of the image or move it to the right to zoom into an image. The Zoom slide
bar is one of four tools available for zooming.
Page 25
4000189C.qxp
10/21/2004
7:50 AM
Page 26
Part 1: Lab Users Guide
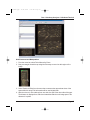
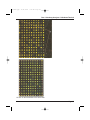
Segmentation Tabs
Once the image(s) have been quantified additional tabs, one for each image plus one
for plots, will appear along the top of the image display panel. Some of these new tabs
display the segmentation as it has been performed for the given image. From this view,
you have the ability to see the macro view of the image and notice any large defects
and the corresponding segmentation. Typical use of the segmentation tabs is for
detailed post processing quality assurance analysis.
Unlike the Preview Panel, the Segmentation tabs use lines to indicate the segmentation's
signal and background regions. All signal regions are surrounded by RED lines. All
ignored regions, values not counted as signal or background, are surrounded by YELLOW
lines. The remaining pixels within the image are all background regions.
The Segmentation Tab line colors:
•
Red – All pixels within the red lines are signal values
•
Yellow – All pixels within the yellow lines are ignored pixels
Page 26
4000189C.qxp
10/21/2004
7:50 AM
Page 27
Part 1: Lab Users Guide
Note: The description and use of colors between the Preview Panel and the
segmentation tab does vary slightly. The segmentation tab includes the use of yellow to
indicate ignored pixels where as the Preview Panel uses no coloring to indicate ignored
regions. Also, the segmentation tab does not use a color to indicate the background
region; however, within the Preview Panel, background values are indicated by a green
color. The differences between the two displays is accounted by the fact that due to
customer requests, the segmentation tab is designed to prevent eyestrain during
extensive visual inspection.
Plots Tab
This tab appears also only when the image is quantified. It contains a set of useful data
visualization tools that can help speed up the analysis process.
You can take virtually any measurement available from the results table and plot it in a
manner corresponding to one of three tools: Histogram, Scatter Plot, Box Plot or
GenePie. Once you choose the desired type of visualization, choices of measurement
for X- and Y-axes become available. Background correction options are available for
both axes if signal mean, median, mode or their inter-channel ratio is chosen for the
plot. If Histogram is selected, only the measurement choice for the X-axis will be
available. Correspondingly, only background correction for that measurement will be
accessible.
A Change in measurement selection will be followed by an update of the current plot.
Any plot can be printed or saved as an image file.
Page 27
4000189C.qxp
10/21/2004
7:50 AM
Page 28
Part 1: Lab Users Guide
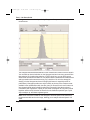
Histogram. As we mentioned previously, Histogram allows you to choose only one
measurement.
The histogram demonstrates distribution of the measurement values over their domain.
You can make an interval selection on the histogram and see how many genes fall into
that selection. By changing the selection of "Tails" check box, you can select genes
either inside the interval or outside.You can switch between untransformed measurement
and log-transformed measurement using "log" check box. You can also change bin
density, print the histogram and save its image (this feature is especially useful for
publications). Histogram provides not only the ability to plot any of the measurements
available in the quantification table, but also gives you access to such useful values as
inter-channel signal ratios (including background corrected). Using these values in
combination with "logarithmic" option you can obtain a histogram of a log-ratio (natural
logarithm will be used). Selection of the tails of such distribution provides you a quick
way to analyze up- and down-regulated genes.
Note: when a selection is made on the histogram, the same spots will be selected in
measurements table and on the image, allowing you to analyze selected spots in full
scale.
Page 28
4000189C.qxp
10/21/2004
7:51 AM
Page 29
Part 1: Lab Users Guide
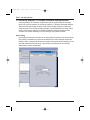
Scatter Plot. The scatter plot option offers visualization of one measurement plotted
against any other.
If multiple images are loaded, you can plot not only two measurements within one
channel, but also two measurements belonging to different channels. For instance, a
plot of signal means can show the difference between fluorescence characteristics in
two channels or can even give a crude estimation of the regulation of the genes.
Selecting points on the scatter plot will result in the selection of corresponding rows in
the results table and highlighting of selected spots on the image.
Note: you can add to your current selection by simply continuing to select other groups
of spots. To start a new selection, right-click on the plot first to clear the previous selection.
Page 29
4000189C.qxp
10/21/2004
7:51 AM
Page 30
Part 1: Lab Users Guide
Box Plot. This option allows you to visualize the distribution of the measurement
between different categories of spots (belonging to different subgrids, different rows,
having different flags etc). You choose between different categories for the X axis and
between different measurements for the Y axis. The box on such a graph visualizes
displays the lower and upper percentiles of the distribution. These percentiles can be
changed using the scroll bars on the left hand side. The box plot also allows
visualization of the distribution of outliers, which can be useful when looking for
abnormalities in the data due to special categorization.
Page 30
4000189C.qxp
10/21/2004
7:51 AM
Page 31
Part 1: Lab Users Guide
GenePie. This plot displays the spot's expression values for each channel as portions
of a circle. The colors within a pie correspond to thesignal intensity of the individual
channel. The most common use of the GenePie chart is to plot differential expression
patterns between channels. Different measurements may be used for GenePie plot.
The values on X- and Y-axes represent the spot coordinates in pixels.
Note: any selection that you make within one of the plots will be common for all other
plots, results table and image tab. The only exception is that if you select a group of
spots using Scatter plot, Box plot or Results table, the selection will not be visible on
Histogram plot. If you make the selection using the Histogram option, it can be viewed
by all other tools.
Note: you can move the cursor over any of the data elements on any plot and see a
pop-up tip containing short information about the gene ID and measurement values.
Page 31
4000189C.qxp
10/21/2004
7:51 AM
Page 32
Part 1: Lab Users Guide
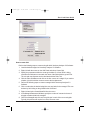
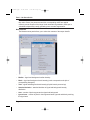
1.4 VersArray Analyzer 5.0 Software Parameter Settings Window
VersArray Analyzer 5.0 Software encapsulates most of its parameters and settings
within one common interface, the VersArray Analyzer 5.0 Software Parameter Settings
Window. Within this window are tabs, which control virtually all aspects of the array
image analysis. From initial spot finding settings, to complicated auto reporting of alert
values, the VersArray Analyzer 5.0 Software Parameter Settings window provides
complete user control. Selecting File, then Settings, may open the window.
Spot Finding
Spot finding involves the localization of the array signal as printed on the array medium.
Due printing inconsistencies, spots and sometimes even entire subgrids require spot
finding in order to properly determine the location of the signal value. Depending on the
type and characteristics of the array, if spot finding is not performed, the resulting
quantification may be questionable.
Page 32
4000189C.qxp
10/21/2004
7:51 AM
Page 33
Part 1: Lab Users Guide
The following parameters affect how VersArray Analyzer 5.0 Software performs spot
finding:
•
Find Negative Spot – While not a problem for most arrays, negative spots can
potentially cause problems for VersArray Analyzer 5.0 Software spot finding. If you
suspect that the image may contain negative spots, we recommend leaving this option
checked. When Find Negative Spots is enabled, VersArray Analyzer 5.0 Software will
look for negative spots while also looking for regular spots.
Note: If you suspect all the signal values within the image are negative due to specific
scanner settings, then you may need to invert value for the images. Occasionally, the
scanner software does not save information about which values are high and low within
the tiff image. The result is that VersArray Analyzer 5.0 Software does not know
whether white or black pixels are the high values. If all signal values are negative,
which can be deduced through quantification or use of the intensity tool, then select
Invert Values and re quantify. The Find Negative Spots option is not intended for use in
these situations.
•
Enforce Grid Constraints – With this option selected, VersArray Analyzer 5.0 Software
will use Local and Grid Flexibility when performing spot finding. When not selected,
VersArray Analyzer 5.0 Software will perform spot finding with no constraints. Please
see below for additional information regarding Local and Grid Flexibility.
Note: Under most circumstances, you will want to enforce grid constraints as this will
limit the movement of circles during spot finding and help prevent erroneous spot
finding due to dust and other contaminations.
•
Local Flexibility – Local Flexibility defines the radius, measured in pixels, that
VersArray Analyzer 5.0 Software is allowed to search for spots. The origin for the
search is the initial spot location as determined by grid placement. From here,
VersArray Analyzer 5.0 Software will search for a spot with X pixels distance where X is
defined in the local flexibility parameter.
•
Grid Flexibility – Grid flexibility is an indication of the extent to which VersArray
Analyzer 5.0 Software should deform the grid to match a given set of spots. The
measurement is a qualitative notion based on a large part due to the unique properties
of the image. Most users should set this to the middle values.
Note: You can press the End key to move the slider all the way to the right or the
Home key to move the slider all the way to the left.
Page 33
4000189C.qxp
10/21/2004
7:51 AM
Page 34
Part 1: Lab Users Guide
Segmentation
Segmentation is the differentiation of signal and background values within the array
image and constitutes one of the most important aspects of array image analysis.
Proper segmentation yields more robust data free from contamination and other
adverse affects.
VersArray Analyzer 5.0 Software supports two primary type of segmentation, manual
and automatic. With Manual Segmentation, you must specify the appropriate values for
VersArray Analyzer 5.0 Software to use when analyzing the image. Often these proper
values can be arrived at through experimentation or experience. Alternatively, VersArray
Analyzer 5.0 Software can calculate the appropriate segmentation parameters for you
using a robust patent pending statistical approach. Under normal circumstances, we
recommend use of the Automatic Segmentation due to its superior contamination
removal. Regardless of the segmentation in use, both methods assist in providing the
highest quality data available.
Page 34
4000189C.qxp
10/21/2004
7:51 AM
Page 35
Part 1: Lab Users Guide
Listed under the Segmentation Tab are the following parameters:
Background Buffer –
The distance, in pixels, between the
signal and the background measurement regions. Within this region, all pixel values are
ignored during quantification. Setting the proper buffer size helps to ensure accurate
results. The desired size is dependent on several factors, including the spot size, density,
image quality, and spot shape.
Background Width –
The measurement, in pixels, to determine
how far background measurements will extend from the buffer region. In other words,
the measurement will extend X pixels from the end of the buffer. Remember that the
background should include enough pixels to provide a sufficient sampling. VersArray
Analyzer 5.0 Software should not be used with no background values as these values
are required in numerous quality measurements.
Do not allow donut shapes –
When you select this option,
VersArray Analyzer 5.0 Software will make sure that a donut-shaped segmentation
does not appear for any spot. A segmentation is considered to be donut-shaped if there
are ignored pixels completely surrounded by signal pixels and their median intensity is
lower then signal's. This option is available for auto segmentation only.
Note: The background width will not extend beyond the snip, or rectangular boundary
around each spot. Even though you can set the background to an extremely high value,
the background measurements will stop at this boundary and not include signal values
from surrounding spots.
•
Signal Percentages – These parameters are a percentage of all intensity levels within
the signal region. The intensity ranges are raw values that do not include any statistical
measurements (such as mean and median). The high percentage can to 100%, since
the sample should contain the pixel with the highest intensity value. If you want to filter
out possible noise sources, such as a speck of dust, set this percentage at a lower
value, like 95%. This filters out the high intensity values associated with particle
(assuming it will be fluorescing at a high intensity level).
•
Background Percentages – These parameters are a percentage of all intensity levels
within the background region. Set them the same way as described for the signal
percentages. Press the Home key to set a slider to 0%. Press the End key to set a slider
to 100%
•
AutoSegmentation – Selecting this option will turn on a patented automatic
segmentation method. Under most circumstances, this should be selected. Under
AutoSegmentation, the only parameter, which VersArray Analyzer 5.0 Software will use,
is the Background Buffer. The typical value should be slightly less than ½ the radius.
Under AutoSegmentation, the slider bars for the signal and background percentages
become disabled.
Page 35
4000189C.qxp
10/21/2004
7:51 AM
Page 36
Part 1: Lab Users Guide
Note: An important difference between automatic and manual segmentation is the fact
that under manual, the parameters and their corresponding values are applied
uniformly across all spots of the image. Under automatic segmentation, each spot is
calculated independently usually generating more accurate segmentation.
Measurements
The Measurements panel allows you to select the contents of the output data file.
•
Mean – signal and background mean intensity
•
Median – signal and background median intensity
•
Mode – signal and background mode intensity (mode corresponds to the pick of
corresponding histogram)
•
Total – signal and background total intensity (all pixel intensity summed up)
•
Standard deviation – standard deviation of signal and background intensity
distribution
•
Area – number of pixels segmented as signal and background
•
Ignored area – number of pixels in the segmented areas ignored and directly touching
the signal area
Page 36
4000189C.qxp
10/21/2004
7:51 AM
Page 37
Part 1: Lab Users Guide
•
Spot area – ignored area plus signal area
•
Ignored median – median of pixel intensity in ignored area
You can check and uncheck these measurements at any time and the results table will
be updated immediately.
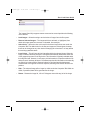
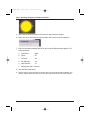
1.5 VersArray Analyzer 5.0 Software Wizard
VersArray Analyzer 5.0 Software wizard is designed to help you understand the
VersArray Analyzer 5.0 Software tools better and to assist in navigating through the
necessary steps. The Wizard can be switched on and off at any moment through Help
menu. Even when the Wizard window is switched on, it does not limit your access to
any of the VersArray Analyzer 5.0 Software tools.
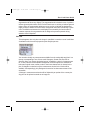
To launch the Wizard, select the "Wizard On" option from the Help menu. The Wizard
window will be shown in the bottom right part of your screen.
The VersArray Analyzer 5.0 Software Wizard works in two modes. The first mode
switches on whenever Wizard detects that you have performed an action that should
logically be followed by another action. The Wizard will display the action that was
performed and indicate the next step. To follow this advice you can either use a the tool
the Wizard refers to or click on the "Follow Advice" button in the bottom part of the
Wizard window. The latter will result in the recommended action being performed
automatically. If the recommended action is not necessary, you will have an option to
go to next suggested action. The sequence of the recommended actions will start
immediately after the VersArray Analyzer 5.0 Software launches with the advice to load
the image. Thus, virtually anyone can learn to use VersArray Analyzer 5.0 Software by
following the Wizard prompts.
Page 37
4000189C.qxp
10/21/2004
7:51 AM
Page 38
Part 1: Lab Users Guide
If you try to apply a tool that does not fall into a pre-defined sequence of actions, the
Wizard will switch to its second mode. In this mode the Wizard will prompt the user as
to what tool is being used and how to use it.
Thus, the VersArray Analyzer VersArray Analyzer 5.0 wizard provides you with an
opportunity to learn how to use the software in an interactive fashion.
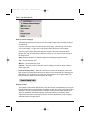
1.6 Reviewing Results
One of the most powerful features of VersArray Analyzer 5.0 Software is the ability to
review results of previously processed data. VersArray Analyzer 5.0 Software is
designed to load and display data exactly as it was processed days or even months
earlier. The capability to review the results provides the following benefits:
•
Compare old data with recently processed data
•
Review the results of batch processing
•
Establish post image analysis quality controls and screening
•
Reload and take screen captures for publication
1.6.1 The Snapshot File (sst file)
The snapshot file is a result of quantification within VersArray Analyzer 5.0 Software.
Upon saving the quantified data to the file system, VersArray Analyzer 5.0 Software
also saves another file, which contains a snapshot of that data as it existed after
quantification. It is this snapshot file, ending with an .sst file extension, which VersArray
Analyzer 5.0 Software loads allowing review of results.
The snapshot file itself is simply a proprietary binary file format which is not useful
outside of VersArray Analyzer 5.0 Software. Due to the large amount of information
contained within the file, its size can grow quite large, often surpassing the image size
itself. The snapshot file contains the following components:
•
Grid
•
Gene ID
•
Segmentation
•
Quantified Data
•
Quality Measures
While the sst file contains almost all the required information to reload and review data,
it does not contain the actual images. To review results, VersArray Analyzer 5.0
Software must have access to the original images. By default, VersArray Analyzer
VersArray Analyzer 5.0 Software will attempt to load the images from the location
specified within the sst file. However, if the images have been moved and VersArray
Analyzer 5.0 Software is not able to load them, VersArray Analyzer 5.0 Software will
ask you to browse and select the appropriate images.
Page 38
4000189C.qxp
10/21/2004
7:51 AM
Page 39
Part 1: Lab Users Guide
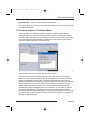
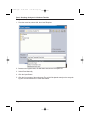
1.6.2 Loading Results to Review
Loading data for subsequent review can be accomplished by performing the following
steps:
1. From the VersArray Analyzer 5.0 Software menu bar, select File followed by Review
Results. Likewise, you may click on the Review Results icon located along the toolbar.
2. With the Open dialog, browse and select the snapshot file you wish to open.
3. Depending on the file, VersArray Analyzer 5.0 Software may prompt you to specify the
location of the original images as well.
4. The information and data should now be visible within the main VersArray Analyzer 5.0
Software user interface. If you wish to reprocess the images, click the Cancel button
along the bottom of the Results tab and use the Quantify button of the main panel.
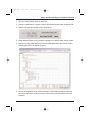
1.7 VersArray Analyzer 5.0 Software Tools
VersArray Analyzer 5.0 Software includes many handy tools designed to help facilitate
array analysis. These tools are designed for manipulating, quantifying and analyzing
array images.
1.7.1 Auto Alignment Tool
The Auto Alignment tool
automatically overlays several images on top of one
another. If two or more images are loaded, activating this tool will attempt to overlay the
spots from each image. While this tool is designed largely for transposing of images, or
left, right, and up, down, movement, VersArray Analyzer 5.0 Software can rotate
images up to 10°.
The Auto Alignment tool is intended to provide a quick and highly accurate means to
solve the problem of analyzing arrays which have been scanned slightly out of
alignment. If the images have a high degree of rotation or other extreme problems, then
the manual manipulation tools of transposing and rotation may be used.
Note: The Auto Alignment tool is intended to account for shifts of the array in scanning
and not for warping of the medium being printed upon.
1.7.2 Auto Grid Placement Tool
VersArray Analyzer 5.0 Software's Auto Grid Placement Tool
automatically
repositions a grid structure to the proper location within the image. This tool is used
with grid and template files. If the geometry of an array stays the same between
experiments, the use of a common template for all experiments is beneficial. However,
due to differences in arraying and scanning, the location of the array within the image
may vary across experiments. The Auto Grid placement tool solves this problem,
because once the image and the grid have been loaded, the tool will automatically
move the grid to the proper location.
Page 39
4000189C.qxp
10/21/2004
7:51 AM
Page 40
Part 1: Lab Users Guide
Note: it is important that at least 60% of the spots in each row and each column of
every sub-grid are visually resolvable in order for the grid placement algorithm to find
the correct grid location. In case the image has some spots that are a priori blank or
empty, assign the gene IDs "BLANK" or "EMPTY". This way VersArray Analyzer 5.0
Software will take the absence of signal in those spots into account and produce
reliable results.
1.7.3 Save Display Image Tool
VersArray Analyzer 5.0 Software’s save Display Image Tool
provides the capability
to save a screen capture of the overlaid, i.e. composite, images. The saved image
includes only the overlay as it appears within the main image panel. VersArray Analyzer
5.0 Software saves the image as a high quality 24 bit tiff format. The image can later be
recalled for reference of for use in publications.
1.7.3.1 Saving the Display Image
Perform the following step to save the current composite overlay to a tiff image file:
From the menu bar select File then Save Display Image. Alternatively, click the Save
Display Image icon from the toolbar.
From the Save As Dialog that appears, browse to the location you wish to save the
image.
Specify a file name. VersArray Analyzer 5.0 Software will automatically add the .tif file
extension at the end of the name.
The image is now saved and is available to be viewed in virtually any graphics program
such as Microsoft Imaging or Adobe Photoshop.
1.7.4 Zoom Tool
The Zoom Tool
allows you to zoom a specific region of the image. VersArray
Analyzer 5.0 Software allows several methods tozoom, including:
After selecting the Zoom Tool, you can left click with the mouse and drag a rectangle
around the section of interest in the main image panel.
left click with the mouse and drag a rectangle around the section of interest in the
Image Map View.
Hold the <alt> key on the key board, left click with the mouse and drag a rectangle
around the section of interest in either of the areas mentioned previously.
Drag the Zoom slider bar located directly below the Main Image Panel.
Note: To return to the original image size, double right click with the mouse.
Page 40
4000189C.qxp
10/21/2004
7:51 AM
Page 41
Part 1: Lab Users Guide
1.7.5 Scroll Tool
The Scroll Tool
provides a convenient way to move about the image. To pan the
image, simply click and drag the image around as you would any other object. The
image will automatically scroll left and right as needed.
If at any time you wish to know where the current view is situated in the image, simply
look for the location of the yellow box within the Map View. The yellow box indicates the
region currently being viewed within the Main Image Panel.
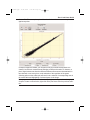
1.7.6 Ruler Tool
The Ruler Tool
allows objects to be measured within the Main Image Panel. The
most common use of this tool is to determine the minimum and the maximum diameter
for spot sizes and distance between the spots. The tool can also be used to determine
the general resolution of the image and how many pixels are included within each spot.
The Ruler Tool displays the results within the Status Bar located under the Main image
Panel. The information provided includes:
Dx: the distance moved on the x-axis as measured in pixels
Dy: the distance moved on the y-axis as measured in pixels distance: the absolute
distance moved as measured in pixels
1.7.7 Intensity Tool
The Intensity Tool
displays the raw pixel intensities in the Status Bar located
under the Main Image Panel. After selecting the tool, simply position the cursor over
the pixel of interest and the pixel intensity for each image is displayed.
Note: The values provided here are raw intensities representing single pixel values
rather than mean or median values.
1.7.8 Flagging Tool
The Flagging Tool
provides a simple means of manually flagging spots within
VersArray Analyzer 5.0 Software. While spots may be flagged or marked for a variety of
reasons, the most common reason is due to a defect within the spot or array.
Page 41
4000189C.qxp
10/21/2004
7:51 AM
Page 42
Part 1: Lab Users Guide
Once a spot has been flagged, a numerical value indicating the type of flag is then
displayed with the quantified data. The flag value can then be used in later data analysis
software, such as Bio-Rad's GeneGazer Software, or can be used in post analysis
quality control measures. In addition to the numerical value, a shape is also added to
make the flag visually unique. Each shape corresponds to a different flag as is
explained below.
VersArray Analyzer 5.0 Software supports a variety of manual flagging types. To
change the type of flag, right click with the mouse and select the desired manual flag
from the context sensitive menu. The following is a list of possible flags and the
corresponding values:
Flagging codes:
Manual flags (color: red)
1 – Flag spots
2 – Empty spots (cross)
3 – Poor spots (plus)
4 – Negative spots (dash)
1.7.9 Undo and Redo Tools
VersArray Analyzer 5.0 Software supports an unlimited number of undo and redo
operations. Anytime you wish cancel an action, this tool provides means to do so.
Note: The action to be undone or redone is displayed next to the text in the menu bar.
For example, if you move the grid and then wish to undo this action, the text in the
Tools Menu will read "Undo Move Grid". This is a convenient means to see what action
is reversed.
Page 42
4000189C.qxp
10/21/2004
7:51 AM
Page 43
Part 1: Lab Users Guide
1.7.10 Grid Tools
Adjust Metagrid
This tool allows manipulation of entire metagrids. The metagrid can be moved, stretched
or resized.
Adjust Subgrid
This tool allows manipulation of entire subgrids. The subgrids can be moved, stretched
or resized.
Adjust Spot
This tool allows individual spots to be moved and resized.
Lasso Adjust
This tool allows you to select irregularly shaped regions of circles for adjustment.
Instead of shifting entire subgrids, you can now specify unusually shaped regions of
circles for fine-tuning.
Rectangle Adjust
This tool, which is similar to the lasso adjust tool, allows you to make a sub-selection of
circles to adjust from within the array. This tool employs a rectangular shape to highlight
given circles.
Page 43
4000189C.qxp
10/21/2004
7:51 AM
Page 44
Part 1: Lab Users Guide
Duplicate MetaGrid
Duplicating an existing metagrid can save time and produce better results than manually
recreating the metagrid several times. To use it click on the button and select a metagrid
to duplicate by left-clicking on it. After that you can multiply this metagrid in any place
on the image by left-clicking. To stop duplicating, right click on the mouse.
Show/Hide Grid
VersArray Analyzer 5.0 Software allows the grid to be hidden to allow a better view of
the bare spots. Hiding the grid hides any lines, circles and flagging that may exist within
the Main Image Panel.
Auto Adjust Spots
Select this option to have VersArray Analyzer 5.0 Software perform automatic spot
localization. VersArray Analyzer 5.0 Software searches the area around the grid
placement for a spot within the predefined minimum and maximum diameters.
Adjustment accuracy also depends on grid constraints and the quality of your images.
For example, if you have spots with irregular signal values and you set grid flexibility
with a high number of pixels, VersArray Analyzer 5.0 Software will tend to find pixels
with high expression values. For full automation use this tool in conjunction with auto
grid placement button.
Note: If you use this button several times, spot searching will start from the position
where previous attempt left it. Be careful: multiple auto adjustment can dramatically
deform grids on low-quality images.
Wrangle
The wrangle feature of VersArray Analyzer 5.0 Software applies new, stricter constraints
to the results of spot localization without requiring further spot finding. Essentially, this
allows you to reduce the spot search radius without repeating the spot finding. The
benefit of this feature is to assist processing for those with either slower computer
hardware or for those with numerous spots.
A sample application would be to perform spot finding for grid geometry on an array
image with a Local Flexibility set to a large number of pixels. After spot finding, if the
resulting circle placement has high variability, the Local Flexibility can be reduced. After
reducing Local Flexibility, click the Wrangle Button to apply the new setting without
waiting for spot finding to be performed again.
Page 44
4000189C.qxp
10/21/2004
7:51 AM
Page 45
Part 2: VersArray Analyzer 5.0 Software Tutorials
Part 2: VersArray Analyzer 5.0 Software Tutorials
2.1 Basic Analysis
This tutorial demonstrates performing basic quantification through VersArray Analyzer
5.0 Software. The tutorial covers the essential steps from loading the initial array
images until a report is generated. The following lessons will be presented within this
tutorial.
•
Image Loading and Manipulation – Describes how to load an image into VersArray
Analyzer 5.0 Software and use the controls on the Image tab to enhance the on-screen
display of the image.
•
Grid Placement and Manipulation – Describes how to create a grid and adjust it to fit
the image.
•
Quantifying and Saving the Data – Describes the quantification and subsequent
output of data.
Image Loading and Manipulation
•
Launch VersArray Analyzer 5.0 Software from the desktop icon or from the VersArray
Analyzer 5.0 Software folder within the Windows Start Menu.
•
From the menu bar, select File , then Load Images.
•
Browse to the Samples folder within the VersArray Analyzer 5.0 Software folder. The
location is typically, C:\VersArray Analyzer 5.0\Samples.
•
Select lowdensity_1 or lowdensity_2. Multiple selections can be performed by holding
the <ctl> key on the keyboard and left clicking.
Page 45
4000189C.qxp
10/21/2004
7:51 AM
Page 46
Part 2: VersArray Analyzer 5.0 Software Tutorials
5. Click the Open Button to complete the image loading. A progress bar displays time
remaining. The first file loaded will appear as the Cy5 image; the second, as the Cy3
image.
6. Once the images are loaded and are visible within the Main image display located
along the right of the primary VersArray Analyzer 5.0 Software window, the images
need to be overlaid. Not all images will require this action, but due to variances in
scanning, some will. To overlay the Images Automatically, click the Align Images button
from the toolbar. In additional to auto alignment, VersArray Analyzer 5.0 Software
offers manual tools for rotation and translation of images.
Page 46
4000189C.qxp
10/21/2004
7:51 AM
Page 47
Part 2: VersArray Analyzer 5.0 SoftwareTutorials
Grid Placement and Manipulation
1. From the menu bar, select Tools followed by Zoom.
2. Drag a rectangle around the top subgrid of the array to zoom into this region of the
image.
3. Select Tools then Ruler from the menu bar to measure the approximate sizes of the
spots within this array. This information will be used slightly later.
4. With the ruler tool, click and drag from one side of a spot to the other side of the spot.
The distance is displayed in a status bar located beneath the main image panel. This
distance is in pixels.
Page 47
4000189C.qxp
10/21/2004
7:51 AM
Page 48
Part 2: VersArray Analyzer 5.0 SoftwareTutorials
5. Next count the number of rows and columns of spots within this subgrid.
6. Right click on the Grid Panel and select Create Grid from the menu that appears.
7. Enter the information obtained above into the Create Grid Window that appears. The
values should be:
a.
Field Name –
“Main”
b.
Rows –
“30”
c.
Columns –
“60”
d.
Min Diameter –
“18”
e.
Max Diameter –
“21”
f.
Rectangular Grid is selected
8. Click the Place Grid Button
9. Use the mouse cursor and click on each of the four corner spots of the subgrid in succession. Upon placement of the fourth spot, the grid becomes visible on the subgrid.
Page 48
4000189C.qxp
10/21/2004
7:51 AM
Page 49
Part 2: VersArray Analyzer 5.0 SoftwareTutorials
10. Click on the name Main in the Grid Panel.
Page 49
4000189C.qxp
10/21/2004
7:51 AM
Page 50
Part 2: VersArray Analyzer 5.0 SoftwareTutorials
11. With "Main" selected, right click and select Create Metagrid.
12. In the window that appears, enter the following information
a.
Metarows –
“1”
b.
Metacolumn –
“2”
(This indicates that your array has 2 total grids, and both are found in 1 row)
13. Click Place MetaGrid
14. In the top subgrid where we just placed the grid, click on the top, left most spot.
15. Using the scroll bar located along the right of the main image panel, scroll downward
until the last subgrid is reached
16. Click the top, left most spot within this subgrid as well. VersArray Analyzer 5.0 Software
automatically places the remaining subgrids in the proper locations.
17. Click the Adjust Subgrid button on the toolbar.
18. Click on and drag this subgrid slightly to provide a better fit.
19. Alternatively, click the Automatically Place Grid button to automatically place the subgrids.
20. Click the Adjust MetaGrid Button from the toolbar and click on any subgrid.
21. Click the Auto Adjust Spots Button from the Toolbar to perform automatic spot finding.
Page 50
4000189C.qxp
10/21/2004
7:51 AM
Page 51
Part 2: VersArray Analyzer 5.0 Software Tutorials
Quantifying, Pre-Analyzing and Saving the Data
1. Click the Quantify Button located along the Bottom of the Main Tab.
2. After a few moments the quantified data is visible under the Results Tab.
3. Select Plots tab on the Image Display panel.
4. Select Histogram on the Plots panel.
5. Select "Signal Mean Ratio ch1/ch2" from the list of measurements.
6. Make sure that "log" option is not selected for the Histogram.
7. Select 2-fold regulated genes by specifying 2 in the "Upper bound" text box.
8. "Freeze" the selection using the corresponding button in the bottom of the table.
9. Sort the data by column "Selected" clicking on its header. All selected genes will be in
the bottom of the table.
10. Go through the spots one by one analyzing spot images.
Page 51
4000189C.qxp
10/21/2004
7:51 AM
Page 52
Part 2: VersArray Analyzer 5.0 Software Tutorials
11. Click the Save Button to save the Quantified data and snapshot file to an output
directory of your choice.
2.2 Premanufactured Array Analysis
VersArray Analyzer 5.0 Software provides the ability to load templates for many
commercially available arrays. A template within VersArray Analyzer 5.0 Software is the
combination of a grid and the genelist, or Gene IDs, required to easily quantify and
name the various probes on the array. A selection of these templates are provided to
customers as a service to aid their array analysis. For a complete listing of templates
currently available, contact Bio-Rad support. The following Lessons will be covered:
•
Image Selection – Describes how to load an image into VersArray Analyzer 5.0
Software and use the controls on the Image tab to enhance the on-screen display of
the image.
•
Template Selection – Demonstrates the loading and placement of premade templates.
•
Quantification – Describes the quantification and subsequent output of data.
Note: This procedure is also used for GAL, GEML, or MAGE files.
Page 52
4000189C.qxp
10/21/2004
7:51 AM
Page 53
Part 2: VersArray Analyzer 5.0 Software Tutorials
Image Selection
1. Launch VersArray Analyzer 5.0 Software from the desktop icon of from the VersArray
Analyzer 5.0 Software folder within the Windows Start Menu.
2. From the menu bar, select File, then Load Images.
3. Browse to the Samples folder within the VersArray Analyzer 5.0 Software folder. The
location is typically, C:\VersArray Analyzer5.0 Software\Samples.
4. Select Rat_Agilent.tif from the Agilent folder.
5. Slide the top triangle of the Display Control Panel to the left of the panel to see the
image clearly.
Page 53
4000189C.qxp
10/21/2004
7:51 AM
Page 54
Part 2: VersArray Analyzer 5.0 Software Tutorials
Template Selection
1. From the menu bar, select Grid, then Load Template.
2. Browse to the Agilent folder, the Rat folder and select the template file.
3. Select Place Manually
4. Click the Open Button
5. Click the four corners of the entire array. The grid will be placed exactly on the array taking into account differences in scale and rotation.
Page 54
4000189C.qxp
10/21/2004
7:51 AM
Page 55
Part 2: VersArray Analyzer 5.0 Software Tutorials
Quantification
1. Click the Quantify Button under the Main Tab.
2. Once the quantification is complete, click the Save Button located under the Results Tab.
3. Specify a file name and location to save the data file.
4. Using Windows Explorer or My Computer, navigate to the data file within the file system.
5. Open the file using either MS Excel or Microsoft Wordpad. Notice the GeneID column
contains gene names as defined by Agilent.
6. The use of templates through VersArray Analyzer 5.0 Software provides a convenient
and simple way to perform grid placement and associate gene information with clone
locations.
Page 55
4000189C.qxp
10/21/2004
7:51 AM
Page 56
Part 3: Licensing
Part 3: Licensing
License Agreement and Limited Warranty
THIS SOFTWARE LICENSE AGREEMENT AND LIMITED WARRANTY ("AGREEMENT")
IS ENTERED INTO BY AND BETWEEN BIODISCOVERY, INC. ("LICENSOR") AND YOU
WHETHER YOU ARE AN INDIVIDUAL OR AN ENTITY ("LICENSEE"). READ THE
FOLLOWING TERMS AND CONDITIONS CAREFULLY BEFORE OPENING THIS
SEALED PACKAGE CONTAINING THE ENCLOSED SOFTWARE, OR BEFORE
PROCEEDING FURTHER WITH THE USE OR INSTALLATION OF THIS SOFTWARE. BY
YOUR OPENING OF THE PACKAGE CONTAINING THIS SOFTWARE, OR BY
INSTALLING OR UTILIZING THE INSTANT SOFTWARE, YOU AGREE TO BE BOUND
BY THE TERMS AND CONDITIONS SET FORTH HEREIN. IF YOU DO NOT AGREE TO
BE BOUND BY THE TERMS AND CONDITIONS, YOU MUST RETURN THIS PACKAGE
AND THE SOFTWARE WHICH IT CONTAINS TO YOUR PLACE OF PURCHASE NO
LATER THAN 10 DAYS FROM YOUR RECEIPT OF THE SOFTWARE. UPON RECEIPT
OF THE UNOPENED PACKAGE, YOUR PURCHASE PRICE WILL BE REFUNDED. THIS
SOFTWARE PRODUCT IS PROTECTED BY COPYRIGHT LAWS AND INTERNATIONAL
COPYRIGHT TREATIES, AS WELL AS OTHER INTELLECTUAL PROPERTY LAWS AND
TREATIES, AND THIS AGREEMENT. THE SOFTWARE PRODUCT WHICH IS THE
SUBJECT OF THIS AGREEMENT IS LICENSED UNDER THIS AGREEMENT, NOT
SOLD.
Page 56
4000189C.qxp
10/21/2004
7:51 AM
Page 57
Part 3: Licensing
1. LICENSE GRANT – For consideration promised and/or received, Licensor hereby
grants to Licensee one nonexclusive, nontransferable, internal, end-user license (the
"License") to use, except for any commercial diagnostic purpose or use, the basic
software product entitled VersArray Analyzer 5.0, and those software modules expressly
authorized in writing by Licensor, if any, (the "Software"), and the accompanying
documentation in the form delivered to Licensee. If Licensee would like to use the
Software and accompanying documentation for any commercial diagnostic purpose or
use, Licensee will need to purchase a separate and additional license from Licensor.
Unless Licensee has requested and expressly obtained written permission from
Licensor, and until such time that Licensee has paid a multiple licensee fee for the
concurrent use of the Software, the Software is licensed as a single product and,
notwithstanding the fact that the Software itself does execute and/or access multiple
central processing units ("CPUs") concurrently, Licensee shall not separate, execute, or
access the Software for use on more than one CPU at any one given time. Subject to
Licensee's purchase of more than one License, the License granted hereunder is for
use only upon a single stand alone computer and only one instance of the Software
may be executed and/or accessed at any one time, where such computer upon which
the Software is executed and/or accessed is owned, leased, or otherwise substantially
controlled by Licensee. Subject to Licensee's purchase of more than one License,
neither concurrent use on two or more computers nor use in a local area network or
other network is permitted. Upon having purchased and obtained written consent from
Licensor to hold more than one License to the Software, Licensee may concurrently
load, use, or install the Software upon the number of computers or CPU's for which
Licensee expressly holds a License.
Upon loading the Software, Licensee may retain the Software for backup purposes
only. In addition, Licensee may make one copy of the Software on a second set of
diskettes (or on compact disc or cassette tape) for the purpose of backup in the event
the original diskette(s) or compact disc(s) for the Software is damaged or destroyed.
Licensee may make one copy of the User's Manual for backup purposes only. Any such
copies of the Software or the User's Manual shall include Licensor's copyright and
other proprietary notices. Except as authorized under this paragraph, no copies of the
Software, the accompanying documentation, or any portions thereof may be made by
Licensee or any person under Licensee's control or authority.
Licensee agrees that it will not use the Software for any purpose that is illegal or in any
way that might result in any loss of its or any third party's property or information.
Licensee agrees that it shall have the sole responsibility for protecting its data used in
connection with the Software.
The terms and conditions of this Agreement shall apply to all additional, subsequent or
multiple Licenses obtained by Licensee for the Software.
Page 57
4000189C.qxp
10/21/2004
7:51 AM
Page 58
Part 3: Licensing
2. RESTRICTIONS – Licensee agrees that it will not assign, sell, sublicense, transfer,
pledge, lease, rent, or share the Software, the accompanying documentation or
Licensee's rights under this Agreement, nor delegate any of Licensee's obligations
under this Agreement. Any attempted assignment, sale, sublicense, transfer, pledge,
lease, rental or delegation shall be null and void. Licensee shall not utilize the
Software to provide image processing services directly to third parties for any
compensation without first obtaining the express written consent of the Licensor.
Licensee shall not, nor attempt to, reverse engineer, decompile, disassemble, modify,
reproduce, reverse assemble, reverse compile or otherwise translate the Software or
any part thereof.
3. LICENSOR’S RIGHTS – Licensee agrees that it will not assign, sell, sublicense,
transfer, pledge, lease, rent, or share the Software, the accompanying documentation
or Licensee's rights under this Agreement, nor delegate any of Licensee's obligations
under this Agreement. Any attempted assignment, sale, sublicense, transfer, pledge,
lease, rental or delegation shall be null and void. Licensee shall not utilize the
Software to provide image processing services directly to third parties for any
compensation without first obtaining the express written consent of the Licensor.
Licensee shall not, nor attempt to, reverse engineer, decompile, disassemble, modify,
reproduce, reverse assemble, reverse compile or otherwise translate the Software or
any part thereof.
4. RESTRICTED RIGHTS – Licensee will comply with all applicable laws, regulations,
treaties or other agreements in connection with its use of the Software and accompanying
documentation. Without limiting the foregoing, Licensee hereby covenants that neither the
Software and the accompanying documentation nor any information or know-how
embodied in such Software and accompanying documentation will be directly or indirectly
provided, transported or removed, or authorized to be provided, transported or removed,
in contravention of any export laws, regulations or decrees of the U.S. Government or any
agency thereof. This Agreement is subject to termination by Licensor in the event
Licensee fails to comply with any such laws, regulations or decrees.
5. LICENSE FEES – Subject only to section 8 of this Agreement, the license fees paid by
Licensee in consideration of the License granted under this Agreement are non
refundable and shall not be returned or credited to Licensee under any circumstance,
including, but not limited to any request for a pro rata refund by Licensee or any reason
for termination of this Agreement.
Page 58
4000189C.qxp
10/21/2004
7:51 AM
Page 59
Part 3: Licensing
6. TERM – This Agreement is effective upon Licensee's opening of the package containing
the Software, or upon Licensee's acceptance of this Agreement. This Agreement shall
continue thereafter until terminated. Licensee may terminate this Agreement at any time
by returning the Software and all copies thereof and extracts therefrom to Licensor.
Licensor may terminate this Agreement and revoke any License granted hereunder
upon the breach by Licensee of any term hereof. If the License granted hereunder is
terminated for any reason, upon notice of such termination, Licensee shall immediately
de-install the Software from the computer on which it is installed and shall certify to
Licensor in writing, under penalty of perjury of the laws of the United States of America,
that the Software is de-installed and all copies thereof have either been destroyed or
returned to Licensor. Any confidential, proprietary, or trade secret information or material
provided to Licensee in connection with the Software shall be immediately returned to
Licensor, unless otherwise specified by Licensor. The provisions of sections 2-5, 6, 7,
8-10, 12-16 and 19 shall survive any termination of this Agreement.
7. CONFIDENTIAL INFORMATION – Licensee hereby acknowledges that the Software
and any accompanying documentation contain confidential, proprietary, and/or trade
secret information belonging to Licensor. Licensee further acknowledges and agrees
that it shall not disclose the Software and any accompanying documentation to any
third party. Licensee further acknowledges and agrees that any written documentation
provided by Licensor to Licensee which contains a legend upon such documentation,
whether or not such legend be a single legend affixed upon a multiple page document,
which legend identifies such document to be either proprietary, trademarked, registered,
copyrighted, confidential and/or trade secret, shall impose a duty upon Licensee not to
disclose to any third party the documentation or any information contained within such
documentation, either in writing or orally, without the express written consent of
Licensor. Notwithstanding the foregoing provision, Licensor may notify Licensee in
writing within twenty (20) days after disclosure to Licensee of documents which do not
contain a legend identifying such documents to be either proprietary, confidential and/or
trade secret, that such documents disclosed were either proprietary, trademarked,
registered, copyrighted, confidential and/or trade secret in nature. Such notice shall
impose a duty upon the Licensee not to disclose to any third party such documentation
or any information contained with such documentation, either in writing or orally, without
the express written consent of Licensor. Licensee further acknowledges that any oral
information provided by Licensor to Licensee which information is identified or
summarized in writing within twenty (20) days after such oral disclosure to be either
proprietary, trademarked, registered, copyrighted, confidential and/or trade secret in
nature shall impose a duty upon Licensee not to disclose to any third party such
information disclosed by Licensor to Licensee, either in writing or orally, without the
express written consent of Licensor. The obligations of this section 7 shall not extend to
any information which is lawfully known to Licensee prior to receipt from Licensor or its
distributor; or enters the public domain through no wrongful act or breach of this
Agreement by Licensee; or is received by Licensee from a third party having a legal
right to disclose such information.
Page 59
4000189C.qxp
10/21/2004
7:51 AM
Page 60
Part 3: Licensing
8. LIMITED WARRANTY – Licensor warrants for a period of 90 days from the date of
commencement of this Agreement ("Warranty Period") that during the Warranty Period
the Software shall operate substantially in accordance with the functional specifications
in the User's Manual. LICENSOR FURTHER WARRANTS THAT DURING THE
WARRANTY PERIOD THE MEDIA WHICH CONTAINS THE SOFTWARE SHALL BE
FREE FROM DEFECTS IN MATERIAL AND WORKMANSHIP. LICENSEE'S SOLE
AND EXCLUSIVE REMEDY, AND LICENSOR'S AND/OR DISTRIBUTORS SOLE
LIABILITY ARISING FROM BREACHES OF THE ABOVE WARRANTIES IS THE
REPLACEMENT OF DEFECTIVE MEDIA OR, IN LICENSOR'S SOLE OPTION, TO
REFUND TO LICENSEE THE PURCHASE PRICE FOR THE DEFECTIVE SOFTWARE
AND DOCUMENTATION, PROVIDED THAT LICENSEE NOTIFIES LICENSOR IN
WRITING OF SUCH DEFECT AND RETURNS TO LICENSOR THE DEFECTIVE
MEDIA CONTAINING THE SOFTWARE AND THE DOCUMENTATION, DURING THE
ABOVE WARRANTY PERIOD.
EXCEPT AND TO THE EXTENT EXPRESSLY PROVIDED ABOVE, THE SOFTWARE
AND DOCUMENTATION WHICH ARE THE SUBJECT OF THIS AGREEMENT ARE
PROVIDED ON AN "AS IS" BASIS, WITHOUT ANY WARRANTIES OF ANY KIND,
INCLUDING ANY AND ALL IMPLIED WARRANTIES OR CONDITIONS OF TITLE,
NONINFRINGEMENT, MERCHANTABILITY, OR FITNESS OR SUITABILITY FOR
ANY PARTICULAR PURPOSE, WHETHER ALLEGED TO ARISE BY LAW, BY
REASON OF CUSTOM OR USAGE IN THE TRADE, OR BY COURSE OF DEALING.
IN ADDITION, LICENSOR AND DISTRIBUTOR EXPRESSLY DISCLAIM ANY
WARRANTY OR REPRESENTATION TO ANY PERSON OTHER THAN LICENSEE
WITH RESPECT TO THE SOFTWARE AND DOCUMENTATION WHICH ARE THE
SUBJECT OF THIS AGREEMENT. LICENSEE ASSUMES THE ENTIRE LIABILITY
FOR THE SELECTION AND USE OF THE SOFTWARE AND DOCUMENTATION,
AND LICENSOR AND/ OR DISTRIBUTOR SHALL HAVE NO LIABILITY FOR ANY
ERRORS, MALFUNCTIONS, DEFECTS, LOSS OF DATA, OR ECONOMIC LOSS
RESULTING FROM OR RELATED TO THE USE OF SOFTWARE AND/OR
DOCUMENTATION.
Page 60
4000189C.qxp
10/21/2004
7:51 AM
Page 61
Part 3: Licensing
9. LIMITATION OF LIABILITY – Notwithstanding any other provision of this Agreement,
the cumulative liability of Licensor and/or Licensor's suppliers, distributors and/or
agents to Licensee or any other party for any loss or damages resulting from any
claims, demands, or actions arising out of or relating to the Software, the accompanying
documentation and/or this Agreement shall not exceed that license fee paid to Licensor
by Licensee for the use of the Software and accompanying documentation. In no event
shall Licensor and/or Licensor's suppliers, distributors and/or agents be liable for any
indirect, incidental, punitive, consequential, special, or exemplary damages, for any lost
profits or savings, or for any loss of data or loss of use of equipment, even if Licensor
and/or Licensor's suppliers, distributors and/or agents have been advised of the
possibility of such damages and regardless of the form of action whether in tort, contract
or otherwise. SOME STATES DO NOT ALLOW THE LIMITATION OR EXCLUSION OF
LIABILITY FOR INCIDENTAL OR CONSEQUENTIAL DAMAGES, SO THE ABOVE
LIMITATION OR EXCLUSION MAY NOT APPLY TO LICENSEE.
10. TRADEMARK – ImaGene™, GeneSight™, and GenePie™ are registered trademarks
of Licensor. No right, license, or interest to such trademarks is granted hereunder, and
Licensee agrees that no such right, license, or interest shall be asserted by Licensee
with respect to such trademarks. VersArray Analyzer 5.0™, VersArray®, and Bio-Rad®
are trademarks of Bio-Rad Laboratories, Inc. No right, license, or interest to such
trademarks is granted hereunder, and Licensee agrees that no such right, license, or
interest shall be asserted by Licensee with respect to such trademarks.
11. NOTICE – All notices required or provided under the terms of this Agreement shall be
given in writing to all parties and may be delivered by First Class U. S. Mail, postage
prepaid; U.S. Registered Air Mail, postage prepaid; overnight air courier, courier
charges prepaid; or facsimile. Notices shall be effective as follows: five (5) calendar
days following mailing by First Class U.S. Mail, postage prepaid; seven (7) calendar
days following mailing by U.S. Registered Mail, postage prepaid; two (2) business days
following delivery by overnight courier; and two (2) business days following confirmation
of transmittal by facsimile. Any notices provided under this Agreement shall be given at
the address and/or facsimile number for the parties as set forth upon the sales
document for this License, unless change of such address and/or facsimile number has
been provided previously in writing.
Page 61
4000189C.qxp
10/21/2004
7:51 AM
Page 62
Part 3: Licensing
12. GOVERNING LAW AND VENUE – GOVERNING LAW AND VENUE. This Agreement
shall be construed and governed in accordance with the laws of the State of California,
without giving effect to any choice or conflict of law provision or rule. Licensor and
Licensee consent and agree that personal jurisdiction over them with respect to any
dispute arising as to this Agreement shall rest solely with the state or federal courts of
the State of California. Licensor and Licensee hereby expressly waive the right to bring
an action in any state or federal court other than the California state or federal courts
located within the County of Los Angeles. This Agreement shall not be governed by the
United Nations Convention on Contracts for the International Sale of Goods, the application of which is expressly excluded.
13. ATTORNEYS’ FEES – If any action is brought by either party to this Agreement against
the other party in an effort to enforce or effect any provision or language contained
within this Agreement, the prevailing party shall be entitled to recover, in addition to any
other relief granted, reasonable attorney fees and costs.
14. SEVERABILITY – If any provision of this Agreement shall be held illegal, unenforceable,
or in conflict with any law of a federal, state, or local government having jurisdiction over
this Agreement, the validity of the remaining portions or provisions hereof shall not be
affected thereby.
15. NO WAIVER – The failure of either party to enforce any rights granted hereunder or to
take action against the other party in the event of any breach hereunder shall not be
deemed a waiver by that party as to subsequent enforcement of rights or subsequent
actions in the event of future breaches.
16. ENTIRE AGREEMENT – Licensee acknowledges that it has read this Agreement,
understands it, and agrees to be bound by its terms. This Agreement and any
modifications made pursuant to it, constitutes the complete and exclusive written
expression of all terms of the Agreement between Licensor and Licensee, and
supersedes all prior or contemporaneous proposals, understandings, representations,
conditions, warranties, covenants, and all other communications between Licensor and
Licensee relating to the subject matter of this Agreement, whether oral or written. This
Agreement may not in any way be explained or supplemented by a prior or existing
course of dealing between Licensor and Licensee, by any usage of trade or custom, or
by any prior performance between Licensor and Licensee pursuant to this Agreement
or otherwise.
17. AMENDMENTS – No amendments or other modifications to this Agreement may be
made except by a writing signed by Licensor and Licensee.
Page 62
4000189C.qxp
10/21/2004
7:51 AM
Page 63
Part 3: Licensing
18. ACKNOWLEDGMENT – If Licensee is the U.S. Government or if Licensee is a contractor
or subcontractor (at any tier) of the U.S. Government and is licensing the Software for
use by the U.S. Government or in connection with any contract or other transaction with
the U.S. Government, Licensee acknowledges that by accepting delivery of the
Software, the U.S. Government agrees that the Software qualifies as commercial
computer software and that the accompanying documentation qualifies as commercial
computer software documentation within the meaning of the acquisition regulations and
contract clauses applicable to this procurement. The terms and conditions of this
Agreement are fully and exclusively applicable to the Government's use and disclosure
of the Software and accompany documentation, and shall supersede any conflicting
terms or conditions. No license of any kind is granted in the case of acquisitions which
contain or are subject to the clauses FAR 52-227.19 COMMERCIAL COMPUTER
SOFTWARE-RESTRICTED RIGHTS (JUNE 1987) or DFARS 252.227-7013 RIGHTS
IN TECHNICAL DATA AND COMPUTER SOFTWARE (OCT 1988) or any other clause
which purports to grant to the U.S. Government rights greater than, or additional to
those, set forth in this Agreement, or which purports to impose additional requirements
upon Licensor to make this Agreement effective, unless Licensor specifically so consents
by separate written agreement. Failing such agreement, and if this Agreement fails to
meet the U.S. Government's stated needs or is inconsistent in any respect with federal
law, the U.S. Government agrees to return the Software and accompanying
documentation, unused, to Licensor. The Contractor/Licensor/Manufacturer is
BioDiscovery, Inc., 100 North Sepulveda Blvd., Suite 1230, El Segundo, CA 90245.
19. INDEMNITY. – Licensee acknowledges that Licensor has no knowledge of, or control
over, the uses of the Software and accompany documentation made by Licensee.
Licensee agrees to defend, indemnify and hold Licensor harmless from and against
any and all losses, liabilities, damages, costs and expenses (including but not limited to
reasonable attorneys' fees) arising out of or related to any suit, claim or proceeding
relating to the use of the Software and accompanying documentation, including without
limitation any loss related to Licensee's failure to conform to the requirements of section
4 of this Agreement.
20. PATENTS.– This product is covered by one or more of U.S. Patent Nos. 6,349,144,
6,577,956, 6,633,659, 6,674,882, and 6,731,781. Purchase of the License to the
Software conveys to Licensee only the nonexclusive, non-transferable, revocable
internal right under the applicable aforementioned patent(s) to use, by Licensee only,
the Software only for research and non-diagnostic use and solely in accordance with
the terms and conditions of this Agreement. Licensor and its suppliers reserve all other
rights, and the Software may not be used in any manner other than as provided in this
Agreement.
Page 63
4000189C.qxp
10/21/2004
7:51 AM
Page 64
Part 3: Licensing
21. UPDATING. – Licensee acknowledges and agrees that the Software may communicate
via the Internet or other communications systems with Licensor's computer systems for
the purpose of checking the status of the License, checking the status of maintenance
for the Software, and/or determining if any fixes, updates and/or upgrades to the
Software are available. Licensee agrees and consents to any such communications
between the Software and Licensor's computer systems and the transfer of data
between the Software and Licensor's computer system. Licensee also agrees and
consents to, if applicable, remote configuration of the Software on Licensee's computer
systems.
Licensee acknowledges and agrees that the Software permits downloading of Software
fixes, updates and upgrades, and that such fixes, updates and upgrades may occur
without notice. Licensee agrees to install and use any and all such fixes, updates and
upgrades and, if applicable, discontinue use of the previous version of the Software.
Licensee agrees that any and all such fixes, updates and upgrades are and shall be
governed by this Agreement unless superseded by an agreement associated with such
a fix, update and/or upgrade.
21. PRIVACY.– Licensor believes that the personal information Licensee provides to
Licensor must be both kept private, and used in a responsible fashion. Licensor
consistently puts its best efforts towards achieving both these objectives. The updating
feature of the Software provides information (such as product serial number, operating
system information, product language, etc.) to Licensee for the purpose of checking the
status of the License, checking the status of maintenance for the Software, and/or
determining if any fixes, updates and/or upgrades to the Software are available and
Licensee agrees and consents that Licensor may store, process and use such
information for that purpose. Licensee agrees, that in the event that Licensor sells,
merges or otherwise re-organizes all or part of its business with another entity, the
other entity may have access to and process, store and use Licensee's information,
including the information collected through the updating feature of the Software, on the
same terms and conditions as set forth in this Agreement. Licensee agrees that
Licensor may process and/or store Licensee's information in United States databases.
Licensee permits Licensor to share Licensee's information within Licensor and transfer
it to countries in the world where Licensor does business. Licensee permits Licensor to
disclose Licensee's information when Licensor is required to do so by law.
Page 64
4000189C.qxp
10/21/2004
7:51 AM
Page 65
Part 4: Appendices
Part 4: Appendices
4.1 File Specifications
While VersArray Analyzer 5.0 Software is designed to be flexible with regards to
information imported and exported, you must adhere to certain standards regarding file
formats.
4.1.1 Gene ID File
The Gene ID file allows you to track information about the genetic material spotted at
each location within the array. This information will be saved along with the quantified
values in the text output file and visualization tools.
For example, you will be able to click on a GenePie from within GeneSight-Lite and see
the specific Gene ID associated with the selected spot in addition to all the other
detailed quantification information. To accomplish this, VersArray Analyzer 5.0 Software
needs the Gene ID file to associate a reference ID to each spot in the array of spots in
the image.
VersArray Analyzer 5.0 Software supports two formats for the Gene ID file. The first format will be familiar to existing VersArray Analyzer 5.0 Software users since the basic
structure is the same between versions. The second format is based upon the new
multi-level grid structure available in VersArray Analyzer. This new format takes advantage of the use of fields, or unique grid/meta grid structures. To deal with the unlimited
number of possible fields, and grid structures, an additional column needs to be added
to the Gene ID file.
Note: Choose the Gene ID format based on your array structure and preferences.
However, when creating the Gene ID file, do not combine the two formats in the same
file, as VersArray Analyzer 5.0 Software will not be able to process the hybrid file format.
Gene ID Format #1 (Traditional Format)
Listed below is a brief description of the various parts of the Gene ID file as well as the
precise syntax.
•
Header – Anything other than the Gene ID information located at the beginning of the
file. If you want to include header information, you must start each line with a percentage
sign, “%.” The percentage sign is an indication to VersArray Analyzer 5.0 Software not
to read this line as gene information but rather continue until a line is encountered
matching the structure found below.
Page 65
4000189C.qxp
10/21/2004
7:51 AM
Page 66
Part 4: Appendices
• Columns – Metarow Number (MR) / Metacolumn Number (MC) / Subgrid Row Number
(SR)/ Subgrid Column Number (SC) / Gene ID. Separator: You must use tabs to
separate the fields in each row.
•
Order – VersArray Analyzer 5.0 Software does not care about the order in which the
rows are sorted. It’s also not necessary to specify Gene ID information for all the spots
in the array.
•
Gene ID – The Gene ID field can be any alpha-numeric string (including blank spaces)
following the Subgrid Column Number. You can specify a database entry followed by
the gene name as one option.
•
Comment Lines – Use the percentage sign, “%,” to indicate comment lines.
•
Creating the Gene ID File – You can use any text processing program, spreadsheet,
or database program to generate the Gene ID file. You can also use the CloneTracker
software tool to generate this file. CloneTracker manages the information about cDNA
plates and the mapping of plates onto the slide. It can also generate the necessary
gene ID file to be used by VersArray Analyzer.
Insert the accession number followed by a colon and then insert the Gene ID name.
For example, all of the following are valid formats for the Gene ID File:
Header information
MR MC SR SC Gene ID
MR MC SR SC Ascension #
MR MC SR SC Ascension #: Gene ID
Note: The actual accession numbers are not provided nor determined by VersArray
Analyzer 5.0 Software or Bio-Rad. The information must either be located by you or
provided by the microarray chip manufacturer.
Gene ID Format #2 (VersArray Analyzer 5.0 Software Format)
The second format follows the same rules as the first except for the addition of a field
column:
•
Columns – Field/Metarow Number (MR) / Metacolumn Number (MC) / Subgrid Row
Number (SR)/ Subgrid Column Number (SC) / Gene ID.
Header Information
Field MR MC SR SC Gene ID
Field MR MC SR SC Ascension #
Field MR MC SR SC Ascension #: Gene ID
4.1.2 Output File
VersArray Analyzer 5.0 Software exports standard tab delimited text files when saving
data. The information below is intended to describe the general format of the text file and
explain particular fields therein. VersArray Analyzer 5.0 Software saves the quantified
Page 66
4000189C.qxp
10/21/2004
7:51 AM
Page 67
Part 4: Appendices
data from each image processed into individual text files. Due to the multi-image processing capability, VersArray Analyzer 5.0 Software no longer exports two channel ratio
data. Researchers are required to either generate any desired ratio information themselves or import the raw data into a data analysis program such as the GeneSight software tool. The data file is divided into two main parts. The first part is header
information about the parameters set for analysis. The second part of the file includes
the data extracted from the images.
Note: Due to the nature of tab delimited text files, wrapping of columns is common. To
easily view information, open the data files into a spreadsheet program such as
Microsoft Excel.
Begin Header
version 5.0
Date
Tue Mar 26 09:19:34 PST 2002
Image File
C:\BioDiscovery\VersArray Analyzer\Samples\1205_g.TIF
Page 0
Page Name
Invertedfalse
Begin Field Dimensions
Field Metarows
Metacols
Rows Cols
A
1
1
8
12
End Field Dimensions
Begin Measurement parameters
Segmentation Method auto
Signal Low
0.0
Signal High
0.0
Background Low
0.0
Background High
0.0
Background Buffer
3.0
Background Width
3.0
End Measurement parameters
Begin Alerts
Control Type
Minimum threshold
If tested Percentage allowed
If failed Maximum threshold
If tested Percentage allowed
If failed CV threshold
If tested If failed
hot
45000.0false
0.0% false
65000.0false
0.0% false
1.0
false
false
End Alerts
Begin Quality settings
Empty Spots
true
Threshold:
0.3
Poor Spots
true
Begin Poor Spots Parameters
Background contamination flag true
Threshold:
0.9995
Background tested against subgrid data only
true
Page 67
4000189C.qxp
10/21/2004
7:51 AM
Page 68
Part 4: Appendices
Signal contamination flag false
Threshold:
0.9995
Signal contamination test connected to background contamination threshold false
Ignored percentage flag true
Threshold:
25.0
Open perimeter flag
true
Threshold:
25.0
Shape regularity flag
true
Threshold:
0.65
Area To Perimeter Ratio flag
false
Threshold:
0.65
Offset flag
true
Threshold:
60.0
End Poor Spots Parameters
Negative Spots true
End Quality settings
End Header
Begin Raw Data
Field
Meta Row
Meta Column
Row
Column Gene ID Flag
Signal Mean
Background Mean
Signal Median Background Median
Signal Mode
Background Mode
Signal Area
Background AreaSignal Total
Background
Total
Signal Stdev
Background Stdev
Shape RegularityIgnored Area
Spot
Area
Ignored Median Area To Perimeter
Open Perimeter XCoord YCoord
Diameter
Position offset
Offset X Offset Y Expected X
Expected Y
CM-X
CM-Y CM Offset
CM Offset-X
CM Offset-Y
Min Diam
Max Diam
Control Failed Control
Background contamination presentSignal contamination present
Ignored % failed Open perimeter failed
Shape regularity failed
Perim-to-area failed
Offset failed
Empty spot
Negative spot
A
1
1
1
1
0
109.89393939393939
4.926565874730022
129.5 5.0
132.9090909090909
4.738562091503268
66.0
463.0 7253.0 2281.0 55.13623039946595
2.9050872336804874
0.584070796460177
0.0
66.0
NaN
1.0
0.0
33.427956043956044
21.692307692307704
9.0
0.3435990182607777
0.3298958928437372
0.09606760762402544 33.09806015111231
21.78837529993173
33.984848484848484
21.151515151515152
1.0917803796972039
0.8867883337361775
-0.6368601484165772
8.319720247072127
10.339058029748454
0
0
0
0
0
1
0
0
0
0
A
1
1
1
2
0
163.88571428571427
4.821350762527233
228.5 5.0
248.61111111111111
4.571428571428571
70.0
459.0 11472.0 2213.0 102.5569587883649
1.2165800511090508
0.6481481481481481
0.0
70.0
NaN
0.9773843811168245
0.0
55.77061338661339
21.72727272727274
9.0
0.2811541783968894
0.269943687738035
-0.07860074732736422 55.500669698875356
21.805873474600105
56.0
21.514285714285716
0.5782336652136307
0.49933030112464394 -0.29158776031438904 8.236983309361506
11.051234910005755
0
0
0
0
0
1
0
0
0
0
A
1
1
1
3
0 105.26470588235294 4.836776859504132
138.0 5.0
173.3 4.7482993197278915
68.0
484.0 7158.0 2341.0
68.92421619325587
Page 68
1.4288247004403603
4000189C.qxp
10/21/2004
7:51 AM
Page 69
Part 4: Appendices
4.1.3 ConFIGuration File
The conFIGuration file stores information about virtually all the parameters within
VersArray Analyzer. This file is a simple XML file format which is easily saved and
loaded from the VersArray Analyzer 5.0 Software Parameter Settings Window. While
the contents of this file are not important to most users, you should be aware that this
file is required for batch processing. Advanced users integrating VersArray Analyzer 5.0
Software into high throughput environments may also find the information useful.
Listed below is a sample VersArray Analyzer 5.0 Software conFIGuration file:
<?xml version=”1.0” encoding=”UTF-8”?>
<VersArray Analyzer_Parameters>
<IGNORED_MEDIAN>true</IGNORED_MEDIAN>
<PERIMETERTOAREA_FLAG>false</PERIMETERTOAREA_FLAG>
<BACKGROUND_FLAG>true</BACKGROUND_FLAG>
<POOR_FLAG>true</POOR_FLAG>
<PERIMETER_FLAG>true</PERIMETER_FLAG>
<PERIMETERTOAREA_THRESH>0.65</PERIMETERTOAREA_THRESH>
<TOLERANCE>5.0</TOLERANCE>
<STANDARD_LOW>5000.0</STANDARD_LOW>
<OFFSET_FLAG>true</OFFSET_FLAG>
<SHAPE_REGULARITY>true</SHAPE_REGULARITY>
<CONTROL_TYPE_LOWTHRESH_0>45000.0</CONTROL_TYPE_LOWTHRESH_0>
<NEGATIVE_FLAG>true</NEGATIVE_FLAG>
<BLANK_CV>5.0</BLANK_CV>
<IGNORED_AREA>true</IGNORED_AREA>
<POOR_THRESH>0.995</POOR_THRESH>
<CONTROL_TYPE_ID_0_0>Gene17</CONTROL_TYPE_ID_0_0>
<OFFSET_THRESH>60.0</OFFSET_THRESH>
<HOT_CV>3.0</HOT_CV>
<CONNECT_FLAG>false</CONNECT_FLAG>
<EMPTY_THRESH>0.3</EMPTY_THRESH>
<HOT_CHECK>false</HOT_CHECK>
<MEASURE_MEAN>true</MEASURE_MEAN>
<BACKGROUND_THRESH>0.9995</BACKGROUND_THRESH>
<MEASURE_STDEV>true</MEASURE_STDEV>
<CONTROL_TYPE_VARTHRESH_0>1.0</CONTROL_TYPE_VARTHRESH_0>
<MEASURE_AREA>true</MEASURE_AREA>
<PERIMETER_THRESH>25.0</PERIMETER_THRESH>
<STANDARD_CV>5.0</STANDARD_CV>
<AUTO_SEG>true</AUTO_SEG>
<CONTROL_TYPE_UPALERTTHRESH_0>0.0</CONTROL_TYPE_UPALERTTHRESH_0>
<CONTROL_TYPE_IFLOWALERT_0>false</CONTROL_TYPE_IFLOWALERT_0>
Page 69
4000189C.qxp
10/21/2004
7:51 AM
Page 70
Part 4: Appendices
<BLANK_LOW>0.0</BLANK_LOW>
<BACKGROUND_BUFFER>3.0</BACKGROUND_BUFFER>
<CONTROL_TYPE_NAME_0>hot</CONTROL_TYPE_NAME_0>
<EMPTY_FLAG>true</EMPTY_FLAG>
<MEASURE_MODE>true</MEASURE_MODE>
<ENFORCE_GRID>true</ENFORCE_GRID>
<OVERALL_FLAG>false</OVERALL_FLAG>
<MEASURE_TOTAL>true</MEASURE_TOTAL>
<SIGNAL_HIGH>1.0</SIGNAL_HIGH>
<PERIM_TO_AREA>true</PERIM_TO_AREA>
<SIGNAL_FLAG>false</SIGNAL_FLAG>
<BACKGROUND_WIDTH>3.0</BACKGROUND_WIDTH>
<BLANK_CHECK>false</BLANK_CHECK>
<ON_TOP>false</ON_TOP>
<CONTROL_TYPE_UPTHRESH_0>65000.0</CONTROL_TYPE_UPTHRESH_0>
<SIGNAL_THRESH>0.9995</SIGNAL_THRESH>
<FLEXIBILITY>0.0</FLEXIBILITY>
<FIND_NEGATIVES>false</FIND_NEGATIVES>
<SIGNAL_LOW>0.0</SIGNAL_LOW>
<STANDARD_HIGH>10000.0</STANDARD_HIGH>
<BACKGROUND_LOW>0.0</BACKGROUND_LOW>
<OFFSET>true</OFFSET>
<CONTROL_TYPE_IFUPALERT_0>false</CONTROL_TYPE_IFUPALERT_0>
<SPOT_AREA>true</SPOT_AREA>
<REGULARITY_THRESH>0.65</REGULARITY_THRESH>
<LOG_SCALE>false</LOG_SCALE>
<STANDARD_CHECK>false</STANDARD_CHECK>
<HOT_HIGH>100000.0</HOT_HIGH>
<REGULARITY_FLAG>true</REGULARITY_FLAG>
<CONTROL_TYPE_N>1</CONTROL_TYPE_N>
<MEASURE_MEDIAN>true</MEASURE_MEDIAN>
<CONTROL_TYPE_IFCVALERT_0>false</CONTROL_TYPE_IFCVALERT_0>
<CONTROL_TYPE_COLOR_0>-52429</CONTROL_TYPE_COLOR_0>
<IGNORED_FLAG>true</IGNORED_FLAG>
<CONTROL_TYPE_LOWALERTTHRESH_0>0.0</CONTROL_TYPE_LOWALERTTHRESH_0>
<OPEN_PERIMETER>true</OPEN_PERIMETER>
<CONTROL_TYPE_ID_N_0>1</CONTROL_TYPE_ID_N_0>
<BLANK_HIGH>1000.0</BLANK_HIGH>
<BACKGROUND_HIGH>1.0</BACKGROUND_HIGH>
<HOT_LOW>30000.0</HOT_LOW>
<IGNORED_THRESH>25.0</IGNORED_THRESH>
</VersArray Analyzer_Parameters>
Page 70
4000189C.qxp
10/21/2004
7:51 AM
Page 71
Part 4: Appendices
4.2 Technical Support
Bio-Rad is available to answer any questions that you have about VersArray Analyzer
5.0 Software. Your questions will be addressed promptly so you can focus on what is
most important - your research. Your VersArray Analyzer 5.0 Software serial number
will be requested when you contact technical support using any of the following methods:
Bio-Rad Technical Service Department
Phone: (800) 424-6723, option 2, option 3
Fax: (510) 741-5802
E-mail: [email protected] (U.S.)
[email protected] (International)
4.3 Warranty Information
Bio-Rad guarantees VersArray Analyzer 5.0 Software to be free from defects up to
30 days from the date of purchase. Bio-Rad will promptly address any problems you
may have through either technical support or by sending you a replacement copy of
VersArray Analyzer 5.0 Software.
Page 71
4000189C.qxp
10/21/2004
7:51 AM
Page 72
Bio-Rad
Laboratories, Inc.
Web site www.bio-rad.com USA (800) 4BIORAD Australia 02 9914 2800 Austria (01)-877 89 01 Belgium 09-385 55 11 Brazil 55 21 2527 3454
Canada (905) 712-2771 China (86-21) 63052255 Czech Republic + 420 2 41 43 05 32 Denmark 44 52 10 00 Finland 09 804 22 00
France 01 47 95 69 65 Germany 089 318 84-0 Hong Kong 852-2789-3300 Hungary 36 1 455 8800 India (91-124)-6398112/113/114, 6450092/93
Israel 03 951 4127 Italy 39 02 216091 Japan 03-5811-6270 Korea 82-2-3473-4460 Latin America 305-894-5950 Mexico 55-52-00-05-20
The Netherlands 0318-540666 New Zealand 64 9 415 2280 Norway 23 38 41 30 Poland + 48 22 331 99 99 Portugal 351-21-472-7700
Russia 7 095 721 1404 Singapore 65-6415 3188 South Africa 00 27 11 4428508 Spain 34 91 590 5200 Sweden 08 555 12700
Switzerland 061 717-9555 Taiwan (8862) 2578-7189/2578-7241 United Kingdom 020 8328 2000
Life Science
Group
Bulletin 3085
US/EG
Rev A
0104
Sig 1103
4000189 Rev C