1
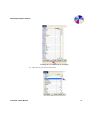
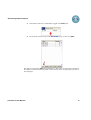
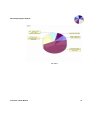
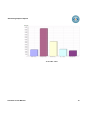
TM Visualizer Business Intelligence The Graphical-Analysis SecurityComponent of iSecurity Visualizer 3 User Manual Table of Contents Copyright Notice ............................................................................. i About This Manual .......................................................................... ii Who Should Read This Manual ....................................................................ii Terminology ..................................................................................................ii Documentation Overview .............................................................................ii Printed Materials .....................................................................................................ii On-Line Help ...........................................................................................................ii Typography Conventions ..............................................................................ii Chapter 2: Introducing Visualizer .................................................. 2 Overview .......................................................................................................2 Key Features and Benefits ............................................................................2 Installing Visualizer ......................................................................................2 Other iSecurity Products ...............................................................................3 Assessment ...............................................................................................................3 Audit .........................................................................................................................3 Action .......................................................................................................................3 Anti-Virus .................................................................................................................3 Firewall ....................................................................................................................3 View .........................................................................................................................4 Screen ......................................................................................................................4 Password ..................................................................................................................4 AP-Journal ...............................................................................................................4 Chapter 2: Working with Visualizer ............................................... 6 Working with Business Intelligence .............................................................6 Starting Business Intelligence .......................................................................6 The Business Intelligence Interface ..............................................................7 Generating Graphic Reports .........................................................................10 Copyright Notice © Copyright Raz-Lee Security Inc. All rights reserved. This document is provided by Raz-Lee Security for information purposes only. Raz-Lee Security© is a registered trademark of Raz-Lee Security Inc. Action, System Control, User Management, Assessment, Firewall, FileScope, Screen, Password, Audit, Capture, View, Visualizer, Anti-Virus, AP-Journal © are trademarks of Raz-Lee Security Inc. Other brand and product names are trademarks or registered trademarks of the respective holders. Microsoft Windows© is a registered trademark of the Microsoft Corporation. Adobe Acrobat© is a registered trademark of Adobe Systems Incorporated. Information in this document is subject to change without any prior notice. The software described in this document is provided under Raz-Lee’s license agreement. This document may be used only in accordance with the terms of the license agreement. The software may be used only with accordance with the license agreement purchased by the user. No part of this document may be reproduced or retransmitted in any form or by any means, whether electronically or mechanically, including, but not limited to: photocopying, recording, or information recording and retrieval systems, without written permission given by Raz-Lee Security Inc. Visit our web site at www.razlee.com. Record your details here. Computer Model Serial Number Authorization Code Visualizer 3 User Manual i About This Manual Who Should Read This Manual This manual is intended for system administrators and security administrators responsible for the implementation and management of security on System i systems. Terminology This manual attempts to adhere to standard IBM System i (AS/400) terminology and conventions whenever possible. However, deviations from IBM standards are employed in certain circumstances in order to enhance clarity or when standard IBM terminology conflicts with generally accepted industry conventions. Documentation Overview Raz-Lee takes customer satisfaction seriously. Therefore, our products are designed for ease of use. The documentation package includes a variety of materials to get you up to speed with this software quickly and effectively. Printed Materials This user guide is the only printed documentation necessary for understanding this product. It is available in user-friendly PDF format and may be displayed or printed using Adobe Acrobat Reader version 4.0 or higher. Acrobat Reader is included on the product CD-ROM. This manual contains concise explanations of the various product features as well as stepby-step instructions for using and configuring the product. On-Line Help System i context sensitive help is available at any time by clicking the F1 key. A Help window appears containing explanatory text that relates to the function or option currently in use. PC based on-line help is also available in JavaHelp format for display on a PC with terminal emulation. Typography Conventions This document is intended to be printed by the end user and viewed on-line using a variety of different PC platforms. Accordingly, it was written using standard Windows TrueType fonts that are installed on virtually all systems. You do not need to install any special fonts in order to view or print this document. Visualizer 3 User Manual Body text appears in 10-point Times New Roman. Menu options, field names, and function key names appear in Arial Bold. OS/400 commands, system values, data strings, etc. appear in Bold Italic. Key combinations are separated by a dash, for example: Shift-Tab. Referrals to chapters or procedures appear in Times New Roman Italic. ii Introducing Visualizer 1 Overview Chapter 1: Introducing Visualizer Overview Visualizer is an advanced data warehouse solution that allows IT managers to graphically analyze security-related system activity quickly and easily. Visualizer uses Business Intelligence techniques to process large quantities of transaction data with minimal storage requirements. This process eliminates the need for time-consuming log scanning and tracking activities that tie up system resources and increase IT operating costs. With most security analysis products, the system administrator faces a “needle in a haystack” search task in order to analyze security breaches or other critical system activity. Visualizer makes the whole process painless, simple, and cost-effective. Visualizer presents the user with a user-friendly, JAVA-based GUI, making the whole process a snap, even for technologically-challenged users. The user simply points, clicks, and drags the appropriate parameters to the filter section of the GUI and a stunning pie chart appears in seconds that tells the whole story. Want to tweak the analysis a bit? Simply mouse a few changes and the revised results appear like magic. Visualizer is available in versions that work with Firewall, Audit, and Screen. Key Features and Benefits Installing Visualizer User-friendly, intuitive GUI Lightning fast operation - does not waste precious system resources Report generator creates statistical reports with rich graphics Works with all significant data elements associated with each transaction type Queries may be saved and re-used as necessary Available in Firewall, Audit, and Screen versions 1. Enter the installation CD into your PC and navigate to the GUI library. 2. Click the GUI installation file and follow any further instructions. 3. Go to Start/Programs/iSecurity and enter code. Visualizer 3 User Manual 2 Other iSecurity Products Other iSecurity Products Raz-Lee’s iSecurity is an integrated, state-of-the-art, security solution for all System i systems, providing cutting-edge tools for managing all aspects of network access, data, and audit security. Its individual components work together transparently, providing comprehensive “out-of-the-box” security. Other iSecurity products include: Assessment Assessment checks your ports, sign-on attributes, user privileges, passwords, terminals, and more. Results are instantly provided, with a score of your current network security status with its present policy compared to the network if iSecurity were in place. Audit Audit is a security auditing solution that monitors System i events in real-time. It includes a powerful query generator plus a large number of predefined reports. Audit can also trigger customized responses to security threats by means of the integrated script processor contained in Action. Action Action automatically intercepts and responds to security breaches, system activity events, QHST contents, and other message queues. Inquiring messages can be automatically answered. Alerts are sent by e-mail, SMS, pagers, or the message queues. Command scripts with replacement variables perform customized corrective actions, such as terminating a user session or disabling a user profile. Anti-Virus Anti-Virus provides solid virus protection that prevents your System i from becoming an infection source. Anti-Virus automatically scans and examines all incoming IFS files, validating and checking them as they are enrolled or modified. Anti-Virus authenticates them, and finally quarantines or erases infected files. Firewall Firewall protects and secures all types of access, to and from the System i, within or outside the organization, under all types of communication protocols. Firewall manages user profile status, secures entry via pre-defined entry points, and profiles activity by time. Its Best Fit algorithm determines the validity of any security-related action, hence significantly decreasing system burden while not compromising security. Visualizer 3 User Manual 3 Other iSecurity Products View View is a unique, patent-pending, field-level solution that hides sensitive fields and records from restricted users. This innovative solution hides credit card numbers, customer names, etc. Restricted users see asterisks or zeros instead of real values. View requires no change in existing applications. It works for both SQL and traditional I/O. Screen Screen protects, from unauthorized use, unattended terminals and PC workstations left active. It provides adjustable, terminal- and user-specific time-out capabilities. Locking is established either by user or terminal name. Password Password ensures that user passwords cannot be easily cracked and guessed. This solution enables you to protect your data from prying eyes and data thieves. AP-Journal AP-Journal automatically manages database changes by documenting and reporting exceptions made to the database journal. Visualizer 3 User Manual 4 Working with Visualizer 2 Working with Business Intelligence Chapter 2: Working with Visualizer Working with Business Intelligence Business Intelligence is an advanced data warehouse solution that allows IT managers to graphically analyze security related system activity quickly and easily. Business Intelligence uses a techniques to process large quantities of transaction data with minimal storage requirements. This process eliminates the need for time consuming log scanning and tracking activities that tie up system resources and increase IT operating costs. With most security-analysis products, the system administrator faces a “needle-in-a-haystack” search task in order to analyze security breaches or other critical system activity. Business Intelligence makes the whole process painless, simple, and cost-effective. Business Intelligence presents a user-friendly interface, making the whole process a snap. Simply point, click, and drag the appropriate parameters to the filter section and a stunning pie chart appears in seconds that tells the whole story. Want to tweak the analysis a bit? Simply mouse a few changes and the revised results appear like magic. Starting Business Intelligence To open and begin working with Business Intelligence, follow this procedure. Visualizer 3 User Manual 1. Click the Business Intelligence plus to open the navigation tree. 2. Click Collect Statistical Data 6 The Business Intelligence Interface collect statistical data 3. Select Audit or Firewall to collect statistical data for, and click Collect. 4. Select maximum items to retrieve and initial filter for number of days. 5. Double-click Firewall or Audit to work with the Business Intelligence tool of the product. The Business Intelligence Interface The following screen-shot is the main interface window for Business Intelligence, the graphic-analysis security component of iSecurity. The table below provides a description of the main components. Visualizer 3 User Manual 7 The Business Intelligence Interface Business Intelligence (main interface) Number Name Description 1 Toolbars The toolbar enables you to perform basic navigation tasks. New = Creates and opens a new filter tab (see Filter Tabs) Open = Opens a previously-saved filter Save as = Enables you to save filter data Delete = Delete a filter Report = Generates an HTM report 2 Filter Tabs Enables you to navigate between open filters 3 Filter Pane Area where filters are displayed Visualizer 3 User Manual 8 The Business Intelligence Interface Number Name Description 4 Data Pane Toolbars Toolbar that enables you to work with the Data Pane 5 Data Pane Area where Dimension data is displayed. Print Table = Print data Search = Search and add to the filter Apply Filter = Click to apply selection to the filter. Refresh = Click Refresh after the fetch size has been modified. Maximum items to retrieve = the fetch size can be set at any time from within the visualizer. This way you can gradually increase the amount of data being retrieved making it less prone for a long task. 6 Dimensions These criterion enable you to choose how you want to sort and display your data. Date = Sorts system activity according to date System = Select the system you want to work with User = Sorts system activity according to user Server = Sorts system activity according to server Function = Sorts system activity according to function, such as OPEN, DELETE, etc. IP = Sorts system activity according to IP address Library = Sorts system activity according to library Object = Sorts system activity according to object Result = Sorts system activity according to Allow or Reject 7 Status Bar The Status Bar, divided into three parts, displays valuable system information. 1. Number of members (units of information-each displayed on a different line) selected, out of total members. 2. Number of entries (entries to the system) selected, out of total number of entries. 3. IP address of computer. Visualizer 3 User Manual 9 Generating Graphic Reports Number Name Description 8 Pie Chart The colorful, pie-shaped representation of your security and system data. Display also in a vertical and horizontal bar chat. Generating Graphic Reports NOTE: Visualizer works with a statistical file installed on your system. Therefore, all dates listed in the Date dimensions (the default opening setting) in the Data pane will be from when the first entries were made to your system. 1. Phrase the data you want to display in this form: (examples). This is known as a Business Intelligence query. Date according to user (a particular user’s entries covering all dates) Server according to function (a particular function’s entries broken down into a list of the different servers that performed that function) Result according to IP (an IP address listed by how many entries were allowed/ rejected) 2. Make sure the Filter pane is empty, then click the Dimension tab of the second part of the Business Intelligence query. 3. Find the specific data in the list and select it. Note that the Filter pane immediately displays this information. 4. Click the Dimension tab of the first part of the Business Intelligence query. Your query is displayed in the Data pane. The first example listed, date according to user, is shown this way. 1. Click the User Dimension tab. Visualizer 3 User Manual 10 Generating Graphic Reports Clicking the User Dimension tab (example) 2. Select the user you want to learn about. Visualizer 3 User Manual 11 Generating Graphic Reports 3. Note that this selection is immediately logged in the Filter pane. 4. Click the tab of the first part of the Visualizer query (in this case, Date). The dates are listed in the Data pane immediately or after a few seconds. Next to the date is the number of entries that the user made on each of those dates; the appropriate pie chart is also displayed. Visualizer 3 User Manual 12 Generating Graphic Reports Pie Chart Visualizer 3 User Manual 13 Generating Graphic Reports Vertical Bar Chart Visualizer 3 User Manual 14 Generating Graphic Reports Horizontal Bar Chart Visualizer 3 User Manual 15 Generating Graphic Reports Visualizer 3 User Manual 16