1
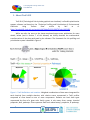
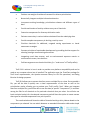
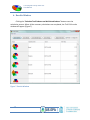
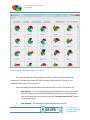
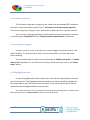
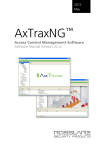
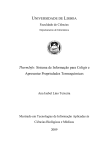
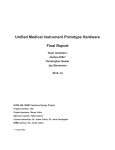
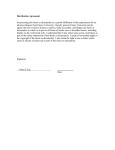
The University of North Carolina at Chapel Hill Gillings School of Global Public Health Version 1.3 TOXICOLOGICAL PRIORITY INDEX GUI User Manual Toxicological Priority Index GUI User Manual October 16, 2009 Table of Contents 1. About ToxPi GUI .................................................................................................................................... 3 2. ToxPi GUI Installation and Requirements ............................................................................................. 7 3. Home screen ......................................................................................................................................... 8 4. Data format ......................................................................................................................................... 10 5. Slices Information Window ................................................................................................................. 11 6. Results Window .................................................................................................................................. 15 6.1 Chemical window .............................................................................................................................. 18 6.2 Chart Window ................................................................................................................................... 20 6.2.1 Confidence intervals .................................................................................................................. 21 6.2.2 Zooming and Dragging ............................................................................................................... 21 6.2.3 Highlighting the Data ................................................................................................................. 21 7. Description of ToxPi Bootstrapping Algorithm. .................................................................................. 22 2 Toxicological Priority Index GUI User Manual October 16, 2009 1. About ToxPi GUI ToxPi GUI (Toxicological Priority Index graphical user interface) is a flexible prioritization support software tool based on the “Endocrine Profiling and Prioritization of Environmental Chemicals Using ToxCast Data” article by Reif et al. (http://ehsehplp03.niehs.nih.gov/article/info%3Adoi%2F10.1289%2Fehp.1002180). While we refer the users to the above-mentioned open-access publication for more details, below (and in Section 7 of this Manual) we briefly describe the mathematical transformations of the data performed by the software. The framework for this profiling and prioritization system is detailed in Figure 1. Figure 1. ToxPi definitions and notation. Weighted combinations of data were integrated for each chemical from multiple domains, with relative scores represented in ToxPi profiles composed of slices based on one or more components. Domains are basic data types represented by slices of a given color family: green, in vitro assay slices; orange, chemical properties; blue, pathways. Slices represent data from related assays, properties, or pathways, 3 Toxicological Priority Index GUI User Manual October 16, 2009 including AR, ER, TR, and seven other slices (see Reif et al. Environ Health Perspect 118:17141720, 2010 for a full description). Ninety assays, two properties, and 27 pathways make up the 119 components of this endocrine ToxPi (e.g., the ERα transcription factor assay is one of six components in the ER slice). The number of components in each slice is shown in parentheses. ToxPi profiles for bisphenol A and tebuthiuron are shown as examples of high- and low-ranked chemicals. (Modified from Reif et al. Environ Health Perspect 118:1714-1720, 2010). Specifically, ToxPi is a dimensionless index score that is calculated for each chemical as a weighted combination of all data sources that represents a formalized, rational integration of information from different domains. Visually, ToxPi is represented as component slices of a unit circle, with each slice representing one piece (or related pieces) of information (Figure 1). For each slice, distance from the origin (center) is proportional to the normalized value (e.g., assay potency or predicted bioavailability) of the component data points composing that slice, and the width (in radians) indicates the relative weight of that slice in the overall ToxPi calculation. For example, in Figure 1, the slice representing ER assays for bisphenol A (BPA) extends farther from the origin than the corresponding slice for tebuthiuron, indicating that BPA is more potent across ER assays than is tebuthiuron. In the implementation presented here, all 10 slices are weighted equally in the overall ToxPi calculation, so the graphical width of all slices is equal to the angle, θ, formed by dividing 2π radians into 10 sections, or 2π/10 = π/5 radians = 36 degrees. Figure 2 is a schematic that details how data are translated into ToxPi scores. For this application, the chemical-wise slice results are normalized to the interval [0,1] by dividing each chemical result by the slice maximum, where results represent relative potency (in vitro assays), bioavailability (chemical properties), or perturbation score (pathways). Values closer to the unit score (equal to 1) translate to higher potency, higher predicted bioavailability, or greater pathway perturbation relative to all other chemicals. Conversely, values closer to the origin (equal to 0) translate to lower potency, lower bioavailability, and lesser pathway perturbation across the corresponding domains. Values at zero (i.e., slices not extending at all from the origin) translate to “inactive/no activity.” As conveyed by the equal radial width of all slices in Figure 1, the slices are not differentially weighted for this implementation. However, by using a smaller number of targeted components in the AR, ER, and TR slices, individual component assays within these slices exert a greater influence over that slice’s composite score than do individual assays from one of the larger slices for other NRs or XME/ADME. 4 Toxicological Priority Index GUI User Manual October 16, 2009 Figure 2. Translation of results into ToxPi score profiles. The concentration–response curves for each of the six assays in the ER slice are shown for three example chemicals. On each curve, the red asterisk represents the AC50 (potency) for assay “hits,” and flat blue lines indicate assays that are inactive for that chemical. For nonassay slices, the same procedure is followed, with AC50 values replaced by particular chemical property values, pathway scores, and so forth. Abbreviations: 2,4‑D, 2,4‑dichlorophenoxyacetic acid; max, maximum; MXC, methoxychlor. (Modified from Reif et al. Environ Health Perspect 118:1714-1720, 2010). In summary, this tool is designed to incorporate diverse sources of information (e.g., a chemical’s bioactivity profiles, inferred toxicity pathways, dose estimates, exposure data, chemical structural descriptors, etc.) into easy-to-understand output. The ToxPi GUI was designed to help quickly import, analyze, visualize, highlight and export diverse data. The output can be used to: Calculate the comprehensive toxicity potential of a chemical. Provide a visual that represents relative contribution of each data domain. 5 Toxicological Priority Index GUI User Manual October 16, 2009 Enable a new weight-of-evidence framework for diverse prioritization. Numerically integrate multiple information domains. Incorporate existing knowledge, prioritization schemes and different types of data. Provide multivariate of toxicity relative to any set of chemicals. Customize components for diverse prioritization tasks. Estimate uncertainty in various indices calculated from the underlying data. Provide complete transparency in deriving a toxicity score. Prioritize chemicals for additional, targeted testing experiments or tiered assessment strategies. Promote principles of sustainable development by providing decision support for selecting amongst manufacturing alternatives. Integrating novel data streams, such as environmental exposure metrics or socioeconomic status, into decisions. Facilitate arguments on chemical similarity (i.e. “read across” of ToxPi profiles). ToxPi GUI is written in Java in order to provide cross-platform compatibility and can be used on any computer where Java is installed. The application uses the JFreeChart package for ToxPi chart representation, the Apache commons library for CSV file operations, and Swing libraries for design purposes. ToxPi GUI allows you to extract data from one or multiple files at a time. Once you add a file, you will be able to quickly see a visual representation of the data as well as the prioritization results, allowing you to preview your ToxPi profile “pies”. When you integrate data from multiple files, you will be able to see the data (or specific “components”) in common among the files for all chemicals or for particular chemicals that you select. You will also see basic statistical analysis for the selected components and will have the option to create custom data types for selected components from your input file. The results window will show the table of chemical toxicity priority indexes based on the components you selected. You can switch between an extended information table and a simple 6 Toxicological Priority Index GUI User Manual October 16, 2009 image table. The chart visualization option allow users to focus on a particular chemical or sets of chemicals, zoom into a specific area of the ToxPi chart, highlight any specific chemicals, and browse from one chemical to another by simply dragging the plot. All information can be saved in the form of shareable input files and/or graphical output. The following sections detail implementation, usage, and capabilities of the ToxPi GUI. 2. ToxPi GUI Installation and Requirements In order to use ToxPi GUI you need to have Java installed on your machine. You can download Java for free from this website http://www.java.com/en/. For version 1.1 and later, users can choose between a Windows executable file or a Java JAR file. We recommend using the Windows EXE file on Windows OS and the JAR on any other OS. For some big datasets users can face memory errors. If you see those errors, use the Java JAR file but set the memory size for the application using the following string in command the line: java –Xmx1500m –jar path_to_jar_file, where path_to_jar_file is a system path to the location where you saved the ToxPi v1.2.jar file. After you have successfully installed Java you can double click on the ToxPi.jar file in order to launch the application. The most recent version of ToxPi GUI is located on the website http://comptox.unc.edu/resources.html. If you have trouble running the location on Windows OS please verify that your JAVA_HOME system variable is pointing to the installation directory. To do so, click “Start” and then right-mouse-click on the “My Computer” or “Computer” item. Select “Properties” in the list. On the next window locate the ”Advanced System Settings” button and click it. Next locate the “System Variables” button and click it. Look inside the “System Variables” list for JAVA_HOME record. If you cannot find it then click the “New” button and enter JAVA_HOME as a Variable name and path to your java folder as a value. Usually the path will look like c:\Program Files\Java\jre6\bin. 7 Toxicological Priority Index GUI User Manual October 16, 2009 3. Home screen Figure 3. ToxPi GUI home window. Once you have opened the application, you will see the ToxPi GUI main screen, which allows you to select the files and chemicals to work with (See Figure 3). To select your input data file, click on the “Add Data File” button. The file browsing dialog box should appear. Browse to your data file, select it, and click “Open”. See Section 4 for information on how the input data file should appear. For a bigger file, you will see the loading window with the progress bar indicating the amount of data already processed. Please note that all the files will be checked for duplicated chemicals and components. When there are duplicates, the error window will appear indicating the name of the duplicates so you can easy locate and delete repeated data from your file or resolve the error as-needed. You can remove a file from the list by selecting it and pressing the “Remove File” button. 8 Toxicological Priority Index GUI User Manual October 16, 2009 At this point, you should see the list of the chemicals and list of the components from the file you loaded in the left side of the window under “Available chemicals” and “Available components”, respectively. You can add one chemical or multiple chemicals to your analysis by selecting a chemical from the left “Available Chemicals” list and pressing the “Add” button. If you’d like to add and analyze all available chemicals, click the “Add all” button. To remove chemicals from your analysis list, select chemicals from the “Selected chemicals” list and click the “Remove” button or the “Remove all” button to clear the list (see Figure 4). Figure 4. Available chemicals and Selected chemicals Note: in the case of multiple input files, only common components for all selected files and chemicals will be added to the right “Available components for selected Chemicals” list. For example: You have added two files, F1 and F2, each containing different chemicals. F1 has data for components C1 and C2 on chemical A and F2 contains data for components C1 and C3 on chemical B. If you select both chemicals A and B, then in the list of “Available components for selected chemicals” you will only see component C1 as it would be the only component for which we have data for both chemicals. 9 Toxicological Priority Index GUI User Manual October 16, 2009 “Recreate data from file” allows you to quickly get to the results of the analysis without selecting any components. The results will be based on the input file and will be an exact visual representation of the input file. This option is available when only one file is added to the list of files to analyze. “Next step (formation of slices)” proceeds to a window where you will be able to select different combinations of slices, components, types, colors, weights, and scaling methods for your ToxPi analysis. 4. Data format Data in the input data file should be separated using “,“ (comma) delimiter. The file extension should be “.csv”. You can see the required data format in the example data files provided here: http://comptox.unc.edu/toxpi.php Those values will be treated as missing Row 1: Slice weight Row 2: Slice name Row 3: Slice type Row 5: Component name Figure 5. Input file format Row 4: Component source id Please note that any values that are below zero or are not numbers will be ignored and treated as a missing data. 10 Toxicological Priority Index GUI User Manual October 16, 2009 Properly formatted data files that are created outside the GUI can be analyzed using the one-step “Recreate data from file” button. Files saved from within the GUI can also be edited outside the GUI and reloaded as new input files. When creating original data files outside of the GUI, note that all columns having the same slice name (Row 2) will be aggregated into a single slice by the ToxPi algorithm. 5. Slices Information Window After you click “Next step (formation of slices)”, you will see the window where you can control the inputs and information that will be used in the ToxPi analysis. Figure 6. Slices Information Window In the window shown in Figure 6, you can add a new slice by clicking “Add new slice”, preview the slices by clicking “Preview your slices”, and start the analysis calculation by clicking “Calculate ToxPi scores and build visualizations”. 11 Toxicological Priority Index GUI User Manual October 16, 2009 Initially you will see one slice in the window. You can set some unique name for the slice by rewriting the text in the “Enter slice name:” field. In the “Select slice type” area you will see the possible types based on the data from your input file. You can create your custom type by selecting “Custom” and entering the type name in the field below. You can select the slice color by clicking on the colored rectangle below the “Select color:” text. There are predefined color sets for five base types (although these can be manually adjusted): Assay – gradient of green color Pathway – gradient of blue color ChemProp – gradient of orange color Exposure – gradient of gray color ToxRefDB – gradient of purple color Custom type – gradient of red color Starting from version 1.2 all the colors and scaling types defined by user will be stored into the output CSV file. One can reproduce exactly the same results by selecting previously saved files. You can set the slice weight in relation to other slices by dragging the slider in the “Slice weight” area to a value from 1 to 25. The weight will be displayed as a percent relative to the overall ToxPi and as absolute values. The weight controls the width of the slice (i.e., slices with higher weights will be wider than slices with lower weights). In the “Select components” area you will be able to select the components you want to add to a given slice. You can search for some particular components using the “Search” field. The matches will be highlighted in the components list. In the “Select scaling type” area you will be able to select a scaling option for the data in the components. There are 6 scaling types allowed: -log10(x)+6 : Component values are scaled using the formula 1* log 10 ( x) 6 . This scaling is intended for ToxCast-style data, where values represent the micromolar concentration at which half-maximal assay activity was achieved (i.e. the “hit” concentration). The convention is to assign negative (i.e. “no hit”) results the value = 10 6. Therefore, this 12 Toxicological Priority Index GUI User Manual October 16, 2009 scaling inverts a micromolar activity concentration into a log-scaled measure of “potency”, where larger numbers indicate higher potency (i.e. lower concentration at which a “hit” was observed). -log10(x)+log10(max(x)) : Component values will be scaled using the formula 1* log10 ( x) log10 (max( x)) . This scaling is intended for data where values represent a level at which activity was defined (e.g. a concentration level observed as a “hit” for assay data). The max(x) portion of the equation is for data with any top end/”not-active” definition. Otherwise, the interpretation is similar to the +6 scaling above, where higher scaled values indicate higher hazard/concern/etc. This scaling is appropriate for input data that represent components where smaller numerical values should have larger ToxPi slices (e.g. assay potency estimates or measured distance from some source hazard). hit count : Component values will be treated as binary data, meaning that all non-zero values will be replaced with ones, and all zeros will remain zeros. This scaling is appropriate for input data represented occurrence/counts, or where the absolute numerical value is less important than whether or not an event was observed. For thresholds, this scaling type could be applied to input data that has been “zeroed” prior to loading in the GUI. -ln(x)+max(x) : Component values will be scaled using the formula 1* ln( x) ln(max( x)) . This scaling is the natural log alternative to the log base 10 scaling and is intended for data where values represent a level at which activity was defined (e.g. a concentration level observed as a “hit” for assay data). The max(x) portion of the equation is for data with any top end/”not-active” definition. This scaling is appropriate for input data that represent components where smaller numerical values should have larger ToxPi slices (e.g. assay potency estimates or measured distance from some source hazard). The natural log should be used when the input data represent exponential decay or some quantity where scaling by orders of magnitude is not desired. 13 Toxicological Priority Index GUI User Manual October 16, 2009 sqrt(x) : Component values will be scaled by taking the square root of the original value. The square root transformation is most often used for count data. linear(x) : No scaling will be applied. This is the default scaling, and is the appropriate choice for input data that should be represented by larger ToxPi radii for larger numbers. All input data scaling occurs prior to ToxPi normalization. Because ToxPi normalization converts all component numeric values in a given slice into relative ToxPi index values (visualized as profiles), the GUI software is agnostic as to the interpretation of the radial length of those slices. Restated: If the user maintains linear(x) scaling (i.e. no scaling) for all input data, larger numbers will translate into longer slices. For a particular input component, if the goal is to “flag” the largest numbers in a set by drawing ToxPi slices with long radii, then linear(x) scaling is appropriate. Conversely, if the goal is to “flag” the smallest numbers (e.g. input data are lowest-effective-concentrations, IC50s, AC50s), then one of the negative log or negative ln scaling would be appropriate. Users can always implement whatever scaling is appropriate for their data prior to importing files into the GUI, with the only exception being that negative values will be interpreted as “missing”. In the case that <0 values have meaning other than “missing”, users should take care to properly scale all component columns containing negative data prior to importing the data into the GUI. For example, the minimum (“most negative”) value in a given column should be added to all values in that column. You will see some basic summary statisticals of the included components in the “Selected data analysis” field. You can remove entire slices by clicking “Remove this slice”. 14 Toxicological Priority Index GUI User Manual October 16, 2009 6. Results Window Clicking the “Calculate ToxPi indexes and build visualizations” button starts the calculation process. When all the necessary calculations are completed, the ToxPi GUI results window will appear (Figure 7). Figure 7. Results Window 15 Toxicological Priority Index GUI User Manual October 16, 2009 Figure 8. Results Window (Images only view) The results window will initially display the table of all the chemicals used for the calculations. The table will contain the ToxPi pie image, Chemical name, Source ID, and calculated ToxPi score for each chemical. Above the table you will see five buttons and two radio controls. The buttons are: Save data file – This will save your data. You will be asked to select or enter the file name where the current data will be saved, and later, the saved file can be used to recreate your current results using the “Recreate data from file” button on the home screen. Save selected – This will save only selected chemicals into a file. 16 Toxicological Priority Index GUI User Manual October 16, 2009 Save selected image – This will save images in one file for selected chemicals Save image of all - This will save images of all chemicals in a single PNG file, sorted by ToxPi score Display chart – This will display the ToxPi chart in a new window. Radio controls allow you to switch between different views of your results data. Extended information will be displayed when “All data” (See Figure 7) is selected, while only images will be displayed if “Images only” (See Figure 8) is selected. Click on a ToxPi image on either table (extended or images only), a new window will appear containing detailed information about the selected chemical (See Figure 9). 17 Toxicological Priority Index GUI User Manual October 16, 2009 6.1 Chemical Window 19.7% of the data is missing for this particular slice. The color is light grey. Upper 95% confidence interval limit Lower 95% confidence interval limit Upper and Lower 95% CI limits match the actual ToxPi score, meaning that all the components used in this slice have exactly the same values. Color usually represents the type of data used and is chosen for each slice. No missing data, or the amount of missing data is less than 10% Name of the chemical [Source ID : CASRN] Legend for missing data values Figure 9. Chemical Information Window 18 Toxicological Priority Index GUI User Manual October 16, 2009 The chemical information window will contain a ToxPi pie image with 95% confidence intervals (CI) highlighted for each slice (upper limit – black dashed line, lower limit – white dashed line). The core of the image represents the amount of missing data, denoted by the color (the lighter the core, the lower the amount of missing values). You can open multiple Chemical information windows simultaneously. One can see the Pie Chart without missing data “core” and/or without 95% confidence intervals by unchecking boxes on the “Data display settings” window. This window will appear upon selecting “Settings”->”Data display settings” menu on the main window (See Figure 3) Multiple chemical information windows can be open simultaneously. User can save your image by clicking “Save image” and specifying the file name. The image will be saved in PNG format with a transparent background and publication ready quality. You can close the window by clicking the “Close” button. 19 Toxicological Priority Index GUI User Manual October 16, 2009 6.2 Chart Window Figure 10. ToxPi Chart Window The ToxPi chart window shows a distributional plot of the chemicals, based on the ToxPi scores on the X-axis and ranked chemicals on the Y-axis. The actual calculated ToxPi score for each chemical will be represented as red dots. One can use computer mouse scroll to zoom in/zoom out and click-drag to move the plot. Also user can use “Zoom in” and “Zoom out” buttons for detailed view. User can save the plot image by clicking the “Save plot” button. The image saved will reflect the contents of the window at the time of saving. One can save the data represented by the plot by using “Save plot data” or “Save selected data”, both of this options will create CSV file. 20 Toxicological Priority Index GUI User Manual October 16, 2009 6.2.1 Confidence intervals The horizontal orange bars, along the X-axis, indicate the bootstrapped 95% confidence interval for a particular chemical (see Section 7: Description of ToxPi Bootstrapping algorithm). The vertical orange bars, along the Y-axis, indicate the ranking interval for a specific chemical. You can show or hide the confidence intervals and/or the ranking intervals by checking or unchecking the “Display 95% CI” and “Display chemical ranked interval” check boxes. 6.2.2 Zooming and Dragging In order to zoom in or out on the plot, you are encouraged to use your mouse or track pad scroll wheel. To move the plot to the area you are interested in, click your left mouse button and drag. You can disable zoom for either axis by unchecking the “Enable zoom X-axis” or “Enable zoom Y-axis” checkboxes. To reset the zoom and return to the initial view, click on the “Reset zoom” button. 6.2.3 Highlighting the Data In order to highlight specific data, simply click on the red dot representing the chemical you are interested in. The highlighted chemical should become blue and will be highlighted in the results table as well. You can also select chemicals in your results table and then see the selected chemicals highlighted blue on the chart plot. To unselect chemicals click on your selections and the dot should change color from blue to red. Alternatively one can use “Reset selection” button to clear all selections. 21 Toxicological Priority Index GUI User Manual October 16, 2009 7. Description of ToxPi Bootstrapping algorithm. Confidence intervals for the ToxPi score of each chemical are generated by bootstrapping the values within each slice. The assay values within each slice are sampled with replacement, and these resampled values are used to calculate a bootstrap ToxPi statistic. This bootstrap ToxPi statistic is calculated exactly as the original statistic, but on the resampled data. This process is repeated 1000 times, and these 1000 or more bootstrap statistics are used to assess the stability of the estimated ToxPi score for the chemical. In particular, a 95% confidence interval for the ToxPi score is generated in the standard way: the lower bound is given by the 2.5 percentile in the bootstrap statistics and the upper bound is given by the 97.5 percentile of the bootstrap statistics. Intuitively, the width of the confidence interval for a chemical depends on the amount of variability within each slice. The ToxPi score will have a narrow confidence interval if the assay values within a slice are very similar and a wide confidence interval if the assay values within a slice are very different. The bootstrapping approach does not make any assumption regarding the distribution of the data values, and should give appropriate confidence intervals in most contexts. However, we caution that confidence intervals generated using the approach described here may be unreliable in the following situations: 22 If the measurements within each slice are on dramatically different scales. While different scales can be combined within ToxPi, individual slices are best used to represent similar/related data. If there are just a small number of assays within each slice. If there are extreme values (outliers) in the data.