1
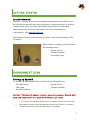
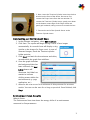
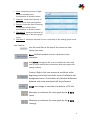
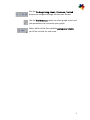
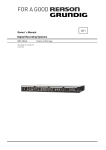
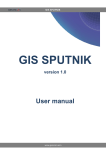
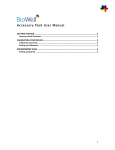
 Sputnik User Manual
GETTING STARTED ................................................................................................................... 2 SPUTNIK OVERVIEW ........................................................................................................................ 2 ENVIRONMENT SCAN .............................................................................................................. 2 SETTING UP SPUTNIK ....................................................................................................................... 2 CONDUCTING AN ENVIRONMENT SCAN ............................................................................................... 3 ENVIRONMENT SCAN RESULTS .......................................................................................................... 3 1 GETTING STARTED
Sputnik Overview
Sputnik is a special sensor and accompanying attachments that affix to your
Bio-Well device that will allow you to perform a Environment Scan. In order to
conduct these scans, you must have the Bio-Well device and a Bio-Well
Subscription Plus (or above) subscription. For more information on
subscriptions, visit www.Bio-Well.com.
Environment scans for experienced users with a solid understanding of GDV
Technique.
When Sputnik is ordered, you will receive
the following items:
-
Sputnik Sensor
-
Titanium Cylinder
-
Grounding Cable
ENVIRONMENT SCAN
Setting up Sputnik
To conduct an Environment Scan, you will use the following items:
-
Bio-Well Device
-
Sputnik Sensor
-
USB Cable
-
Titanium Cylinder
-
Bio-Well Software
Caution: The Sputnik sensor contains very sharp edges. Handle with
care and keep out of the reach of children at all tim es.
1. To connect your Bio-Well device to your computer, connect one end of the
USB cable to the back of the Bio-Well device where the USB icon is indicated.
Connect the opposite end of the USB cable to a computer.
2 2. Next, insert the Titanium Cylinder Insert into the lens
window on the front of the device. Be sure to first
remove the Finger Insert from the lens window. To
remove the Titanium Cylinder Insert, gently press down
on the bottom, outer edge of the Finger Insert and
gently pull outward, taking care not to scratch the lens.
3. Connect the end of the Sputnik Sensor to the
Titanium Cylinder Insert.
Conducting an Environment Scan
1. In the software navigation, select Environm ent.
2. Click Start. The system will begin taking a series of test images
automatically. A successful test will display a ring
(similar to the image of a finger scan). In case of
distorted images, check the Titanium cylinder
holder position.
3. Click Start and wait for three minutes and thirty
seconds while the graph line stabilizes.
4. Once the graph indicates
the background data has
been collected, the Add
Label button will
illuminate. Add labels as
needed to indicate
shifting events within the
environment (e.g. yoga,
meditation, etc.) 5. Allow for the scan to run for a minimum of thirty minutes for accurate
results. You can run the scan for as long as you wish. Once finished, click
Stop.
Environment Scan Results
What it Shows
The Environment Scan view shows the energy shifts of an environment
measured as five parameters:
3 1. Area: shows the amount of light
photons emitted from
environment to Sputnik sensor.
2. Intensity: shows the intensity of
the emission from each photon.
3. Energy: shows the level of energy
of the light emitted from
environment to Sputnik sensor.
4. Deviation E: measures the level of
non-uniformity of the area graph
curve.
5. Deviation S: measures the level of non-uniformity of the energy graph curve.
View Features
Use the scroll bar at the top of the screen to view
entire scan time.
Save the Environment scan as a picture to your
computer.
Add labels throughout the scan to indicate the start and
end of events within the environment that may impact the
energy reading.
Control+Right-click your mouse to put labels at the
beginning and at the end of the areas of influence and
background areas. A calculation of statistical difference
between each area mentioned will be performed.
Print scan image or save the scan data to a CSV file.
Maximize or minimize the scan graph by the X axis
(time).
Maximize or minimize the scan graph by the Y axis
(energy).
4 Use the To Beginning, Next, Previous, To End
buttons to navigate through various time frames.
Use the Preferences option to select graph colors and
plot parameters to customize your graph.
Select which of the five available parameter views
you’d like to view for each scan.
5