1
DEBUG
Advanced 8080 Debugger
User's Manual
Describes DEBUG 1.1
Processor Technology
Corporation
7100 Johnson Industrial Drive
Pleasanton, CA 94566
Telephone (415) 829-2600
Copyright (C) 1978 by Processor Technology Corporation
First Printing, August, 1978
Manual Part No. 727131
All rights reserved.
IMPORTANT NOTICE
This manual, and the program it describes, are copyrighted by Processor
Technology Corporation. All rights are reserved. All Processor
Technology software packages are distributed through authorized dealers
solely for sale to individual retail customers. Wholesaling of these
packages is not permitted under the agreement between Processor Technology
and its dealers. No license to copy or duplicate is granted with
distribution or subsequent sale.
TABLE OF CONTENTS
SECTION
1
2
PAGE
INTRODUCTION ........................................... 1-1
1.1
GENERAL INFORMATION ............................... 1-1
1.2
LOADING AND INITIALIZATION OF THE DEBUGGER ........ 1-1
1.3
BREAKPOINTS AND RESTARTS .......................... 1-2
COMMANDS ............................................... 2-1
2.1
CONVENTIONS ....................................... 2-1
2.2
DEBUGGER COMMAND LIST ............................. 2-2
2.3
DESCRIPTION OF COMMANDS ........................... 2-4
2.4
A WALK THROUGH THE DEBUGGER ....................... 2-14
SECTION 1
INTRODUCTION
1.1 GENERAL INFORMATION
This program is an aid for debugging a machine language program
developed and assembled on a Sol Terminal Computer or other 8080
computer system using CUTER software and CUTS format cassette tape.
With DEBUG, you are permitted to set as many as fifteen "breakpoints" in
a program you want to debug or examine. When that program is executed
under the control of DEBUG, it will stop at each of these addresses so
that CPU registers, flags, and specified memory locations may be
examined and modified. It is possible to resume execution at a
breakpoint (or at another specified memory location) after you have made
modifications. At the conclusion of debugging, you can save the
modified version of your program with the SOLOS/CUTER SAVE command.
There are five versions of the DEBUG program on the cassette tape.
Each version is designed for use on a system with a particular amount
of memory:
DBG8
DBG16
DBG32
DBG48
DBG64
is for a system with 8K of memory, and occupies memory
between 0E00H and 1FFFH.
is for a system with 16K of memory, and occupies memory
between 2E00H and 3FFFH.
is for a system with 32K of memory, and occupies memory
between 6E00H and 7FFFH.
is for a system with 48K of memory, and occupies memory
between AE00H and BFFFH.
is for a system with 64K of memory, and occupies memory
between EE00H and FFFFH.
The versions are identical, except that they run at different memory
locations. Each version occupies 4 1/2 K of memory and may be
restarted at the address at which it is loaded. Hereafter DEBUG or
"the debugger" will be used to designate any version of the program.
The DEBUG program contains its own VDM output driver. When execution
begins, however, all output is sent to the current SOLOS/CUTER
pseudo-port; a command is provided (the V command, described in Subsection
2.3) to direct output to the internal VDM driver, instead of to the
current pseudo-port.
1.2 LOADING AND INITIALIZATION OF THE DEBUGGER
1) Connect a cassette recorder to the computer.
instructions for setting up a recorder.)
1-1
(Your Sol manual has
CDEBUG
2) Insert the cassette tape on which you have recorded the program you
want to debug. Use the SOLOS/CUTER CAtalog command to rewind the tape and
position it before the part of the tape on which the program is recorded.
Use the MODE SELECT or CTRL and @ keys to return to SOLOS/CUTER command
mode. (Omit this step if the program you want to examine is already in
memory.)
3) Use the GET command to load your program into memory. Do not use
XEQ, because you do not want to execute the program until you can do
so under control of DEBUG.
4) When you have loaded your own program, remove the cassette from
the recorder and insert the DEBUG program tape. Position the tape as
in step 1, and use the SOLOS/CUTER XEQ command to load and execute
DEBUG.
When DEBUG begins to run, it will display the question
RST?
on the output device (probably the video display). Your response, a
number between 0 and 7, inclusive, will determine which 8080 "restart"
location will be used by the debugger to implement breakpoints.
(Subsection 1.3 discusses breakpoints and restarts.)
When the > prompt appears, the debugger is ready to accept a command
from the keyboard.
1.3 BREAKPOINTS AND RESTARTS
A BREAKPOINT is a location at which the operation of a program stops
to permit some kind of external intervention; in the case of DEBUG,
the user program (or the program being examined) stops to permit the
user to examine and modify registers and memory. A breakpoint can be
set at any address; when the debugger is in operation and a breakpoint
has been implemented, it is possible to proceed from that breakpoint,
or even to determine that execution will no longer stop there.
When a breakpoint is encountered by the debugger, the value of each
register is immediately displayed as a hexadecimal number following
the letter symbol for the register and an equals sign (=). For
example, B=3E means that the number 3E is in register B. The symbols
for the registers are:
A
B
C
D
E
F
H
L
M
for the Accumulator
for register B
for register C
for register D
for register E
for CPU Flags
for register H
for register L
for the content of the memory location to
which H and L point
P for Program Counter
S for Stack Pointer
1-2
CDEBUG
The flags that were set at the time of the
breakpoint are indicated by letter
symbols following the letter "F" and an
equals sign. The symbols for the flags
are:
S
Z
A
P
C
N
for
for
for
for
for
for
the Sign flag
the Zero flag
the Auxiliary Carry flag
the Parity flag
the Carry flag
no flag
Thus, f=ZAP means that the Zero, Auxiliary Carry, and Parity flags
were set. (Obviously, the letter N will only appear if no other
symbol follows the equals sign.)
The X command (discussed in Subsection 2.3, below) may be used to
modify any of the values existing in the registers or flags at the
time of the breakpoint. There are also commands that make it possible
to examine and modify the contents of memory at any named location.
The 8080 microcomputer allows for eight possible RESTART locations,
numbered 0 through 7 and corresponding to memory addresses 0, 8, 16,
24, 32, 40, 48, and 56 Decimal. It is quite common to give a
much-used subroutine an origin at one of the restart locations,
because a call to such a location requires only the one-byte RST
instruction, rather than the three-byte CALL instruction. In the
debugger a subroutine for dealing with breakpoints has its origin at
whatever restart location is specified in answer to the RST?
question. The program provides for a choice of restart locations, in
order to allow the other restart addresses to remain available for
access by the user. (For example, the program being debugged may use
restart addresses as origins for some of its subroutines.) If all
eight of the restart locations are available for use by the debugger,
then the answer to RST? can be any number between 0 and 7.
1-3
CDEBUG
1-4
CDEBUG
SECTION 2
COMMANDS
2.1 CONVENTIONS
On the next page is a list of the commands accepted by the DEBUG
program. In this list and for the remainder of the manual, the
following conventions are used:
The symbol <cr> denotes the RETURN key.
Upper case letters are literal: the $Bexpr<cr> command actually
contains the upper case letter B. (Note that it also ends with a
carriage return.)
Lower case letters are not literal: the $Bexpr<cr> command contains a
four character hexadecimal address or an expression that evaluates to
a four character hexadecimal address. (The rules governing
expressions are given below.) If a number occupying more than four
hexadecimal places is entered as an address, only the rightmost four
characters are significant. Similarly, if an expression evaluates to
a number occupying more than four hexadecimal places, only the
rightmost four places are significant.
Brackets {} indicate that a parameter is optional. The command
$P{n}<cr> contains an optional parameter represented by the letter n.
Other punctuation is literal, except that the dollar sign ($)
signifies the ESCape key, rather than the shift-4. (The ESCape key is
actually echoed on the screen as a dollar sign.)
EXPRESSIONS
The letters expr denote an expression that points to an address in memory,
i.e., an expression that evaluates to a number between 0 and 65535,
inclusive. The characteristics of an expression are as follows:
1) An expression may involve any of the operators + (add), (subtract), * (multiply), and % (divide). Expressions are evaluated
from left to right, with no operator precedence. Parentheses are not
allowed.
2) An operand is assumed to be a hexadecimal number, unless it is
preceded by an exclamation point (!), in which case it is assumed to
be a decimal number.
100 is 100 Hexadecimal, or 256 Decimal.
!100 is 106 Decimal, or 64 Hexadecimal.
2-1
CDEBUG
3) Multiplication and division operate on two 16-bit unsigned numbers.
The result of division is truncated to its integer part, and the remainder
is lost.
3D%7 evaluates to 0008.
4) There is no check for overflow or for division by zero.
It may be useful to imagine the acceptable range of numerical values
(corresponding exactly to the range of addressable memory) on a
circular number "clock," with 0 at the twelve o'clock position and
values increasing in a clockwise direction. Thus the largest number
in the system (65535) is next to the smallest (0), just
counter-clockwise of twelve o'clock. If we follow the rule, "Move
clockwise to increment a value, counter-clockwise to decrement a
value," it becomes clear that in this system 3-5 will be 65534, and
65534+5 will be 3. Although it is possible to utilize this
arrangement to advantage, it is probably less confusing to use
expressions that actually evaluate to a number neither less than
zero, nor greater than 65535.
Division by zero will always give the result 65535 Decimal.
5) A period (.) in an expression represents the address of the last
memory location examined. Thus, a memory location offset by 100
Hexadecimal from the last location examined could be represented as
100+. or as .+100. If no memory location has yet been examined, the
value of . is 0000.
6) BLANKS ARE NOT ACCEPTABLE WITHIN EXPRESSIONS.
2.2 DEBUGGER COMMAND LIST
All of these commands will be described in the next subsection. A
command may be entered at any time that the > prompt appears on the
video display.
SYNTAX
FUNCTION
$A<cr>
Set breakpoint mode to Static.
$Bexpr<cr>
Set breakpoint at address expr.
may be set.
$C<cr>
Set output mode to Character.
$Daddr<cr>
Delete the breakpoint at address expr.
$E<cr>
Exit DEBUG; return to PTDOS.
expr/
Display the content of the location designated by expr.
Allow modification of the value at that location.
expr=
Print the value of expr in Hexadecimal.
2-2
Up to fifteen breakpoints
CDEBUG
expr#
Print the value of expr in Decimal.
$Fexpr1,expr2,bb<cr>
Fill memory from address expr1 to address
expr2 with byte bb.
$H<cr>
Set output mode to Hexadecimal.
$I<cr>
Set output mode to Instruction.
$K<cr>
Delete all currently set breakpoints.
$P{n}<cr>
Proceed from a breakpoint; continue
execution, skipping this breakpoint until it
is met again for the nth time. Default for
n is 1.
$Rexpr<cr>
Begin execution (of the program being
debugged or examined) at address expr.
$Sexpr1,expr2,bb,mm<cr>
Search memory from address expr1 to address
expr2 for byte bb using mask mm.
$T<cr>
Display a list of current breakpoint
addresses.
$V<cr>
Change output driver (SOUT to VDM, or
vice-versa).
$Wexpr1{,expr2}<cr>
Dump contents of memory from address expr1
to address expr2.
$Xr<cr>
Display the content of CPU register r.
Allow modification of that value.
$Z<cr>
Set breakpoint mode to Remove.
2-3
CDEBUG
2.3 DESCRIPTION OF COMMANDS
This subsection describes all of the commands in the debugger and
provides short examples of their use. (There are no examples in cases
in which the operation of a command is not evident on the display,
i.e., in which the DEBUG program simply issues a carriage return and a
prompt after the command is executed.) For the purpose of this
discussion, it is convenient to group the commands as follows:
GROUP 1 DEBUGGER CONTROL
These are commands not directly related to the process of debugging a
program. They determine where output will be sent from the debugger
(V), and whether the contents of memory will be represented as
hexadecimal numbers (H), characters (C), or 8080 instructions (I).
Also included in this group is the command that terminates execution
of the debugger (E).
GROUP 2 CONTROLLING EXECUTION OF THE USER PROGRAM
These commands set and delete breakpoints (B,D,T,K), start and
restart the program being debugged (R,P).
GROUP 3 EXAMINING AND MODIFYING MEMORY
These commands are related to the examination and modification of
particular memory locations (expr/,W,F,S), CPU registers and flags
(X). These commands are generally used after a breakpoint has been
encountered, although it is possible to examine memory without
setting any breakpoints.
Subsection 2.4, below, illustrates a typical sequence of steps
followed while debugging a program.
GROUP 1:
V
H
I
C
E
sets the output port.
sets output mode to Hexadecimal.
sets output mode to Instruction.
sets output mode to Character.
exits the program.
CHANGE OUTPUT DRIVER
$V<cr>
DEBUG can send output either to the internal VDM driver or to the
current SOLOS/CUTER pseudo-port; the V command changes the output
driver from the current pseudo-port to VDM, or vice-versa. When the
program is first executed, output is sent to the current pseudo-port.
(Normally, this is also the video display.)
2-4
CDEBUG
The internal VDM driver has a variable speed option: while output is
being displayed, it is possible to alter the speed of the display by
striking a key representing one of the digits (0 is fastest, 9 is
slowest). Output can be suspended temporarily by the space bar and
reactivated by any other key. The default display speed is 2.
SET OUTPUT MODE TO HEXADECIMAL
$H<cr>
This command determines that when the content of a memory location is
examined (expr/ command), it will be displayed as a hexadecimal number.
(The commands to examine memory are in Group 3.) The default mode for
output is Hexadecimal; it is therefore unnecessary to specify this mode
unless another mode is in force.
SET OUTPUT MODE TO INSTRUCTION FORMAT
$I<cr>
This command determines that when the content of a memory location is
examined (expr/ command) or dumped (W command), it will be decoded
into the corresponding 8080 instruction mnemonic. (The twelve
undefined operation codes are output in Hexadecimal.) In Instruction
mode, DEBUG will assume that the location given by the expression in
the expr/ command is the first byte of an instruction. If the
location specified in the command is, in fact, the second or third
byte of a multiple-byte instruction, DEBUG will still decode the byte
as an assembly language instruction mnemonic, and the result will not
reflect what is actually happening in the object code.
There are two exceptions to the rule that every byte displayed in
Instruction mode will be displayed as an 8080 instruction mnemonic.
If the W command is entered while Instruction mode is set, or if expr/
specifies the first byte of a multiple-byte instruction and the
linefeed key is used to examine the next location(s), the DEBUG
program will display the second and third bytes of instructions in
Hexadecimal format.
SET OUTPUT MODE TO CHARACTER
$C<cr>
This command determines that when the contents of memory are examined
(expr/ command), any value that corresponds to the code for a printable
ASCII character will be displayed as that ASCII character. Any value that
does not correspond to a printable ASCII character will be printed as a
hexadecimal number.
EXIT TO SOLOS/CUTER $E<cr>
This command terminates execution of the debugger and returns to
SOLOS/CUTER. At this point the altered program may be saved from memory,
or its source may be altered in EDIT. If the. If the program is going to
be saved from memory, all current breakpoints must be removed before the E
command is entered.
GROUP 2:
B
T
A
R
sets a breakpoint; D deletes a breakpoint.
displays all breakpoints; K deletes all breakpoints.
and Z set breakpoint mode.
and P begin and restart program execution.
2-5
CDEBUG
SET BREAKPOINT
$Bexpr<cr>
This command sets a breakpoint at the location specified by the expression
expr. A breakpoint causes program execution to stop immediately BEFORE
the execution of the instruction at the specified address; for this reason
it is not permissible to set a breakpoint on the second or third byte of a
multiple-byte instruction.
There may be as many as fifteen breakpoints set at any given time.
DELETE BREAKPOINT
$Dexpr<cr>
This command deletes the breakpoint currently set at the location
specified by the expression expr. If there is no breakpoint at the
specified address, a question mark will be printed.
DISPLAY ALL CURRENT BREAKPOINTS
$T<cr>
This command causes the addresses of all current breakpoints to be
displayed; thus it becomes evident how many breakpoints have been set and
whether there are any that can be deleted.
EXAMPLE:
>$T<cr>
4075
4089
4102
(command to type out current breakpoints)
(addresses at which breakpoints have been
set with the B command)
KILL ALL CURRENT BREAKPOINTS
$K<cr>
This command deletes all of the breakpoints that have been set. Once
a program has been debugged, it can be executed normally from within
the debugger if all breakpoints have been removed. If the altered
version of a program is going to be saved following a return to
PTDOS, it is necessary to delete all breakpoints before entering the
E command.
SET BREAKPOINT MODE TO STATIC
$A<cr>
This command determines that breakpoints will NOT be deleted after
they are encountered, that is, that execution will stop again every
time a breakpoint address is reached. Static mode is set when the
debugger is entered.
SET BREAKPOINT MODE TO REMOVE
$Z<cr>
This command determines that breakpoints WILL be deleted after they
are encountered. Execution will stop only the FIRST time that the
breakpoint address is reached.
2-6
CDEBUG
PROCEED FROM A BREAKPOINT
$P{n}<cr>
This command causes program execution to resume after a breakpoint has
been encountered and related examination or modification of the code
has been completed. Execution will continue, beginning at the
instruction that caused the break, and will proceed until the next
breakpoint is encountered. All registers will be loaded with values
that reflect the modifications that have been made; a register or flag
whose value has not been modified will retain the value that it
contained when the breakpoint was encountered.
If a number is given after the letter P, the command is taken to mean:
proceed with execution and do not stop again for this breakpoint until
it is encountered for the nth time. For example, the command $P5<cr>
will cause the breakpoint just implemented to be bypassed four times;
all other breakpoints will be implemented normally. The default for n
is l; that is, normally execution will proceed, and any breakpoint
that has not been deleted or removed will be implemented normally.
BEGIN EXECUTION
$Rexpr<cr>
This command will start execution of a program at the location
specified by expression expr. The R command is used to execute a
program at its starting address; it should not be used to proceed from
a breakpoint, because the values of registers and flags will not be
restored! (The P command, by contrast, restores the values of
registers and flags.)
GROUP 3:
X displays CPU registers and flags.
W dumps a series of memory locations.
F fills a series of locations with a given value.
S searches a series of locations for a given value.
expr/ displays the contents of location expr.
expr= displays the value of expr in Hexadecimal.
expr# displays the value of expr in Decimal.
DISPLAY CPU REGISTERS AND FLAGS
$Xr<cr>
This command is used to examine and modify the values of CPU registers
and flags after a breakpoint has been encountered. The r in the
command format represents a symbol for the register that is to be
examined or modified. If no value is specified for r, the values of
ALL registers and flags are displayed. The carriage return is NOT
required if a value is specified for r.
SYMBOLS DESIGNATING REGISTERS AND FLAGS
Here is a list of the symbols for registers and memory.
symbols may be used as the r element in the X command.
2-7
Any of these
CDEBUG
A for the Accumulator
B for register B
C for register C
D for register D
E for register E
F for CPU Flags
H for register H
L for register L
M for the content of the memory location
to which H and L point
P for Program Counter
S for Stack Pointer
These are the symbols for the flags. The X command will not display the
value of an individual flag; rather, the flags are displayed as a group
when F is specified in the X command.
S
Z
A
P
C
N
for
for
for
for
for
for
the Sign flag
the Zero flag
the Auxiliary Carry flag
the Parity flag
the Carry flag
no flag
MODIFYING A REGISTER OR FLAG
In order to modify a register or flag, enter the X command, following
the letter "X" with the symbol that designates the register. To
modify one of the flags, type $XF<cr>, NOT the symbol that stands for
the particular flag! If the letter "X" is followed simply by a
carriage return, the values of all registers and flags will be
displayed again.
When the X command is entered, the value of the named register will be
displayed.
EXAMPLE:
>$XB
B=52
(command to display register B)
(hexadecimal value of register B)
If you do not want to modify the register, after all, type a carriage
return to re-enter command mode. If you DO want to modify the
register, enter a new value at the cursor position, without inserting
additional punctuation or spaces. The value that you enter will
replace the value currently in the register. Follow the entry with a
space or a carriage return; a space dictates that the next register be
displayed (on the current line), while a carriage return effects a
return to command mode. To modify the value of a flag, enter the
symbols of all flags that are to be set, whether or not they are set
already.
>$XF<cr>
F=SZC SZP<cr>
>
(examine flags)
(Sign, Zero, and Carry flags already set; user
sets Parity, alters carry so no longer set)
(back in command mode)
2-8
CDEBUG
DUMP MEMORY
$Wexpr1{,expr2}<cr>
This command causes the contents of a specified section of memory to be
displayed in the current output mode (see Group 1). If the mode is not
Instruction format, memory will be dumped with fourteen bytes represented
on each line: first all bytes are displayed in Hexadecimal, and then all
are displayed as characters. (A period will be printed if the value of
the byte does not correspond to a printable ASCII character.) In
Instruction format, memory will be dumped in decoded format, with one
instruction per line and the second and third bytes of multiple-byte
instructions represented in Hexadecimal.
Memory will be dumped starting at the location specified by expr1 and
continuing to that specified by expr2. If no value is specified for
expr2, the value expr1 will be used; the dump will continue as though
memory were circular, starting at expr1 and continuing past 65535 to 0,
finally stopping when the byte before expr1 is reached. To terminate a
dump before it reaches expr2, type MODE SELECT or CTRL-@.
>$W100,110<cr>
0100 01 07 00 21 50 00 11 65 00 78 B1 C8 0B 7E
010E 12 24 14
FILL MEMORY WITH A GIVEN BYTE
...!P..e.x...~
.$.
$Fexpr1,expr2,bb<cr>
This command fills memory from expr1 to expr2 with byte bb. If expr1
and expr2 are quite far apart in memory, a few moments may pass before
the prompt (>) reappears on the screen.
SEARCH MEMORY FOR A GIVEN BYTE
$Sexpr1,expr2,bb,{mm}<cr>
This command searches memory from the location specified by expr1 to
that specified by expr2 for byte bb, using mm as a mask.
As each byte is examined, it is ANDed with mask mm and then checked for
equality to byte bb. If the quantities are equal, then the memory
address and the byte at the address are printed. If the mask is not
specified, it will be assumed to have the value OFF Hexadecimal, i.e.,
all bits will be compared.
EXAMPLE:
>$S2340,2375,4C<cr>
2357 4C
>$S5261,5269,0,1<cr>
5261 C2
5263 52
5264 3E
5265 0E
5266 90
(search for 4CH, using default mask)
(4C is found at location 2357)
(search for even numbers)
(even numbers found at five locations)
2-9
CDEBUG
EVALUATE EXPRESSION OR EXAMINE MEMORY
expr=, expr#, expr/
If an expression is entered and followed immediately by an equals sign
(_), the expression is evaluated and the result is displayed as a
Hexadecimal number.
>5*6=001E
(result displayed in Hexadecimal)
If an expression is entered and followed immediately by a pound sign
(#). the expression is evaluated and the result is displayed as a
Decimal number.
>5*6#00030
(result displayed in Decimal)
If an expression is entered and followed by a slash (/), the
expression is evaluated and the content of the memory location
denoted by the expression is displayed in the current output mode
(see Group 1).
>$H<cr>
>!34%2/ 40
(output mode set at Hexadecimal)
(value of location 17 Decimal is displayed in
Hexadecimal output mode)
Note that none of these commands requires a carriage return.
In the rules for expressions (see Subsection 2.1), an expression was
defined as POINTING to an address in memory. Actually, in the case of an
expression followed by an equals sign or a pound sign, the expression need
not denote a location that is to be examined; any arithmetic problem whose
result will lie between 0 and 65535, inclusive, can be entered, even if
the computer being used does not have any memory at the designated
location. If the expr/ command is entered and there is no memory at the
specified location, the result will be FF in Hexadecimal mode, RST 07 in
Instruction mode.
Once expr/ has been entered and the location has been displayed, several
different entries are possible.
A CARRIAGE RETURN effects a return to command mode.
A SINGLE QUOTE MARK (') causes the value of the location to be displayed
in Character mode (without changing the current mode setting for the
debugger).
>$H<cr>
>5002/ 50 ' P<cr>
>
(set output mode to Hexadecimal)
(value displayed in Hex, then as
Character; return to command mode)
A SEMI-COLON (;) causes the byte to be displayed in Instruction format;
the location is assumed to be the first byte of an 8080 instruction.
The current mode setting for the debugger is not altered.
>$H<cr>
>1234/ 39 ; DAD SP<cr>
>
(set output mode to Hexadecimal)
(value displayed in Hex, then as
Instruction; return to command mode)
2-10
CDEBUG
An EQUALS SIGN (=) causes the contents of the present memory location to
be displayed in Hexadecimal, without changing the current mode setting
for the debugger.
>$I<cr>
(set output mode to Instruction)
>025F/XCHG =EB<cr> (value displayed as Instruction, then
>
in Hex; return to command mode)
A DOUBLE QUOTE MARK (") followed by a character specifies that
character as a replacement for the current value of the location.
Replacement input must be terminated by a carriage return, linefeed,
or up arrow; each of these delimiters will also perform the function
ascribed to it elsewhere in this list, e.g., a linefeed will delimit
replacement input and then cause the next location to be displayed.
If an attempt is made to enter more than one character following a
double quote mark, DEBUG will respond with a question mark and will
not accept either character entered.
>$C<cr>
>47D8/ @ " B<cr>
>./ B<cr>
>
(set output mode to Character)
(value displayed as Character, replaced
with letter B; new value displayed)
(return to command mode)
(In this example, the period is used to designate the last location
displayed; see the rules for expressions in subsection 2.1, above.)
A COLON indicates that subsequent input is an instruction. It is
possible to enter a multiple byte instruction in place of a single
byte instruction; input will be placed in successive memory locations
and the previous contents of those locations will be overwritten.
Such a disturbance of the previous contents of memory will seldom be
desirable.
To enter a replacement in Instruction format, type the mnemonic for
the instruction, rather than the corresponding machine code. The
standard Intel instruction mnemonics have been implemented. (See the
appendix of 880 Operation Codes.) Most of the standard symbolic
names for registers may be used in the operand field; the two
exceptions are that "P" should be used to denote the Program Status
Word (PSW) and "S" should be used to denote the Stack Pointer (SP).
The instruction must be entered immediately after the colon. Use a
single blank to separate operands from the operation code, and a comma
to separate two operands. Terminate the input with a carriage return,
linefeed, or up arrow; any of these delimiters will first delimit the
input and then perform the function ascribed to it elsewhere in this
list, e.g., a carriage return will delimit the input and than cause a
return to command mode.
>$H<cr>
>2113/ 1C ;INR E : INR C<cr>
>
(set output mode to Hexadecimal)
(value displayed in Hex, then as
Instruction; Instruction input and
return to command mode)
A LINEFEED causes the contents of the next location to be displayed.
If the current output mode is Instruction mode and the last location
2-11
CDEBUG
examined was interpreted as the first byte of a multiple-byte
instruction, the next one or two locations, if examined by means of
the linefeed, will be displayed in Hexadecimal.
>$I<cr>
>5002/MOV D,B <linefeed>
5003 LXI SP, <linefeed>
5004 3E <linefeed>
5005 F5 <cr>
>
(set output mode to Instruction)
(value displayed; display next
location, and next...)
(second and third bytes of multi-byte
instruction are displayed in Hex)
(return to command mode)
An UP ARROW C) causes the content of the previous location to be
examined. If the current mode is Instruction mode, the location will
be assumed to be the first byte of an instruction (whether or not this
is actually the case) and will be decoded into an 8080 instruction
mnemonic. (Consider that whereas it is possible to determine from an
operation code how many subsequent bytes are part of the instruction,
it is not always possible to tell whether or not PRECEDING bytes are
operation codes.)
>$C<cr>
>2300/ G ^
2299 U<cr>
>
(set output mode to Character)
(value displayed as Character)
(value of previous location displayed)
(return to command mode)
2-12
CDEBUG
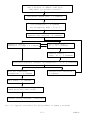
Load user program (or program to be examined)
and a version of DEBUG: >GET prog
>XEQ DBG8 (or another version)
Determine output port - V command
Set breakpoints - B command
Set breakpoint mode - A or Z
Execute user program - R command
Examine & modify
registers & flags - X command
Set output mode H, I, or C command
Examine memory expr/, W, F, S commands
Determine possible changes in breakpoints - T, K, D commands
Kill all remaining
breakpoints - K command
Proceed with execution P command
Exit DEBUG - E command
Save debugged version of program
>SAVE prog,add1,add2,{add3}
Correct source program - >XEQ EDIT
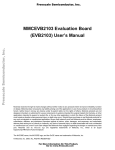
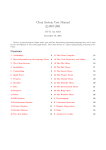
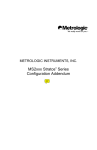
Fig. 2-1 Typical Procedure for Using DEBUG to Debug A Program
2-13
CDEBUG
2.4 A WALK THROUGH THE DEBUGGER
The example below illustrates the use of DEBUG to locate and correct
the errors in an assembly language program. The next few pages
consist entirely of tutorial material; they do not contain any
additional information about the features of the debugger. The
figure on the facing page is a generalized diagram of the process of
using DEBUG to debug a program. This figure and the command summary
in subsection 2.2 are intended to serve as your quick reference
materials after you have read the detailed descriptions in the rest
of the manual.
SAMPLE PROBLEM
Below is the assembler listing of a routine just added to a large
program called TEST. The purpose of this routine is to move BC bytes
of information from one area of memory to another. When the routine
is first called, the H and L registers point to the first of BC
consecutive locations occupied by the information to be moved; the D
and E registers point to the first of BC consecutive locations to be
occupied by the same information when control returns to the calling
routine. The calling routine prints out the BC bytes beginning at
the location to which the first byte was moved.
0100
0101
0102
0103
0104
0105
0106
0107
0108
78
B1
C8
0B
7E
12
24
14
C3 00 01
BMOVE
MOV
ORA
RZ
DCX
MOV
STAX
INR
INR
JMP
A,B
C
.
B
A,M
D
H
D
BMOVE
Let us assume that we have run TEST in SOLOS/CUTER, and that where we
would expect 7 bytes, the characters F, I, D, D, L, E, and S, to be
printed out as the ASCII string FIDDLES, we see a good first
character 'F' followed by a great deal of suspicious screen activity.
(Write and execute a program that calls BMOVE and then prints out
about 100 bytes, beginning at the location indexed by D and E at the
time of the call.) Let us also assume that we do not immediately
recognize the bugs in the program, and that we decide to use the
debugger to take a closer look at the BMOVE routine during its
execution.
Remember that the symbol > is the prompt character and should not be
typed. Also, $ signifies the ESCape key, not the dollar sign.
1) LOAD TEST and DEBUG from SOLOS/CUTER
>CA<cr>
>GET TEST<cr>
>CA<cr>
>XEQ DBG8<cr>
(SOLOS/CUTER will print load address and
byte count on the same line as the command.)
(or whatever version you want to use.)
2-14
CDEBUG
TEST is loaded but not executed.
DEBUG is loaded and executed.
RST? 3
DEBUG asks user to assign restart location.
User enters 3.
2) DETERMINE OUTPUT PORT V command
>$V<cr>
Output will be sent to the internal VDM driver, instead of to the
current SOLOS/CUTER pseudo-port. (If the current pseudo-port setting
is the VDM, it really does not matter which output driver you use.)
3) SET BREAKPOINTS) with B command
>$B0102<cr>
Because only the first byte of information appears to have been moved
properly (see description above), it is worth checking whether the
BMOVE loop is executed only once, that is, whether the zero flag is set
and causes a return the second time the RZ instruction is reached. By
setting a breakpoint at 0102H, we can examine the condition of the
flags at the time of the RZ instruction. (More breakpoints could, of
course, be set; to simplify this example, we set only one at a time.)
4) SET BREAKPOINT MODE with A or Z command
>$A<cr>
Breakpoints will not be deleted automatically after they have been
encountered once. The distinction between the modes is relevant here,
because the breakpoint at 0102H will give useful information only the
second time it is encountered. (It is actually unnecessary to use the A
command, unless the Z command has been used previously; Static
breakpoint mode is set when the DEBUG program begins to run.)
5) EXECUTE USER PROGRAM (or program to be examined) with R command
>$R1200<cr>
The address specified in this command is the starting address of the
program called TEST. Execution will proceed until it reaches the
breakpoint address; then that address and the contents of all registers
and flags will be displayed.
*0102
A=07 B=00 C=07 D=00 E=65 F=N H=00 L=50 M=46 5=625C P=0102
Assuming that we intended to move 7 bytes of information beginning at
address 50 to consecutive addresses beginning at 65, all is well so far.
The STAX operation will put the value 46 (or ASCII 'F') in location
0065H. (M represents the value of the location addressed by H and L.)
2-15
CDEBUG
SET OUTPUT MODE With H, I, or C commands
EXAMINE MEMORY with expr, W, F, or S command
For good measure, we can EXAMINE MEMORY to make sure that the
characters F, I, D, D, L, E, and S are actually stored at consecutive
locations beginning at 50. The W command can be used to display the
locations; output mode does not need to be set to Character, because
in the default Hexadecimal mode the dump will appear both in
Hexadecimal and in Characters.
>$W50,56<cr>
0050 46 49 50 44 4C 45 53 FIPDLES
The dump shows that the third character is incorrect.
correct character at address 52, we can enter
To insert the
>$C<cr>
to set the output mode to Character, and then
>52/
to display the contents of location 52. The contents of the location
will be displayed right after the slash. To enter the correct
character, we type a double quote ("), the character, and a carriage
return. Now the line looks like this:
>52/ P " D<cr>
Of course, the fact that there was a P instead of a D at location 52
does not account for the fact that the program does not run properly.
6) DETERMINE POSSIBLE CHANGES IN BREAKPOINTS with T,K,D,B
In this instance, we have no real reason to type out or delete our one
breakpoint, but we might want to add a breakpoint at address 0108H.
By looking at the registers at that point, we can see whether the
locations addressed by HL and DE are what we would expect them to be,
i.e., whether the value of each of these register pairs has been
incremented by 1.
>$B0108<cr>
7) PROCEED FROM BREAKPOINT with P command
>$P<cr>
Execution will continue until the next breakpoint is encountered.
*0108
A=46 B=00 C=06 D=01 E=65 F=N H=01 L=50 M=2E S=625C P=0108
From this display of the values of registers and flags, it becomes
clear that the register pairs that address memory locations have
2-16
CDEBUG
actually been incremented not by 1, but by 100H (256 Decimal). In
order to verity that data is actually being stored at every hundredth
(or 256th) address, we can proceed with execution until the next time
0108H is reached. Then we can use other commands to examine memory
locations in the areas from which and to which we want to move our
data. To proceed with execution, we enter the command
>$P<cr>
(We will not delete the breakpoint at 0102, because we might want to
look at it again; the next time that breakpoint is encountered,
however, we can ignore it and Proceed with execution.)
When we reach 0108, the values of registers and flags are:
*0108
A=2E B=00 C=05 D=02 E=65 F=N H=02 L=50 M=06 S=625C P=0108
8) EXAMINE MEMORY with the expr/ command
If we enter the command to examine locations 150 and 165, we can
indeed see that the second byte to be moved was taken from location
150 and moved to 165, instead of being taken from location 51 and
moved to 66.
>150/ @<cr>
>165/ @<cr>
If we look at location 66, we find whatever value was at that location
when the debugger began its operation:
>66/ .<cr>
If our sample routine were not so short, we might want to use the
MEMORY SEARCH (S) command to locate the part of the program containing
the INX instructions. The table of 8080 Operation Mnemonics in the
ASSM subsystem manual indicates that INX H, which should be one of our
instructions, corresponds to the Hexadecimal value of 23. To search a
section of memory above our most recent breakpoint, we can enter
>$S100,108,23<cr>
only to find that the BMOVE routine does not contain an INX H
instruction at all!
Using the expr command to EXAMINE MEMORY, we can look at the code in
the same area that we just searched for INX. First we shall change the
output mode to Instruction, so that we will see the contents of memory
as a series of assembly language instructions, rather than as
Hexadecimal numbers.
2-17
CDEBUG
>$I<cr>
>0100/ MOV A,B<linefeed>
0101/ ORA C<linefeed>
0102/ RZ .<linefeed>
etc.
0106/ INR H<linefeed>
0107/ INR D<cr>
(you enter the linefeeds)
Now the cause of our troubles is clear: instead of adding 1 to each of the
register pairs HL and DE, we have added 1 to each of the single
registers H and L. By examining locations 0106 and 0107 again, we can
change the two INR instructions to IT4X instructions and solve our
problem. The colon indicates instruction input.
>0106/ INR H :INX H<linefeed>
0107
INR D :INX D<cr>
9) EXAMINE AND MODIFY REGISTERS AND FLAGS with X command
We have found the bug in BMOVE and want to continue running TEST,
rather than reinitiate execution of that calling program. We can use
the X command to modify several registers, and so backtrack in our
execution of the program to a point before BMOVE first put an
incorrect byte in an incorrect location.
Remember,we are still at a breakpoint. The X command without a
register specification will cause the contents of all registers and
flags to be displayed:
>$X<cr>
A=2E B=00 C=85 D=02 E=65 F=P H=02 L=50 P9=B6 S=625C P=0108
The bug in BMOVE caused all bytes but the first to be moved to
incorrect locations in memory. To backtrack to the point from which
we want to reinitiate execution, we must alter the following
registers:
C, so that BC indicates that the last 6 of the 7 bytes
that compose the (English) word FIDDLE must still be
moved:
>$XC
C=05 06
D and E, so that they point to the next location
to which information should be moved:
>$XD
D=02 00
>$XE
E=65 66
and
2-18
CDEBUG
H and L, so that they point to the next location
from which information should be taken.
>$XH
H=02 00
>$XL
L=50 51
10) KILL ALL BREAKPOINTS
using K command
Before either proceeding with execution or exiting to PTDOS to save
the file, we kill all current breakpoints. In order to have used
almost all possible commands in this example, we may as well type out
the breakpoints first with the T command.
>$T<cr>
0102
0108
>$K<cr>
11) EXIT DEBUG with the E command
>$E<cr>
This is the command to return to SOLOS/CUTER. Once in SOLOS/CUTER, we
can use the SAVE command to save the object file, and EDIT to alter the
source code file.
2-19
CDEBUG