1
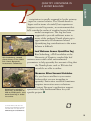
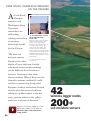
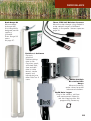
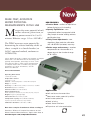
Turfschipper 114 | 2292 JB Wateringen | Tel. 0174 272330 | Fax. 0174 272340 | [email protected] | www.catec.nl
INSIDE
NEW PRODUCTS FOR
2010–2011
RESEARCH BRIEFS
CURRENT SOIL,
PLANT, AND WATER
RESEARCH FROM
AROUND THE WORLD
DECAGON
EDUCATIONAL
INITIATIVES AND
RESEARCH GRANTS
D
1
G. A. Harris Fellowship
X Instrumenting canopy soil over 19
m off the ground.
Camila Tejo Haristoy is one of six
2010 winners of the G.A. Harris
Fellowship. The fellowship provides
$30,000 worth of instruments to
graduate students in environmental
and geotechnical fields. This year’s
competition focused on innovative
soil and plant monitoring. Haristoy is
studying canopy soil in Pacific
Northwest Sitka Spruce.
2
For more information about the G.A. Harris Fellowship, visit
decagon.com and choose “G.A.Harris Fellowship” on the “About
Us” page (decagon.com/about-us/ga-harris-fellowship).
TABLE OF CONTENTS
Research Briefs
CANOPY
Leaf Porometer
LP-80
Leaf Wetness Sensor
Page 4
Page 6
Page 8
SOIL MOISTURE
Complete Soil Moisture Analysis
Software and Data Collection
Soil Moisture Sensors
Leaf Wetness Sensor—
Quantifies the amount of fog
available for use by the living
fossil Welwitschia
Mirabilis.
Page 9
Page 10
Page 11
Page 12
EM50 SERIES LOGGERS
Em50 Loggers
Em50G Remote Logger
Em50R Radio Logger
Multi-site Accessories
Watershed Characterization
Irrigation Monitoring
Page
Page
Page
Page
14
16
18
19
Page 22
Page 24
WATER POTENTIAL
WP4C
Tensiometers
Hyprop
AquaSorp IG
MPS1
Case Study: Complex
Hydrology—Can it be
hassle free?
Page 20 & 21
Page
Page
Page
Page
Page
26
28
30
31
32
Page
Page
Page
Page
34
36
38
40
HYDROLOGY
Infiltrometer
Monitor Solute Movement
Drain Gauge G2-G3
Pore Water Samplers
THERMAL
Sample Disturbance —A
problem when measuring
water potential?
Page 29
KD2Pro
Page 42
Essential Soil References
Page 44
Distributors
Page 46
D
3
Porometer Research for Everyone
GET HIGH QUALITY DATA
WITHOUT FANS, TUBES,
OR PUMPS.
B
steady state technology
(see details at right) makes accurate
stomatal conductance measurements
affordable and practical for everyday
research. Detail water use, indicate water
stress and compare physiological varieties.
Add stomatal conductance data to any
canopy study with this elegantly designed
Leaf Porometer.
REAKTHROUGH
Applications
Water Stress Measurements
Variety Testing & Comparison
Fundamental Research on Stomatal Function
Teaching and Student Labs
Benefits
Automatic sampling mode eliminates user subjectivity.
Accurate Steady-State measurement.
No tubes, pumps, or fans.
Leaf Porometer Specifications
Conductance range
0 to 1000 mmol m -2 s -1
Accuracy ± 10%
Operating Environment
5 to 40ºC, 10 to 90% RH, non-condensing
Units mmol m -2 s -1, m 2s mol -1, s/m
Measurement diameter 6.3 mm
Sensor head cable length 1.2 m (4 ft.)
Measurement time in Auto mode 30 s
See the extended specifications for the
leaf porometer at www.decagon.com
4
Watch a 3 minute video introducing
the Porometer at
www.decagon.com/education/
video-index/
D
MATHEMATICS OF THE STEADY STATE POROMETER
RVS
CANOPY
CVL
ecagon’s Steady State
porometer measures stomatal
conductance using a sensor
head with a fixed diffusion path to
the leaf. It measures the vapor concentration
at two different locations in the diffusion
path. It computes vapor flux from the vapor
concentration measurements and the known
conductance of the diffusion path using
the following equation:
Leaf
=
R1
CV1
R2
Humidity
Sensors
CV2
Schematic illustrating how the
porometer measures stomatal
conductance.
Where CvL is the vapor concentration at
the leaf, Cv1 and Cv2 are the
concentrations at the two sensor
locations, Rs is the stomatal resistance,
Rv1 is the resistance between the leaf and
the first sensor, and R2 is the resistance
between the two sensors. If the
temperatures of the two sensors are the
same, vapor concentration can be
replaced with relative humidity, giving
1
Conductance is the reciprocal of
resistance, so Cvs = 1/Rvs. D
5
Canopy Measurements PAR / LAI
Photosynthetically
Active Radiation &
Leaf Area Index
MEASURE BOTH PAR AND
LAI WITH ONE LIGHTWEIGHT,
STREAMLINED WAND
U
to estimate biomass
production without destroying the
crop (see details at right). Measure
photosynthetically active radiation (PAR)
and get leaf area index (LAI) values
simultaneously in real time. Store
approximately 9000 data points manually by
pressing a button or automatically in
unattended sampling mode.
SE PAR DATA
INCLUDED ACCESSORIES
EXTERNAL PAR SENSOR
2 meter cable with connector for direct connection to the ceptometer’s
external port. Calibrated to provide an output of about
0.1 mV per µmol m -2 s -1 (calibration label provided).
RS-232 CABLE— for interfacing between your computer
and the AccuPAR.
CARRYING CASE
Polyethylene hardened case with custom foam cutouts allow the instrument
and its accessories to be safely stored inside.
3.6 kg, 11.8 x 24 x 109 cm.
Watch a 5 minute video on
measuring PAR and LAI with the
AccuPAR LP-80 at
www.decagon.com/education/
video-index/
6
AccuPAR LP-80 SPECIFICATIONS
Operating environment
0° to 50°C (32°-122°F),
0 to 100% relative humidity
Probe length 86.5 cm
Number of sensors 80
Overall length 102 cm (40.25 in)
Microcontroller dimensions
15.8 x 9.5 x 3.3 cm (6.2 x 3.75 x 1.3 in)
PAR range 0 to >2,500 µmol m -2s -1
Resolution 1 µmol m -2s -1
Minimum spatial resolution 1 cm
Data storage capacity 1MB RAM, 9000 readings
Unattended logging interval
User selectable, between 1 and 60 minutes
Instrument weight 1.22 kg (2.7 lbs)
Data retrieval Direct via RS-232 cable
Power 4, AA Alkaline cells
External PAR sensor connector
Locking 3-pin circular connector (2 m cable)
Extension cable option 7.6 m (25 ft)
NONDESTRUCTIVE BIOMASS PREDICTION
CANOPY
T
he detailed processes in photosynthesis are
complicated and hard to model. In many
cases, however, it’s possible to simplify the
model by focusing on one or more of the
limitations to assimilation.
To learn more about
the relationship
between light
interception and
biomass production,
visit
www.decagon.com/
canopynews2009
Limited by Light, Limited by Water: Two
Separate Approaches
We could postulate situations where light would
be the limiting factor in assimilation, and others
where water would be the limiting factor. Our
models, in words, might be: assimilation is
proportional to the plant’s ability to capture light,
or assimilation is proportional to the plant’s ability
to capture water. Both approaches can be useful in
modeling biomass production.
Knowing Which Model to Use
The most efficient way to determine whether light
or water is the limiting factor is to simply run both
mathematical models daily to see which one
predicts the lowest value. That value is the best
predictor of dry matter production for the
particular day on which it is run. The 2009
Decagon Canopy News feature article, Simple
Models for Carbon Assimilation by Plants,
describes the math involved and climatic data
needed to run these two alternative predictors of
dry matter accumulation and shows how to use
them together to give the most accurate result. D
7
Ready-to-Use Leaf Wetness Sensor
DETECT LEAF WETNESS
DURATION WITH A
SENSITIVE, CALIBRATED,
STANDARDIZED SENSOR
M
affect plants only
when moisture is present on
the leaf surface. The Dielectric
Leaf Wetness Sensor determines the
presence and duration of wetness on a
leaf’s surface, enabling researchers and
growers to forecast disease and protect
plant canopies. The Leaf Wetness Sensor
approximates the thermal mass and
radiative properties of leaves to closely
mimic the wetness state of a real leaf.
Because the sensor does not take resistancebased measurements, it requires no
painting or user calibration, and it can
detect ice formation as well.
ANY DISEASES
Leaf Wetness Sensor Specifications
Measurement time 10 ms
Power 2.5 VDC @ 10 mA to 5 VDC @ 7 mA
Output 250 to 1500 mV
Operating Environment -20 to 60°C
Expected Lifetime
2+ years continuous use
Probe Dimensions
11.2 x 5.8 x 0.075 cm (4.4 x 2.3 x 0.029 in)
Cable Length
5 m standard, extension cables available
Connector type 3.5 mm plug
Datalogger Compatibility (not exclusive)
Decagon Em50, Em50R, Em50G
Campbell Scientific CR10, 10X, 21X, 23X, 1000, 3000, 5000
Applications
Disease forecasting and modeling
Ecological and Agricultural Research
8
recipitation is usually assumed to be the primary
input in a water balance. The Namib desert is
hyper-arid in terms of rainfall, but experiences
frequent coastal fog events, an environment that
falls outside the realm of standard water balance
model assumptions. The fog has been
suggested to provide sufficient water to
many of the endemic Namib plants up to
approximately 60 kilometers inland.
Quantifying fog contributions to the water
balance is difficult.
Keir Soderberg, second
place winner of the 2009
G.A. Harris Research
Instruments Fellowship.
Welwitschia mirabilis,
which has a lifespan of
400 to 1500 years, uses
water from fog in order
to survive.
See all the winners of the 2009 G.A.
Harris Research Instruments Fellowship
and download the 2010 application at
www.decagon.com/about-us/
CANOPY
P
QUANTIFY UNKNOWNS IN
A WATER BALANCE
Leaf Wetness Sensor Quantifies Fog
Kier Soderberg, a PhD candidate at the
University of Virginia, coupled the leaf
wetness sensor with other environmental
parameters to help quantify the amount of fog that
the Namib plants such as Welwitschia
mirabilis are able to utilize.
Measure Other Unusual Variables
Do you have variables in your water
balance that you are struggling to
quantify? Innovative research sometimes
requires innovative sensor solutions.
Contact Decagon’s application support
specialists to help brainstorm ideas for your
specific project. D
9
Complete Soil Moisture Analysis
Tools to measure, collect, and analyze your data.
Data
Management
Soil Moisture and
Environmental
Sensors
ECH2O soil moisture
DataTrac 3 is a completely
redesigned software package sensors deliver:
that helps you view and
effectively manage your data. Research Grade
Accuracy— ±3 VWC in
typical soils, can be
DataTrac 3 does the heavy
calibrated for improved
lifting—pulling the logger
data, amending files, tracking performance.
nodes, graphing sets—so you
can see what’s going on with Reliable Data—patented
technology eliminates
your study at any point
without interrupting the data interference from salinity and
texture differences.
stream. Check in daily or
weekly to add notes and
Practicality—low power,
make observations.
low-cost sensors allow you to
characterize spatial
variability more completely.
Complete the system with
environmental sensors for
context to show why soil
water content is changing.
Data
Acquisition
Systems
The Em50 series of loggers
make data collection easy,
whether you’re installing a
single station or a large,
multi-station site.
All Em50 loggers are:
Pre-programmed—plug the
sensors in and start logging.
No user programming
required.
Weatherproof—no extra
enclosure needed.
Internally powered—runs 6
months-2 years on enclosed
AA batteries. No external
power needed.
10
Wireless options let you
collect data from almost
anywhere.
Z DataTrac 3—SOFTWARE
DataTrac 3 graphical and database
software organizes, graphs, and stores
data from Em50 series or Em5b data
loggers. Users can view and edit data in
table format, create reports, and transfer
data to other DataTrac 3 users.
Minimum System Requirements
Microsoft Windows XP or newer
Monitor set to display 1024 x 768 pixels
(minimum)
DataTrac 3
ORGANIZE AND ANALYZE
YOUR SOIL MOISTURE DATA
I
magine having an
assistant that brings
you data, general
trends, and specific
problems from all of your
research sites at the start
of every day. DataTrac 3
is that assistant—a
completely redesigned
software package that lets
you view and manage
your data.
Contact
Decagon
for a free
30 day trial.
When DataTrac 3 is
started, all of your most
recent data downloads
will be updated and
graphed allowing you to
see changes in real time.
Instead of looking back at
the data and wondering
what happened, you can
add event-related
comments.
Just a few new features:
Logger tree let you
organize your data logger
nodes during set-up.
Annotate your notes on
current thinking or relevant
environmental conditions.
Growing Tools let you
create meaningful metrics
such as vapor pressure
deficit and growing degree
days.
D
11
Research-Grade Soil Moisture Sensors
All sensor electrical interface: 3.5 mm plug or 3-wire.
MODEL
L E N GT H
MEASUREMENT
RANGE
ACCURACY
BENEFITS
± 3% VWC, typical
mineral soils up to 8 dS/m
Rockwool
± 3% VWC, 0.5 to 8 dS/m
EC-5
5 cm
Volumetric water
content
0–100% VWC
Lowest cost for large
sensor networks.
Potting Soil
± 3% VWC, 3 to 14 dS/m
(ea): ± 0.5 from ea of 2 to 10
± 2.5 from ea of 10 to 50
± 3% VWC, typical
mineral soils up to 8 dS/m
10HS
10 cm
Dielectric permittivity,
Volumetric water
content
Apparent dielectric
permittivity ( e a ):
1 (air) to 50,
0–57% VWC
Apparent dielectric
permittivity ( e a ):
1 (air) to 80,
0–100% VWC
Temperature
-40 to 50 ºC
5TM
5TE
5 cm
5 cm
(ea): ± 1 ea (unitless)
from 1–40 (soil range)
± 15% from 40–80
± 3% VWC, typical
mineral soils up to 8 dS/m
Temperature ± 1 ºC
Volumetric water
content, Temperature,
Electrical conductivity,
Dielectric Permittivity
Apparent dielectric
permittivity ( e a ):
1 (air) to 80,
0–100% VWC
Temperature
-40 to 50 ºC
EC 0 to 23 dS/m
(bulk)
(ea): ± 1 ea (unitless)
from 1–40 (soil range)
± 15% from 40–80
± 3% VWC, typical
mineral soils up to 8 dS/m
12
Soil matric potential
Manage salts and
fertilizers in your
system.
Bulk EC ± 10%
Temperature ± 1 ºC
± 20% of reading from
-50 to -500 kPa
5 cm
Include temperature
dependencies in your
study.
Volumetric water
content, Temperature,
Dielectric Permittivity
± 40% of reading from
-10 to -50 kPa
MPS-1
Largest volume of
influence decreases
effects of
heterogeneity.
-10 to -500 kPa
Maintenance-free
water potential
measurements that do
not drift over time.
Above Ground Sensors
The Decagon system also allows you to characterize the environment above the soil
surface. The sensors below can be used with the Em50 series data loggers and software
to provide data on a variety of environmental variables.
TEMP/RH Durable sensor measures relative
humidity and temperature and outputs both values
as a digital signal.
Probe RH Range 0 to 100% RH
RH Accuracy
±2% from 10–90% RH
±3% from 0–10% RH and 90–100% RH
Temperature Range -40 to 60 ° C
The Leaf Wetness Sensor measures duration of leaf
wetness and requires no painting or calibration and detects
trace amounts of water or ice on the sensor sur face.
Operating Environment -20 to 60° C
The Pyranometer Model
PYR and the PAR Photon
Flux Sensor are completely
water proof, submersible and
designed for continuous outdoor
use. A leveling plate is included.
The ECRN-100 Precipitation
Sensor is best for research
applications and measuring rainfall.
Resolution 0.2 mm
Dimensions 17 cm x 14.2 cm
Cable length 1m
Range 0 to 2000 µ mol / m 2 s (PAR)
Range 0 to 1750 W m -2 (PYR)
Dimensions 24mm diameter, 29 mm deep.
Accuracy ±5%
The ECRN-50 Precipitation
Sensor is best for measuring
irrigation events.
Resolution 1 mm
Dimensions 5 cm x 10 cm
SOIL TEMPERATURE SENSOR
model ECT
Range -40 to 60° C
Accuracy ±0.25° C
Cup Anemometer
The anemometer measures both wind speed (using
windcups and a magnetic switch) and wind direction (with
windvane and potentiometer). Includes sealed stainlesssteelbearings for long life. The range and accuracy
specifications of this unit have been verified in windtunnel tests (information available upon request). For
use only with our Em50 or Em50R Data logger
using ECH2O Utility.
Watch a 5 minute video showing the
factory calibration process at
www.decagon.com/education/
video-index/
D
13
Spend more time with your data…
T
he Em50 series of data
loggers are designed for
researchers who just want
quality data. You install the
sensors, plug them into the logger,
set the clock and measurement
intervals, and start logging data.
The Em50’s primary advantage is
simply this:
NO PROGRAMMING.
MEASUREMENT NODES—Em50 Logger
Channels 5.
Storage >36,000 scans - Each scan includes logger name,
date, time, and 5 measurements.
Scan Interval User-programmable from 1/minute to 1/day.
(minimum Em50G scan interval every 5 minutes).
Communication Serial RS232, USB, radio, cellular.
Power 5, AA alkaline batteries.
Dimensions 12.7 x 20.3 x 5.1 cm (5 x 8 x 2 in)
Enclosure Rating IP55, NEMA3.
Download software included with Em50 purchase.
CONTINUOUS MONITORING
[ Em50 is a highly weather
resistant logger for all
Decagon sensors.
We recommend and support use of
Campbell Scientific loggers with our
sensors for applications requiring
programming and/or control.
14
not your data logger.
The ECH2O System
NO PROGRAMMING
Em50 Series Logger Options
1
Basic
Data Logging
The standard Em50 data
logger is the least expensive
and has the longest battery
life of all the Em50 series
loggers. It requires a direct
connection to a laptop or
other computing device to
download data. The Em50
option is best if:
You don’t need to access
your data on a regular basis.
Your site is so remote that
you need the data logger
batteries to last for over two
years.
2
Long Distance
Data Delivery
The Em50G remote data
logger uses the cellular
network to upload your data
from the field to the internet.
You can access the data at
any time from any location
that has an internet
connection. The cellular
modem is fully integrated
with the logger making setup
a snap. The logger comes
ready to go right out of the
box with a one-year pre-paid
SIM card and subscription to
the Decagon Data Service.
Just plug in your sensors, set
your measurement interval,
and you’re done. Your data
will be waiting for you back
at the office. The Em50G is
the best option if:
3
Local Data
Connection
The Em50R wireless data
logger uses long range 900
MHz* radio communication
to send your data to a central
data receiving location. No
existing wireless
infrastructure is necessary.
The Em50R collects data at a
single location and delivers
data over short distances
(2 to 5 miles). The Em50R is
the best option if:
You don’t have cell
coverage at your field site.
You want to collect data
from all your loggers at a
central location.
*2.4 GHz radios available for
global customers.
Your research sites have
cell service.
You want regular access to
your data but can’t visit your
site to get it.
D
15
Your Data, Delivered
Get your data in seconds on any
computer with an internet connection.
Y
ou don’t need a mobile phone, a solar
panel, nor even a conversation with
your local cell service provider to
make this work.
Measure, log, and remotely transmit
data from five Decagon sensors at up
to 5 minute intervals.
You pick the times during the day when
Em50G logger data is automatically sent to
the Decagon Data Service via the integrated
cellular module. Once uploaded, you have
24/7 access over the internet to your data
stored on the Decagon Data Service. No
logger programming or expert knowledge of
cellular networks are necessary.
Automatically download data to DataTrac or
create Excel files on demand.
Share your data or not.
Sharing you data with
trusted colleagues is as
easy as sharing your
subscription
information.
16
No-hassle cellular service included in the
the box. First year service is pre-paid.
Em50G can be used in 120 countries with
more than 200 partner networks providing
GSM/GPRS cellular services.
Decagon Data Service (included with every
Em50G) provides 24/7 access to data from
anywhere you have cellular service.
Data is confidential, encrypted, and
password protected. Downloads from the
Decagon Data Service are encrypted using
the same security a your online bank
account.
Em50G provides go/no go cellular
signal testing. Full cellular and data
transfer testing available with included
software.
Em50G powers the sensors and
the integrated cellular module on 5
AA batteries; no external power
source needed.
Em50G Specifications
Input ports 5, 12-bit analog or 32-bit digital,
compatible with any Decagon Devices sensor.
Enclosure access
Hinged door with eyelet for securing with usersupplied padlock.
Data storage 1MB (36,800 scans on all 5 ports).
Mounting 3.8 cm (1.5 inch) mast or wall mount
Memory type Non-volatile Flash
Local communication Dedicated serial port 3.5mm
stereo jack for use with the Decagon Serial Cable
Adapter (SCA) or Decagon USB Cable Adaptor (UCA)
Logging interval 5 minutes to 24 hours, logged data
is 1-minute average of user-specified interval.
Upload interval 1 to 6 times per day at
user-specified times.
Operating environment
-30°C to 60°C, up to 100% RH
Battery service life 6+ months
Decagon Data Service
(included with every Em50G)
Data plan Annual subscription provided by Decagon
Devices with over 200 GSM/GPRS partner networks
in 120 countries.
Server location Decagon Network Operations Center,
Pullman WA USA
External power None needed
Enclosure
Weatherproof, impact and UV-resistant polymer.
Enclosure dimensions
12.7 x 20.3 x 5.1 cm (5 x 8 x 2 in)
Data security SSL/TLS encrypted data transfer; a
unique Device ID and password (provided with each
logger) are necessary for accessing data from the
server.
Cellular Frequency Quad-band (850/900/1800/
1900 MHz) GSM/GPRS for use worldwide.
Software
ECHO Utility Software and DataTrac Software Demo
17
Transmit Data Locally
COLLECT DATA WIRELESSLY AT A SINGLE POINT
X
Multiple Em50R loggers collect data then transmit to a nearby office (2 to 5 mile range).
T
he Em50R wireless data logger transmits data to a central receiving location using
900 MHz* radio communication. No existing wireless infrastructure is necessary.
Multiple Em50R loggers are often used to collect data from many locations, which are then
transmitted to a nearby office (2 to 5 mile range)
Benefits
Long-range wireless radio allows large spatial
monitoring.
No need to visit each site after initial
installation.
No programming—only simple configuration.
Em50R Logger—MEASUREMENT NODES
Channels 5.
Storage >36,000 scans - Each scan includes logger name,
date, time, and 5 measurements
Scan Interval User-programmable from 1/minute to 1/day
Communication 900 MHz radio*
Power 5, AA alkaline batteries
Battery service life 6+ months
Dimensions 12.7 x 20.3 x 5.1 cm (5 x 8 x 2 in)
*2.4 GHz radios available for global customers.
[ DataStation—BASE STATION
The DataStation radio base station collects and stores data from multiple Em50R
data loggers.
18.4cm L x 10.5cm W x 2.86cm H (7.25”L x 4.125”W x 1.125”H)
18
“Confirm Data Delivery” protocol allows complete and reliable data transfer.
RS232 serial cable connectivity.
Storage for over 28,000 broadcast packets.
Flexible 12–24 V AC/DC power.
Telemetry testing for connection quality analysis during set-up.
Enclosures and solar panels for remote installs.
Accessories for multi-site installation.
Save your laptop by
investing in an Archer Field
PC. Laptops are great, but
they require two hands and
aren’t built to be
submersed, dropped, and driven around
on dusty roads. Archer is built for
frequent field trips, and it will last long
after it has become worth the
Em5b Logger
For EC-5, EC-10, EC-20,
ECRN-50, ECT, & 10HS
Storage 3,300 scans,
1/minute to 1/day
Communication RS232
Power 4, AAA alkaline batteries,
battery life 3+ yrs
Dimensions 8.7 x 6.2 x 3.5 cm
(3.75 x 2.75 x 1.25 in)
Download software included with
Em5b purchase.
X The Em5b has 5 channels that
allow scientists on a tight budget to
monitor soil moisture and other
environmental parameters
investment.
Archer Field PC
The ultra-rugged Archer Field PC is our recommended platform
for managing data in-the-field. The Archer is water-proof,
shock-resisitant, and remarkably versatile. The Archer is
capable of a wide range of adaptations, including:
Capture, map, or navigate using GPS options.
Communicate wirelessly via Bluetooth, Wi-Fi.
See your screen in the sun.
10+ hour battery life.
Windows Mobile 6.1 operating system.
Comes with ECH 2O Utility Mobile.
k The ProCheck
instantaneously
displays calibrated or
raw readings of any
Decagon soil moisture
or environmental
sensor.
Use the
instant-read
ProCheck to test
individual sensors
for good
installation.
ProCheck
For all Decagon sensors.
Channels 1
Storage 5,000 readings. Each reading includes sensor
type, date, time, raw value, calibrated value and
calibration coefficients.
Communication Serial RS232.
Power 4, AA alkaline batteries
Dimensions 15.5 x 9.5 x 3.5 cm (6 x 3.7 x 1.4 in)
ECH2O Utility software
Free software included with every Em50
Series and Em5b data logger. Configure
sensors, change measurement intervals,
monitor battery life and memory levels.
CAPABILITIES
Instantaneously read and store data from any Decagon
sensor.
Troubleshoot field measurements.
Address sensors being used in SDI-12 mode.
D
19
CASE STUDY: COMPLEX HYDROLOGY
ON THE PALOUSE
A
t Cook Farm,
Decagon
scientists and
Washington State
University
researchers are
calibrating,
refining and testing
an existing
hydrologic model
for the Palouse.
X
SOIL MOISTURE SYSTEM
WITH TEMPERATURE /
EC OPTION
Each node has 5 soil moisture
sensors monitoring the soil
profile at one foot vertical
intervals—the shallowest is a
foot below the surface; the
deepest five feet down. The
sensors measure volumetric
water content, soil temperature,
and Electrical Conductivity. The
Em50R logger stores the data
internally and transmits it to the
DataStation.
“We have soil
moisture sensors
See sensors specifications
on page 12.
buried at the same
depths all over the farm, but the
volumetric water content readings
can be different from location to
location. Sometimes they seem
almost random. When I flew over the
farm this summer, suddenly I could
see those variations in living color.
Patterns of wheat senescence showed
exactly what the sensors had been
telling us—golden wheat in the dry
areas, greener wheat in the valleys
and every variation in between.”
Watch a 5 minute video of a Soil
Moisture System installation at
www.decagon.com/education/
video-index/
20
42
200+
wireless logger nodes
soil moisture sensors
CASE STUDY
“Hassle Free”
Telemetry
X
DATASTATION
INTEGRATED WITH
AN EXISTING
METEOROLOGICAL TOWER
The station gathers soil
moisture, temperature, and
EC data from all
42 loggers hourly.
See DataStation
specifications on page 18.
YOU CAN SEE SIGNAL STRENGTH AND CONNECTION
SPEED IN REAL-TIME AS YOU PICK THE BEST SPOT
FOR A DATA LOGGER NODE SITE. IT’S SIMPLE.
TEST FIRST AND INSTALL SECOND.
D
21
Watershed Characterization
Package
The elements of this bundle
were chosen to help you nail
two tough components of
the water balance: storage
and deep percolation.
The drain gauge’s elegant
design ensures that water will
flow through and not around it,
giving you accurate deep
percolation rate.
High accuracy water content
sensors let you calculate storage
from differences in profile
water content.
Close Your
Water Balance
WITH PRECIPITATION, SOIL
STORAGE, AND DEEP
DRAINAGE
n Get closer to completing the
water balance.
n Collect the data you need to calculate
water input, storage, and drainage in the
vadose zone.
n Measure deep drainage rather than
estimating to reduce errors in water
balance calculation
IN THE BOX
Standard Configuration #40525
Water Balance System
Drain Gauge G3
Adding on a rain gauge gives
you the downward “vertical
water profile”—incoming,
storage, and drainage.
Three, 5TM Soil Moisture Sensors
ECRN-100 High Resolution Rain Gauge
Em50 Data Logger
DataTrac 3 Software
USB Cable
Batteries
Mounting hardware
Printed and electronic documentation
22
Contact Decagon to add telemetry options.
WATER BALANCE
Three, 5TM Soil Moisture Sensors
Measure water storage using dielectric
water content sensors at different
depths in the profile. Sensors specs on
page 12.
Drain Gauge G3
Measure deep
drainage with
this thoughtfully
designed passive
capillary
lysimeter.
Drain Gauge G3
specs
on page 37.
DataTrac 3 Software
Dynamic
graphical
interface brings
data to life.
Organize, graph,
and store data;
view and edit
data in table
format; create
reports and
transfer data to
other DataTrac 3
users.
ECRN-100 High
Resolution Rain
Gauge
Measure incoming
water values for water
balance calculations.
Em50 Data Logger
Plug in the sensors, set time
and measurement intervals,
and start logging data. No
programming necessary.
D
23
Irrigation Monitoring Package
The elements of this bundle
were chosen specifically for
you to see both how much
water is in the soil and how
much of that water is
available to plants.
A matric potential sensor
measures plant available water
so you know when to turn
irrigation on.
n Know when to turn
irrigation on.
Soil moisture sensors only measure
volumetric water content. Use the matric
potential sensor to monitor plant
available water.
n Know when to turn
irrigation off.
Fast-response soil moisture sensors let you
track plant water use in real time and set
an accurate full point that minimizes
wasted water.
IN THE BOX
Soil moisture sensors let you
know when you’ve reached field
capacity and should turn
irrigation off.
Standard Configuration #40523
Soil Moisture/Irrigation System
Two, 5TE Soil Moisture Sensors
MPS-1 Matric Potential Sensor
Pressure on/off switch
ECRN-100 Precipitation Sensor
Em50 Data Logger
DataTrac 3 Software
A pressure switch monitors
pipes to make sure irrigation
is happening as scheduled.
USB Cable
Batteries
Mounting hardware
Printed and electronic documentation
Contact Decagon to add telemetry options.
DataTrac lets you watch
the interaction of all the
sensors graphically.
24
See sensor specs on pages 12 and 13.
IRRIGATION
Settling For 1 Water
Parameter?
KNOW WHEN TO TURN IT ON
AND WHEN TO TURN IT OFF
Pressure On/Off Switch
Tracks irrigation events by recording when
water is turned on and off.
MPS-1 Matric Potential Sensor
This sensor goes beyond just water
content to describe water
availability. Measures 0 to -500 kPa.
DataTrac 3 Software
Dynamic graphical interface
brings data to life. Organize,
graph, and store data; view data
in table format; create reports
and transfer data to other
DataTrac 3 users.
ECRN-100 Precipitation
Sensor
Designed to measure both
precipitation and irrigation
events.
Two, 5TE Moisture Sensors
Soil moisture sensors located
within and below the root zone
track water content through
the profile.
Em50 Data Logger
Plug in the sensors, set time
and measurement intervals,
and start logging data. No
programming necessary.
D
25
Essential Water Potential Data
26
MAKE FAST, ACCURATE
WATER POTENTIAL
MEASUREMENTS IN THE LAB
NEW FEATURES
Precise Mode—verifies full equilibrium
before displaying a final reading.
M
easure the water potential of soil,
soilless substrate, plant tissue, or
any porous material in 5 to 10
minutes. Effective range: -0.1 to -300 MPa.*
Speedy Equilibration—new
hydrophobic teflon impregnated nickel
alloy sample chamber coating reduces
equilibration time.
Finely-Tuned Adjustments—new
algorithms allow precision calibration
and ± 0.05 MPa (or better) accuracy.
Better range and accuracy—resolves
temperatures to a thousandth of a
degree to push the functional range
to -0.1 MPa.
*Note: WP4C will read to 0 MPa, but readings of samples
wetter than -0.1 MPa will have an increasing, and
typically unacceptable, percentage of error. Some
users may be able to make useful measurements
in samples wetter than -0.1 MPa using special
techniques. For more information, see the
WP4C User Manual.
Y SOILS
The WP4C measures water potential by
determining the relative humidity of the air
above a sample in a closed chamber (an
AOAC-approved method, conforms to
ASTM 6836).
WP4C SPECIFICATIONS
Operating Environment
5 to 43°C (41 to 110°F)
Temperature Control
15° to 40°C ± 0.2 °C
Sensors 1. Infrared temperature. 2. Chilled-mirror dewpoint.
Range 0 to -300 MPa
Accuracy ± 0.05 MPa from 0 to -5 MPa, ± 1% from -5 to -300 MPa
Read time Typically 5 to 10 minutes
Interface Cable Serial cable (included)
Data Communications
RS232 compatible, 8-bit ASCII code, 9600 baud, no parity, 1 stop bit
Weight 3.2 kg (5.2 kg shipping weight)
Universal Power 110/ 220V AC, 50/60Hz
Sample dish capacity 7ml recommended (15ml full)
25 plastic cups and 10 stainless steel cups included
Calibration Standard 0.5 molal KCl (-2.19MPa)
How does sample disturbance affect readings?
Read the “Effects of Sample Disturbance on Soil
Water Potential Measurements” Application Note at
www.decagon.com/sampledisturbance
Applications
Soil moisture characteristics
Root zone water potential profiles
Leaf water potential
Seed priming
Seed water relations
Expansive soil characterization
D
27
Fast Response Tensiometers
U
X T5 mini-tensiometers are essential for the measurement
of water potential in small spaces like soil columns, potted
plants and in laboratory water flow experiments.
X T4 Tensiometer Standard tensiometer.
External refilling optional.
X T8 Tensiometer Includes temperature measurement,
water level indicator and external refilling option.
MS designs and
manufacturers
tensiometers to make
research easier. The pressure
transducer-based sensors
allow for precise
measurement of water
potential. A variety of sizes
give you options for
deployment from field to lab.
Their newest tensiometer, the
TS1, allows yearlong field
deployment after installation.
h TS1 The world’s first smart tensiometer. Designed to be deployed in the field and left, the TS1 logs
water potential data, self refills, monitors temperature, and self-empties when the temperature nears
freezing to avoid damage.
TENSIOMETERS SPECIFICATIONS
Range 0 to -85 kPa*
Accuracy ± 0.5 kPa
Resolution 0.1 kPa
Cable length 5m
Hysteresis typ. 0.1% FS
Stability over one year typ. 0.5% FS
[ Infield 7
Handheld digital
display interfaces
with all UMS
tensiometers for
quick data
collection.
Sensor Piezoresisitve pressure transducer, overpressure max
± 3000 hPa
Electronics Wheatstone full bridge
Compatible with Infield 7
and Campbell Scientific dataloggers.
28
*With careful refilling, the T5 tensiometer can make measurements well below -85 kPa.
T
“A TENSIOMETER SCIENTISTS
COULD ONLY DREAM ABOUT”
hanks to cavitation, many scientists have a lovehate relationship with tensiometers. At one time,
Georg von Unold was one of them. “They leaked
and would quickly run dry,” he recalls. “The
ceramic membrane was not consistent, and it was
easy to see that there was a large variation of pore
sizes between the different individual tensiometers.
The most difficult problem was that the water
reservoirs were opaque, which meant I couldn’t see
if there were bubbles that may have occurred
during refilling or if cavitation had occurred.”
www.decagondevices.com/
for more specs on
these UMS
Tensiometers. More
information on the
history and theory
behind them will
appear in the 2010
issue of Water
Potential News.
D
Y SOILS
See
Precision Engineering,
Meticulous Construction
After weeks of frustration, von
Unold decided to start fresh and
design a better tensiometer. By
the time he’d finished, he had a
master’s degree and a company,
UMS. The tensiometers he builds
at UMS, thanks to precision
German engineering, meticulous
Georg von Unold, UMS
construction, and fanatical
attention to detail, are modern
classics with terrific accuracy and a range that
(with a careful operator) can extend
beyond -200 kPa.
von Unold describes these tensiometers as
instruments “soil scientists and ecologists from a
century—or even a few decades—ago could only
have dreamed about.” They certainly made us
excited, which is why we offer UMS
instrumentation to the U.S. market. 29
Measure Soil Hydraulic Properties
Hyprop
F
orget the pain of using pressure plates.
Use Hyprop to generate detailed
moisture release curves, typically
within a few days.
Just take your undisturbed sample, insert the
measurement head, put it on the balance,
and in less than a week, you have a detailed
moisture release curve.
HYPROP SPECIFICATIONS
Range +2 kPa to -120 kPa / -250 kPa
Resolution 0.001 kPa
Accuracy ± 1.5 kPa
OPTIONAL LABORATORY SCALE SPECIFICATIONS
Measuring range 0 to 2.5kg
Resolution 0.01g
Accuracy ± 0.1g
Interface RS232
Uses undisturbed soil samples.
Works in all soil types
Bonus feature gives unsaturated
hydraulic conductivity values for the
soil sample.
Drying portion of the moisture curve
generated by Hyprop.
X
30
Create Soil Moisture Release Curves
AquaSorp IG
INSERT SAMPLE, PRESS START,
AND WALK AWAY
A
Y SOILS
QUASORP IG brings click and read
efficiency to soil isotherms. In 24 to
48 hours, AquaSorp IG generates up to
200 data points (water potential vs. water
content) in the wetting and drying
directions. AquaSorp works in the dry
range of water potential (-10 to -300 MPa).
Whether you are studying adsorption/
desorption characteristics in dry soil or
characterizing soil expansion, AquaSorp
will provide the information you need
with a fraction of the time
and effort.
Specifications
Range -10 to -300 MPa.
Accuracy ±1MPa or ±1%
Temperature Operating Range 15 to 40° C
Size 44 w x 38 d x 28 h cm
Weight 19 kg
Benefits
Rapid isotherm generation.
Fast expansive soil characterization.
Y Isotherm
generated by
the Aquasorp.
D
31
Monitor Water Potential In Situ
ACCURATE MEASUREMENTS IN
ANY SOIL TYPE
I
MPS-1 Water Potential
Sensor down-hole, pack wet soil around
it, plug the sensor into an Em50 or other
compatible datalogger, and start logging
water potential data. The MPS-1 integrates
high-performance ceramic with new
dielectric circuitry to measure a wide range
of soil water potentials without user
maintenance.
NSTALL THE
MPS-1 SPECIFICATIONS
Range -5 to -500 kPa
Accuracy
±40% of reading
Resolution
1 kPa from 0 to -100 kPa
4 kPa from -100 to -500 kPa
Measurement time 10 ms (milliseconds)
Power requirement 2 to 5 VDC @ ~ 10 mA
Output 525 to 925 mVDC independent of
excitation voltage
Operating temperature -40 C to +50 C
Sensor dimensions 75 mm x 32 mm x 15 mm
Connector types 3.5 mm “stereo” plug
Cable length 5 m standard, extension cables available
Datalogger Compatibility (not exclusive)
Decagon Em50, Em50R, Em50G
Campbell Scientific CR10X, 21X, 23X, CR1000, CR3000, etc.
APPLICATIONS
Water potential monitoring in vadoze zone.
Crop stress.
Waste water drainage studies.
Irrigation monitoring and control.
Plant water availability.
BENEFITS
Continuous measurement of soil water potential.
No complicated programming.
No maintenance required after installation.
32
Learn more about the measurement of
water potential methodologies and limitations
at www.decagon.com/waterpotential
D
www.decagondevices.com
33
Measure Soil Hydraulic Conductivity
QUANTIFY SPATIAL VARIABILITY
OF SOIL HYDRAULIC
CONDUCTIVITY
Bubble
chamber
stopper
Suction
regulation
tube
Bubble
chamber
Chamber
barrier
Acrylic
tube
Water
reservoir
Mariotte
tube
Sintered stainless steel
disc encapsulated in
elastomer base
W
ater movement in soil is
spatially variable. The
Mini Disk Infiltrometer is a
quick way to test hydraulic conductivity
and infiltration rates.
Backpackable
Small, compact, and simple, the Mini
Disk Infiltrometer is a true field
instrument. It can be tossed into a
backpack with a bottle of water.
Quick Setup
Just fill the reservoir, set the suction, and
start measuring infiltration. You don't
have to pre-saturate the disk.
Straightforward Calculations
Enter infiltration and elapsed time data in
the included spreadsheet calculator to find
hydraulic conductivity.
Reliable
Both scientists and technicians have used
the Mini Disk Infiltrometer to design
irrigation systems, demonstrate hydraulic
conductivity, evaluate erosion hazard, and
gauge the impact of forest fires.
SPECIFICATIONS
Total Length 32.7 cm
Suction Range 0.5 to 7 cm of suction
Water Volume for Operation 135 mL
Diameter of Sintered Stainless Steel Disc
4.5 cm dia., 3 mm thick
34
And After the Fire...
USING THE INFILTROMETER TO
ASSESS EROSION RISK
F
lagstaff, Arizona is typically a dry
place. In August 2010, Flagstaff's
residents experienced severe floods. Video
footage shows churning rivers flowing
down roadways and around and through
homes. August's monsoon rains
contributed the water, but the floods were
actually caused by the 15,000 acre Shultz
fire that raged around Flagstaff from April
to July.
Floods Follow Fires
To Forest Service research engineer Dr.
Peter Robichaud, the setup is classic.
Robichaud, who studies post-fire
erosion processes, says that after a fire,
soil commonly becomes water repellent.
That, together with loss of forest floor
matter and ash clogging soil pores, creates
a dramatic increase in runoff. "It's not just
a 100% increase," he says. "It's orders of
magnitude."
[ 2010's Shultz Fire burned
15,000 acres of Arizona
forest land.
Read the full article about Dr. Robichaud’s research
at www.decagon.com/robichaud or access his
online Erosion Risk Management Tool at
forest.moscowfsl.wsu.edu
HYDROLOGY
Modeling to Improve
Response
Robichaud's work in
modeling post-fire erosion is
used by many practitioners to
assess the impacts of a fire,
predict erosion, and make
plans to manage and reduce
the associated risks.
Robichaud uses the Mini
Disk Infiltrometer as a tool to
characterize changes in the
soil after a fire. "It's a
practical instrument for fire
assessment teams to use. It
provides the information they need to help
them determine the changes in infiltration
characteristics."
34
X After a fire, soil commonly becomes water repellent,
just one factor in increased runoff.
X Residents of Flagstaff experienced significant flooding.
"When you have steep slopes and high velocities, things
can converge rather quickly," Dr. Robichaud says.
35
Monitor Solute Movement into Groundwater
MEASURE DEEP DRAINAGE AND SOLUTE
FLUX WITHOUT THE BIG LYSIMETER
PRICE TAG
T
he new Drain Gauge G3 lets you measure
drainage rates in unsaturated soils and collect
soil water samples for chemical analysis.
Complete the Water Balance
Water draining from the bottom of the soil profile is an
important component of the water balance. It’s usually
estimated to be whatever is left over after the other
components are measured, but these estimates are often
subject to large errors. The drain gauge lets you measure
deep drainage directly. Optional soil moisture and rain
gauge sensors add data to
complete the water balance.
Evaluate Groundwater
Contamination
Typically, it’s difficult to
monitor contaminants until they
reach the groundwater. The
Drain Gauge lets you collect
water just below the root zone
and pump it to the surface for
further analysis. Using the
drainage rate and the chemical
concentration in the drainage
water, you can calculate the flux
of chemical through the soil.
”I would put these everywhere—
under farms, under golf courses,
anywhere you want to know what’s
being leached into groundwater and
how much of it there is. It gives you
very good estimates, and the
maintenance is essentially nil. You
just dig a hole, chuck it in, and go
on farming, or golfing, or fertilizing.
All you have to do is get the water
and analyze it.”
D
36
Y The drain gauge measures total drainage and saves
samples for lab analysis.
FLUX DIVERGENCE—HOW TO
MEASURE WHAT’S REALLY
MOVING
W
ater is pulled through the soil in
response to water potential
gradients, or “soil suction.” The two
components of soil suction that are
important in calculating water balance
are matric suction and gravitational
suction.
Collection Challenges
HYDROLOGY
Gravitational suction—water movement
due to the pull of gravity—is only
significant in soils wetter than field
capacity (33 kPa). Matric suction—
water movement due to the attraction
between water and soil particle
surfaces—makes it difficult to collect
water in a traditional pan lysimeter
because the pan has no suction. Water,
always moves towards areas of higher
suction, will flow around the lysimeter
unless the soil itself is very close to zero
suction (saturation).
Creating Suction
This phenomenon is called flux
divergence. The Drain Gauge uses a
fiberglass wick to create a constant
suction and a divergence control tube to
minimize flux divergence and
convergence. Find more information
about the advantages and limitations of
the Drain Gauge at decagon.com
37
Monitor Groundwater Leaching
MEASURE DEEP PERCOLATION
RATES DIRECTLY
D
etermine the volume of water and chemicals
draining from the vadose zone into groundwater.
Our Drain Gauges measures flow rate in unsaturated
soils and collects soil water samples for chemical
analysis.
An ingenious duct and wick design maintains a flow rate
within the gauge equivalent to that in surrounding soil.
A surface port allows you to draw out samples to
analyze for chemicals, fertilizers, and other
contaminants.
h
DRAIN GAUGE APPLICATIONS
Waste landfill sites, to advise operators when drainage is occurring and where
cover systems need to be improved.
Maximization of food processing waste applications by monitoring water
drainage rates and water quality below the root zone.
Environmental research measuring percolation and recharge rates.
Farming operations, to measure and control irrigation during a cropping season.
Recreational facilities, such as golf courses, to measure and control excess
water and nutrient losses.
1.47m
k Drain Gauge G2
Constructed from Inert
Materials
Chemicals won’t react
with the tube, the
sensors, or the
collection reservoir.
i
38
36
DRAIN GAUGE G2
Flow Through Technology
DRAIN GAUGE G3
Sample Capture Technology
Measurement Surface Area
324 cm 2
Measurement Surface Area
507 cm 2
Sampling Reservoir Volume
150 mL
Sampling Reservoir Volume
3 L
Accuracy
± 10%
Accuracy
± 10%
Resolution
0.1 mm drainage
Resolution
0.1 mm drainage
Suction at Intake
110cm (11 kPa)
Suction at Intake
110cm (11 kPa)
Total length
147 cm
Total Length
147 cm
Divergence Control Tube (DCT)
Length
60 cm
Divergence Control Tube (DCT)
Length
60 cm
Measurement Time
10 ms
Measurement Time
150 ms
Power
2.5–3 VDC @ 3 mA, for 10 ms
Power
3.6–15 VDC, 0.3 mA quiescent, 20
mA during 150 ms measurement
Datalogger Compatibility
EM50/EM50R/EM50G and all
Campbell Scientific Loggers
Construction Material
Stainless Steel or PVC DCT, inert
PVC reservoir, polyethylene
evacuation tube, dry fired fiberglass
wick, and epoxy molded drainage
sensor
Datalogger Compatibility
EM50/EM50R/EM50G and all
Campbell Scientific Loggers w/ SDI12 capability
HYDROLOGY
Construction Material
Galvanized Steel DCT, inert
polyethylene reservoir, and dryfired fiberglass wick
Z New Drain Gauge G3 has
surface port for easy access
to drainage / temperature /
EC sensor for maintenance.
39
Continuously Sample Nitrogen,
TENSIOMETER CONTROL ENSURES
ACCURATE SAMPLE CONCENTRATIONS
D
on’t take a soil core every time
you want data. Leave your
experimental site undisturbed and
take more meaningful pore water samples
with UMS’s pore water samplers.
How does it work?
A pore water system is a quick access point
for extracting soil water. Rather than digging
up a chunk of soil and performing an
extraction every time you want a sample,
you install a specially tipped tube in the soil.
Soil water samples are gently extracted from
soil pores using suction pressure matched to
natural soil water tension.
Eliminates Spatial Variability
Sampling in the same undisturbed location
every time gives you better data.
Uses Natural Sampling Suction
Precisely controlled tension means you
sample what’s actually in the soil water.
Constant, unregulated tension preferentially
samples the wet time periods, diluting your
samples and giving inaccurate
concentrations. UMS’s unique tensiometer
control matches sampler suction to the
natural suction of the soil as conditions
change for the most accurate sample
concentrations.
Customized to Solute Type
UMS’s patented silicone carbide tip is inert to
a large range of compounds. Other tips are
also available.
Measure net
mineralization rates.
Sample for organic
carbon.
Quantify the
presence of heavy
metals, pesticides,
and other
contaminants.
40
Phosphorous, and More in Soil Water
PORE WATER SAMPLERS
VACUUM SYSTEMS
SIC20
Shaft Diameter
20 mm; acrylic
VS/VS-pro/VS-Twin
Power Supply
10.5 to 15 VDC
Shaft Length
20 to 210 cm; customized to
order
Interface
tensioLINK, RS485
Porous Ceramic
20 mm dia.; 60 mm length
Bubble Point
-90 kPa
Suction Tube
Polyethylene; 1.6 mm i.d.;
2.8 mm o.d.
SK20
Shaft Diameter
20 mm; acrylic
Shaft Length
20 to 210 cm; customized to
order
Porous Ceramic
20 mm dia.; 60 mm length
Bubble Point
-100 kPa
Suction Tube
Polyethylene; 1.6 mm i.d.;
2.8 mm o.d.
Shaft Length
20 to 210 cm; customized to
order
Porous Ceramic
20 mm dia.; 60 mm length
Bubble Point
-100 kPa; but the PE cover
allows water flow only up to 20 kPa
SIC20
Silicon
Carbide
SK20
Aluminum
Oxide Ceramic
Allows for
sampling of a
broad range of
chemicals due to
low sorption.
Suitable for
determination of
nitrate and
common organic
and inorganic
substances.
Vacuum Regulation Range
0 to -85 kPa
Dimensions
26 x 16 x 10 cm
Enclosure
Aluminum
Operating Temperature
-10°C to +45°C
VacuPorter
electric pump
Max. Vacuum
-85 kPa
Max. Pressure
400 kPa
Capacity
10 liters/min
Batter Capacity
Internal rechargeable battery;
7 hours of operation
Case
30 x 25 x 13 cm
Weight
4.8 kg
VPS-2
hand-operated
floor pump
Max. Vacuum
-85kPa
HYDROLOGY
SPE20
Shaft Diameter
20 mm; acrylic
Memory
5000 readings
Capacity
0.41 liters per stroke
Suction Tube
Polyethylene; 1.6 mm i.d.;
2.8 mm o.d.
SPE20
Polyethylene
Nylon
Membrane
Specially suitable
for heavy metals,
herbicides, and
pesticides.
D
41
Model Heat Movement
GET A HANDLE
ON HEAT TRANSFER
F
transfer in
the soil plant atmosphere
continuum with the KD2
Pro Thermal Properties
Analyzers. The KD2 Pro has
three interchangeable sensors
which measure thermal
diffusivity and specific heat (heat
capacity) measurement functions
along with data storage
capabilities and an automatic
data collection mode. OLLOW THE HEAT
KS-1
6cm needle
length
Thermal conductivity
of liquids.
TR-1
10cm needle
length
Thermal conductivity
or thermal resistivity
of soil or porous
materials. ASTM and
IEEE compliant.
Heated Needle Technology
Requires No Calibration
Displays in Engineering Units
Small Needle Minimizes Soil
Disturbance
SH-1
30mm dual
needle length
3 parametersThermal Conductivity,
Thermal Diffusivity,
and Specific Heat.
42
D
KD2 Pro Specifications
Measurement 90 Seconds
Accuracy*
± 5% to ± 10% Conductivity/Resistivity
± 10% Thermal Diffusivity
± 10% Specific Heat
Ranges*
K: 0.02 to 4 Wm-1 C-1
D: 0.1 to 1.0 mm2s-1
R: 0.5 to 50 mC W-1
C: 0.5 to 4 MJ m-3 C-1
Data Storage 4095 readings
Environment –50 to 150°C
Case Size 15.5 x 9.5 x 3.5 cm
Power 4, AA Batteries
Sensors
KS-1, 6 cm, 1.27 mm Dia. needle
TR-1, 10 cm, 1.27 mm Dia. needle
SH-1, 30 mm, 1.27 mm Dia. 2 needles
*Accuracy and measurement range vary with sensor
type.
Cable 1m
Z Each KD2 Pro comes factory calibrated and
includes performance verification standards.
THERMAL
Watch a three and a half minute
video on measuring soil thermal
conductivity with the KD2 Pro at
www.decagon.com/education/
video-index/
43
REQUEST A FREE EC POSTER BY EMAILING
[email protected]
44
TRANSLATING DATA
Essential Soil Moisture References
WATER CONTENT CONVERSIONS
wd (kg/kg)
wd = Mw
Ms
wd =
ww (kg/kg)
ww= wd
1 + wd
ww=
q (m m )
rdry
q= r wd
w
3
-3
ww
1 - ww
r
wd = r w q
Mw
Mw + Ms
rw
ww= r q
dry
q= rrwet ww
w
wet
q=Vw
Vt
DEFINITIONS
wd
mass water content, dry basis
ww
mass water content, wet basis
q
volume water content
rdry
dry bulk density (kg m-3) = Ms /Vt
rwet
wet bulk density (kg m-3) = (Ms + Mw)/Vt
rw
water density (kg m-3) = 1000 kg m-3
Ms
mass of dry solid
Mw
mass of water
Vw
volume of water
Vt
total volume, soil, water and air
45
Distributors
AFRICA
South Africa
CS Africa
1a Meson Street
Technopark
Stellenbosch
tel: +27 21 880 1252
fax: +27 21 880 0240
[email protected]
www.csafrica.co.za
ASIA
China
Ecotek
Unit A,22F., Chengming
Building
No.2 Xizhimen Nadajie
Beijing
tel: +86 10 51 665 551, 66
001 563
fax: +86 10 66 001 652
[email protected]
www.ecotek.com.cn
India
Nu-Tech International
E-4, 2nd Floor, Bali Nagar
New Delhi 110-015
tel: 91-11-5467218/ 5420595
fax: 91-11-25420595/
25437988
[email protected]
www.nutechintl.com
Japan
AINEX Co., Ltd.
2-4-3 Shinkamata, Ohta-ku
Tokyo - 144-0054
tel: +81 3 5713-0388
fax: +81 3 5713-1388
[email protected]
www.ai-nex.co.jp
46
Korea
C&H
Room #1505 Hwanghwa Bldg.
Yeoksam-dong, Kangnam-ku
Seoul
tel: +82 2 501 3869
fax: +82 2 556 0480
[email protected]
www.candh.net
Malaysia
Team Medical & Scientific Sdn
Bhd
No. 41, Jalan Anggerik
Vanilla T-31/T
Kota Kemuning40460
Shah Alam
Selangor, Malaysia
tel: 603-5122-5108
fax: 603-5122-1608
[email protected]
www.tms-lab.com
Taiwan
Wilson Scientific Co. Ltd.
9F-3, No. 159 Sec.1
Shin-Tai-Wu Rd.
Shijr, Taipei County
tel: 886 2 2690 7696
fax: 886 2 2690 7721
[email protected]
Thailand
Win Siam Co., Ltd.
701/12 Wong-Sawang Road
Bang Sue, Bangkok 10800
tel. +66 2910 9898
[email protected]
AUSTRALIA AND NEW
ZEAL AND
Australia
ICT International Pty. Ltd.
PO Box 503
Armidale. NSW 2350
tel: +61 267 726 770
fax +61 267 727 616
[email protected]
www.ictinternational.com.au
EUROPE
Austria
UMS Gmbh München
Gmunder Str. 37, 81379
München, Germany
tel: +49 89 12 66 52 14
fax: +49 89 12 66 52 20
[email protected]
www.ums-muc.de
Belgium/Luxembourg
CaTeC
Turfschipper 114
2292 JB Wateringen
The Netherlands
tel: +31 174 272 330
fax: +31 174 272 340
[email protected]
www.catec.nl
Czech and Slovak Republics
Ekotechnika Spol. S.R.O.
Mokropeska 1832
252 28 Cernosice, Czech
Republic
tel: +420 737 044 323
fax: +420 251 640 512
[email protected]
www.ekotechnika.cz
Denmark
Inverva ApS
DK-2970 Hørsholm,
Denmark Stakkeledet 63
tel: +45 6595 9454
fax: +45 6595 9452
[email protected]
www.inverva.com
France
Sols Mesures
17, rue Jean Monnet
Z.A. des Côtes
78990 Elancourt
tel: +33 1 30 503 450
fax: +33 1 30 503 449
[email protected]
www.sols-mesures.com
Germany
UMS Gmbh München
Gmunder Str. 37, 81379
München, Germany
tel: +49 89 12 66 52 14
fax: +49 89 12 66 52 20
[email protected]
www.ums-muc.de
Greece
Scientact SA
16 Kanari St
54644 Thessaloniki
tel: +30 2310 946 126
fax: +30 2310 947 005
[email protected]
www.scientact.com.gr
Iceland
Measurement Systems
Hofdabakki 9c
110 Reykjavik
tel: +354 661 1169
fax: +354 567 3995
www.maelibunadur.is
Italy
Misure SNC
Via degli Olmetti, 38
00060 Formello - Roma
tel: +39 06 907 5535
fax: +39 06 907 5536
[email protected]
www.misure.net
Netherlands
CaTeC
Turfschipper 114
2292 JB Wateringen
The Netherlands
tel: 31 174-272330
fax: 31 174-272340
[email protected]
www.catec.nl
Poland
Geomor-Technik Sp. Z O.O
ul. Bialowieska 2
PL 71-010 Szczecin
tel: +48 91 482 00 90
tel/fax: +48 91 482 60 87
[email protected]
www.geomor.com.pl
Romania
SC Terra Preta SRL
Bd. Unirii nr. 61, bl. F3, sc. 4,
ap. 510
sector 3, Bucuresti, Romania
tel: +40 21 326 8567
fax: +40 31 101 6676
www.terra-preta.ro
Spain
Centro De Asesoría Dr. Ferrer,
S.L.
c/Ferran el catòlic, 3
25200 Cervera (Lleida)
Catalunya
tel: +34 93 371 05 16
fax: +34 93 473 01 98
[email protected]
www.lab-ferrer.com
United Kingdom
Labcell Ltd.
Unit 3a, Mansfield Park
Four Marks, Alton
Hants. GU34 5PZ
tel: 01420 568 150
fax: 01420 568 151
[email protected]
www.labcell.com
MIDDLE EAST
NORTH AMERICA
SOUTH AMERICA
Israel
Meteo-Tech
31 Lehi Street
Bnei Brak, 51200
tel: +97 2 3 616 0598
fax: +97 2 3 618 4384
[email protected]
www.meteo-tech.co.il
Canada
Hoskin Scientific Limited
www.hoskin.ca
239 East 6th Avenue
Vancouver, BC V5T 1J7
tel: 604 872 7894
fax: 604 872 0281
[email protected]
Agrolan Knowledge & Input
PO Box 45 Moshav NOV 12921
Ramat Hagolan
tel: 972-4-6763091
fax: 972-4-6763093
[email protected]
www.agrolan.com
4210 Morris Drive
Burlington, ON L7L 5L6
tel: 905 333 5510
fax: 905 333 4976
[email protected]
Argentina
Instrumentos del Sur S.A.
Gaspar Campos 1175
(1638) VICENTE LOPEZ
Pcia. de Buenos Aires
tel./fax: 54 11 4791–0169
cel: 54-9-11 3226-5826 153-226-5826
[email protected]
www.idelsur.com
Turkey
Bilmar Bilimsel Arastirma ve
Mühendislik A.S.
Tunali Hilmi Caddesi,
Büklüm Sokak
No: 63/57
06700 G.O.P. Ankara
tel: 0312-468 28 35
fax: 0312-468 17 17
[email protected]
8425 Devonshire
Monteal, PQ H5P 2L1
tel: 514 735 5267
fax: 514 735 3454
[email protected]
Mexico
Ruber Eim De México
Av. Arcos Ote 195-B
Col. Jardines del Sur
CP 16050, Xochimilco, Mexico,
D.F.
fax: 52 55 5675 2627
tel: 52 55 5653 3077
[email protected]
USA & All others
Decagon Devices, Inc.
2365 NE Hopkins Court
Pullman, WA 99163
tel: 509 332 2756
fax: 509 332 5158
[email protected]
www.decagondevices.com
Brazil
Braseq Brasileira De
Equipamentos Ltda.
Av. Dr. Antenor Soares
Gandra, 433 / 435
13240-000 Jarinú - SP
tel: +55 11 4016 0000
fax: +55 11 4016 1322
[email protected]
www.braseq.com.br.
Chile
AMBIMET LTDA
Garibaldi N° 1620,
Ñuñoa, CP
777 0125
Santiago - CHILE
tel: (+56 2) 274 4798 y 341
6980
fax: (+56 2) 341 6980
[email protected]
www.abmimet.cl
Peru
Enviroequip S.A.C.
Asuncion 230,
La Molina, Lima 12, Perú
tel: 51 1 348 9444
fax: (+56 2) 341 6980
www.enviroequip.net
[email protected]
D
47
What’s New?
Your Data, Delivered
The new Em50G lets you access data from anywhere
with an internet connection. Self-contained logger runs
on 5 AA batteries and sets up in less than 15 minutes.
Todd Vanek
customer support manager
Watch Your Research Unfold
Don’t wait until the end of the season to look over
your data. Check in daily with the completely
redesigned DataTrac 3. DataTrac 3 makes your
research an open book by ammending, managing, and
displaying your data as it’s collected.
Monitor the Deep Stuff
What’s being leached into groundwater, and how much
of it is there? Find out with the new fully sealed Drain
Gauge G3.
Chris Chambers
customer support scientist
Cover the Full Range of
Water Potential
A boost in accuracy makes the
Dewpoint Water Potential
Meter effective up to -0.1 MPa.
Measure the full water potential
range in the lab using this meter
together with UMS’s precision
tensiometers or Hyprop instrument.
Nick Mower
applications engineer
D
©2010 Decaagon Devices, Inc.
PRINTED IN USA
Jordan Tanasee
48
applications engineer