1
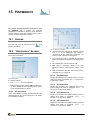
muMEASURE
FRENCH
STATION
User Manual
ENERIUM Measure station
2
Table of contents
9.1
9.2
9.3
9.4
9.5
Access......................................................29
‘’Measurements’’ screen ..........................29
Information ...............................................29
Return.......................................................31
Notes ........................................................31
10.
ENERGIES (SCREEN) ............................. 33
10.1
10.2
10.3
10.4
10.5
Access......................................................33
‘’Energy‘’ Screen ......................................33
Information ...............................................33
Return.......................................................34
Notes ........................................................35
11.
SERVICES (SCREEN) ............................. 37
EQUIPMENT DESCRIPTION .............................11
11.1
11.2
11.3
11.4
Access......................................................37
“Services” Screen.....................................37
Information ...............................................37
Return.......................................................38
5.
GENERAL PRESENTATION....................13
5.1
5.2
Presentation ............................................ 13
Model Comparison .................................. 14
12.
(SCREEN) ALARMS ............................. 39
6.
FRONT FACE .......................................15
6.1
6.2
6.3
6.4
6.5
6.6
Elements.................................................. 15
LCD Screen ............................................. 15
Optical Interface ...................................... 16
Optical Cable ........................................... 17
OK Key .................................................... 17
Navigation Keys....................................... 17
12.1
12.2
12.3
12.4
Access......................................................39
“Alarms’’ Screen.......................................39
Information ...............................................39
Return.......................................................40
13.
CUSTOMIZED SCREENS ...................... 41
7.
BACK FACE .........................................19
13.1
13.2
13.3
13.4
13.5
Access......................................................41
“Customized Screens’’ Screen.................41
Principle....................................................41
Screens ....................................................41
Return.......................................................42
7.1
7.2
7.3
7.4
7.5
7.6
Elements.................................................. 19
Measurement terminal............................. 19
Auxiliary source terminal ......................... 20
Optional cards ......................................... 20
RS485 terminal........................................ 21
Ethernet Connector ................................. 22
14.
(SCREEN) CONFIGURATION ................. 43
14.1
14.2
14.3
14.4
14.5
14.6
14.7
14.8
Access......................................................43
‘’Configuration ‘’ screen............................43
Remote Communication RS 485 .............43
Remote Ethernet Communication............44
Display......................................................45
Electrical Network ....................................46
Default values ..........................................47
Notes ........................................................47
HARMONICS ....................................... 49
INTRODUCTION ...............................................5
1.
AIM OF THE MANUAL ..............................7
2.
SAFETY .................................................8
3.
GUARANTEE, RESPONSIBILITY AND
PROPERTY ............................................9
3.1
3.2
3.3
3.4
3.5
Guarantee.................................................. 9
Property rights ........................................... 9
Copyright ................................................... 9
Registered trademarks .............................. 9
End-of-life of the devices........................... 9
4.
PACKAGING ........................................10
SOFTWARE DESCRIPTION .............................23
8.
MAIN SCREEN .....................................25
8.1
8.2
8.3
8.4
Home Screen........................................... 25
Main Menu............................................... 25
Abbreviations........................................... 26
Synoptic of the menus............................. 26
15.
9.
MEASUREMENTS (SCREEN) ....................29
16.
ENERIUM Measure station
15.1 Access......................................................49
15.2 ‘’Harmonics’’ Screen ................................49
15.3 Return.......................................................50
FRESNEL AND GAUGES ....................... 51
3
16.1 Access ..................................................... 51
16.2 “Fresnel and gauges’’ Screen ................. 51
16.3 Return...................................................... 53
17.
LOAD CURVES .....................................55
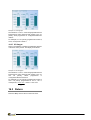
18.
RECORDING CURVES ...........................57
18.1
18.2
18.3
18.4
Recorded variables ................................. 57
Synchronization modes ........................... 57
Operating modes of recording curves ..... 57
Indicators of the recording curve ............. 58
INSTALLATION ..............................................59
19.
MECHANICAL ASSEMBLY .....................61
19.1 Cutting ..................................................... 61
Operations: Continuation................................... 61
20.
ELECTRICAL CONNECTION ...................63
20.1
20.2
20.3
20.4
20.5
20.6
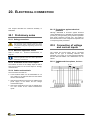
Preliminary notes..................................... 63
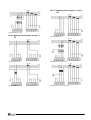
Connection of voltage and current inputs 63
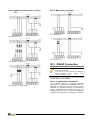
RS485 Connection .................................. 65
Ethernet Connection................................ 66
Connection of input and output cards ..... 67
Connection of the auxiliary source .......... 68
25.5
25.6
25.7
25.8
25.9
25.10
25.11
25.12
25.13
25.14
25.15
25.16
25.17
25.18
25.19
25.20
25.21
25.22
25.23
25.24
25.25
Transit direction of powers .......................88
Reactive power ........................................88
Apparent Power .......................................88
Power factor .............................................88
Cos(ϕ) ......................................................88
Peak factor ...............................................89
Tan(ϕ).......................................................89
Frequency ................................................89
Harmonics ................................................89
Harmonics rate.........................................89
Energy and Energy metering ...................90
Unbalance ................................................90
Phase order..............................................90
Time meter ...............................................91
Average variable ......................................91
Calculation of minima...............................92
Minima of variables ..................................92
Minima of average variables ....................92
Calculation of maxima..............................92
Maxima of variables .................................93
Maxima of average variables ...................93
26.
INDEX ................................................. 95
USE 69
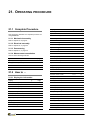
21.
OPERATING PROCEDURE .....................71
21.1 Complete Procedure ............................... 71
21.2 How to …................................................. 71
22.
LOCALE OR REMOTE COMMUNICATION .73
22.1 E.set and E.view applications.................. 73
22.2 ModBus/RTU compatible specific application
................................................................. 73
23.
MAINTENANCE ....................................75
TECHNICAL CHARACTERISTICS ......................77
24.
CHARACTERISTICS ..............................79
24.1
24.2
24.3
24.4
24.5
24.6
24.7
24.8
24.9
24.10
24.11
Measurements......................................... 79
Load curves ............................................. 80
Alarms ..................................................... 80
Analog outputs......................................... 80
Recording curves .................................... 80
Electrical .................................................. 81
Optional cards ......................................... 82
Metrology................................................. 83
Mechanical .............................................. 84
Environmental constraints ....................... 85
Accessories ............................................. 85
25.
MEASURED VARIABLES........................87
25.1
25.2
25.3
25.4
Ground voltage ........................................ 87
Line voltages ........................................... 87
Current..................................................... 87
Active power ............................................ 87
ENERIUM Measure Station
4
Introduction
ENERIUM Measure station
5
ENERIUM Measure Station
6
1. AIM OF THE MANUAL
This manual is meant for any person wishing to use an
ENERIUM 50 or ENERIUM 150 Central Readout
Station for the measurement of network variables (V, U,
I, F, P, Q, S, FP, tg φ, THD, etc.) and energy variables.
The present manual informs about:
● The product functions
● Product implementation and use
● Product characteristics
The product owner must keep this manual for the
entire duration of the product’s use.
Any information or modification pertaining to this
manual should be addressed to:
ENERDIS
Publication Manager
1 - 9 Rue d’Arcueil
BP 675
92542 MONTROUGE Cedex
FRANCE
The ENERDIS Company has printed this manual with
the purpose to provide simple and precise information.
The ENERDIS Company does not assume any
responsibility for any wrong interpretation. Although all
efforts have been made to offer a manual as precise
as possible, the latter may however include technical
inaccuracies
and/or
typographical
errors.
ENERIUM Measure station
7
2. SAFETY
You have just acquired an ENERIUM Measure station
of 50 or 150 type and we thank you for trusting our
company and products.
Operators’ Safety
To obtain the best service from your device:
The device described in this manual is meant to be
used exclusively by personnel trained beforehand. The
maintenance operations must be exclusively executed
by qualified and authorized personnel. For a correct
and safe use and for all maintenance activities, it is
essential that the personnel follow the normal safety
procedures.
● Read this operation notice carefully;
● Follow the precautions for usage which are
mentioned in it.
Meaning of the symbol. Caution! Read the
reference manual carefully before using the device.
In this reference manual, if the instructions
preceded by this symbol are not followed or
executed well, they can cause a bodily injury and
damage the device and the installations.
This device is meant to be used as per the conditions
of the installation category III, degree of pollution 2,
complying with the provisions of the CEI 61010-1
standard. It has come out of the plant in perfect
conditions of technical safety. In order to preserve
these conditions and guarantee a safe use of the
device, the user should comply with the indications and
the symbols contained in this manual.
Before the installation, check the voltage for use and
the coincidental network voltage.
Before any intervention, check that the device is
disconnected from all the voltage sources.
When use in total safety is no longer possible, the
device should be disabled and insured against an
accidental use.
Read the following recommendations carefully
before installing the device.
Precautions in case of breakdown
When it is suspected that the device is no longer safe
(for example due to damages inflicted during transport
or at the time of its use), it should be disabled. It is
necessary to ensure that it will not be used accidentally.
The device will be entrusted to authorized technicians
with a view to inspect it.
Instruction for installation
On receipt of the device, check that it is intact and has
not been subjected to any damage during transport. In
case of problem, contact the after-sales service for
possible repair or replacement.
Instruction for cleaning
When the device is disconnected from the electricity
network, use only a dry rag to clean the external
surface. Do not use either abrasive products or
solvents. Do not wet the connection terminals.
The use in total safety is no longer guaranteed in the
following cases:
● The device is visibly damaged,
● The device no longer operates:
- after prolonged storage in unfavorable
conditions;
- after serious damages inflicted during transport.
ENERIUM Measure station
8
3. GUARANTEE, RESPONSIBILITY AND
PROPERTY
3.1
Guarantee
The guarantee is applicable, except for express
stipulation, during twelve months after the installation
of the equipment (see our General Sales Conditions,
communicated on request).
3.2
Property rights
All manuals and documentation of any nature whatever
are the property of ENERDIS and are protected by
copyright, all rights reserved. They cannot be
distributed, translated or reproduced, in whole or in
part, in whichever manner and under whichever form.
3.3
3.4
Registered trademarks
ENERIUM is a trademark registered by ENERDIS.
3.5
End-of-life of the
devices
The products that we market do not enter the domain
of the decree no.2005-829 pertaining to the
composition of electrical equipments and elimination of
waste originating from these equipments.
In compliance with article L541-2 of the environment
code, it is the responsibility of the holder of the waste
to ensure it or ensure the elimination.
Copyright
All Rights reserved. Reproduction, adaptation or
translation of the present manual is prohibited without
prior authorization, within the limits envisaged by the
legislation governing the copyright rights.
Copyright ENERDIS – 2007.
First edition, September 2007.
ENERIUM Measure station
9
4. PACKAGING
The equipment is delivered as per your order. It shall,
at the minimum, include the following articles:
Variable equipment
Name
ty
Q
ty
Name
Q
ENERIUM Measure Station
Type 50 or 150.
1
CD ROM containing:
1
Detachable Connector(s) associated with
optional cards
0 to 2
- the present manual in PDF format
- E.set configuration software
- USB driver for the optical head accessory
Simplified commissioning manual (A4 format)
1
Plastic bag with the equipment, varying
according to the model
1
Attachment parts on a panel for the ENERIUM
50 or 150 models
2
ENERIUM Measure station
10
Equipment Description
ENERIUM Measure station
11
ENERIUM Measure Station
12
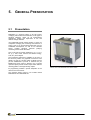
5. GENERAL PRESENTATION
5.1
Presentation
ENERIUM is a measure station in 96 x 96 format,
complying with the DIN 43700 standard, for all types of
electrical networks, meant for all measurement
applications, display and supervision of low and
medium voltage networks.
The ENERIUM Central readout station is aimed for
companies managing the monitoring and reduction of
energy costs in an environmental framework and for
sustainable development, as well as for industries
having complex electrical networks justifying
monitoring and accurate calculation.
Thus, more than 50 network variables (U, V, I, P, Q, S,
FP, tg φ, THD, active, reactive and effective energy,
THD, etc.) are analyzed.
The information gathered is available on the front of
the device by means of a graphical monochrome LCD
display, as well as a On/Off output of RS485 type as
per the ModBus/RTU protocol or Ethernet as per
ModBus/TCP RTU protocol, whereas one or several
optional outputs provide an alarm report which delivers
metering pulses or manages analog outputs.
General view of the ENERIUM 150 readout station
Its programming enables a precise adaptation of the
device to the environment.
The measure station comes in two models named
ENERIUM 50 and ENERIUM 150.
ENERIUM Measure station
13
5.2
Model Comparison
The table presented below gives the main features of
versions 50 and 150. The detailed technical and
electrical characteristics are part of chapter 24 on page
79.
ENERIUM 50
ENERIUM 150
Measurements
Calculation of the neutral current
Yes
3 or 4 wire network management
Yes
Tan φ
Yes
Harmonic range
25
400 Hz Network
50
Yes
Graphic User Interface
Customizable screens
Yes
Input-output cards (I/O)
Optional card (1)
1
Alarms
Elementary alarms
16
General Alarms
8
Event log FIFO
Yes
Curves
Load curve
8 variables from among possible 10 (2)
Recording curves
No
Yes
Communication Interface
Optical (front face)
Yes
Ethernet (ModBus / TCP RTU) (3)
Yes
RS 485 (ModBus RTU) (3)
Yes
IP address parametering in front
Yes
Graphics
Fresnel Diagram
No
Yes
Gauges
No
Yes
Histograms (harmonics)
No
Yes
(1) The optional cards are: 2 analog outputs, 2 On/Off outputs, 2 On/Off inputs and 1 On/Off input+ 1 On/Off
output.
(2) P+, P-, Q1, Q2, Q3, Q4, S+, S-, E-TOR1, E-TOR2.
(3) The communication interfaces RS 485 and Ethernet cannot be used simultaneously.
ENERIUM Measure Station
14
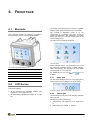
6. FRONT FACE
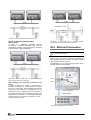
6.1
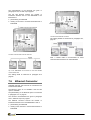
The positive, transmitting type LCD screen is a graphic
display module, permanently back-lit by white LEDs.
Elements
This paragraph presents the elements accessible in
the front face for each of the two available models.
The contrast is adjustable locally or by the
transmission of a command word from a local or
remote communication. This adjustment is possible
directly with the E.set or E.view software (refer to the
corresponding notice).
AC00
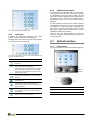
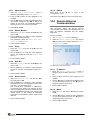
The main menu is presented as follows:
008
The main menu.
Front View of the ’ENERIUM 50 or 150.
Function
See §
1.
LCD display screen.
6.2
2.
OK Validation key
6.5
3.
Optical interface
6.3
4.
Navigation keys
6.6
6.2
For ENERIUM 50, the icons
available.
6.2.1
and
are not
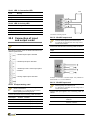
Upper part
The title of the displayed screen is in the upper part of
all the screens ("Ph-N Voltage” in the figure below).
LCD Screen
This screen displays:
● All the measured and calculated variables (see
chapters 9 to 13 in pages 29 to 41)
● All parametering variables (see chapter 14, in page
43).
106
Ref.
All the displayed screens can be viewed, in one of the
five languages available (French, English, German,
Italian and Spanish). The language can be modified
(see paragraph 14.5.3, in page 45).
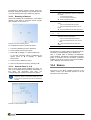
Example of display with the screen title in the upper part
6.2.2
Central part
The measurement menus as in the following examples
are found here.
The detail of screens pertaining to:
● measurement, see chapters 9 to 13, pages 29 to
41.
● parametering, see chapter 14, page 43.
ENERIUM Measure station
15
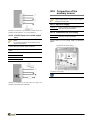
6.2.4
Additional Information
107
Upon powering up the measure station, a home screen
is displayed for a few seconds. This screen is displays
the ENERDIS logo and the station model. The last
screen then appears, displayed before the last break of
the auxiliary source. If the last screen displayed was a
parametering screen, it is the main menu which is
displayed.
The central part displays measurements.
6.2.3
Lower part
It displays the information pictograms, from fixed
position. These are listed in the following table.
The figure below gives all the icons that can be viewed
in the lower part of the LCD screen.
It is also possible to read the screen number displayed
in the ModBus memory field. It is also possible to force
the display of a screen by sending a command word
thru a local or remote communication (see document
MSO-7388 - Mapping and command words – Contact
ENERDIS to obtain this document).
When no action has been detected on the keys for
more than 3 minutes, the display back-light is switched
into standby mode.
6.3
Optical Interface
6.3.1
Presentation
108
The optical interface is made of the following elements:
The icons in the lower part of the screen (visualization of all
the icons for illustration only)
Meaning
At least one active general alarm exists. Blinking
Pictogram.
Order of phases incorrect; the voltage wires are
badly connected. Fixed Pictogram.
Verification of the order of phases of the voltage
lines is carried out continuously. The calculation
is done over 3 periods and the 10 periods of the
reference input signal.
Optical
Interface
Communication ongoing on one of the
communication ports (remote or local). Blinking
Pictogram.
1
Automatic scrolling mode of the active screens.
Fixed Pictogram.
2
Capacitive type network. Fixed Pictogram.
2
039
Icon
This pictogram has the same screen position as
the next pictogram.
Inductive type network. Fixed Pictogram.
This pictogram has the same screen position as
the preceding.
Generator network. There is no pictogram for a
receiver network. Fixed Pictogram.
ENERIUM Measure Station
Ref.
Function
1.
Positioning device.
2.
Infrared communication emitter and receiver.
Close view of the front optical interface.
16
6.3.2
6.6
Function
The optical interface allows parametering and reading
the measurements recorded by ENERIUM locally from
a PCusing an optical cable (see paragraph 6.4, page
17).
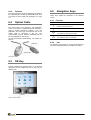
These keys enable the navigation in the different
menus.
6.6.1
6.4
Optical Cable
Navigation Keys
Key
Function
Function
Leftward movement of the cursor
Return to the previous menu
The optical cable is an accessory, sold separately,
which is connected to ENERIUM optical interface in
order to transfer information between a PC and
ENERIUM. The USB type connecOn/Off side of the
optical cable is connected to the PC. The
communication protocol between ENERIUM and the
PC uses a ModBus in RTU mode.
Rightward movement of the cursor
Menu: downward movement of the cursor
Parametering: value decrementation
Menu: upward movement of the cursor
Parametering: value incrementation
For the communication parametering, see chapter 22,
page 73.
6.6.2
USB plug
Use
The diagram of paragraph 8.4 on page 26 specifies the
use of the navigation keys for the selection of menus.
045
Optical Head
The optical cable.
6.5
OK Key
041
This key validates the selected choice or the entered
parameters. It also enables the input or output of the
editing mode.
OK Key
Position of the OK key.
ENERIUM Measure Station
17
ENERIUM Measure Station
18
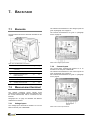
7. BACK FACE
7.1
The electrical characteristics of the voltage inputs are
given in paragraph 24.6.3 page 81.
Elements
The terminal characteristics are given in paragraph
24.6.3 on page 81.
09
010
The figure below shows the elements described in this
chapter.
Detail of the voltage input terminals.
Back view of ENERIUM for all versions.
Ref.
Function
See §
Page
1.
RS485 terminal (if no Ethernet
connector).
7.5
21
2.
Optional card terminal.
7.4
20
3.
Ethernet Connector (if no
RS485 terminal).
7.6
22
4.
‘’Voltage’’ input terminals.
7.2.1
19
5.
‘’Current’’ input terminals.
7.2.2
19
6.
Auxiliary source terminal.
7.3
20
7.2
7.2.2
Current inputs
The ‘’Current input’’ terminals are marked 6 to 11 on
the label on the rear part of ENERIUM.
The electrical characteristics of the current inputs are
given in paragraph 24.6.4 page 81.
The terminal characteristics are given in paragraph
24.6.4 page 81.
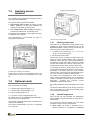
Measurement terminal
The network monitoring inputs, namely those
monitoring the line voltages and those originating from
the current transformers, will be connected on this
terminal.
7.2.1
Voltage inputs
The “Voltage input’’ terminals are marked 1 to 5 on the
label on the rear part of ENERIUM.
ENERIUM Measure station
011
Paragraph 20.2 on page 63 describes the different
authorized connections.
Current inputs
courant
Detail of the current input terminals.
19
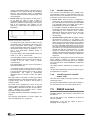
7.3
Auxiliary source
terminal
Location of the optional card
The ‘’Auxiliary source’’ terminals are marked 12 and 13
on the rear part of ENERIUM.
Two types of power supplies are available:
● High voltage power supply: the supply is made
without preference on the same terminals (no
change), for alternating or direct current.
● Low voltage direct power supply: the supply is
exclusively made with DC. The polarity is free.
The characteristics of the terminals are given in
paragraph 24.6.6 page 82.
019
The electrical characteristics of the supplies are given
in paragraph 24.6.6 page 82.
Location of the optional cards.
7.4.1
Auxiliary source inputs
2 Analog output Card
This card has two independent analog outputs, each
generating a direct current proportional to one of the
ENERIUM variables. Using a local or remote link, the
user may assign to each analog output:
● A variable to be monitored (V, U, I, P, Q, S, FP,
cos (ϕ), Tan (ϕ) and frequency)
● Min and max output values
012
The transfer function is always of single slope type.
When the output variable reaches and exceeds the
maximum output value, the output remains blocked at
the maximum output value. When the output variable
reaches and exceeds the minimum output value, the
output remains blocked at the minimum output value.
Location of the auxiliary source terminal.
In the case of a power cut of the auxiliary source, the
strategic data are saved. See paragraph 24.6.7 page
82.
7.4
Optional cards
Four card models are available:
● 2 analog output card (paragraph 7.4.1);
● 2 On/Off output card (paragraph 7.4.2);
It is possible to block an analog output with a value
lying between the authorized minimum and maximum,
by sending a command word over a local or remote
communication. The output is blocked automatically at
the end of 10 minutes or after the station restart.
The detail of the management of each of the two
analog outputs (assigned variable, etc.) is defined by
means of ModBus command words (see document
MSO-7388 – Mapping and command. Contact
ENERDIS to obtain this document).
The cabling details are given in paragraph 20.5.1 page
67.
The electrical characteristics of the analog outputs are
given in paragraph 24.7.2 page 82. The analog output
can remain open permanently.
● 2 input card (paragraph 7.4.3);
● 1 input and 1 output card (paragraph 7.4.4).
An optional card can be installed inside ENERIUM. A
cache protects the unused location.
The terminal of each of these cards is accessible in the
upper part of ENERIUM.
The terminal characteristics are given in paragraph
24.7.1 page 82.
ENERIUM Measure Station
7.4.2
2 On/Off output card
This card has two logic individual and independent
outputs (digital), each programmable in either alarm or
pulsed mode.
For each of these, the user assigns one or two output
modes thru local or remote communication:
● Alarm mode: the output is activated when a
variable measured or calculated by ENERIUM
20
crosses a threshold (maximal or minimum) which is
allocated to it, for a time longer than the configured
time-lag. This elementary alarm is deactivated
when the variable crosses the threshold again, with
close hysteresis.
7.4.3
This card has two independent inputs (digital), each
programmable in pulse or synchronisation mode. For
each of these the user allocates one of the two input
modes thru local or remote communication:
● Pulsed mode: the pulse output is of relay type. In
an off state, the relay is open. A pulse is
considered emitted when the relay is closed. The
pulses are counted from the energy in the primary
side of the transformer. This metering can be
directed to a pulse meter (for example the CCT
ENERDIS).
Example of chronogram in pulsed mode
To manage the pulse output, this output must be
associated (when parametering) with energy from
among three-phase active energy in generator
mode, three-phase active energy in receiver mode,
three-phase reactive energy of quadrants 1, 2, 3,
and 4 and three-phase effective energy in
generator mode.
The pulse weight is also parameterable among the
values 1, 10, 100, 1k, 10k and 100k.
The pulse width is common to all the outputs and it
is programmable at 30 ms then from 50 to 500 ms,
in steps of 50 ms, using a local or remote
communication.
The pulse emission over one second is rounded to
the nearest millisecond.
It is possible to block a pulse output in the High or
Low state by sending a command word or thru the
E.set and E.view software using a local or remote
communication. The output is automatically
unblocked after 10 minutes or after the station
restart.
Each logic output is composed of a static rely ensuring
isolation between the command and the output. This is
a simple contact, which is closed to emit a pulse or
activate an alarm.
The detail of the management of each of the two
On/Off outputs (assigned variable, etc.) is defined
using ModBus command words (see document MSO7388 – Mapping and command words. Contact
ENERDIS to obtain this document)
2 On/Off -input Card
● Pulsed mode: when the input is configured in
pulsed mode, the received pulses are multiplied by
the pulse weight on this input and are then added
in an integrating meter. The weight of the pulse is
parameterable from 0.0001 to 999.9999.
It is possible to initialize the meters with any value
by sending a command word (see document MSO7388 Mapping and command words. Contact
ENERDIS to obtain this document) or by the E.set
and E.view software using a local or remote
communication
032
● Synchronization input mode: the input is used to
synchronize the records or to run alarms. It can
also serve to synchronize the ENERIUM internal
alarm; the clock is then parametered as an external
synchronization input. When a pulse is detected on
this input, ENERIUM automatically sets the internal
clock to the rounded-off hour (minutes and seconds
are worth zero), if the internal clock has less than 5
seconds gap with the rounded-off hour. It is also
possible to read the input status in the ModBus
mapping (see document MSO-7388 - Mapping and
command words. Contact ENERDIS to obtain this
document).
The detail of the management of each of the two logic
inputs (digital) is defined by means of ModBus
command words (see document MSO-7388 - Mapping
and command words. Contact ENERDIS to obtain this
document)
The cabling detail is mentioned in paragraph 20.5.2
page 67.
The electrical characteristics of On/Off inputs are given
in paragraph 24.7.3 page 82.
7.4.4
1 On/Off input and 1 On/Off
output Card
This card has a single On/Off logic input and a single
On/Off logic output.
The electrical characteristics of this card are similar to
the “2 On/Off inputs’’ and “2 On/Off outputs” above.
7.5
RS485 terminal
The cabling details are mentioned in paragraph 20.5.2,
page 67.
Available optionally, this terminal is connected to the
RS 485 bus.
The electrical characteristics of On/Off outputs are
given in paragraph 20.5.2, on page 67.
The RS 485 option is not available if the Ethernet
option is available.
Parametering of the RS 485 option is given in
paragraph 14.3 on page 43.
ENERIUM Measure Station
21
The characteristics of the terminals are given in
paragraph 24.6.5, RS 485 Output page 81.
The RS 485 terminal ensures the transfer of
information between the PC and ENERIUM in the
framework of:
● parametering of ENERIUM
● reading of real time or recorded measurements in
ENERIUM.
Ethernet
Connector
015
RS485 card and output terminal
Location of the Ethernet connector.
Location of the terminal of the RS 485 card.
016
013
The cabling details are mentioned in paragraph 20.4,
page 66.
014
Note: a twisted cable is recommended for direct
communication between a PC and ENERIUM.
Up to 247 ENERIUMs can be linked on the same RS485
communication line.
The cabling detail is mentioned in paragraph 20.3
page 65.
7.6
Ethernet Connector
Available optionally, this connector is connected to the
local Ethernet network.
The Ethernet option is not available if the RS 485
option is available. .
The parametering of the Ethernet option is mentioned
in paragraph 14.4 on page 44.
The connector characteristics are given in paragraph
24.6.5, Ethernet Output on page 81.
The Ethernet connector ensures the transfer of
information between a PC and ENERIUM in case of:
● parametering of ENERIUM
● reading of the real time or saved measurements in
ENERIUM.
ENERIUM Measure Station
22
Software Description
ENERIUM Measure station
23
ENERIUM Measure Station
24
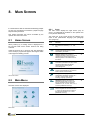
8. MAIN SCREEN
It is assumed here that the mechanical assembly (chapter
19 page 61) and electrical connections (chapter 20 page
63) have been performed.
This chapter describes the menus accessible by the
operator from the main screen.
8.1
Home Screen
8.2.1
The main screen displays the eight menus (only six
menus on ENERIUM 50) available to the operator thru
icons (see the table below).
The upper part of the screen shows the selected icon
name in the parametered language (see paragraph
14.5.3 page 45).
Icon
When powering up, a loading screen is displayed for a
few seconds while all the station functions are being
activated.
100
Under the “Enerium 50’’ or “Enerium 150” line (depending
on the model) a progress bar appears showing the status
of the equipment loading process.
The Home screen.
8.2
Main Menu
Function
Page
Measurements: displays the screen of
the measured variables (U, I, P, THD,
etc.).
29
Energy: displays the screens of active,
reactive and effective energy meters,
cumulated by the station.
33
Services: displays the screens of
variables (the time meters for the device
operating time and the internal time
stamping) linked to the maintenance of
the station.
37
Alarms: displays the screens for alarm
information (visualisation of alarm status
and relays associated with On/Off
outputs) and the existing alarm
acknowledgement.
39
Customized screens: displays the
screens parameterable by the user thru
local or remote communication.
41
Configuration: displays the menu for
configuration parameter changes (TP –
TC ratio, communication, display
scrolling, language, password).
43
Harmonics: displays the harmonic
amplitude of the range 1 to 50 in the
form of histograms for the electrical
variables V1, V2, V3, U12, U23, U31, I1,
I2 and I3 (ENERIUM 150 only).
49
Fresnel and gauges: displays the
Fresnel diagrams of electrical variables
V, U and I as well as the bar charts for
the electrical variables V, U, I and P
(ENERIUM 150 only).
51
AC00
The main menu is then displayed.
Icons
Main menu.
ENERIUM Measure Station
25
Recall: the selection of an icon is made using
navigation keys (see § 6.6 page 17).
When an icon is selected, its look changes by the
appearance of a routing creating a relief button.
The action on the "OK" key shows the menu
related to the selected icon.
8.2.2
MVAh
Total effective energy in mega.
kVARh
Total reactive energy in kilo.
MVARh
Total reactive energy in mega.
kWh
Total active energy in kilo.
Pressing the "OK" key displays the selected
screen.
MWh
Total active energy in mega.
Icons at the bottom of the screen
Function
At least one active global alarm. Blinking
Pictogram.
Wrong phase order; the voltage inputs are badly
connected. Fixed Pictogram.
A cabling test thru verification of the phase order
on the voltage lines is carried out continuously.
The calculation is made over 3 periods and for all
10 periods of the reference signal input.
Communication ongoing on one of the
communication ports (remote or local). Blinking
Pictogram.
Automatic scrolling mode of the screens active.
Fixed Pictogram.
Capacitive type network: this pictogram has the
same position on the screen as the next
pictogram.
Inductive type network: this pictogram has the
same position on the screen as the preceding
pictogram.
Generator network: there is no pictogram for a
receiver network. Fixed Pictogram.
8.3.2
Symbols
F
FP
8.3.1
Symbols
Units
Percent Symbol.
A
Real RMS current symbol in Ampere
V
Real RMS voltage symbol in Volt.
Hz
Network frequency.
VA
Apparent power (total if 3φ).
VAR
Reactive power (total if 3φ).
kVAh
Symbol for Frequency in Hertz.
Power factor (ratio active / effective power).
Hxx Uab
Harmonic rate (%) of ‘xx’ voltage range for the
“ab” line phase (ab = 12, or 23 or 31).
Ix
Instantaneous current (A) of the “x” conductor
(x = 1, 2, 3).
In
Neutral current (A) (value available only in a 4wire networks).
Ix Max
Moy
P
Pmoy
Maximum average current (A)
(x = 1, 2, 3 or N)
Active power (W).
Active power (W) averaged over a defined
duration Pmoy
Q
Reactive power (VAR).
S
Apparent power (VA).
Smoy
Effective power (VA) averaged over a defined
duration.
THD Ix
Harmonic distortion rate (%) of the current in
the “x” conductor (x = 1, 2 or 3).
THD Uab
Harmonic distortion rate (%) of the “ab” line
phase (ab = 12, 23 or 31).
Real composed voltage (V) between the “ab”
phase (ab = 12, or 23 or 31).
Vx
Ground voltage (V) between phase (x = 1, 2 ou
3) and neutral.
VT
Real RMS voltage (V) between neutral and
earth.
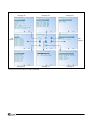
8.4
Synoptic of the menus
Description
%
W
Description
Harmonic rate (%) of the 'xx' current range for
the “a” conductor (a = 1, 2 or 3).
Abbreviations
The ENERIUM display uses abbreviations of electrical
symbols. These symbols, also used in the present
document, are the following:
Electric variables
Hxx Ia
Uab
8.3
Description
The "Up" and "Down" keys scroll between lines.
These icons are located in the lower part of the different
screens. They display the following information:
Icon
Symbols
All the menus accessible from the main menu are shown
hereafter with the reference to the related chapters.
Active power (total if 3 φ).
Total apparent energy in kilo.
ENERIUM Measure Station
26
See page 29
See page 33
See page 37
See
page 39
See
page 43
See page 49
Flowchart of all the main menus accessible on ENERIUM.
ENERIUM Measure station
See page 41
See page 51
SY01
27
ENERIUM Measure Station
28
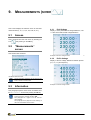
9. MEASUREMENTS (SCREEN)
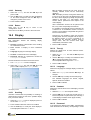
This screen displays the selection menu for the basic
measurements (V, U, I, P, Q, S, PF, THD, H, etc.).
9.1
9.3.1
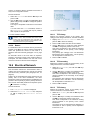
Ph-N Voltage
Display of each phase/neutral voltage difference; The
VT value is the earth/neutral voltage difference.
Access
9.2
‘’Measurements’’
screen
This screen looks as follows:
ME01A
This is achieved from the main menu by selecting the
and pressing on the OK key.
icon
Example of the Ph-N Voltage screen
9.3.2
ME01A
Ph-Ph Voltage
ME00
Display of the line voltage difference between phases
(U12, U23, U31) and frequency.
All the information displayed can be retrieved thru
local or remote communication.
9.3
Information
ME02A
The Measurements Screen.
Example of a Ph-Ph Voltage screen.
This paragraph explains each screen accessible from
the Measurements screen after pressing the OK key.
For each of the screens, navigation between the
screens is done by pressing the keys .
See paragraph 9.5.1 page 31 for the rules for
value displays.
See paragraph 8.2.2 page 26 for the meaning of
the icons at the bottom of the screen.
ENERIUM Measure station
29
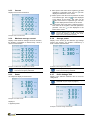
9.3.3
Current
Display of the current of each line.
P: active power. This value can be negative if the load
operates in a generator mode. The icon
is then
displayed at the bottom of the screen.
Q: reactive power. This value can be positive if the load
is then displayed
is of inductive type. The icon
at the bottom of the screen. This value can be
negative if the load is of capacitive type. The icon
is then displayed at the bottom of the screen.
ME03A
FP: power factor (ratio of the active / effective powers).
This value can be negative if the load operates in
generator. The icon
is then displayed at the
bottom of the screen.
Thru the
and
or icons
, users know at
anytime the quadrant in which the load works.
Page 33 shows the quadrant positions.
Example of the Current screen.
9.3.4
Maximum average current
9.3.6
Average power
Display of the active (P) and effective (S) average
powers over duration. The duration is defined by a
local or remote communication.
ME06A
ME04A
Display of the maximum average current of each line;
the duration of integration is defined using a local or
remote communication.
Example of a Maximum Average Current screen
Example of an Average Power screen
See paragraph 25.19 page 91 for the calculation
mode of the averages by ENERIUM.
9.3.5
Power
An example of display is shown below.
See paragraph 25.19 page 91 for the calculation
mode of the average by ENERIUM.
9.3.7
Ph-Ph Voltage THD
Display of the harmonic distortion rate on the three
voltage lines.
ME05A
The Harmonics function displays graphics only for
ENERIUM 150 (see chapter 15 page 49).
Display of:
S: apparent power.
ME07A
Example of a Power screen
Example of a Ph-Ph Voltage THD screen.
ENERIUM Measure Station
30
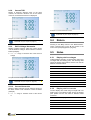
9.3.8
Current THD
ME10A
Display of harmonic distortion rates on the three
currents; the harmonic distortion rate of the neutral
current is not measured and thus not displayed.
Example of a Current Harmonics screen.
ME08A
The Harmonics function displays graphics only for
ENERIUM 150 (see chapter 15 page 49).
Example of a Current THD screen
The Harmonics function displays graphics only for
ENERIUM 150 (see chapter 15 page 49).
9.3.9
Ph-Ph Voltage Harmonics
Display of higher harmonic rates and of their ranges
over the three line voltages. Each indication is read as
follows (example):
● H03 U12: “range 3” harmonic rate of the U12 line
voltage
9.4
Return
Pressing on the key returns to the “Measurements’’
screen. Pressing twice on the key returns to the
main screen (see paragraphs 8.2 page 25).
9.5
Notes
9.5.1
Display rule for voltages
ME09A
Voltage displays (simple or composed) are made using
four digits with one floating point. The following table
shows the floating point position and the unit used for
different measured values.
Example of a Ph-Ph voltage Harmonics screen.
The Harmonics function displays graphics only for
ENERIUM 150 (see chapter 15, page 49).
9.3.10
V<
Display
10
9,999 V
100
99,99 V
1 000
999,9 V
10 000
9,999 kV
100 000
99,99 kV
1 000 000
999,9 kV
10 000 000
9,999 MV
100 000 000
99,99 MV
Current Harmonics
Display of higher harmonic factors and their ranges on
the three currents. Each indication is read as follows
(example):
● H02 I1: “range 2” harmonic factor of the current
I1.
ENERIUM Measure Station
9.5.2
Display rule for currents
Current displays are made using four digits with one
floating point. The following table shows the floating
point position and the unit used for different values
measured.
I<
Display
10
9,999 A
100
99,99 A
1 000
999,9 A
10 000
9,999 kA
31
100 000
99,99 kA
1 000 000
999,9 kA
10 000 000
9,999 MA
100 000 000
99,99 MA
9.5.3
Display rule for frequency
Frequency displays are made using four digits with one
floating point. As an example, frequency is displayed
as 99.99 Hz.
9.5.4
Display rule for power
Power displays (active, reactive or effective) are made
using four digits with one floating point. The following
table shows the floating point position and the unit
used for different values measured.
P<
Display
10
9,999 u
100
99,99 u
1 000
999,9 u
10 000
9,999 ku
100 000
99,99 ku
1 000 000
999,9 ku
10 000 000
9,999 Mu
100 000 000
99,99 Mu
For an active power, ‘’u‘’ means W. For a reactive power, ‘’u‘’
means VAR. For an effective power, ‘’u‘’ means VA.
9.5.5
Display rule for harmonics
Harmonic (of range x) or total harmonic distortion rate
displays are made using four digits with one floating
point. The point position is adjusted based on the
value measured.
9.5.6
Display rule for the power factor
Power factor displays are made using three digits with
one floating point (i.e. 9.99). A logo is used for the unit.
In case of an inductive power factor, the unit is the
pictogram. In case of a capacitive power factor, the
unit is the
pictogram.
9.5.7
Display rule for the time meter
Ttime meter displays are made using ten digits with
one floating point and the unit is given. 99999999.99 h
is an example.
ENERIUM Measure Station
32
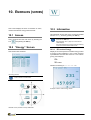
10. ENERGIES (SCREEN)
This screen displays the menu for selection of active,
reactive and effective energy measurements.
10.3 Information
10.1 Access
This paragraph shows each of the screens accessible
from the Energy screen by pressing the OK key.
For all the displays, scrolling between screens is
done with the keys.
This is achieved from the main menu by selecting the
See paragraph 10.5.1 page 35, for the rules for
value displays.
and pressing the OK key.
icon
Also see paragraph 8.2.2 page 26 for the meaning
of the icons at the bottom of the screen.
10.2 ‘’Energy‘’ Screen
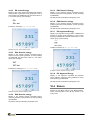
10.3.1
This screen looks as follows:
EP+ active Energy
Display of two active positive cumulated energy meters
in receiver mode (quadrants 1 and 4) when powering
up ENERIUM. The total value refers to a “two values”
group: (see example):
MWh
231
kWh
457.897
EN00
indicates a metering of 231 457.897 kWh.
The Energy Screen.
EN01A
All the information displayed can be retrieved thru
local or remote communication.
Generator
Example of an EP+ active Energy Screen
receiver
034
Generator
receiver
Reminder of the quadrants used by ENERIUM.
ENERIUM Measure station
33
10.3.2
EP- active Energy
Display of two active negative cumulated and absolute
energy meters in generator mode (quadrants 2 and 3)
when powering up ENERIUM. The total value refers to
a “two values” group: (see example):
10.3.5
EQ3 Reactive Energy
Display of two negative reactive cumulated energy
meters in generator mode (quadrant 3) when powering
up ENERIUM
The data is read as indicated in paragraph 10.3.3.
MWh
231
10.3.6
kWh
457.897
Indicates a metering of 231 457.897 kWh.
EQ4 Reactive energy
Display of two negative reactive cumulated energy
meters in generator mode (quadrant 4) when powering
up ENERIUM.
The data is read as indicated in paragraph 10.3.3.
10.3.7
ES+ Apparent Energy
Display of two apparent energy meters cumulated and
absolute in receiver mode (quadrants 1 and 4) when
powering up ENERIUM. The total value refers to a “two
values” group: (see example):
MVAh
231
EN02A
kVAh
457.897
Indicates a metering of 231 457.897 kVAh.
_
Example of an EP active energy screen
10.3.3
EQ1 Reactive energy
Display of two positive reactive cumulated energy
meters in receiver mode (quadrants 1) when powering
up ENERIUM. The total value refers to a “two value”
group: (see example):
MVARh
231
457.897
Indicates the metering of 231 457.897 kVARh.
EN07A
kVARh
Example of an ES+ Apparent Energy Screen
10.3.8
ES- Apparent Energy
Display of two apparent cumulated and absolute
energy meters in generator mode (quadrants 2 and 3)
when powering up ENERIUM.
The data is read as indicated in paragraph 10.3.7.
EN03A
10.4 Return
Example of a EQ1 Reactive Energy screen.
10.3.4
EQ2 Reactive energy
Pressing on the key returns to the “Measurements’’
screen. Pressing twice on the key returns to the
main screen.
Display of two positive reactive cumulated energy
meters in generator mode (quadrant 2) when powering
up ENERIUM.
The data is read as indicated in paragraph 10.3.3.
ENERIUM Measure Station
34
10.5 Notes
10.5.1
Display rules for energies
Energy meter display (active, reactive or apparent) is
made on two lines.
On the first line, the upper part of the energy meter is
displayed in the form 999999 Muh. On the second line,
the lower part of the energy meter is displayed in the
form 999.999 kuh. The letter “u” is defined as follows:
Energy
Active
Unit
W
Reactive
VAR
Effective
VA
ENERIUM Measure Station
35
ENERIUM Measure Station
36
11. SERVICES (SCREEN)
This screen shows the menu for selecting information
relating to the device, time meters for the device’s
operating time and the internal timestamping.
11.1 Access
11.3 Information
This paragraph shows each of the screens accessible
from the Services screen after pressing the OK key.
For all displays, the direct passage to the next or
previous screen is possible with the keys.
See also paragraph 8.2.2, on page 26, for the
meaning of the icons at the bottom of the screen.
This is done from the main menu by selecting the icon
and by pressing the OK key.
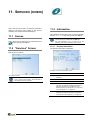
11.2 “Services” Screen
11.3.1
Product Information
The following information is displayed:
SE01
This screen is as follows:
SE00
Example of a Product information screen
Ref.
The Services Screen.
All displayed information can be retrieved thru
local or remote communication. No modification of
the displayed values is possible.
ENERIUM Measure station
Indication
1.
Type of ENERIUM (50, 150) and network
frequency.
2.
Serial number of ENERIUM.
3.
Version number of the embedded software.
4.
Indicates “Blank’’ if no communication card is
installed, else indicates the ModBus address for
the option RS 485 or the IP address for the
Ethernet options (see paragraph 14.3, in page 43
and in paragraph 14.4, in page 44).
5
Indicates “Blank’’ if no input/output card is
installed, else indicates the type of input/output
card inserted (see paragraph 7.4, on page 20).
37
11.3.2
Time meter
11.3.3
Date/Time
The following information, which ca only be read, is
displayed:
SE02A
SE03A
Three time meters are seen. The information, which
can only be read, is displayed over ten digits, with fixed
point as follows:
Example of a Date/Time Screen.
Example of a Time meter Screen.
Ref.
Ref.
1.
2.
3.
Indication
"Operating Time": Time meter: duration of
presence of the supply voltage (auxiliary source)
on ENERIUM (see paragraph 7.3, on page 20).
This indication is useful for the maintenance of
ENERIUM.
"Network Presence" Time meter: duration during
which, at least one ground voltage, from among
V1[1s], V2[1s] and V3[1s] is different from zero.
This indication is useful for the maintenance of the
monitored load.
"In Load" Time meter: duration during which, at
least one current, from among I1[1s], I2[1s] and
I3[1s], is different from zero. This indication is
useful for the maintenance of the monitored load.
Indication
1.
Date
2.
Time
The date/time variable is recorded in the form of
st
number of seconds elapsed since January 1 ,
1970.
The display format of the date is "dd mmm yyyy",
for all languages.
The date and time are modifiable only by local or
remote communication.
11.4 Return
One press on the key enables the return to the
“Services” screen. Two successive presses on the key return to the main screen.
ENERIUM Measure Station
38
12. (SCREEN) ALARMS
This screen shows the menu for selection of alarms
(visualisation of the status of alarms and relays
associated with On/Off outputs) and zero setting of
possibly stored alarms.
12.3 Information
This paragraph shows each of the screens accessible
from the Alarms screen after pressing the OK key.
12.1 Access
For each of the screens, the passage to the next
or previous screens is done by pressing the keys
.
See also paragraph 8.2.2, on page 26, for the
meaning of the icons at the bottom of the screen.
This is done from the main menu by selecting the icon
and pressing on the OK key.
12.3.1
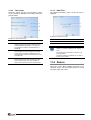
12.2 “Alarms’’ Screen
Alarms
The following information is displayed:
AL01A
This screen is as follows:
AL00A
Example of an Alarms screen.
The Alarms screen, on call.
All displayed information can be retrieved thru
local or remote communication.
This screen shows, for each of the eight global alarms,
the status of the active alarm, or having been activated
in the first column, and the status of associated On/Off
outputs (relays) (paragraph 7.4.2, on page 20) in the
second column.
Indication
Explanation
Number
Number of the global alarm (a global alarm is
sometimes a combination of two elementary
alarms).
Status
Status of the alarm (active or inactive) in the
station.
Relay
-
non-programmed alarm
non active programmed alarm.
active programmed alarm.
Status of the associated relay (paragraph 7.4.2,
in page 20).
-
relay not associated with the alarm
relay associated with the alarm, but not
active.
ENERIUM Measure station
relay associated with active alarm.
39
The definition of alarms (number, NO/NF, delay time,
threshold, measured variable) is only possible by local
or remote communication (see chapter 22, page 73).
12.3.2
Indication
Status
Resetting of Alarms
This screen enables the re-initialization of the alarms
(release of the alarm of associated On/Off outputs)
upon validation of the choice YES.
Relay
Explanation
Status of this global alarm (active or inactive) in
the station.
-
non-programmed alarm
non active programmed alarm.
active programmed alarm.
Status of the relay associated with this general
alarm.
-
relay not associated with the alarm.
relay associated with the alarm, but not
active.
relay associated with the alarm and active.
El.
Alarm
Name of the associated electrical variable, ex
V1.
Status
Status of the elementary alarm output
associated with this global alarm.
AL02A
output not associated with the alarm.
output associated with the alarm, but not
active.
Example of an Alarm resetting screen.
To re-initialize the alarms, proceed as follows:
output associated with the alarm and
active.
Equation
Logic Equation AND or OR
1. The Alarms Resetting screen is displayed.
2. Press on OK to enter the procedure.
3. Press on to highlight YES (black background).
To quit this procedure without re-initializing the
alarms, press on to highlight NO (black
background).
4. Press on OK to validate the choice.
The activation of a general alarm is signaled locally by
the blinking of the backlighting of the display area.
Thus, if a global alarm is activated, the ENERIUM
screen will blink. The blinking is stopped after resetting
(RAZ) of the status word for the alarms (command
available under E.set, E.view or in the document MSO7388 – Mapping and command words).
5. Return to the previous screen by pressing on .
12.3.3
General Alarm (1 to 8)
Each of these eight screens displays the status, for
each of the 8 global alarms (activated, deactivated) of
this alarm, the associated load relay, the
corresponding logic equation and elementary alarms.
12.4 Return
One press on the key enables the return to the
“Alarms’’ screen. Two successive presses on the key return to the main screen.
AL03A
A global alarm is activated by a combination of
elementary alarms, combination defined from the
E.set or E.view application (see the corresponding
manual).
Example of a Global alarm screen
ENERIUM Measure Station
40
13. CUSTOMIZED SCREENS
This screen shows the menu for selection of one of the
three groups of screens defined using local or remote
communication.
● Or by programmed automatic scrolling, of one,
two or three of these screens.
The E.set or E.view software ensures
parametering of these customisable screens.
the
13.1 Access
13.4 Screens
From the main menu by selecting the icon
pressing on the OK key.
and
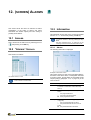
13.2 “Customized Screens’’
Screen
This paragraph shows each screen accessible from
the Customised Screens screen (after pressing the
OK key, in their factory configuration.
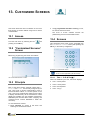
EP01A
Before any programming, the screen is as follows:
Example of a Customized Screen.
EP01A
EP00A
Reminder: the Title name is defined by the
E.set or E.view application (see this manual).
The “Customized Screens’’ screen.
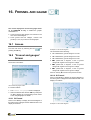
13.4.1
Title 1: “S-P-Q-Tan(φ
φ) “
When not redefined by the user, this screen displays:
13.3 Principle
Each of the three screens, basically named Title 1,
Title 2 and Title3, can be freely configured by the
user, using local or remote communication. Each of
these three titles collects, in a screen specific to the
user, a set of four measurements which the user wants
to display simultaneously. All the combinations of data
display are possible, from the variables measured by
ENERIUM (see document MSO-7388 – Mapping and
command words. Contact ENERDIS to obtain this
document).
● Line 1: S three-phase.
● Line 2: P three-phase.
● Line 3: Q three-phase
● Line 4: Tan (φ).
To view these three screens:
● Either manually, by access to this menu and
selecting one of the three screens.
ENERIUM Measure station
41
13.4.2
Title 2: “ V1-U12-I1-FP1 “
When not redefined by the user, this screen displays:
● Line 1: V1
● Line 2: U12
● Line 3: I1
● Line 4: FP1.
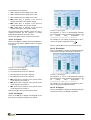
13.4.3
Title 3: “ In: H03 H05 H07 H09 “
When not redefined by the user, this screen displays
the harmonics of range 3, 5, 7 and 9 present on the
neutral current In.
● Line 1: H03.
● Line 2: H05.
● Line 3: H07.
● Line 4: H09.
13.5 Return
One press on the key returns to the ‘’Customized
Screens’’ screen. Two successive presses on the key return to the main screen.
ENERIUM Measure Station
42
14. (SCREEN) CONFIGURATION
This screen
ENERIUM.
shows
the
Configuration menu of
14.1 Access
and
14.2 ‘’Configuration ‘’
screen
The screen is as follows:
CO06A
From the main menu by selecting the icon
pressing the OK key.
A password can be
Configuration screen.
requested
before
entry
in
the
14.3 Remote
Communication RS
485
This information defines the characteristics of the
RS485 remote communication (see paragraph 20.3, on
page 65) between ENERIUM and the reading
equipment.
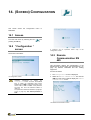
CO00A
Proceed as follows:
1. The Configuration screen is displayed.
Th Configuration screen.
CO02A
If a password has already been defined, this is
necessary
beforehand
to
access
the
Configuration screen. To do this, use the keys to modify the highlighted value (black
background) and to change the position of the
cursor. Press on OK to validate. If the password
has been lost, the E.set software enables to
retrieve it.
The password is defined as indicated in paragraph
14.5.5, on page 45). The default password is
0000.
2. Select the Remote Communication line with the
keys and press on OK to display the Remote
Communication screen.
The RS485 Communication screen.
ENERIUM Measure station
43
14.3.1
JBus Address
14.3.6
Return
1. When the Remote Communication screen is
displayed, press OK to select JBus Address.
Press once on the
“Configuration’’ menu.
key
to
return
to
the
2. Press on OK to select the value (address) to be
modified.
Press twice on the key to return to the main menu.
3. Use the keys to modify the highlighted value
on the black background and to change the
position of the cursor. The acceptable addresses
range from 001 to 247, inclusive of the limits.
14.4 Remote Ethernet
Communication
4. Press OK to validate.
14.3.2
Speed (Bauds)
1. Select the Speed(Bds) line with the keys and
press on OK.
2. Use the keys to modify the value displayed
(transmission speed in Bauds).
The predefined values are 2400, 4800, 9600,
19200, 38400 and 115200.
3. Press on OK to validate.
14.3.3
This information defines the Remote Ethernet
communication characteristics (see paragraph 20.4, on
page 66) between ENERIUM and the reading
equipment.
Proceed as follows:
1. The Configuration screen is displayed.
2. Select the Remote Communication line with the
keys and press on OK to display the Remote
Communication screen.
Parity
1. Select the Parity line with the keys and
press on OK.
2. Use the keys to modify the value displayed
(parity). The predefined values are Without, Odd
and Even.
14.3.4
Stop Bit
1. Select the Stop Bits line with the keys and
press on OK.
2. Use the keys to modify the value displayed
(number of stop bits). The displayable values are 1
and 2.
3. Press on OK to validate.
14.3.5
Reversal (ms)
1. Select the Reversal (ms) line with the keys and press on OK.
2. Use the keys to modify the value displayed
(reversal time in ms). The displayable values range
from 0 to 500 by increments of 50.
The reversal time, expressed in milliseconds,
corresponds to the waiting time between the time
when the RS485 frame has been received and the
time when ENERIUM responds. This value is to be
defined based on the number of ENERIUM
connected on the RS485 line and the quality of the
field bus.
3. Press on OK to validate.
CO02B
3. Press on OK to validate.
The Ethernet Communication Screen.
14.4.1
IP Address
1. When the Remote Communication screen is
displayed, press on OK to select the IP Address
line.
2. Press on OK to select the value (address) to be
modified.
3. Use the keys to modify the highlighted value
on the black background and the keys to
change the position of the cursor.
4. Press on OK to validate.
14.4.2
Mask
1. Select the Mask line with the keys and press
on OK.
2. Use the keys to modify the value highlighted
on the black background and the keys to
change the position of the cursor.
3. Press on OK to validate.
ENERIUM Measure Station
44
14.4.3
Gateway
1. Select the Gateway line with the keys and
press on OK.
2. Use the keys to modify the value highlighted
on the black background and the keys to
change the position of the cursor.
3. Press on OK to validate.
14.4.4
Return
Press once on the
“Configuration’’ menu.
key
to
return
to
the
Press twice on the key to return to the main menu.
14.5 Display
This information
characteristics:
defines
the
following
display
NO: the display screens will not scroll. Only the
manually selected screen will be continuously
displayed.
YES: the display screens, having been defined, by
E.view, E.set, as the ones to be displayed one after
the other, will be displayed cyclically at a periodicity
defined by the value Time (see below). These
screens will be predominant with respect to the
normal display.
All the visualization screens can be placed in this
list, in any order and possibly several times.
It is possible to automatically set the parameters for
a maximum of 16 visualization screens. The list of
screens to be scrolled is configurable using local or
remote communication.
Pressing any key enables to block the automatic
scrolling mode and thus navigate with the keys in
the different screens. If no key is pressed for 10
seconds and the automatic scrolling mode is
always active, then the screens scroll again
automatically one after the other.
● Scrolling: activation or deactivation of the scrolling
for customized screens.
4. Press on OK to validate.
● Time: duration of display of each customized
screen.
14.5.2
● Language: language for message display.
● Contrast: contrast level of the LCD display.
● Password: definition of a password to access the
Configuration screen.
Time (s)
Defines the display time for each selected screen.
Proceed as follows:
1. Select the Time (ms) line with the keys and
press on OK.
Proceed as follows for access to these sub-menus:
2. Use the keys to modify the underlined value
to change the position of the cursor.
The acceptable values range from 01 to 10.
1. The Configuration screen is displayed.
3. Press on OK to validate.
2. Select the Display line with the keys and
press on OK to display the Display screen.
14.5.3
Language
Defines the language for message display; Proceed as
follows:
1. Select the Language line with the keys, for
example.
2. Use the keys to modify the active language.
The available languages are French, English,
Spanish, German and Italian.
CO03A
3. Press on OK to validate.
14.5.4
The Display screen.
14.5.1
Scrolling
Activates or deactivates the possibility for scrolling of
measurement screens as well as the possible display
time; proceed as follows:
1. When the Display screen is displayed, press on
OK to select Scrolling.
2. Press on OK to select the value to be modified.
3. Use the keys to modify the value displayed.
The displayable values are Yes and No.
ENERIUM Measure Station
Contrast
Defines the contrast level of the LCD display; Proceed
as follows:
1. Select the Contrast line and press on OK.
2. Use the keys to modify the contrast level. A 0
level corresponds to a pale screen (low contrast); a
7 level displays a darker screen (high contrast).
3. Press on OK to validate.
14.5.5
Password
If the password is different from “0000”, (parametering
when received from the factory corresponding to a free
45
access), a password will be requested at the time of
entry in the Configuration screen.
Proceed as follows:
2. Use the keys to modify the highlighted value
(black background) and to change the position
of the cursor.
The range of acceptable codes is that of the ASCII
table.
If a code other than 0000 is activated, access to
the Configuration screen will only be possible
after request for this password.
3. Press on OK to validate.
The password is active only 30 seconds after its
definition. Thus, after immediate return to the home
screen from the Configuration menu, the latter can
be redefined without request of the password if the
30 seconds have not yet not elapsed.
14.5.6
Return
It is essential to return to the main menu by successive
presses on the key in order to quit the Configuration
mode and prohibit the access to this mode if a
password has been entered (paragraph 14.5.5, page
45).
No automatic return to the main menu is expected.
However, if the power supply of the measure station is
interrupted, the station restarts from the main menu
and not as usual from the last screen displayed.
14.6 Electrical Network
This information defines the transformation ratios of
voltage and current transformers used at the voltage
and current entry terminals (see paragraph 20.2, on
page 63).
Indeed, all the measurements being viewed from the
primary side of the client transformers, the client
transformer values are parametered in ENERIUM. The
product of the CT primary by the PT primary should not
be more than 693.0 MW (maximum three-phase power
=
3 x 693 MW = 1.2 GW).).
CO04A
1. Select the Password line with the keys and
press on OK.
The Electrical Network screen
14.6.1
TP Primary
Defines the maximum voltage of the primary (line
voltage) of the voltage transformer; Proceed as follows:
1. Display the Electrical network sceen and
press on OK to select TP Primary.
2. Press on OK to select the value to be modified.
3. Use the keys to modify the value displayed
and to change the position of the cursor.
This value corresponds to the maximum operating
voltage indicated on the primary of the voltage
transformer.
The primary (line voltage) of the TP transformer
lies between 100 V and 650,000 V. The TP primary
can be adjusted in increment of 1 V.
4. Press on OK to validate.
14.6.2
TP Secondary
Defines the maximum voltage of the secondary of the
voltage transformer; Proceed as follows:
1. Select the TP Secondary line with the keys
and press on OK.
2. Use the keys to modify the underlined value
and to change the position of the cursor.
This value corresponds to the maximum operating
voltage indicated on the secondary of the voltage
transformer.
The secondary (line voltage) of the TP transformer
lies between 100 V and 480 V. The TP secondary
can be adjusted in increments of 1 V.
3. Press on OK to validate.
Proceed as follows:
14.6.3
1. The Configuration screen is displayed.
Defines the maximum current of the primary of the
current transformer; Proceed as follows:
2. Select the Electrical network line, and press
on OK to display the Electrical network
screen.
TC Primary
1. Select the TC Primary line with the keys and
press on OK.
2. Use the keys to modify the underlined value
and to change the position of the cursor.
This value corresponds to the maximum working
current indicated on the primary of the current
transformer.
The primary of the TC transformer lies between 1 A
and 25,000 A. The TC primary can be adjusted in
increments of 1 A.
ENERIUM Measure Station
46
3. Press on OK to validate.
14.6.4
14.7 Default values
TC Secondary
Defines the secondary current
transformer; Proceed as follows:
of
the
current
1. Select the TC Secondary line with the keys
and press on OK.
2. Use the keys to modify the underlined value.
This value corresponds to the maximum working
current indicated on the secondary of the current
transformer.
The secondary of the TC transformer lies between
1 A and 5 A. The TC secondary can be adjusted in
inrements of 1 A.
This table indicates the default values of the
Configuration menu when the device is delivered.
RS 485 Communication (*)
Address
001
Speed
9600
Parity
Sans
Stop Bit
1
Reversal
50
3. Press on OK to validate.
Ethernet Communication (*)
14.6.5
3 wire / 4 wire
Defines the type of network to be monitored; Proceed
as follows:
1. Select the 3 wire/4 wire line with the keys
and press on OK.
2. Use the keys to modify the selection
displayed.
3 wire: non-distributed neutral.
4 wire: distributed neutral.
3. Press on OK to validate.
14.6.6
Return
Press on the key to return to the “Configuration”
screen.
IP Address
000.000.000.000
Mask
255.255.000.000
Gateway
000.000.000.000
(*)RS 485 and Ethernet communications cannot be shown at
the same time.
Display
Scrolling
NO
Time
03
Language
Français
Contrast
3
Password
0000
Press twice on the key to return to the main menu.
Electrical network
TP Primary
400
TP Secondary
400
TC Primary
5000
TC Secondary
5
3 wire/4 wire
4 wire
14.8 Notes
If some parameters can be modified directly from the
navigation keys of the display, others can only be
defined using local or remote communication.
For local or remote communication, see chapter 22, on
page 73.
The parameter setting by local or remote
communication can be done using the E.set or E.view
software. They enable the parameter setting (E.set) or
remote parameter setting and visualization (E.view)
using a digital connection (RS485, modem, optical,
etc.).
ENERIUM Measure Station
47
Any other software or automaton compatible with the
ModBus RTU standard enables the parameter setting
of ENERIUM.
The reader can refer to the specific manual for this
application.
It is accepted that ENERIUM is supplied (see
paragraph 20.6, page 68) and connected to peripheral
equipment (see chapter 20, page 63). However, the
parameter setting can be performed without the
peripheral equipment being connected.
For additional information on the MODBUS/RTU and
MODBBUS/JCP/RTU protocol, contact ENERDIS to
obtain the document MSO-7388 – Mappings and
command words.
ENERIUM Measure Station
48
15. HARMONICS
This screen displays the menu of Harmonics only
on ENERIUM 150. It enables the graphical
visualization of harmonics, range by range, the three
ground voltages, three line voltages, three currents
and the corresponding distortion factors.
From the main menu by selecting the icon
pressing the OK key.
and
HA01A
15.1 Access
The V1 Harmonics Screens
15.2 ‘’Harmonics’’ Screen
The screen is as follows:
● The horizontal axis indicates the harmonic ranges
from 1 to 50 for ENERIUM 150. Range 0
corresponds to the continuous component and
ranges 1 to 50 correspond to harmonics.
● The vertical axis (0-100 %) indicates the harmonics
ratio in percentage with respect to the basic (range
1).
● V1: instantaneous ground voltage in volts.
● Hxx: value in percentage related to the most
important harmonic found between ranges 1 and
50.
HA00A
● THD: total harmonic distortion (see formula used in
paragraph 25.14, on page 89.
15.2.2
Harmonics screen.
It is used as follows:
V2 Harmonics
Displays the harmonics and additional data on ground
voltage V2. Refer to paragraph 15.2.1 - V1 Harmonics,
on page 49 for details.
1. The Harmonics screen is displayed.
2. Select the desired line with the keys and press
on OK to display the corresponding screen. Refer
to the next paragraphs for details.
15.2.1
V1 Harmonics
Press on the OK key to display the harmonics and the
additional data on the ground voltage V1. The display
is for example as follows:
15.2.3
V3 Harmonics
Displays the harmonics and additional data on the
ground voltage V3. Refer to paragraph 15.2.1 - V1
Harmonics, on page 49 for details.
15.2.4
U12 Harmonics
Displays the harmonics and additional data on the line
voltage U12. Refer to paragraph 15.2.1 - V1
Harmonics, on page 49 for details.
15.2.5
U23 Harmonics
Displays the harmonics and additional data on the line
voltage U23. Refer to paragraph 15.2.1 - V1
Harmonics, on page 49 for details.
ENERIUM Measure station
49
15.2.6
U31 Harmonics
Displays the harmonics and additional data on the line
voltage U31. Refer to paragraph 15.2.1 - V1
Harmonics, on page 49 for details.
15.2.7
I1 Harmonics
Displays the harmonics and additional data on the
current I1. Refer to paragraph 15.2.1 - V1 Harmonics,
on page 49 for details.
15.2.8
I2 Harmonics
Displays the harmonics and additional data on the
current I2. Refer to paragraph 15.2.1 - V1 Harmonics,
on page 49 for details.
15.2.9
I3 Harmonics
Displays the harmonics and additional data on the
current I3. Refer to paragraph 15.2.1 - V1 Harmonics,
on page 49 for details.
15.3 Return
Press twice on the key to return to the main menu.
ENERIUM Measure Station
50
16. FRESNEL AND GAUGES
This screen displays the Fresnel and gauges menu
on an ENERIUM 15 only. It enables the graphic
visualization of:
● Three ground and line voltages, and currents in the
form of a Fresnel diagram.
● Three ground and line voltages, currents and
powers (P1, P2, P3) in the form of baragraphs.
From the main menu by selecting the icon
pressing the OK key.
FR01A
16.1 Access
and
Example of a 3V Fresnel diagram
The information is the following:
● V1: instantaneous ground voltage V1 in volts.
16.2 “Fresnel and gauges’’
Screen
The screen is as follows:
● V2: instantaneous ground voltage V2 in volts.
● V3: instantaneous ground voltage V3 in volts.
● Φ12: phase shift, in degrees, of the V1 ground
voltage with regard to the V2 ground voltage.
● Φ23: phase shift, in degrees, of the V2 ground
voltage with regard to the V3 ground voltage.
● Φ31: phase shift, in degrees, of the V3 ground
voltage with regard to the V1 ground voltage.
Press on the key to return to the previous screen.
16.2.2 3U Fresnel
FR00A
Press on the OK key to display the Fresnel diagram of
the three ground voltages and the additional data. The
display is as follows:
The Fresnel and gauge screen.
It is used as follows:
1. The Fresnel and gauges screen is displayed.
16.2.1 3V Fresnel
Press on the OK key to display the Fresnel diagram of
the three ground voltages and the additional data. The
display is as follows:
ENERIUM Measure station
FR03A
2. Select the desired line with the keys and press
on OK to display the corresponding screen. Refer
to the next paragraphs for details.
Example of a 3U Fresnel diagram.
51
The information is the following:
● U12: instantaneous line voltage U12 in volts.
● U23: instantaneous line voltage U23 in volts.
● U31: instantaneous line voltage U31 in volts.
● Φ23: phase shift, in degrees, of the U23 line
voltage with regard to the U31 line voltage.
● Φ31: phase shift, in degrees, of the U31 line
voltage with regard to the U12 line voltage.
The Disequilibrium indication shows the rate of
unbalance between the line voltages. A correctly
balanced network has a rate close to zero.
Press on the key to return to the previous screen.
16.2.3 3I Fresnel
Press on the OK key to display the Fresnel diagram of
the three currents and the additional data. The display
is as follows:
FR05A
● Φ12: phase shift, in degrees, of the U12 line
voltage with regard to the U23 line voltage.
Example of a 3V baragraph
The indication “0 - 130 %” of the baragraph indicates
the instantaneous value measured with regard to the
TP
primary
value
programmed
in
Configuration/Electrical network.
For example, for a TP primary programmed for 400 V,
100% of the gauge corresponds to 400V
.
3
Press on the key to return to the previous screen.
16.2.5 3U Gauges
FR09A
Press on the OK key to display the baragraph diagram
of the three line voltages. The display is as follows:
The information is the following:
● I1: instantaneous current I1 in amperes.
FR06A
Example of a 3I Fresnel diagram.
● I2: instantaneous current I2 in amperes.
Example of a 3U baragraph.
● I3: instantaneous current I3 in amperes.
● Φ12: phase shift, in degrees, of the ground current
I1 with regard to the current I2.
The indication “0 - 130 %” of the baragraph indicates
the instantaneous value measured with regard to the
TP
primary
value
programmed
in
Configuration/Electrical network.
● Φ23: phase shift, in degrees of the ground current
I2 with regard to the current I3.
For example, for a TP primary programmed for 400 V,
100% of the gauge corresponds to 400 V.
● Φ31: phase shift, in degrees, of the ground current
I3 with regard to the current I1.
16.2.6 3I Gauges
Press the key to return to the previous screen.
Press on the OK key to display the baragraph diagram
of the three currents. The display is as follows:
16.2.4 3V Gauges
Press on the OK key to display the baragraph of the
three ground voltages. The display is as follows:
ENERIUM Measure Station
52
FR07A
Example of a 3I baragraph.
The indication “0-130 %” of the baragraph indicates the
instantaneous value measured with regard to the TC
primary value programmed in Configuration/Electrical
network.
For example, for a TC primary programmed for 5000 A,
100 % corresponds to 5000 A.
16.2.7 3P Gauges
FR08A
Press on the OK key to display the baragraph diagram
of the three active powers. The display is as follows:
Example of a 3P baragraph.
The indication “0-130 %” of the baragraph indicates the
instantaneous value measured with regard to the TC
and
TO
primary
values
programmed
in
Configuration/Electrical network.
For example, for a TC primary programmed for 5000 A
and a TP primary programmed for 400 V, 100 %
corresponds to 5000 * 400 , which is 1 154.7 kW.
3
16.3 Return
Press the key twice to return to the main menu.
ENERIUM Measure Station
53
ENERIUM Measure Station
54
17. LOAD CURVES
This curve cannot be displayed on the ENERIUM
screen but when using a specific application (E.view or
any application developed by the user).
The station can activate or not a recording of a load
curve. This load curve records from one to eight
variables among the following ten variables P+, P-, Q1,
Q2, Q3, Q4, S+, S-, TOR1, TOR2. The integration time
of these variables can be parametered among the
times 5, 10, 12, 15, 20, 30 and 60 minutes.
Each recording is composed of a time stamping (date
and time), a status and selected variables (maximum
eight). The variables are always ranked in the following
order: P+, P-, S+, S-, Q1, Q4, Q2, Q3, TOR1 and
TOR2.
The recording depth is based only on the parametered
integration time. The number of selected variables
does not modify the recording depth.
Tps (1)
Pfd (2)
5
17
10
34
12
40
15
51
20
68
30
102
60
204
(1): Integration time in minutes
(2): Recording depth in days.
The E.set and E.view software automatically provide
the recording depth according to the selected
integration time.
The status contains the marking of following events:
synchro loss, synchro return and change of
configuration and mains supply cut.
It is possible to reinitialize the load curves in totality by
sending a command word by local or remote
communication. A material entry is allocated to one of
the variables On/Off1 to 2, by the sending of a
command word over the local or remote
communication.
For additional information, contact ENERDIS to obtain:
● the MSO-7389 document for the management of
load curves.
● the MSO-7388 document for the mapping and
command words.
ENERIUM Measure station
55
ENERIUM Measure Station
56
18. RECORDING CURVES
This function is only available on ENERIUM 150.
These curves cannot be displayed on the ENERIUM
screen, but by using a specific application (E.view or
any other application developed by the user).
The product can record till four recording curves. The
recording period can be different from one curve to
another. This recording period is chosen, for each
curve, between 1 and 59 seconds in increments of one
second or among the following predefined values: 1, 2,
3, 4, 5, 6, 10, 12, 15, 20, 30 and 60 minutes.
The recording depth is only based on the recording
period. The system is designed to save a maximum of
4032 values.
● Average three-phase TAN(ϕ)s in generator and
receiver mode.
● Average frequency
● Average peak factors
● Average THDs in ground voltage, line voltage and
in current of each phase
18.2 Synchronization
modes
E.g.: for a recording period parametered at 1 second,
the storage register will be full at the end of 4032
seconds, or 1 hour, 7 minutes and 12 seconds.
There are three types of synchronizations to manage
the launch or stop of the recordings of previously
selected electrical variables:
According to the recording periods allowed from 1
second to 60 minutes, the recording period ranges
from 1 hour, 7 minutes and 12 seconds to 168 days.
● for the first type called "Synchronization on date",
the recording of data starts or stops when
ENERIUM reaches the programmed date and time.
The E_Set and E_View software automatically provide
the recording depth according to the selected
recording period.
● For the second type called "Synchronisation on
On/Off input", the recording of data starts or stops
when the selected On/Off input changes status.
18.1 Recorded variables
● for the third type called "Synchronisation on
alarm", the recording of data starts or stops when
the selected global alarm is activated. s
The following measurements can thus be recorded in a
recording curve:
● Average ground voltages
18.3 Operating modes of
recording curves
● Average line voltages
● Average currents
● Currents per second
● Three-phase active power per second
● Three-phase apparent power per second
● Three-phase reactive power per second
● Global power factor per second
● Unbalance factor per second
● Average active powers over each phase and threephased in generator and receiver mode.
● Average power factors over each phase and global
in generator and receiver mode
● Average Cos(ϕ) over each phase and global in
generator and receiver mode.
ENERIUM Measure station
There are five operating modes of recording curves:
● Continuous Mode: the recordings are done in a
circular manner in the curve, the oldest recording
being deleted by the latest recording (FIFO type
curve). In this mode, the three types of
synchronization are authorised for the recording
launch. On the other hand, only the writing of a
command word on the local or remote
communication can stop the data recording.
● Mode with stop on full buffer: the three types of
synchronisation are authorised for the launch of the
recording. The recording is stopped when the
storage register is full.
● Mode with immediate stop on synchro: the
recordings are done also in a circular manner in the
curve, the oldest recording being deleted by the
latest recording (FIFO type curve). The recording
57
starts as soon as a variable is allotted to the curve.
The writing of a command word on the local or
remote communication, a "Synchro on On/Off
input" or even a "Synchro on alarm" can
immediately stop the data recording.
● Mode with stop on centered synchro 25%-75%:
the recordings are done in the same manner as in
the third mode. But the recording stop occurs only
when 75 % of the recording curve contains data
recorded after the stop command, which can be the
writing of a command word on the local or remote
communication, a "Synchro on On/Off input" or
even a "Synchro on alarm".
The time setting of the product entails no change in the
programming. Moreover, no marking is executed in the
curves in case of change of time.
For more information, contact ENERDIS to obtain the
MSO-7390 document on recording curves and the
MSO-7388 document on the mapping and command
words.
● Mode with stop on centered synchro 50%-50%:
the recordings are done in the same manner as in
the third mode. But the recording stop occurs only
when 50 % of the recording curve contains data
recorded after the stop command, which can be the
writing of a command word on the local or remote
communication, a "Synchro on On/Off input" or
even a "Synchro on alarm".
18.4 Indicators of the
recording curve
Status of the recording curve
This indicator gives the status of the recording curve.
The status is:
● "Non-programmed" if the curve is not
programmed, i.e. if the variable allocated to the
curve is “none’’.
● "Pending" if a curve is programmed and waiting for
the start synchro.
● "In progress"
periodically.
if
the
curve
records
values
● "Terminated" if a stop command came or if the
curve stopped by itself.
Filling rate of the curve
This indicator gives the filling rate of the curve. For
curves managed in FIFO mode, this rate remains
blocked at 100%, when the recordings crash the oldest
ones.
When programming a new recording curve, this
automatically entails the stop and reset of the curve
previously ongoing recording or recorded. The
resetting of a trend curve can be launched manually,
by writing a command word on the local or remote
communication.
All the programmed curves recover their recordings
after a break of the auxiliary source, without performing
any marking.
It is possible to immediately stop the recording of a
curve by sending a command word on the local or
remote communication.
ENERIUM Measure Station
58
Installation
ENERIUM Measure station
59
ENERIUM Measure Station
60
19. MECHANICAL ASSEMBLY
This chapter describes the mechanical assembly of
ENERIUM. The dimensions are found in paragraph
24.9, on page 84.
19.1 Cutting
Assembling this version is done exclusively on panel.
Proceed as follows:
044
1. Make a cutting as indicated in the following figure.
Setting up a panel fastener: pull the clip end and slid it as
indicated above.
Operations: Continuation
038
This consists of the electrical assembly of the
ENERIUM and its additional elements (voltage
transformers, current transformers, etc.).
Dimensions of the cutting of the panel
2. Insert ENERIUM in the cutting, thru the external
part.
3. Slide the two table fasteners and push them until
you find the correct positioning of ENERIUM.
ENERIUM Measure station
61
ENERIUM Measure Station
62
20. ELECTRICAL CONNECTION
This chapter describes the electrical assembly of
ENERIUM.
20.1 Preliminary notes
20.1.1 Safety precautions
Before proceeding with the electrical installation of
the equipment and its peripheral elements, check
that the power supply is disconnected and locked
in compliance with good engineering practices and
safety rules.
20.1.5 Precautions against electrical
parasites
Although ENERIUM is immuned against electrical
current disturbances, it is desirable to avoid immediate
proximity of parts generating strong electrical parasites
(high power contactors, bus bar, etc.). The quality of
the communication on the computer bus depends a lot
on respecting these precautions.
20.2 Connection of voltage
and current inputs
20.1.2 Maximum applicable values
Refer to Chapter 24 – Technical characteristics, on
page 79.
It is to be noted that any overshooting of the
maximum applicable values can cause a permanent
deterioration of the device.
20.1.3 Protection of the U and I inputs
The voltage and current
based on the type of
paragraph 7.2 on page 19,
and the technical details.
follows:
inputs will be connected
assembly selected. See
for the terminal localization
The abbreviations are as
20.2.1 Unbalanced three-phase, 4 wires 3 TC
The insertion of fuses on the voltage inputs as well a
short circuit system for the current inputs is strongly
recommended.
20.1.4 Cables and terminals
The connections are made on:
● fixed screw terminals for the 2.5 mm² cables for the
power supply of the station and the voltage
measurement inputs.
● fixed screw terminals for the rigid or flexible wires
of 6 mm² section for the current measurement
inputs.
ENERIUM Measure station
M00
● screw terminals which can be dismantled for 2.5
mm² cables for the optional cards and the RS485
remote communication.
Assembly without TP.
63
Assembly with TP in star.
Assembly without TP.
M02
M05
20.2.2 Balanced three-phase, 4 wires - 1
TC
M04
M01
20.2.3 Unbalanced three-phase, 3 wires 3 TC
Assembly with TP in star shape.
M03
M06
Assembly without TP.
Assembly with TP.
ENERIUM Measure Station
Assembly with TP in triangle shape.
64
20.2.5 Mono-phase assembly
M07
M10
20.2.4 Unbalanced three-phase, 3 wires 2 TC
Assembly without TP.
M08
M11
Assembly without TP.
Assembly without TP.
Assembly with TP in star shape.
20.3 RS485 Connection
The RS485 output cannot be present when the
Ethernet card is present.
Only tests on the actual network can validate the
best
combination
(speed,
network
length,
impedance adaptation, etc.).
See paragraph 7.5, on page 21 for the location of the
terminal and the technical details.
M09
20.3.1 In undisturbed environment
Assembly with TP in triangle shape.
ENERIUM Measure Station
For an RS485 network in undisturbed electrical
environment, if possible use a twisted-pair cable. This
cable will be connected to the 18 (A+) and 19 (B-)
terminals. The agreement adopted for terminals (A)
and (B) corresponds to the EI485 standard (§ 3.2)
specifying that a logic level ‘”1” on the line corresponds
to VB>VA and a logic level “0” corresponds to VA>VB.
65
Connection of the RS485 link (standard connection).
20.3.2 In disturbed environment
With shielding
In case of a particularly disturbed electrical
environment, a shielded twisted-pair cable must be
used and the shielding of this cable must be connected
to the terminal 0 V (20) of ENERIUM.
026
024
RS485/RS232 Convertor
Connection of the RS485 link in disturbed electrical
environment with load and polarization resistances
20.4 Ethernet Connection
The Ethernet output cannot be present when the
RS485 card is present.
Connect the RJ45 Ethernet plug of each ENERIUM to
an RJ45 inlet of a switch (or hub) using an Ethernet
cable (straight cable for connection to a switch, twisted
cable for the connection to a PC).
025
See paragraph 7.6, en page 22 for the location of the
terminal and the technical details.
LED 1
Connection of the RS485 link in disturbed electrical
environment (presence of a shielding)
LED 2
With shielding and resistances (polarization and
load))
In order to improve the quality of transmission in
disturbed environment, it is also possible to polarize
the line in a single point. This polarization imposes the
rest level in the absence of transmission by two
resistances of 1.2 kΩ, between the 0 V line and the 5 V
line. These resistances are sometimes included in the
RS485/RS232 convertors. It is sometimes necessary
to adapt the line by connecting a resistance of 120 Ω
to the two ends of the bus.
Ethernet Terminal
028
Ethernet Switch
Connection of the Ethernet link to a switch.
ENERIUM Measure Station
66
20.4.1 LED 1: Connection LED
Colour
Meaning
Off
No connection.
Orange
Connection at 10 Mb per second.
Green
Connection at 100 Mb per second.
Load
Colour
Meaning
Off
No activity
Orange
Half duplex.
Green
Full duplex.
029
20.4.2 LED 2: Activity LED
Connection of analog outputs.
20.5 Connection of input
and output cards
These cards are optional.
The following figures show the labels associated with
different optional cards.
20.5.2 2 On/Off output card
Refer to paragraph 7.4.2, on page 20 for the
technical details regarding these On/Off outputs.
It is essential to parameter this card using local or
remote communication.
Connect the load and the connecting cable as follows:
Card
output
Function
OUT1
1-2
No.1 On/Off Output.
OUT2
3-4
No.2 On/Off Output.
ET_1 à 4
2 On/Off outputs option card label
Terminal
2 On/Off inputs option card label
2 analog outputs option card label
031
1 On/Off input and 1 On/Off output option
card label
Example of connection of On/Off outputs. The polarities on
the terminals 1-2 or 3-4 are indifferent.
20.5.3 2 On/Off input card
See paragraph 7.4.3, on page 21 for the technical
details regarding these On/Off inputs.
It is essential to parameter this card using local or
remote communication.
20.5.1 2 output analog card
It is essential to parameter this card using local or
remote communication.
See paragraph 7.4.1, on page 20 for the technical
details regarding these analog outputs.
Connect the input signal to the connecting cable as
follows:
Connect the load and the connecting cable as follows:
Card input
Card output
Terminal
Function
A01
1
A01 analog output cold point.
A01
2
A01 analog output hot point.
A02
3
A02 analog output cold point.
A02
4
A02 analog output hot point.
ENERIUM Measure Station
Terminal
Function
IN1
1-2
Signal input and earth. Polarities:
indifferent.
IN2
3-4
Signal input B and earth.
Polarities: indifferent.
67
20.6 Connection of the
auxiliary source
Note: ENERIUM is delivered with one of these two
types of power supplies. The type of power supply is
notified on the back label.
20.6.1 High level supply
033
Terminal 12
Terminal 13
Example of connection of On/Off input in pulsed mode. The
polarities on the terminals 1-2 or 3-4 are indifferent.
20.5.4 1 On/Off input and 1 On/Off output
card
See paragraph 7.4.4, on page 21 for the technical
details.
It is essential to parameter this card using local or
remote communication.
Polarity indifferent. See paragraph 7.3, on
page 20 for the technical details.
20.6.2 Continuous low level supply
Terminal 12
Terminal 13
Polarity indifferent. See paragraph 7.3, on
page 20 for the technical details.
Connect the A.C or D.C power supply as illustrated
below.
Terminals for AC or DC supply
Connect the input and the output as follows:
Card
output
Terminal
1
IN2
2
OUT3
3
OUT4
4
See paragraph 20.5.3.
See paragraph 20.5.2.
030
IN1
Function
Connection of the supply.
017
A fuse protection is necessary.
Example of connection of the logic input and output. The
polarities in the terminals are indifferent.
ENERIUM Measure Station
68
Use
ENERIUM Measure station
69
ENERIUM Measure Station
70
21. OPERATING PROCEDURE
21.1 Complete Procedure
Display
Recording curve
§
Page
18
57
11.3.3
38
This paragraph describes the complete procedure for
using ENERIUM.
System Date
Automatic scrolling of screens
14.5
45
21.1.1 Mechanical assembly
Fresnel Diagram
16.2
51
Refer to chapter19, on page 61.
Customized screens
13.2
41
EP+ active energy
10.3.1
33
EP1 active energy
10.3.2
34
Apparent energy
10.3.7
34
Reactive energy
10.3.3
34
14.4
44
11.3.1
37
21.1.2 Electrical assembly
Refer to chapter 20, on page 63.
21.1.3 Parametering
Refer to chapter 14, on page 43.
Ethernet – define IP address
21.1.4 Measurement consultation
Ethernet – read IP address
Use one of the following methods:
Fresnel (diagram)
16.2
51
Ph-Ph voltage harmonic
9.3.9
31
Type of ENERIUM
See page
Manually from the display
23
Current harmonic (I)
9.3.10
31
Locally (PC and optical link)
73
System time
11.3.3
38
Remote thru RS485 link
73
Gauges
16.2.4
52
Remote thru Ethernet link
73
Display language
14.5.3
45
Password
14.5.5
45
Serial number of the box
11.3.1
37
Software version number
11.3.1
37
Parity (RS485)
14.3
43
Average power (P, S)
9.3.6
30
Powers (S, P, Q, FP)
9.3.5
30
Electrical network
14.6
46
12.3.2
40
14.3
43
21.2 How to …
21.2.1 Display the information
Display
§
Page
14.3
43
11.3.1
37
14.4
44
11.3.1
37
14.5
45
Alarm (reset)
12.3.2
40
Alarms active on On/Off output
12.3.1
39
Stop Bit (RS485)
14.3
43
Configure the box
21.1.3
71
Currents (I)
9.3.3
30
Maximum average currents
9.3.4
30
17
55
ModBus Address (define)
ModBus Address (read)
Ethernet Address (define)
Ethernet Address (read)
Display (Scrolling and time)
Load curve
ENERIUM Measure station
Resetting of alarms
Reversal (temps – RS485)
RS485 (parametering)
14.3
43
Box operating time
11.3.2
38
Duration of network presence
11.3.2
38
Load duration
11.3.2
38
Ph-N (U) Voltages
9.3.1
29
Ph-Ph (V) Voltages
9.3.2
29
THD of the Ph-Ph voltage
9.3.7
30
Current THD (I)
9.3.8
31
Enerium Type
11.3.1
37
71
Display
RS485 transmission speed
§
Page
14.3
43
21.2.2 Modify the parameters
Display
§
Page
RS 485 remote communication *
14.3
43
Ethernet remote communication
14.4
44
Display
14.5
45
Electrical network
14.6
46
(*) The RS 485 and Ethernet interfaces cannot be present at
the same time.
ENERIUM Measure Station
72
22. LOCALE OR REMOTE COMMUNICATION
The local or remote communication enables parameter
setting and reading of ENERIUM, either using the
E.set or E.view application, or from any specific
application using the ModBus protocol in RTU mode,
(Optical or RS485 Interfaces) or ModBus TCP in RTU
mode (Ethernet Interface).
For additional information regarding the ModBus/RTU
and ModBus/TCP/RTU protocol, contact ENERDIS to
obtain the MS0-7388 document– Mapping and
command words.
22.1 E.set and E.view
applications
● Number of frames addressed to the station (outside
distribution).
● Number of distribution requests received.
● Number of NAQ responses.
● Number of unready slave responses.
● Number of unprocessed characters.
● Number of responses outside the function 8.
The transmission format is fixed as follows:
● Speed of 38400 bauds.
● 1 start bit.
● 8 data bits.
The reader should refer to the specific reference
manual for this software.
● Without parity.
● 1 stop bit.
22.2 ModBus/RTU
compatible specific
application
22.2.1 Local communication by optical
interface
● Reversal time of 0 ms (see paragraph 22.2.2, on
page 73, for the internal processing time).
The station responds to all the slave numbers between
1 and 247.
It is also possible to download, via the optical interface
only, a new application in the station. In this case, a
protocol different from ModBus is used.
The communication support is described in paragraphs
6.3 and 6.4, on pages 16 and 17.
22.2.2 Remote communication thru the
RS485 interface
Communication is performed in half duplex mode.
The communication support is described in paragraph
7.5, on page 21.
The functions implemented in the products are:
Communication is performed in half duplex mode.
● Function 03
: Reading of N words.
The functions implemented in the products are:
● Function 04
: Reading of N words.
● Function 03
: Reading of N words.
● Function 08 : Reading of diagnostic meters (For
details, see below).
● Function 04
: Reading of N words.
● Function 16
● Function 08 : Reading of diagnostic meters (For
the details see below).
: Writing of N words.
● Function 16
: Writing of N words.
The diagnostic meters are:
● Resetting of meters.
● Number of frames received without CRC.
● Number of frames received with CRC.
● Number of exceptional responses.
ENERIUM Measure station
73
The diagnostic meters are:
● Resetting of meters.
● Number of frames received without CRC.
● Number of frames received with CRC.
● Number of exceptional responses.
● Number of frames addressed to the station (outside
distribution).
● Number of distribution requests received.
● Number of NAQ responses.
● Number of unready slave responses.
● Number of unprocessed characters.
● Number of responses outside the function 8.
The processing of a frame addressed to slave 00 (i.e.
all the slaves present on the network) is performed.
The product does not send any response.
The transmission format is fixed with 1 start bit and 8
data bits. On the contrary, the slave number, parity,
number of stop bits, reversal time and the transmission
speed can be parametered.
The product address on the ModBus network can be
parametered from 1 to 247, in increments of 1.
22.2.3 Remote communication thru the
Ethernet interface
The communication support is described in paragraph
7.6, on page 22.
According to the status of the network, communication
is performed in half or full duplex mode.
An IP address of 000.000.000.000 configures
ENERIUM in DHCP (Dynamic Host Configuration
Protocol). An IP address is thus automatically assigned
to the product by the network’s DHCP server.
To determine the allocated IP address and mask, use
the E.set or E.view applications and launch the Search
command under Network/New Channel with Type of
channel parametered to Ethernet and Port number
defined at 502.
Knowing the serial number of the searched equipment,
just establish the correspondence between the IP
address and the serial number to know the IP address
of the equipment.
It is possible to parameter the IP address, the mask of
the sub-network and the gateway by the GUI (see
paragraph 14.4, on page 44) or using local or remote
communication.
The communication speed can be parametered from
among the values 2400, 4800, 9600, 19200, 38400
and 115200 bauds.
The communication parity can be parametered from
among the following values: Odd, Even and without
parity.
The number of stop bits for communication can be
parametered among the values 1 and 2.
The reversal time is a waiting time between the receipt
of the last of the three characters of the frame end and
the issue of the first character of the response frame.
The reversal time can be parametered from 0 to 500
ms, in increments of 50 ms.
Note: a reversal time configured for 0 ms is not the real
reversal time, which is then equal to the internal
processing time of the frame, which is around 35 ms.
For other values, the parametered time is the real
reversal time.
The default values are mentioned in paragraph 14.7,
on page 47.
ENERIUM Measure Station
74
23. MAINTENANCE
Since no electronic or electrical part is exchangeable
by the end user, the measure station shall be returned
to Manumesure, the distribution and after-sales center.
ENERIUM Measure station
75
ENERIUM Measure Station
76
Technical characteristics
ENERIUM Measure station
77
ENERIUM Measure Station
78
24. CHARACTERISTICS
ENERIUM measures and calculates more than 50
electrical variables. All these variables are effective
values (RMS).
The average variables are calculated over a time
programmable from 0 to 30 minutes. This variable is
refreshed at every tenth period.
Instantaneous variables are refreshed every second,
except for the THDs, every six seconds.
24.1 Measurements
The mini and maxi variables are updated every second
if needed.
1S
MIN
MAX
AVG
V1, V2, V3, Vearth
●
●
●
●
●
U12, U23, U31
●
●
●
●
●
I1, I2, I3, In
●
●
●
●
●
P1, P2, P3
●
● (1)
● (1)
Pt
●
● (1)
● (1)
Q1, Q2, Q3
●
● (1)
● (1)
Qt
●
● (1)
● (1)
S1, S2, S3
●
●
●
St
●
●
●
FP1, FP2, FP3
●
● (1)
FPt
●
● (1)
Cosφ1, Cosφ2, Cosφ3,
●
● (1)
● (1)
● (1)
AVG MIN
AVG MAX
● (1)
● (1)
●
● (1)
Cosφt,
●
● (1)
● (1)
● (1)
Tan φ,
●
● (1)
● (1)
● (1)
Frequency
●
Peak factor V1, V2, V3
●
●
●
Peak factor I1, I2, I3
●
●
●
Unbalance U
●
●
●
Harmonic (2) 1 to 50 V1, V2, V3, U12,
U23, U31, I1, I2, I3
●
THD V1, V2, V3, U12, U23, U31, I1, I2, I3
●
Time meters:
network presence, in load, auxiliary source
●
Active, Receiver, Generator Energy
●
Reactive Energy Qcad1 Qcad2, Qcad3,
Qcad4
●
Effective, Receiver, Generator Energy
●
Pulsed metering input
On/Off1, On/Off2
●
(1) also measures in generator and receiver mode
ENERIUM Measure station
●
●
●
●
●
●
(2) up to range 25 for ENERIUM 50
79
24.2 Load curves
Average values
FP1, FP2, FP3
●
FPt
●
Cos φ1, Cos φ2, Cos φ3
●
Pt Gen, Pt Rec
●
Cos φt
●
Qcad1 Qcad2, Qcad3, Qcad4
●
Tan φ
●
St Gen, St Rec
●
Frequency
●
On/Off1, On/Off2 Inputs
●
24.5 Recording curves
24.3 Alarms
(not available on ENERIUM 50)
1 sec Values
1 sec Values
V1, V2, V3, Vearth
●
U12, U23, U31
●
I1, I2, I3, In
●
Pt
●
Qt
●
St
●
FPt
●
Cos φt
●
Tan φ
●
Frequency
●
Unbalance U
●
3 time meters: network presence, loaded, Aux
source.
●
Average values
Pt Gen, Qt Rec
●
Qt Gen, Qt Rec
●
St
●
24.4 Analog outputs
1 sec Values
I1, I2, I3, In
●
Pt
●
Qt
●
St
●
FPt
●
Unbalance U
●
THD V1, V2, V3
●
THD U12, U23, U31
●
THD I1, I2, I3
●
Average values
V1, V2, V3,
●
I1, I2, I3, In
●
P1 Gen, P1 Rec, P2 Gen, P2 Rec, P3 Gen, P3
Rec, Pt Gen, Pt Rec
●
FP1 Gen, FP1 Rec, FP2 Gen, FP2 Rec, FP3
Gen, FP3 Rec, FPt Gen, FPt Rec
●
Cosφ1 Gen, Cosφ1 Rec, Cosφ2 Gen, Cosφ2
Rec, Cosφ3 Gen, Cosφ3 Rec, Cosφt Gen, Cosφt
Rec
●
Frequency
●
Peak factor V1, V2, V3
●
Peak factor I1, I2, I3
●
THD U12, U23, U31
●
V1, V2, V3, Vearth
●
THD I1, I2, I3
●
U12, U23, U31
●
THD V1, V2, V3
●
I1, I2, I3, In
●
P1, P2, P3
●
Pt
●
Q1, Q2, Q3
●
Qt
●
S1, S2, S3
●
St
●
ENERIUM Measure station
80
24.6.4 Current measurement inputs
24.6 Electrical
Variable
Range
Nominal input current
5A
+30%
24.6.1 Display
Maximum input current 6.5A (which is 5A
● LCD display, monochrome (128 lines, 160 pixels),
backlit by white LEDs. Contrast adjustable by local
or remote communication or via the local keyboard.
Peak factor
3
Frequency
42,5Hz (which is 50Hz
+15%
(which is 60Hz
)
Maximum measured
current
25,0 kA (primary side view from the
client transformer).
Consumption
<0.15 VA
● Display of pictograms (alarm, phass order,
communication, automatic scrolling, inductive
network, capacitive network, generator network),
Excees current
50 times the nominal current, which is
250A, for a duration of 1s supported 5
times to follow every 5 minutes.
● Display of texts dans 5 languages (German,
English, Spanish, French, Italian).
Three-phase
maximum active
power
1.2 GW (primary side view from the
client transformer).
● Forced setting of the screen possible after
activation by local or remote communication.
Non-detachable
terminals
6 connection points. Screw terminals,
with mobile cage.
● On the main menu, display of 6 to 8 icons enabling
the easy selection of variables to be visualised.
● Display of V, U, I, F, P, Q, S, FP, Tanφ, THD
variables, energies and harmonics.
● Automatic scrolling of screens specific to the user.
)
-15%
) to 69Hz
Connection of rigid or flexible wires of
2
section 0.5 to 6mm (20-10 AWG).
24.6.2 Keys
Maximum acceptable Coupling torque
on the terminal: 0.8 Nm.
● “OK” key for validation of choice.
● Joystick (4 keys) for selection and
navigation.
Setting range
TP primary from 1 A to 25 000 A in
steps of 1 A.
TP secondary from 1 A to 5 A in steps
of 1 A.
24.6.3 Voltage measurement inputs
Variable
Range
Nominal ground voltage
57.7 / 230 V
Nominal line voltage
100 V / 400 V
Maximum line voltage
120 V / 480V (which is 100/400V
+20%
)
Peak factor
2
Frequency
42,5Hz (which is 50Hz
) to
+15%
)
69Hz (which is 60Hz
Maximum measured line
voltage
650.0kV (primary side view from
the client transformer)
Permanent Surge
Twice the line voltage of nominal
input, which is 800V.
Consumption per phase
<0.2 VA
Impedance
500 kΩ
Non-detachable terminals
5 connection points. Screw
terminals, with mobile cage.
24.6.5
RS485 Output Communication
The RS485 card cannot be present at the same time
as the Ethernet card.
-15%
Connection of rigid or flexible
2
wires of section 0 to 2.5 mm (2214 AWG).
Item
Characteristics
Protocol
ModBus RTU mode.
Speed
2400, 4800, 9600, 19 200 and
115 200 Bauds.
Parity
without, even or odd.
Number of stop bits
1 or 2
Connection
2 fils + shielding, half duplex
Detachable terminals
3 connection points. Screw
terminals.
Connection of rigid or flexible
2
wires of section 0.2 to 2.5 mm
(22-14 AWG)
Maximum acceptable Coupling
torque on the terminal : 0.4 Nm.
Maximum acceptable coupling
torque on the terminal : 0.4 Nm.
Setting range
TP primary from 100 V to
650 000 V in steps of 1 V.
TP secondary from 100 V to 480
V in steps of 1 V.
ENERIUM Measure Station
81
Ethernet Output
Item
Characteristics
The Ethernet card cannot be present at the same time
as the RS485 card.
Information retention
10 years at 25 °C.
Retention date/time
5 days.
Item
Characteristics
Protocol
ModBus / TCP in RTU mode.
Speed
10/100 Base T
Maximum length
Transmission over 100 m max.
Connection
8 points RJ45 socket.
24.7 Optional cards
24.7.1 Terminal characteristics
Optical Interface
Item
Characteristics
Protocol
ModBus in RTU mode.
Transmission Format
Fixed at the speed of 38400
bauds, 1 start bit, 8 data bits,
without parity, 1 stop bit and a
reversal time of 0 ms. Responds
to all the slave numbers between
1 and 247.
Digital input/output
Optical (infrared) ensuring optical
bidirectional transmission.
Connection
By optical cord without electrical
contact.
24.6.6 Auxiliary supply source
Source
Characteristics
A.C/D.C (high tension) (*)
80 Vac/dc (or 100 Vac/dc
) to
+15%
265 Vac/dc (or 230 Vac/dc
).
Item
Characteristics
Number of admissible
optional cards:
1 per ENERIUM.
Detachable terminals
2 x 2 connection points. Screw
terminals.
Connection of rigid or flexible
2
wires of section 0 to 2.5 mm (2214 AWG).
Maximum acceptable coupling
torque on the terminal : 0.4 Nm.
24.7.2 2 output analog card
Item
Characteristics
Number of outputs
2.
Output Signal
D.C.
Maximum resistive load
10 V / I output
Maximum capacitive load
0.1 µF.
Response time
500 ms.
Isolation between outputs
1 kV – 1 min.
Limits (min and max)
-22 mA, ≤ Ioutput ≤+ 22 mA.
-20%
Frequency between 42.5 Hz (or
-15%
50 Hz
) and 69 Hz (or 60 Hz
+15%
) in A.C.
-20%
Low tension D.C (*)
19 Vdc (or 24 Vdc
+20%
(or 48 Vdc
).
) to 58 Vdc
Consumption
<15 VA – 10 W.
Item
Characteristics
Non-detachable terminals
2 connection points. Screw
terminals, with mobile cage.
Number of inputs
2.
24.7.3 2 On/Off inputs card
Input Signal
Continuous.
Connection of rigid or flexible
2
wires of section 0 to 2.5 mm (2214 AWG).
Amplitude of the input signal
Between 19.2 Vdc (or 24 Vdc
+20%
20%
) and 72 Vdc (or 60 Vdc
).
Maximum acceptable coupling
torque on the terminal : 0.4 Nm.
Level Interpretation
Amplitude < 5 V: the logic level
read is "0".
-
(*): Either model. Supply mounted by the manufacturer
Amplitude > 10 V: the logic level
read is "1".
24.6.7 Information retention
The signal width should be at the
minimum 30 ms.
The information saved after a supply break is the:
Absorbed power
<0.5 W per On/Off input.
● Average values
Isolation between outputs
2.2 kV – 1 min.
● Minimum values
Type of protection
Optocoupler.
● Parametering
● Maximum values
● Energy meters
● Pulse meters
● Event files
● Time meters
● Load curves
● Recording curves.
ENERIUM Measure Station
82
24.7.4 2 On/Off output card
Item
Characteristics
Number of outputs
2.
Maximum admissible current
≤ 100 mA.
Output signal
D.C. signal varying from 19.2Vdc
-20%
) to 265 Vdc (or
(or 24 Vdc
+20%
220 Vdc
).
FP between [0.5 inductive and
0.8 capacitive]
V between [99% and 101%] of
Vnom
I between [10% and 130%] of
Inom
Q
±0,5% of the
measurement
±0,05% of Pnom
Sin (φ) = 1
A.C. frequency signal between
42.5 Hz and 69 Hz, varying from
-20%
19.2 Vac (or 24 Vac
) to 265
+15%
).
Vac (or 230 Vac
V between [99% and 101%] of
Vnom
Output in pulsed mode
Complies with CEI 62053-31
(1998) standard.
I between [2% and 5%[ of Inom
Isolation between outputs
2,2 kV – 1 min.
Type of contact
Dry contact.
Sin (φ) lying between [0.5
inductive and 0.5 capacitive]
Type of protection
Static relay (bidirectional MOS
transistor).
I between [5% and 130%] of Inom ±1% of the
measurement
±1,5% of the
measurement
V between [99% and 101%] of
Vnom
24.7.5 1 On/Off input and 1 On/Off output
card
Electrical characteristics identical to those of the “1
On/Off input” and “1 On/Off output” cards described in
paragraph 24.7.3 on page 82 and 24.7.4 on page 83.
I between [10% and 130%] of
Inom
±1% of the
measurement
I between [5% and 10%[ of Inom
±1,5% of the
measurement
Sin (φ)between [0,25 inductive
and 0,25 capacitive]
V between [99% and 101%] of
Vnom
The differences are found in the number of inputs and
outputs available on the card, i.e.:
- Number of On/Off inputs: 1
- Number of On/Off outputs: 1
I between [10% and 130%] of
Inom
±3,5% of the
measurement
S
V between [99% and 101%] of
Vnom
±0,5% of the
measurement
Cos(φ)
Cos(φ)between [0.5 inductive
and 0.5 capacitive]
24.8 Metrology
I between [5% and 130%[ of Inom ±0,02% of Snom
(A 23°C ±2°C, 50Hz (except for variable F))
Vnom/Unom = 230 V / 400 V for TP secondary > 100 V
V between [99% and 101%] of
Vnom
Vnom/Unom = 57,7 V / 100 V for TP secondary = 100 V
I between [5% and 130%] of Inom ±0,02 points
Inom = 5A
Cos(φ)between [0.2 inductive et
0.2 capacitive]
Variable
Conditions
Accuracy
V
V between [10% and 120%] of
Vnom
±0,2% of the
measurement
±0,02% of Vnom
±0,2% of the
measurement
±0,02% of Unom
U
U between [10% and 120%] of
Unom
I
I between [5% and 130%] of Inom ±0,2% of the
measurement
±0,02% of Inom
V between [99% and 101%] of
Vnom
I between [5% and 130%] of Inom ±0,05 points
Tan(φ)
Tan(φ)between [1.732 inductive
and 1.732 capacitive]
V between [99% and 101%] of
Vnom
I between [5% and 130%] of Inom ±0,02 points
Tan(φ)between [4.90 inductive
and 4.90 capacitive]
F
F between [42,5Hz and 69Hz]
± 0,1Hz
V between [99% and 101%] of
Vnom
CH
-
± 250ppm
I between [5% and 130%] of Inom ±0,05 points
P
FP equals 1
V between [99% and 101%] of
Vnom
I between [5% and 130%] of Inom ±0,5% of the
measurement
±0,02% of Pnom
ENERIUM Measure Station
83
Variable
Conditions
FP
FP between [0.5 inductive and
0.5 capacitive]
Accuracy
Variable
Conditions
Accuracy
Effective
E
V between [99% and 101%] of
Vnom
± 0.5% of the
measurement
I between [5% and 130%] of Inom
V between [99% and 101%] of
Vnom
I between [5% and 130%] of Inom ±0,02 points
Harmonic
s per
range
FP between [0.2 inductive and
0.2 capacitive]
V between [99% and 101%] de
Vnom
I between [5% and 130%] of Inom
V between [99% and 101%] of
Vnom
Active E
± 0.5 points
FP equalsl 1
THD
± 0.5 points
FP equals 1
I between [5% and 130%] of Inom ±0,05 points
V lying between [99% and
101%] of Vnom
FP equals 1
I lying between [5% and 130%]
of Inom
V between [99% and 101%] of
Vnom
Time
± 20ppm
T = 23 °C
(or ± 52 seconds
over 30 days)
I between [5% and 130%] of Inom ± 0.5% of the
measurement
I between [1% and 5%] of Inom
± 1% of the
measurement
FP between [0.5 inductive and
0.8 capacitive]
V between [99% and 101%] of
Vno m
± 0.6% of the
measurement
I between [2% and 10%[ de Inom
± 1% of the
measurement
Overall Dimensions (mm) :
96*96*55 (H, L, D)
Weight:
<600 g.
Assembly:
On panel according to DIN
43700.
Format:
DIN 96 x 96.
Sin (φ) = 1
Dimension of the cutting:
92 x 92 mm.
V between [99% and 101%] of
Vnom
Fastening:
by angle fastening (panel
assembly).
I between [5% and 130%] of Inom ± 1% of the
=5A
measurement
Name plate
on the rear part of the
equipment.
Device number
on the rear part of the
equipment.
I between [2% and 5%[ of Inom
± 1.5% of the
measurement
FP between [0.5 inductive and
0.5 capacitive]
V between [99% and 101%] of
Vnom
I between [10% and 130%] of
Inom
± 1% of the
measurement
I between [5% and 10%[ of Inom
± 1.5% of the
measurement
FP between [0.25 inductive and
0.25 capacitive]
V between [99% and 101%] of
Vnom
I between [10% and 130%] of
Inom
± 3% of the
measurement
040
Reactive
E
I between [10% and 130%] of
Inom
24.9 Mechanical
Figure 24-1 : dimensions in millimeters.
ENERIUM Measure Station
040
84
24.10 Environmental
constraints
24.10.1 Climatic constraints
Operating temperature:
-10 to 55 °C.
Operating humidity:
Up to 95% at 40 °C.
Storage temperature:
-25 to +70 °C.
24.10.2 Safety constraints
Level of pollution :
2
Resistance to fire:
Complies with UL94
standard for the severity
level V1.
Installation category
III
24.10.3 Mechanical constraints
Protection index :
According to CEI 60529, for
the following severity level:
IP 51 Index (front face).
IP 20 Index (rear face).
Mechanical shocks:
According to CEI 61010-1.
Vibrations:
CEI 60068-2-6 (A method).
Free fall with packing
From a height of 1 m,
according to the NF H 00421 standard.
24.10.4 Electromagnetic compatibility
According to the CEI 613261 standard
24.11 Accessories
Optical cable:
For local communication;
Connection to a PC by
minimum USB 1.1 plug.
Cable sold separately.
Software:
Configuration software
E.view or E.set.
ENERIUM Measure Station
85
ENERIUM Measure Station
86
25. MEASURED VARIABLES
This chapter presents the mathematical formulas used for
the calculation of the different measurements by
ENERIUM.
The measurements are perfomed from the “10-period”’’
current measurements for a network frequency
parametered at 50Hz and “12-period’’ for a network
frequency parametered at 60Hz. The formulas are:
25.1 Ground voltage
The measurements are performed from the “10-period’’
ground voltage measurements for a network frequency
parametered at 50Hz and “12-period’’ for a network
frequency parametered at 60Hz. The formulas are:
V L [1s ] =
5
1
× ∑ V L2 [10 T ]
5 1
(For
25.3 Current
F=50Hz)
5
I L[1 s ]= 1 ×∑ I L2[10 T ] (For F=50Hz) or
5 1
5
I L[1 s ]= 1 ×∑ I L2[12 T ] (For F=60Hz)
5 1
or
With I L[ 10 T ]=
5
VL[ 1 s ]= 1 ×∑VL2[12 T ] (For F=60Hz)
5 1
12
10
1 × VL2[T ] , VL[12 T ]= 1 × VL2[T ]
12 ∑
10 ∑
1
1
With VL[10 T ]=
and VL[ T ]=
and I L[ 12 T ]=
10
1 × I L2[T ]
10 ∑
1
12
1 × I L2[ T ]
12 ∑
1
L = 1, 2, 3, N
128
1 × vL2
128 ∑
1
For L=1,2 et 3 : I L[ T ]=
128
1 × iL2
128 ∑
1
L = 1, 2, 3, T
And for L = N I L[T ]=
25.2 Line voltages
The measurements are performed from the “10-period’’
measurements of line voltages for a network frequency
parametered at 50Hz and “12-period’’ for a network
frequency parametered at 60Hz. The formulas are:
5
U ab[1 s ]= 1 ×∑U ab2 [10 T ]
5 1
(For
F=50Hz)
or
128
1 × (i1 + i2 + i3) 2
128 ∑
1
25.4 Active power
The measurements are performed from the “10-period’’
measurements of active powers for a network frequency
parametered at 50Hz and “12-period’’ for a network
frequency parametered at 60Hz. The formulas are:
5
5
U ab[ 1 s ]= 1 ×∑U ab2 [12 T ] (For F=60Hz)
5 1
PL[1 s ]= 1 ×∑ PL [10 T ] (For F=50Hz) or
5 1
5
With U
ab
[10 T ] =
U ab[ 12 T ]=
10
1
× ∑ U ab2 [T ] ,
10 1
12
1 × U 2 [T ]
ab
12 ∑
1
and U ab[ T ]=
128
1 × ( va − v ) 2
b
128 ∑
1
ab = 12, 23 ou 31
ENERIUM Measure station
PL[1 s ]= 1 ×∑ PL [12 T ] (For F=60Hz)
5 1
With P [10 T ] = 1 ×
L
10
PL [12 T ] =
10
∑P
L
[T ] ,
1
1 12
× ∑ PL [T ]
12 1
128
and
PL[T ]= 1 ×∑ vL ×iL
128 1
87
L = 1, 2, 3.
P[1s ]
25.8 Power factor
is the sum of active powers at the second :
P [1s ] = P1 [1s ] + P 2[1s ] + P 3[1s ]
25.5 Transit direction of
powers
The products measure the transit direction of the powers
"at the second".
● If P[1s] is positive, the transit direction of the powers
is the Receiver.
● If P[1s] is negative, the transit direction of the powers
is the Generator.
25.6 Reactive power
The products measure the reactive powers "at the
second" on each of the Q1[1s], Q2[1s] and Q3[1s] phases,
as well as the three-phase reactive power "at the second"
Q[1s].
The measurements are performed from other
measurements, according to the following formula:
Q L [1s ] = SigneQ L [1 s ] S L2 [1 s ] − PL2 [1s ]
The products measure the power factors "at the second"
on each of the FP1[1s], FP2[1s] and FP3[1s] phases, as
well as the three-phase power factor "at the second"
FP[1s].
The measurements are performed from other
measurements, according to the following formula.
FPL [1s ] =
PL [1s ] L = 1, 2, 3 or nothing for the threeS L [1s ]
phase.
The quadrant is associated to each of these variables. If
Px[1s] and Qx[1s] (x = 1, 2, 3 or nothing for the threephase variable) are of the same sign, then the quadrant is
selfic; otherwise, it is capacitive.
25.9 Cos(ϕ
ϕ)
The products measure the cos(ϕ) "at the second" on
each of the cos(ϕ1)[1s], cos(ϕ2)[1s], cos(ϕ3)[1s] phases,
as well as the global cos(ϕ) "at the second" called
cos(ϕg)[1s].
The cos(ϕ) are calculated according to the following
formula :
5
L = 1, 2 or 3
cos( ϕ L )[ 1 s ]= 1 ×∑ cos( ϕ L )[ 10 T ] (For F=50Hz) OR
5 1
SigneQ L [1s ] is the sign of the reactive power,
cos( ϕ L )[1s ] =
developed from the simplified Hilbert transformation.
For F = 50 Hz :
1 5
× ∑ cos( ϕ L )[12 T ] (For F=60Hz)
5 1
L = 1, 2 and 3
SigneQ L [1s ] =
Sign of
6400
∑
i =1
v ( i −1) * (i1 − i ( i − 2 ) )
and
cos( ϕ global )[ 1 s ]=
cos( ϕ1)[ 1 s ]+ cos( ϕ 2)[ 1 s ]+ cos( ϕ 3)[ 1 s ]
3
with
For F = 60 Hz :
SigneQ L [1s ] =
cos( ϕ L )[10 T ] = cos( Angle _ V L _ Fondamenta l [10 T ] − Angle _ I L _ Fondamenta l [10 T ])
Sign of
7800
∑
i =1
i( i −1) * (i1 − i( i − 2 ) )
Q[1s] is the sum of "at the second" reactive powers Q[1s]
= Q1[1s] + Q2[1s] + Q3[1s].
25.7 Apparent Power
and
cos( ϕ L )[12 T ] = cos( Angle _ V L _ Fondamenta l [12 T ] − Angle _ I L _ Fondamenta l [12 T ])
The quadrant is associated to each of these variables.
● If the angle ϕ is between 0° and 90° or between 180°
and 270°, then the quadrant is selfic.
● If the angle ϕ is between 90° and 180° or between
270° and 360°, then the quadrant is capacitive.
The products measure the apparent powers "at the
second" on each of the S1[1s], S2[1s] and S3[1s] phases,
as well as the three-phase apparent powers "at the
second" S[1s].
The measurements are performed from other
measurements, according to the following formula:
S L [1s ] = VL [1s ] × I L [1s ] .
L = 1, 2 or 3
S[1s] is the sum of apparent powers "at the second" S[1s]
= S1[1s] + S2[1s] + S3[1s].
ENERIUM Measure Station
88
25.10 Peak factor
25.11 Tan(ϕ
ϕ)
The measurements are performed from the “10-period’’
active power measurements for a network frequency
parametered at 50Hz and “12-period’’ for a network
frequency parametered at 60Hz. The formulas are:
The product measures the global “at the second’’ Tan(φ) .
25.10.1 For the voltages
5
FC VL[ 1 s ]= 1 ×∑ FC VL[ 10 T ] (For F=50Hz) or
5 1
5
FC VL[ 1 s ]= 1 ×∑ FC VL[ 12 T ] (For F=60Hz)
5 1
with FC [10 T ] = Vpeak [10 T ]
VL
tg(ϕg )[1s] =
Q[1s]
P[1s]
25.12 Frequency
The
measurements
are
performed
from
the
measurements of “10-period’’ active powers for a network
frequency parametered at 50Hz and “12-period’’ for a
network frequency parametered at 60Hz. The formulas
ares:
V [10 T ]
and FC [12 T ] = Vpeak [12 T ]
VL
V [12 T ]
with V [10 T ] =
The quadrant is associated with each of these variables.
If P[1s] and Q[1s] (three-phase variable) are of the same
sign, then the quadrant is selfic, otherwise it is capacitive.
1280
1
× ∑ v L2
1280
1
10T
F[1s]=F_sampling x
Nbr_Samples_on_10T
1536
1
× ∑ v L2
1536
1
and V [12 T ] =
With the following functional relationship: F_sampling =
128 * F[1s]
with Vpeak [10T ] = max[ abs ( v L )]
and Vpeak [12 T ] = max[ abs ( v L )]
25.13 Harmonics
L = 1, 2, 3
25.10.2 For the currents
5
FC IL[1 s ]= 1 ×∑ FC IL[10 T ] (For F=50Hz)
5 1
OR FC [1s ] = 1 ×
IL
5
5
∑ FC
IL
[12 T ] (For F=60Hz)
The products measure the harmonic rate Hx "at the
second", range by range, on the three ground voltages V1,
V2, V3, on the three line voltages U12, U23, U31 and on the
three currents I1, I2, I3, in compliance with the CEI 610004-7 standard (edition 2). The measurements are
performed from the harmonics hx[10T], according to the
formula :
1
with FC [10 T ] = Ipeak [10 T ]
IL
I [10 T ]
and FC [12 T ] = Ipeak [12 T ]
IL
I [12 T ]
When the ground voltage, line voltage or current is equal
to 0, then the harmonic rate of the concerned variable is
not calculated and its value is 0.
with
I [10 T ] =
1280
1
× ∑ i L2 and I [12 T ] =
1280
1
1536
1
× ∑ i L2
1536
1
With Ipeak [10 T ] = max[ abs (i L )] and
Ipeak [12 T ] = max[ abs (i L )]
In the case of ENERIUM 50, the measurement is
performd up tol range 25. In the case of ENERIUM 150,
the measurement is performed up to range 50.
25.14 Harmonics rate
L = 1, 2, 3
The products measure the harmonic rate “at the second’’
on the three ground voltages THDV1[1s], THDV2[1s],
THDV3[1s], on the three line voltages THDU12[1s],
THDU23[1s] and THDU31[1s], as well as on the three
currents THDI1[1s], THDI2[1s] and THDI3[1s], according to
the definition of the CEI 60050-551-20 standard.
ENERIUM Measure Station
89
The measurements are performed from the range by
range harmonics “at the second’’, calculated according to
the following formula:
50
THD = 100 ×
∑H
n=2
2
n
H 12
When the ground voltage, line voltage or the current is
equal to 0, the harmonic rate of the concerned variable is
not calculated and its value is 0.
25.16 Unbalance
The products calculate every second the voltage
unbalance rate called Des[1s], from the measurements of
the line voltages “at the second’’ and according to the
following algorithm:
Thus variables Fact1 and Fact2, such as:
Fact1 = U 12 [1s] + U 23 [1s] + U 31 [1s]
2
25.15 Energy and Energy
metering
2
2
Fact 2 = U 12 [1s] + U 23 [1s] + U 31 [1s]
4
4
4
Or the variable Fact3, such as:
The products calculate “at the second’’ the active energy
EP[1s], reactive energy EQ[1s] and the apparent energy
ES[1s].
If
The measurements are performed from other
measurements already calculated, according to the
following formula:
Else
EX [1s ] = M [1s ] ×
N ech
. X = P, Q or S.
3600 × Fech
If
M is the variable measured “at the second’’ (Active,
Reactive or Apparent power). Nech is the number of
samples collected during the sampling window. Fech is the
sampling frequency.
● If P[1s] is positive, the EP[1s] energy measurement is
added to the active energy meter in receiver mode
CEPR and the measurement of ES[1s] energy is
added to the apparent energy meter in receiver mode
CESR.
● If P[1s] is negative, the EP[1s] energy measurement
is added to the active energy meter in generator
mode CEPG and the measurement of ES[1s] energy
is added to the apparent energy meter in generator
mode CESG.
● If P[1s] and Q[1s] are positive, the EQ[1s] energy
measurement is added to the reactive energy meter
of the first quadrant CEQ1. If P[1s] is negative and
Q[1s] is positive, the EQ[1s] energy measurement is
added to the reactive energy meter of the second
quadrant CEQ2. If P[1s] is positive and Q[1s] is
negative, the EQ[1s] energy measurement is added to
the reactive energy meter of the third quadrant CEQ4.
If P[1s] and Q[1s] are negative, the EQ[1s] energy
measurement is added to the reactive energy meter
of the fourth quadrant CEQ3.
Fact3 = 3 × Fact12 − 6 × Fact 2
Or the variable Fact4, such as:
The energies are measured in absolute values, they are
thus always positive.
According to the quadrant, the energy measured is added
in an total meter.
(3 × Fact12 − 6 × Fact 2) < 0
Then Fact3 = 0
(6 × Fact 2 − 2 × Fact12 ) < 0
Then Fact 4 = 0
Else Fact 4
If
= 6 × Fact 2 − 2 × Fact12
Fact 4 > 0
Des[1s] = 1000 ×
Else
Then
( Fact1 − Fact 3)
Fact 4
Des[1s] = 0
25.17 Phase order
This function executes the cabling test, by verification of
the phase order on the voltage lines. The calculation is
performed over 3 periods and every 10 periods of the
input reference signal. If the phase order is incorrect, as
pictogram lights up in the lower strip of the visualization
screens.
It is possible to reset all the meters using a command
word on the local or remote communication. It is also
possible to reinitialize a meter independently from
another, with a value, also using a command word on the
local or remote communication.
ENERIUM Measure Station
90
25.18 Time meter
The products integrate three time meters.
● The first time meter totals the time during which the
product is active, i.e. the period during which the
auxiliary source is present. This time meter is called
“Auxiliary source presence’’ time meter.
● FCV1[aver], FCV2[aver], FCV3[aver]
● FCI1[aver], FCI2[aver], FCI3[aver]
The averages listed above are calculated according to
the following formula:
X [moy] =
1
×
N
N
∑ X [1s]
i
i =1
● The second time meter totals the time during which
the “one second’’ measurement of at least one ground
voltage, from among V1[1s], V2[1s] et V3[1s], is
different form zero. This time meter is called “network
presence’’ time meter.
25.19.3 Arithmetic averages (B)
● The third time meter totals the time during which the
“one second’’ measurement of at least one current
from among I1[1s], I2[1s] et I3[1s], is different from
zero. This time meter is called “load presence’’ time
meter.
● P1R[aver], P2R[aver], P3R[aver], PR[aver]
25.19 Average variable
The products calculate the arithmetic averages of “at the
second’’ variables in the two quadrants in receiver mode.
These averages are the following:
● Q1R[aver], Q2R[aver], Q3R[aver], QR[aver]
In the case where Px[1s] is positive or nil (receiver mode),
it is the value measured “at the second’’ which is taken
into account in the average. When Px[1s] is negative
(generator mode), it is the value 0 which is taken into
account in the average.
25.19.4 Arithmetic averages (C)
The averages are sliding averages, updated every tenth
of the integration duration. The integration duration is
common to all variables. This integration duration is
chosen from among the following predefined values: 1, 2,
3, 4, 5, 6, 10, 12, 15, 20, 30 and 60 minutes.
All the average values can be updated by writing a
command word on the local or remote communication.
The reinitialization consists of placing the 0 value in the
variable, with the exception of averages of the variables
of type FPx and cos (ϕx), for which the reinitialization
consists of placing the value 1.
The products calculate the arithmetic averages of “at the
second’’ variables in the two quadrants in receiver mode.
These means are the following:
● FP1R[aver], FP2R[aver], FP3R[aver], FPR[aver]
● cos(ϕ1)R[aver],
cos(ϕg)R[aver]
cos(ϕ2)R[aver],
cos(ϕ3)R[aver],
In the case where Px[1s] is positive or nil (receiver mode),
it is the value measured “at the second’’ which is taken
into account in the average. When Px[1s] is negative
(generator mode), it is the value 1 which is taken into
account in the average.
25.19.1 Quadratic averages
The products calculate the quadratic averages of the “at
the second’’ variables in the four quadrants. These
averages are the following:
● V1[aver], V2[aver], V3[aver]
● U12[aver], U23[aver], U31[aver]
● I1[aver], I2[aver], I3[aver], IN[aver]
The averages listed above are calculated according to
the following formula:
X [moy ] =
1
×
N
N
∑ X [1s]
2
i
i =1
25.19.2 Arithmetic averages (A)
The products calculate the arithmetic averages of “at the
second’’ variables in the four quadrants. These averages
are the following:
● S1[aver], S2[aver], S3[aver], S[aver]
● F[aver], Des[aver]
● THDV1[aver], THDV2[aver], THDV3[aver]
● THDU12[aver], THDU23[aver], THDU31[aver]
25.19.5 Arithmetic averages (D)
The products calculate the arithmetic average of “at the
second’’ variables in the two quadrants in generator
mode. These averages are the following:
● P1G[aver], P2G[aver], P3G[aver], PG[aver],
● Q1G[aver], Q2G[aver], Q3G[aver], QG[aver]
In the case where Px[1s] is negative (generator mode), it
is the value measured “at the second’’ which is taken into
account in the average. When Px[1s] is positive or nil
(receiver mode), it is the value 0 which is taken into
account in the average.
25.19.6 Arithmetic means (E)
The products calculate the arithmetic averages of “at the
second’’ variables in the two quadrants in generator
mode. These means are the following:
● FP1G[aver], FP2G[aver], FP3G[aver], FPG[aver]
● cos(ϕ1)G[aver],
cos(ϕg)G[v]
cos(ϕ2)G[aver],
cos(ϕ3)G[aver],
In the case where Px[1s] is negative (generator mode), it
is the value measured “at the second’’ which is taken into
account in the average. When Px[1s] is positive or nil
● THDI1[aver], THDI2[aver], THDI3[aver]
ENERIUM Measure Station
91
(receiver mode), it is the value 1 which is taken into
account in the average.
The minima listed above are developed according to the
following algorithm:
( X [1s] < XG[min]) AND (P[1s] < 0)
Then ( XG[min] = X [1s ]) with X = P or Q.
If
25.20 Calculation of minima
Each minimum is timestamped (date and time of
detection of the minimum). All the minima can be
reinitialized by writing a command word over the local or
remote communication. The reinitialization consists of
placing the value 0 in the variable, with the exception of
the minima of variables of type FPx and cos (ϕx), for
which the reinitialisation consists of placing the value 1.
25.21 Minima of variables
25.21.1 Minima (A)
The products calculate the minima of “at the second’’
variables in the four quadrants. These minima are the
following:
V1[min], V2[min], V3[min]
● U12 [min], U23[min], U31[min]
● I1[min], I2[min], I3[min], IN[min]
● F[min]
The minima listed above are developed according to the
following algorithm:
Si
( X [1s] < X [min])
Then
( X [min] = X [1s])
with X = Uab, IL ou F
ab=12, 23 or 31
25.22 Minima of average
variables
25.22.1 Minima (A)
The products also calculate the minima of average
variables in the two quadrants corresponding to the
receiver mode. These minima are the following:
● FP1R[min aver], FP2R[min aver], FP3R[min aver],
FPR[min v]
● cos(ϕ1)R[min aver], cos(ϕ2)R[min aver],
cos(ϕ3)R[min aver], cos(ϕg)R[min aver]
The minima listed above are developed according to the
following algorithm:
( X [moy] < XR[min moy]) AND (P[moy] ≥ 0)
Then ( XR[min moy] = X [ moy]) with X = FP or cos(ϕg).
If
25.22.2 Minima (B)
The products also calculate the minima of average
variables in the two quadrants corresponding to the
generator mode. These minima are the following:
● FP1G[min aver], FP2G[min aver], FP3G[min aver],
FPG[min aver]
● cos(ϕ1)G[min aver], cos(ϕ2)G[min aver],
cos(ϕ3)G[min aver], cos(ϕg)G[min aver]
L = 1, 2 or 3.
The minima listed above are developed according to the
following algorithm:
25.21.2 Minima (B)
( X [moy] < XG[min moy]) AND (P[moy] < 0)
Then ( XG[min moy ] = X [ moy ])
The products also calculate the minima of “at the second’’
variables in the two quadrants corresponding to the
receiver mode. These minima are the following:
● P1R[min], P2R[min], P3R[min], PR[min]
● Q1R[min], Q2R[min], Q3R[min], QR[min]
The minima listed above are developed according to the
following algorithm:
( X [1s] < XR[min]) AND (P[1s] ≥ 0)
Then ( XR[min] = X [1s ]) with X = P or Q.
If
25.21.3 Minima (C)
The products also calculate the minima of “at the second’’
variables in the two quadrants corresponding to the
generator mode. These minima are the following:
If
with X = FP or cos(ϕ).
25.23 Calculation of maxima
Each maximum is timestamped (date and time of
detection of the maximum). All the maxima can be
reinitialized by writing a command word over the local or
remote communication. The reinitialization consists of
placing the value 0 in the variable, with the exception of
the maxima of variables of type FPx and cos (ϕx), for
which the reinitialization consists of placing the value 1.
● P1G[min], P2G[min], P3G[min], PG[min],
● Q1G[min], Q2G[min], Q3G[min], QG[min]
ENERIUM Measure Station
92
25.24 Maxima of variables
● U12[max aver], U23[max aver], U31[max aver]
● I1[max aver], I2[max aver], I3[max aver], IN[max aver]
● Des[aver]
25.24.1 Maxima (A)
The products calculate the maxima of “at the second’’
variables in the four quadrants. These maxima are the
following:
● V1[max], V2[max], V3[max]
● U12[max], U23[max], U31[max]
● I1[max], I2[max], I3[max], IN[max]
● F[max]
● THDV1[aver], THDV2[aver], THDV3[aver]
● THDU12[aver], THDU23[aver], THDU31[aver]
● THDI1[aver], THDI2[aver], THDI3[aver]
● FCV1[aver], FCV2[aver], FCV3[aver]
● FCI1[aver], FCI2[aver], FCI3[aver]
● S[max aver]
● S1[max], S2[max], S3[max], S[max]
The maxima listed above are developed according to the
following algorithm:
The maxima listed above are developed according to the
following algorithm:
If
( X [1s] > X [max])
Then ( X [max] = X [1s ])
If
with X = Uab, IL, F or S
( X [moy] > X [max moy])
Then ( X [max moy ] = X [ moy ])
25.25.2 Maxima (B)
ab=12, 23 or 31 L = 1, 2 or 3.
25.24.2 Maxima (B)
The products also calculate the maxima of “at the
second’’ variables in the two quadrants corresponding to
receiver mode. These maxima are the following
● P1R[max], P2R[max], P3R[max], PR[max]
● Q1R[max], Q2R[max], Q3R[max], QR[max]
The maxima listed above are developed according to the
following algorithm
( X [1s] > XR[max]) AND (P[1s] ≥ 0)
Then ( XR[max] = X [1s ]) with X = P or Q.
If
25.24.3 Maxima (C)
The products also calculate the maxima of “at the
second’’ variables in the two quadrants corresponding to
generator mode. These maxima are the following:
● P1G[max], P2G[max], P3G[max], PG[max],
● Q1G[max], Q2G[max], Q3G[max], QG[max]
The maxima listed above are developed according to the
following algorithm:
( X [1s] > XG[max]) AND (P[1s] < 0)
Then ( XG[max] = X [1s ]) with X = P or Q.
The products also calculate the maxima of average
variables in the two quadrants corresponding to the
receiver mode. These maxima are the following:
● PR[max aver], QR[max aver],
● FPR[max aver], cos(ϕg)R[max aver]
The maxima listed above are developed according to the
following algorithm:
( X [moy] > XR[max moy]) AND (P[moy] ≥ 0)
Then ( XR[max moy ] = X [ moy ])
If
25.25.3 Maxima (C)
The products also calculate the maxima of average
variables in the two quadrants corresponding to generator
mode. These maxima are the following:
● PG[max aver], QG[max aver],
● FPG[max], cos(ϕg)G[max]
The maxima listed above are developed according to the
following algorithm:
( X [moy] > XG[max moy]) AND (P[moy] < 0)
Then ( XG[max moy ] = X [ moy ]) .
If
If
25.25 Maxima of average
variables
25.25.1 Maxima (A)
The products calculate the maxima of average variables
in the four quadrants. These maxima are the following:
● V1[max aver], V2[max aver], V3[max aver]
ENERIUM Measure Station
93
ENERIUM Measure Station
94
26. INDEX
%, 26
3/4 wire
By default, 47
Configuration, 47
A, 26
Abbreviations, 26
Activation
Global alarm, 40
Active energy, 26
Active Energy EP-, 34
Active Energy EP+, 33
Active power
Mathematical formulas, 87
Active power, 26
Address
ENERIUM, 74
ModBus, 37
Addresse
By default, 47
Alarm
Synchronization, 57
Alarms
Characteristics, 80
Icon, 25
Number, 39
Relays, 39
Resetting, 40
Screen, 39
Status, 39
Analog cards
Connection, 67
Analog outputs
Affected values, 20
Blocking, 20
Card, 20
Min/max values, 20
Output definition, 20
unblocking, 20
Analog Outputs
Characteristics, 80
Apparent energy, 26
Apparent energy I/O-, 34
Apparent energy I/O+, 34
Apparent power, 26
Apparent power, 26
Apparent Power
Mathematical formulas, 88
ASCII, 46
Automatic scrolling
Icon, 16, 26
Auxiliary source
Connection, 68
Terminal, 19, 20
ENERIUM Measure station
Auxiliary supply source
Characteristics, 82
Average current, 26
Average power, 30
Average variable
Mathematical formulas, 91
Backlighting, 15
Balanced three-phase, 64
Blocking
Analog outputs, 20
Pulse, 21
Breakdown, 8
By default
3/4 wire, 47
Contrast, 47
Display, 47
Electrical network, 47
Ethernet Communication, 47
Language, 47
Password, 47
Scrolling
TC primary, 47
TC secondary, 47
Time, 47
TP primary, 47
TP Secondary, 47
Cable
RS485, 65
Cables
Dimension, 63
Cabling (test), 26
Cabling test, 26
Calcul of minima
Mathematical formulas, 92
Calculation of maxima
Mathematical formulas, 92
Capacitive network
Icon, 16, 26
Caracteristics
Table, 14
Card
Analog outputs, 20
Input/Output, 37
On/Off input/output, 21
On/Off inputs, 21
On/Off outputs, 20
CEI 61010-1, 8
Characteristics
Alarms, 80
Analog outputs, 80
Auxiliary supply source, 82
Current inputs, 81
Display, 81
Electrical, 81
Ethernet, 82
Information retention, 82
Keys, 81
LCD, 81
Load curves, 80
Measurements, 79
Mechanical, 84
Metrology, 83
On/Off I/O card, 83
On/Off input card, 82
On/Off output card, 83
Optical interface, 82
Output analog card, 82
Recording curves, 80
RS485, 81
Voltage inputs, 81
Cleaning, 8
Command word
LCD, 15
Communication
Card, 37
Local or remote, 73
Remote, 73
Communication ongoing
Icon, 16
Communication RS 485
By default, 47
Communication speed, 74
Configuration
3/4 wire, 47
Change, 55
Default values, 47
Icon, 25
Password, 45
Remote communication, 43
Screen, 43
TC primary, 46
TC secondary, 47
TP Primary, 46
TP secondary, 46
Configuration change, 55
Connection
Analog cards, 67
Auxiliary source, 68
Cards E/S, 67
Ethernet, 66
On/Off I/O cards, 68
On/Off input cards, 67
Output cards, 67
RS485, 65
Contrast
Adjust level, 45
95
By default, 47
Dsiplay, 45
Contrast LCD, 15
Contrast level
Adjust, 45
Copyright, 9
Cos(ϕ)
Mathematical formulas, 88
Current, 30
Fresnel, 52
Harmonics, 50
Mathematical formulas, 87
Transformer, 46
Current input
Terminal, 19
Current inputs
Characteristics, 81
Connections, 63
Terminal, 19
Currents
Display rule, 31
Fresnel, 52
Gauges, 52
Cursor
Move, 17
Customized screens
Icon, 25
Screen, 41
Cutting, 61
Date
Display, 38
Synchronization, 57
Default values
Configuration, 47
Delivery
default values, 47
DHCP, 74
Dimensions, 13
DIN 43700, 13
Display
By default, 47
Characteristics, 81
Contrast, 45
Language, 45
Password, 45
Remote communication, 45
Scrolling, 45
Time, 45
Display rule
Currents, 31
Energies, 35
Frequency, 32
Harmonics, 32
Power, 32
Power factor, 32
Time meter, 32
Voltages, 31
Distributed (neutral), 47
E.set, 73
E.view, 73
Electric variables, 26
Electrical connection, 63
Electrical network
3/4 wire, 47
By default, 47
Remote communication, 46
TC primary, 46
ENERIUM Measure Station
TC secondary, 47
Electrical parasites, 63
Elementary alarm
Global alarm, 40
Statuts, 40
End of life, 9
Energies
Display rules, 35
Energy
Icon, 25
Screen, 33
Energy and metering
Mathematical formulas, 90
ENERIUM
Accessories, 85
Address, 74
Cuting, 61
Electrical connection, 63
Fixation tableau, 61
Maintenance, 75
Mechanical assembly, 61
Mechanical characteristics, 84
Number, 37
Technical characteristics, 77
Type, 37
Use, 69
ENERIUM 150, 13
ENERIUM 150
Comparison, 14
ENERIUM 50, 13
ENERIUM 50
Comparison, 14
Equation
Global alarm, 40
Ethernet
Address by default, 47
Characteristics, 82
Connection, 66
Gateway, 45
Gateway by defaumt, 47
IP Address, 44
LED, 67
Mask, 44
Mask by default, 47
Remote communication, 44, 74
Terminal, 19, 22
Ethernet Communication
By default, 47
Face
Front, 15
Format, 13
FP, 26
French
Language, 45
Frequency, 26
Display rule, 32
Mathematical formulas, 89
Fresnel 3I, 52
Fresnel 3U, 51
Fresnel 3V, 51
Fresnel and gauges
Icon, 25
Screen, 51
Front
Face, 15
Full duplex, 74
Fuse
Protection, 68
Gateway
By default, 47
Remote communication, 45
Gauges 3I, 52
Gauges 3P, 53
Gauges 3U, 52
Gauges 3V, 52
Generator network
Icon, 16, 26
German
Language, 45
Global alarm
Activation, 40
Blinking, 40
Elementary alarm, 40
Equation, 40
Icon, 16, 26
Relays, 40
Screen, 40
Status, 40
Ground voltage
Fresnel, 51
Mathematical formulas, 87
Guarantee, 9
Half duplex, 73, 74
Harmonic distortion rate, 26
Harmonic rate, 26
Harmonics
Current, 31
Display rules, 32
Icon, 25
Mathematical formulas, 89
Percentage, 49
Ph-Ph voltage, 31
Ranges, 49
Rates, 49
Screen, 49
THD, 49
Harmonics I, 50
Harmonics rate
Mathematical formulas, 89
Harmonics U, 49
Harmonics V, 49
Home screen, 16
Hour, 38
Display, 38
How to, 71
Hub, 66
Hxx Ia, 26
Hxx Uab, 26
Hz, 26
I
Harmonics, 50
Icons
Alarms, 25
Automatic scrolling, 16, 26
Capacitive network, 16, 26
Communication ongoing, 16
Configuration, 25
Customized screens, 25
Energy, 25
Fresnel and gauges, 25
Generator network, 16, 26
Global alarm, 16, 26
Harmonics, 25
Inductive network, 16, 26
96
Measure, 25
Ongoing communication, 26
Phase order, 26
Phase order, 16
Services, 25
In, 26
In load, 38
Indicators
Recording curves, 58
Inductive network
Icon, 16, 26
Information
Retention duration, 82
Information retention
Characteristics, 82
Installation, 59
Cleaning, 8
Instructions, 8
Installation Category, 8
Instantaneous current, 26
Instantaneous ground voltage, 49
Integration time, 55
IP address
Remote communication, 44
IP address
By default, 47
Italian
Language, 45
Ix, 26
JBus
Address, 44
Key
navigation, 17
OK, 17
Keys
Characteristics, 81
kVAh, 26
kVARh, 26
kWh, 26
Language
By default, 47
Display, 45
French, Italian, German,
Spanish, 45
LCD, 15
Backlighting, 15
Blinking, 40
Characteristics, 81
Command word, 15
Contrast, 15
Stop blinking, 40
LCD screen, 15
LCD Screen, 15
LED Ethernet, 67
Line voltage
Fresnel, 52
Line voltages
Mathematical formulas, 87
Load curves
Screen, 55
Local communication
Optical interface, 73
Loss of synchronization, 55
Maintenance
ENERIUM, 75
Management
On/Off inputs, 21
ENERIUM Measure Station
On/Off outputs, 21
Manumesure, 75
Mask
By default, 47
Remote Communication, 44
Mathematical formulas
Apparent Power, 88
Energy and metering, 90
Frequency, 89
Harmonics rate, 89
Line voltages, 87
Maxima of variables, 93
Peak factor, 89
Phase order, 90
Power factor, 88
Reactive power, 88
Unbalance, 90
Mathematical formulas
Ground voltage, 87
Mathematical formulas
Current, 87
Mathematical formulas
Active power, 87
Mathematical formulas
Transit direction of powers, 88
Mathematical formulas
Cos(ϕ), 88
Mathematical formulas
Tan(ϕ), 89
Mathematical formulas
Harmonics, 89
Mathematical formulas
Time meter, 91
Mathematical formulas
Average variable, 91
Mathematical formulas
Calculation of minima, 92
Mathematical formulas
Minima of variables, 92
Mathematical formulas
Calculation of maxima, 92
Mathematical formulas
Maxima of average variables, 93
Maxima of average variables
Mathematical formulas, 93
Maxima of variables
Mathematical formulas, 93
Maximum average current, 30
Measured variables, 87
Measurements
Screen, 29
Measures
Icon, 25
Mecchanical assembly, 61
Mechanical
Characteristics, 84
Menu
Main, 15, 25
Move, 17
Menus
Synoptic, 26
Mesurements
Characteristics, 79
Meters
Active energy, 33
Apparent energy, 34
Initialize, 21
Reactive energy, 34
Metrology
Characteristics, 83
Minima of variables
Mathematical formulas, 92
ModBus/RTU, 73
Mono-phase, 65
Move
Cursor, 17
Menu, 17
MVAh, 26
MVARh, 26
MWh, 26
Navigation
Key, 17
Navigation key, 15
Neutral
Distributed, 47
Non-distributed, 47
Neutral current, 26
Non-distributed (neutral), 47
Number ENERIUM, 37
oad curves
Characteristics, 80
OK, 15
Key, 17
OK key, 15
On/Off I/O card
Characteristics, 83
On/Off I/O cards
Connection, 68
On/Off input
Synchronization, 57
On/Off input card
Characteristics, 82
On/Off input cards
Connection, 67
On/Off input/output
Card, 21
On/Off inputs
Card, 21
Management, 21
Pulse mode, 21
Synchronization mode, 21
On/Off output card
Characteristics, 83
On/Off output cards
Connection, 67
On/Off outputs
Card, 20
On/Off outputs
Alarm mode, 21
On/Off outputs
Max/min threshold, 21
On/Off outputs
Pulsed mode, 21
On/Off outputs
Mode Associate output, 21
On/Off outputs
Relays, 21
On/Off outputs
Management, 21
Ongoing communication
Icon, 26
Operating procedure, 71
Operating time, 38
Operators’ safety, 8
97
Optical
Cable, 17
Interface, 16
Optical cable, 17
optical interface
Local communication, 73
Optical interface, 15, 16
Characteristics, 82
Optional card
Terminal, 19, 20
Output
Associate On/Off outputs, 21
Output analog card
Characteristics, 82
P, 26
Packaging, 10
Par default
Communication RS 485, 47
Parity
By default, 47
Remote communication, 44
Password
0000, 46
By default, 47
Configuration, 45
Display, 45
Time lag, 46
Peak factor
Mathematical formulas, 89
Percentages of harmonics, 49
Period
Recording curves, 57
Phase order
Mathematical formulas, 90
Phase order
Icon, 16, 26
Phase shift
Fresnel (gound current), 52
Fresnel (ground voltage), 51
Fresnel (line voltage), 52
Ph-N voltage, 29
Ph-Ph Voltage, 29
Pmoy, 26
Polarity
Supply, 68
Power, 30
Display rule, 32
Power factor
Mathematical formulas, 88
Power factor, 26
Display rule, 32
Powers
Gauges, 53
Presence network, 38
Presentation, 13
Product information, 37
Property rights, 9
Protection
Electrical parasites, 63
Fuse, 68
Voltage inputs, 63
Pulse
Blocking, 21
On/Off inputs, 21
Tally, 21
Weight, 21
Width, 21
ENERIUM Measure Station
Pulsed mode
Associate output, 21
On/Off outputs, 21
Tally, 21
Q, 26
Ranges of harmonics, 49
Rates of harmonics, 49
RAZ
Status word for alarms, 40
Reactive energy, 26
Reactive Energy EQ, 34
Reactive power
Mathematical formulas, 88
Reactive power, 26
Real composed voltage, 26
Real RMS voltage, 26
Recorded variables, 57
Recording
Depth, 55, 57
Recording curves
Characteristics, 80
Continuous mode, 57
Filling rate, 58
Indicators, 58
Mode buffer stop, 57
Mode with immediate stop, 58
Mode with stop centered 25, 58
Mode with stop centered 50, 58
Operating modes, 57
Period, 57
Screen, 57
Recording period, 57
Registered trademarks, 9
Relays
Alarm (associated), 39
Global alarm, 40
On/Off outputs, 21
Remote communication
Display, 45
Electrical network, 46
Ethernet, 44, 74
Gateway, 45
IP address, 44
JBus address, 44
Mask, 44
Parity, 44
Reversal, 44
RS 485, 43
RS485, 73
Speed, 44
Remote Communication
Configuration, 43
Stop bit, 44
Resetting
Alarms, 40
Resistance
Polarization, 66
Reversal
By default, 47
Remote communication, 44
RJ 45, 66
RS 485
Addresse by default, 47
JBus Address, 44
Parity, 44
Parity by default, 47
Remote communication, 43
Reversal, 44
Reversal by default, 47
Speed, 44
Speed by default, 47
Stop bit, 44
Stop bit by default, 47
RS232, 66
RS485, 37
Characteristics, 81
Connection, 65
Output, 65
Polarization resistance, 66
Remote communication, 73
Terminal, 19, 21
Transmission format, 74
S, 26
Safety, 8
Screen
Alarms, 39
Configuration, 43
Customized screens, 41
Energy, 33
Fresnel and gauges, 51
Global alarm, 40
Harmonics, 49
Home, 25
Load curves, 55
Measurements, 29
Recording curves, 57
Resetting alarms, 40
Services, 37
Screen number
Read, 16
Scrolling
Automatic, 45
By default, 47
Display, 45
Services
Icon, 25
Screen, 37
Shielded twisted cable, 66
Simple voltage, 26
Smoy, 26
Spanish
Language, 45
Speed
By default, 47
Remote communication, 44
Status
Global alarm, 40
Status word for alarms, 40
Stop bit
By default, 47
Remote communication, 44
Supply
Alternative, 20
Continuous, 20
High level, 20, 68
Low level, 20, 68
Polarity, 68
Switch, 66
Synchronization
Loss, 55
Modes, 57
On alarm, 57
On date, 57
On On/Off input, 57
98
dition 08/2007 Code : MS0-7385
On/Off inputs, 21
Return, 55
Types, 57
Synchronization return, 55
Synoptic of menus, 26
Table characteristics, 14
Tan(ϕ)
Mathematical formulas, 89
TC primary
By default, 47
Configuration, 46
TC secondary
By default, 47
TC secondary
Configuration, 47
Technical Characteristics, 77
Terminal
Auxiliary source, 19
Auxiliary Source, 20
Current input, 19
Current inputs, 19
Ethernet, 19, 22
Optional card, 19, 20
RS485, 19, 21
Voltage input, 19
Terminals
Types, 63
THD, 49
Current, 31
Ph-Ph voltage, 30
THD Ix, 26
Time
By default, 47
Display, 45
ENERIUM Measure Station
Time meter
Mathematical formulas, 91
Time meter
In load, 38
Information display, 38
Network presence, 38
Operating time, 38
TP primary
By default, 47
Configuration, 46
Electrical network
TP Primary
Configuration, 46
TP secondary
By default, 47
Configuration, 46
TP Secondary
Electrical network, 46
Transfer
PC-ENERIUM, 22
Transformer
Voltage, 46
Transit direction of powers
Mathematical formulas, 88
Transmission format
RS485, 74
Twiested cable torsadé, 65
Type ENERIUM:, 37
U
Harmonics, 49
unbalance, 52
Unbalance
Mathematical formulas, 90
Unbalance rate, 52
Unbalanced three-phase, 63, 64,
65
Unblocking
Analog outputs, 20
Units, 26
Use, 69
V, 26
Harmonics, 49
VA, 26
VAR, 26
Voltage, 26
Voltage input
Terminal, 19
Voltage inputs
Characteristics, 81
Connections, 63
Protection, 63
Voltage U
Harmonics, 49
Voltage V
Harmonics, 49
Voltages
Display rule, 31
Time meter, 32
Voltages U
Gauges, 51, 52
Voltages V
Gauges, 51, 52
W, 26
Weight
Pulse, 21
Width
Pulse, 21
99