1
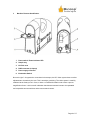
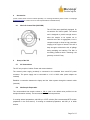
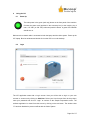
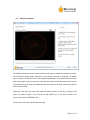
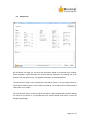
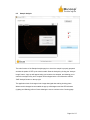
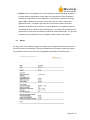
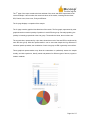
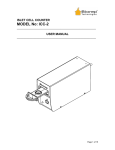
ISLET CELL COUNTER 3 ICC3 ______________________________________________________ USER MANUAL ____________________________________________________ Page 1 of 17 TABLE OF CONTENTS 1 GETTING STARTED .......................................................................................................................... 3 1.1 1.2 1.3 1.4 1.5 SYMBOLS USED IN THIS MANUAL ................................................................................................... 3 MACHINE INFORMATION ................................................................................................................. 3 CONTACT INFORMATION ................................................................................................................. 3 SAFETY INFORMATION .................................................................................................................... 4 PACKING LIST ................................................................................................................................. 4 2 INTRODUCTION ................................................................................................................................ 5 3 MACHINE FEATURES IDENTIFICATION ................................................................................... 6 4 ACCESSORIES .................................................................................................................................... 7 4.1 5 SET-UP OF THE ICC .......................................................................................................................... 7 5.1 5.2 5.3 6 ISLET CELL COUNTER DISH (ICC-DISH) ........................................................................................ 7 ICC CONNECTIONS .......................................................................................................................... 7 ISLET SAMPLE PREPARATION .......................................................................................................... 7 SAMPLE STAINING ........................................................................................................................... 9 USING THE ICC .................................................................................................................................10 6.1 POWER UP ......................................................................................................................................10 6.2 LOGIN .............................................................................................................................................10 6.3 SAMPLE PREPARATION ...................................................................................................................11 6.4 SAMPLE INFO..................................................................................................................................12 6.5 SAMPLE ANALYSIS .........................................................................................................................13 The main function of the Sample Analysis page is to check the sample is properly prepared and that the uptake of DTZ by the islets is stable. Start the Analysis by clicking the “Analyze Image” button. A pop up will appear letting you know the time elapsed, and allowing you to cancel the analysis at any time. Analysis can be skipped at the user’s discretion with the “SKIP Analysis” button on the top right. ......................................................................................................................................................13 The application looks for changes in the image that signal that staining is taking place. Whenever this changes become stable the pop up will disappear and the LED indicators (Lighting and Staining) will turn Green allowing the user to continue to the Counting page. ...........................................................13 6.6 COUNTING ......................................................................................................................................14 6.7 REPORT ..........................................................................................................................................15 7 CUSTOMER SERVICE .....................................................................................................................17 Page 2 of 17 1 Getting Started WARNING: Please, read this section before unpacking, installing or operating this machine. 1.1 Symbols Used in this Manual The lightning flash with arrowhead symbol, within an equilateral triangle, is intended to alert the user to the presence of dangerous voltage within the machine’s enclosure that may be of sufficient magnitude to constitute a risk of electric shock. The exclamation point within an equilateral triangle is intended to alert the user to the presence of important information in the literature that accompanies the device. 1.2 Machine Information In the spaces provided below, record the Model and Serial No. located on the bottom of your machine. Model No. __________________ Serial No.______________________ RETAIN THIS INFORMATION FOR FUTURE REFERENCE. 1.3 Contact Information Biorep Technologies, Inc. th 3225 NW 112 Street Miami, FL 33167 [email protected] www.biorep.com Tel: 305-687-8074 Fax: 305-688-8029 Page 3 of 17 1.4 Safety Information WARNING: DO NOT SKIP READING THIS SECTION. PLEASE READ AND OBSERVE ALL WARNINGS AND INSTRUCTIONS GIVEN IN THIS USER’S MANUAL AND THOSE MARKED ON THE UNIT. RETAIN THIS BOOKLET FOR FUTURE REFERENCE. DO NOT REMOVE THE MACHINE’S COVER OR YOU MAY BE EXPOSED TO DANGEROUS VOLTAGE. REFER SERVICING TO QUALIFIED PERSONNEL ONLY. TO REDUCE THE RISK OF FIRE OR ELECTRIC SHOCK, DO NOT EXPOSE THIS DEVICE TO WATER OR MOISTURE. READ AND FOLLOW THESE INSTRUCTIONS: 1. Keep these instructions for future reference and heed all warnings stated in this manual. 2. Protect the power cord, the power entry module, and the plug from being walked on or pinched to avoid damage. 3. Refer all servicing of the machine to qualified personnel. Servicing is required when the apparatus has been damaged in any way. 1.5 Packing List The following items are included with the purchase of an Islet Counter: Qty 1 1 1 1 1 1 Reference ICC3 ICC3-LT TRD815WHT-3 LFS123000D-A8B ICC3-UM ICC-DISH Description Islet counter V3 vision system Islet counter Laptop (64bit) Category 5E Patch Cable, RJ45 / RJ45 Power Supply User Manual Islet Counter Dish pack (10) Table 1: Packing List Page 4 of 17 2 Introduction This User Manual is intended to be used by scientists, researchers, and technicians who have already been trained in islet isolation procedures and technologies. This document contains the necessary information for installing and operating the islet counter vision system and its software. The Islet Cell Counter (ICC) has been developed to assist in the quantification of islet samples taken from isolated preparations. The islet counter is a useful tool to determine yield in islet isolations, or to quantify islet samples used for Perifusion experiments. The islet counter was created to address the two main limitations of human counting: Speed and variability. Leveraging on machine vision technologies, the ICC can perform counts and generate a report in minutes including IEQ, area cover and purity. Trained human counters require several minutes to perform accurate counts and calculate and fill the required metrics for documentation. In addition, it is known that despite standardization efforts, islet counts can vary dramatically from one human counter to the other. The adoption of machine vision technologies, reduces variability, and ensures that the same counting method is used every time. An ICC in your lab will count with the same method as any other ICC out there, making results more comparable across research centers and hopefully more significant. Other software based cell counting technologies require training and rely significantly on user experience and input to perform accurate counts; therefore they are also subject to user judgment and variability. Furthermore, these software packages are independent of imaging hardware (such as microscopes, illumination and cameras), creating additional sources of variability. The ICC is a self contained machine vision system, that includes both hardware and software designed specifically for islet counting. This ensures that magnification, field of view, illumination, focus, and other optical variables are constant, making the measurements repeatable and reliable. The ICC software is powerful, yet its user interface is minimalist by design to facilitate an intuitive workflow. Ease of use was a top priority when developing the ICC3 software, which will guide the new user in a step by step “wizard” so that every islet sample is optimally quantified. Page 5 of 17 3 Machine Features Identification 1. Power switch / Power indicator LED 2. Sample tray 3. ICC Dish nest 4. RJ45 connector (to laptop) 5. Power supply connector 6. Illumination Switch Not much right?...As opposed to conventional microscopes, the ICC Vision system does not allow adjustments to be made by the user. This is actually a good thing. The vision system is carefully calibrated at the factory to be in focus, to have a consistent illumination and to have a pre-set magnification factor. It is this careful calibration that allows automated counts to be repeatable and comparable across machines and across research centers. Page 6 of 17 4 Accessories (Some of these items must be ordered separately. For ordering information please consult our webpage www.biorep.com or contact one of our sales representatives at 305-687-8074.) 4.1 Islet Cell Counter Dish (ICC-DISH) The ICC-Dish was specifically designed for use with the ICC vision system. The central well is designed to provide enough area to allow the sample to be spread out to minimize errors due to aggregation, but it is compact enough to allow for high resolution imaging of the region of interest. The well is deep enough to minimize the risk of spillage during sampling and staining. The dish is accurately positioned with a matching nest geometry on the ICC tray. 5 Set-up of the ICC 5.1 ICC Connections The ICC only requires 2 cables: Power and communications. The external power supply (included) is connected to the standard 2mm round DC power connector. The power supply can be connected to a 110 or 220V outlet (outlet adapter not included) Establish a connection between the laptop and the vision system through the network cable (included). 5.2 Islet Sample Preparation The recommended islet sample volume is 100 µL (this is the default value pre-filled on the sample information section). For best results follow these best practices: If counting stained preparations, add 250 µL of DTZ solution (See recommended DTZ solution preparation in the next section). If counting an unstained preparation, add 250 µL of buffer solution. Page 7 of 17 The bottom of the dish must be completely covered in fluid. Partial fluid coverage creates shadows at droplet boundaries that cause artifacts that affect detection and count performance. The background of the image should be as a uniform as possible. A fill volume between 350 and 400 µL is recommended to ensure the dish surface is completely covered. Some slight leveling of the ICC-dish might be required to distribute the fluid uniformly. Do not overfill the dish. Overfilling above 500 µL may have adverse effects on the illumination and the count accuracy. Avoid air bubbles in the dish. Large air bubbles cause similar problems to those of partial fluid coverage. Small bubbles might cause localized errors and may even result in false positives. The cell mass should be spread out as evenly as possible in the dish, but away from the edges. Agglomeration makes software segmentation harder and the results less reliable. Cells close to the edges may be omitted since a small margin close to the edge of the dish is excluded to minimize the risk of artifact. Gently shaking the dish, side to side in one direction, helps spread the cells on the dish. Swirling the dish in a small circle usually has the opposite effect and will tend to agglomerate the cells in the middle of the dish. Use these two techniques to achieve a good spread within the region of interest (ROI). Page 8 of 17 5.3 Sample Staining Staining the sample with dithizone (DTZ) drastically improves the count accuracy by enhancing contrast between acinar tissue and islets. As with any other parameter concerning machine vision, repeatability is the key factor. Staining with DTZ has to be done in a repeatable and controlled fashion. For best results, the DTZ formulation/composition, the amount of DTZ added to the dish, and the uptake time allowed for the islets to pick up the stain need to be consistent. We recommend the following best practices: Dithizone (DTZ) Solution Recipe a. Dissolve 100 mg Dithizone in 20 ml Dimethyl sulfoxide (DMSO) and mix b. Add 30 ml HBSS c. Filter using a 0.2 or 0.4 m bottle top filter d. Add 50 ml HBSS e. Label appropriately and use on the day of preparation f. Store at room temperature (20-28°C). Uptake time should be at least 8 minutes before performing a count. The value of the count may change as the cells get stained. The Sample Analysis section of the software (see section 6.5) monitors the stain uptake and will notify the user when the staining is stable. Page 9 of 17 6 Using the ICC 6.1 Power Up The main power is the green (and only) button on the front panel of the machine. Connect the power cord (provided in the accessory box) to the module, plug it into a 115 VAC (or 230 VAC) outlet and push the button. A green LED indicator should turn on. Make sure the network cable is connected to both the laptop and the vision system. Power up the ICC laptop. Boot into windows and double click on the ICC icon on the desktop. 6.2 Login The ICC application starts with a Log-in screen. Here you will be able to log-in to your user account or create one by clicking on Add User. Select your User Account from the drop down, enter your password and click on “Login” to continue to the Sample Preparation screen. The software application is closed from this screen by clicking on the red button. The window close “X” has been disabled to prevent conflicts with the Vision System. Page 10 of 17 6.3 Sample Preparation The Sample Preparation screen includes a step by step guide to prepare the sample for counting. The instructions change slightly depending if your sample is stained or unstained. The default mode is stained. Uncheck the box to count unstained preparations. The GUI provides a live video feed of the sample so you can check the cell distribution within the ROI. Remember that you want to spread the tissue as much as possible within the boundaries of the ROI; only the cells within it will be counted. Press Selecting on the loupe icon above the image will enable zooming. Zoom in by clicking on the region you want to explore. You can zoom out with SHIFT+click. If you wish to return to full screen view, press the CENTER button. Press “Next” to continue to the Sample Info page. Page 11 of 17 6.4 Sample Info On the Sample Info page you can enter the information related to the sample being counted. Donor information, organ information can be filled with the keyboard or by selecting one of the choices in the drop-down menus. The Operator information is automatically filled. The last column of fields on the right pertain to the Dilution Factor. It is very important that you check that the dilution factor is correct before proceeding. The machine has a default setting of 1000 (100uL out of 100ml). The “Skip Analysis” button on the top right is used when counting samples that have been stained for more than 10 minutes. If your sample has been recently stained press “Next” to enter the Sample Analysis page. Page 12 of 17 6.5 Sample Analysis The main function of the Sample Analysis page is to check the sample is properly prepared and that the uptake of DTZ by the islets is stable. Start the Analysis by clicking the “Analyze Image” button. A pop up will appear letting you know the time elapsed, and allowing you to cancel the analysis at any time. Analysis can be skipped at the user’s discretion with the “SKIP Analysis” button on the top right. The application looks for changes in the image that signal that staining is taking place. Whenever this changes become stable the pop up will disappear and the LED indicators (Lighting and Staining) will turn Green allowing the user to continue to the Counting page. Page 13 of 17 6.6 Counting At this point the sample is ready to be counted. Press “Count Islets” to generate a count. When the count is complete a pop-up will display the path where an automatic report has been saved with all the related information (see section X.X). The count results displayed are the following: DILUTION FACTOR is displayed as calculated from the information fields on the Sample Info page. # OF PARTICLES displays the approximate number of individual islets present in the dish, without taking their size into consideration IEQ displays the total islet equivalent in the preparation as calculated from the sample contents and the dilution factor. AREA provides the islet area cover in millimeters squared. This is thought to provide a very consistent metric of islet quantity, which is not subject to size weightings like IEQ, and is less sensitive to cell aggregation. PURITY provides a ratio between the area covered by islets and the total area covered by tissue in the sample (Only available in STAINED mode) Page 14 of 17 B-factor. One of the challenges of accurate counting is related to sampling variability. It is known that the predominance of large islets in a preparation can lead to significant variability of counts within the same preparation. The presence or absence of a single large(> 400µm diameter) islet cell can vary the IEQ count of a 100 uL sample by a significant amount . The B-factor gives the user an idea of the impact of islets size distribution in the IEQ result. A B-factor of 1 means that there is no significant impact of size distribution. As the B-factor gets increases above 1, it signals that large particles are predominant. If small islets are prevalent, the B-factor will be smaller than 1. It is up to the researcher to use and determine any acceptance criteria based on the B-factor. 6.7 Report For every count, a full resolution image of the sample and a comprehensive report are saved in the ICC3 file folder on the desktop. The report contains all the information, results and relevant count statistics of the count as well as some graphical presentations of the IEQ results. Page 15 of 17 st The1 page of the report contains the time and date of the count and all the data related to the user and sample. It also contains the numerical values of the results, including Dilution factor, IEQ, Particle count, Area cover, Purity and B-factor nd The 2 page displays a snapshot of the sample. rd The 3 page contains graphical visualizations of the results. The first graph, represented by a bar graph shows the numerical quantity of particles in each IEQ size group. Generally speaking, the quantity is inversely proportional to the size group. The smaller the islets, the more there are. The second chart, represented by a pie chart, shows how much of the total IEQ is contributed by each IEQ size group. With this representation it can be seen that despite the big difference in numerical particle quantities, the contribution of each size group to IEQ is generally more uniform. These graphical representations may allow the researchers to qualitatively assess the sample visually, and with experience, identify trends and patterns for different types of donors, organs or isolation methods. Page 16 of 17 7 Customer Service If you encounter any problems, please contact customer support at: Biorep Technologies, Inc. 3225 NW 112th Street Miami, FL 33167 [email protected] www.biorep.com Tel: 305-687-8074 Fax: 305-688-8029 Page 17 of 17