1
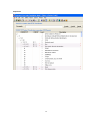
 East Africa Regional Technical Assistance Center
UPLOADING EXCEL WORKBOOK INTO THE PRICE INDEXES
PROCESSOR:
Field Manual #3
Compiled by:
Mr. Iddi H. Makame
Selected Acronyms
Ccode
Country Code found in the SPD table
COICOP
Classification of Individual Consumption by Purpose
CNote
Product note explaining the product found in the SPD table
Ctitle
Title of product based on COICOP found in the SPD table
Digit
Level of COICOP detail
ID
Product Identification found in the SPD table
IsActive
The Variety is Active found in the SPD table
HBS
Household Budget Survey
Ocode
OECD Product Code found in the SPD table
Otitle
OECD Classification Title found in the SPD table
Onote
OECD Product note explaining the product
PIPS
Price Index Processor Software
PPS
Point of Purchase Survey
SN
Serial Number assigned to each product and variety
SPD
Structured Product Description
Stitle
SPD title for products
tblCPSPD
Microsoft Access table used to customize country’s products
tblCountryVCode
A Dictionary used to create and define local products
ii
VParent
Product defined in Microsoft Access table
VCode
Variety Code defined in Microsoft Access table
VDesc
Variety Description defined in Microsoft Access table
iii
FOREWORD
This manual is the outcome of a joint effort by the Office of the Chief Government Statistician (OCGS), Zanzibar,
and East AFRITAC to produce a user’s manual for compiling the Consumer Price Index (CPI). The fundamental
features and contents presented in this manual aim at strengthening the compilation of the CPI by using a
system, known as the Price Index Processing Software (PIPS).
This compilation software is essential for producing CPI estimates. Experience shows that every country within
the region has its own CPI compilation program and mainly uses Microsoft Excel. Using the PIPS is an
operational step for the CPI harmonization in the region.
The Office of the Chief Government Statistician has worked closely with East AFRITAC to develop a simple
user’s manual for uploading Excel workbooks into the PIPS. The purpose of this manual is to help East African
countries that intend to use the PIPS for compiling their CPI. Thus, I am pleased to introduce this Field Manual,
prepared with assistance from the East AFRITAC Statistics Advisor, Dr. Shelley Winston.
Indeed, the success of this publication stems from a concerted effort and cooperation among staff members
from the Price Statistics Unit under the Economic Statistics Section of the OCGS, who piloted the PIPS for about
three years.
I would like to extend special thanks to the East AFRITAC Statistics Advisor for her encouraging role and great
contribution to this endeavour with technical support, advice and encouragement.
Mohammed Hafidh Rajab
Chief the Government Statistician
Office of the Chief Government Statistician
Zanzibar
INQUIRIES
For further information
about this publication and related statistics, contact the
Chief Government Statistician
Office of the Chief Government Statistician
P.O. Box 2321
Zanzibar, United Republic of Tanzania
Phone +255 24 22 31 869
Fax + 255 24 22 31 742
Email : [email protected]
iv
PREAMBLE BY THE EAST AFRITAC COORDINATOR
After years of testing the IMF-developed Price Index Processor Software (PIPS), the Zanzibar Office of the Chief
Government Statistician (OCGS) decided to take the decisive step in 2010 to set up and use the PIPS for
calculating the CPI. To pass on the knowledge it has gained in this process, the OCGS, with guidance from East
AFRITAC, decided to document its experience by publishing this East AFRITAC field manual, with a view to
helping other CPI compilers in the East Africa region and elsewhere.
This field manual, “Uploading Excel Workbooks into the Price Index Processor,” aims to assist compilers who
have already saved and formatted their data in Excel for their CPI calculation and who would like to import
their data into the more robust PIPS. The PIPS is an application developed software, which simplifies sound CPI
estimation, analysis, and report generation. The PIPS also follows international best practices for calculating
CPIs. For example, the PIPS classifies the index according to the Classification of Individual Consumption by
Purpose (COICOP). It promotes regional, items, and outlets price index calculations. More importantly, the PIPS
estimates the indexes according to the Jevons (geometric mean) formula for the lower and higher lever indices.
I hope that the PIPS will contribute to promoting international and regional consistency and harmonization in
CPI methods, estimations, and calculations. Even for those statistical offices that do not use the PIPS, this
software will at least provide the templates and guidelines for producing and calculating accurate, credible,
reliable, and transparent CPIs.
I would like to thank the following for drafting this Manual. Mr. Iddi Makame, from the Zanzibar Office of the
Chief Government Statistician, who was the main author; Ms. Shelley Winston, East AFRITAC Statistics Advisor,
for overseeing and providing technical advice and for ensuring quality. I also would like to thank the region’s
statistics offices and the IMF Statistics Department for their valuable comments.
Mario de Zamaróczy
East AFRITAC Coordinator
v
Table of Contents
Selected Acronyms .................................................................................................................................................. ii
FOREWORD............................................................................................................................................................ iv
PREAMBLE BY THE EAST AFRITAC COORDINATOR ................................................................................................. v
Introduction .......................................................................................................................................................1
I.
UPLOADING EXCEL WORKBOOK INTO THE PRICE INDEX PROCESSOR…………………………………………………..2
1.1
Create New CPI Database ........................................................................................................................2
1.2
Area Description .......................................................................................................................................3
1.3.
Outlet Information ..........................................................................................................................4
1.4
Entering Weight...................................................................................................................................7
II. JOINING WORKSHEETS....................................................................................................................................10
III.
1.5
Appending worksheets ......................................................................................................................10
1.6
Adding product and variety to each outlet ........................................................................................14
1.7.
Entering Price Information............................................................................................................19
ITEM WEIGHT DETERMINATION AND DISTRIBUTION .................................................................................21
1.8.
Reviewing Item Weight Distribution .............................................................................................21
1.9.
Checking for Data Consistency......................................................................................................26
vi
Introduction
This Field Manual Uploading Excel Workbooks into the Price Index Processor tries to address the needs and to
provide assistance to countries that have tried or will try to use the Consumer Price Index Price (CPI) Processor
Software (PIPS). Therefore, this manual aims to provide easy to follow instructions for uploading already
created Excel workbooks and databases that are formatted with expenditure shares, CPI outlets, products,
varieties, and price information for uploading into the PIPS compilation system.
This manual, hence, is to be used purely as a guide to accompany the Consumer Price Index Compilation
System User Guide, (Price Index Processor Version II: Consumer Price Index, Revised Version, August 2009),
which provides in-depth details, definitions, and explanations. Additionally, this manual assumes that CPI
compilers are already familiar with the PIPS system.
This Field Manual was drafted with screen shots or “Snapshots” taken directly from the PIPS to facilitate ease
of understanding. There are three sections with sub-headings that proceed in a logical manner. Section I starts
by demonstrating how to create a new CPI database, how to enter the areas covered, how to add outlet
information, and how to enter weights. Section II describes how to append the worksheets created in Section I,
how to enter products and varieties for each outlet, and how to enter price information. Section III concludes
with reviewing item weight distribution and how to check for data consistency.
The Price Index Processor Software is developed by the International Monetary Fund and has authorized the United Nations
Economic Commission for Europe (UNECE) Statistics Division, with whom the IMF has no other affiliation, to distribute the
software. The IMF retains ownership rights to the original software. The IMF, the UNECE Statistics Division, and the East
Africa Regional Technical Assistance Center assumes no responsibility to users for support or maintenance and has
disclaimed all liability for any errors that may exist in the software and for any other claims relating to the software. The
PIPS was developed using standard Microsoft tools available to all users and only requires that users have licensed versions
of Microsoft Office Suite.
1
I.
UPLOADING EXCEL WORKBOOK INTO THE PRICE INDEX PROCESSOR
1.1
1.
Create New CPI Database
Open the PIPS Compiler. On the main window, click System Configuration .
Snapshot 1
2.
Write the name of the new CPI Database in Create New CPI Database field, change the weight dates.
The default imputation method can be set now or at any time when needed. The elementary formulae
can also be set at this time or later. When finished, click Create Access DB to create the database.
Then, click Cancel to return to the main window.
2
3.
If this message appears, it means that that database being created already exists, in that case, click
Cancel . Click the Set is as Default DB box in order for the system to always open the working
database. Click cancel to return to the main page.
1.2
4.
Area Description
From the main window, click Add New and then Add/Edit Area.
Snapshot 2
5.
Define the Area that will be covered in the CPI. This information will determine how many regions or
stratified indexes will be produced. For example, a country may cover and include urban, rural, lower
income, middle income, upper income areas..
3
Snapshot 3
Note, comparing the CPI
for an area to another
area index gives an
indication of difference
among the areas’ rates of
price change.
Such
comparisons
indicate
whether, over time, prices
of similar items that
consumers in one area
tend to buy have risen
more or less rapidly than
the prices of items that
consumers in another area
tend to buy.
These
comparisons DO NOT
indicate whether the
average level of prices in
an area is higher or lower
than the average level of prices in another area.
Click Save then Cancel to return to CPI Main Window.
1.3. Outlet Information
6.
Organize the CPI outlets information in a Microsoft Excel worksheet, as shown in Snapshot 4. This
worksheet is formatted exactly as the PIPS processor format.
4
Snapshot 4
7.
Once finished, on the PIPS main window click Add New then Batch Edit/Upload to upload the outlets
information. An Excel spreadsheet, shown in Snapshot 5, will open. The information from the Excel
spreadsheet created, Snapshot 4, can then be copied and pasted into the PIPS spreadsheet, Snapshot
5. Note, the columns include Outlet ID, Outlet Name, Area, Description, Area Compatible, and Outlet
Status. Keep in mind that Area refers to urban, rural, etc., depending on how the expenditure weights
were determined. Area Compatible refers to the name of the area provided in column D; For example,
Unguja is the name of the urban area shown in Snapshot 4.
5
Snapshot 5
8.
To save the outlets information into the PIPS compiler, select file menu and then save to CPI database
as shown in Snapshot 6.
Snapshot 6
9.
After saving to CPI Database, on file menu, click exit to return to the PIPS Main Menu. A message will
appear saying that the outlet information has been successfully saved.
To check that the outlet data have been uploaded correctly, click Edit , then the list of outlets will
appear. If correct, click Cancel.
6
1.4
Entering Weight
10. In an Excel spreadsheet, organize the CPI weight information, if possible, at level 7 of the Classification of
Individual Consumption by Purpose (COICOP) for which expenditure weights were determined. An
example is shown in Snapshot 7. Note, Total is equal to Rural plus Urban.
Snapshot 7
11.
or, go to the Utilities menu then select
Next, on the PIPS main window click
Item Weights Upload Template. Before clicking Generate , make sure level 7 is selected. Snapshot 8
will open.
7
Snapshot 8
12.
Remember to select level 7, and then click the Generate to create an Excel spreadsheet. Snapshot 9
will appear. From this spreadsheet, delete all the information except for the column headers.
8
Snapshot 9
13.
From the Excel spreadsheet created (step 10) copy and paste the information into the Excel PIPS
spreadsheet (step 12, Snapshot 9). Make sure all the information is entered in the correct columns.
14.
When finished, under the file menu, click Save to CPI database as shown in Snapshot 9, then click Exit.
To generate an Excel spreadsheet template for Weight upload click Cancel to return PIPS Main Menu.
15.
At this time, products per outlets have not yet been assigned. Therefore, do not distribute the item
weights when prompted in the PIPSVB Box; select NO.
9
II. JOINING WORKSHEETS
1.5
16.
Appending worksheets
To calculate the price index, prices are usually entered for each product at the variety level. Therefore,
an Excel spreadsheet should have been created that has variety/ies assigned to each product.
Varieties are usually found at level 8 of the COICOP hierarchal structure. For example, 11.01.11.1_01
is the level 7 for rice, and 11.01.11.1_01a, level 8 is one type of variety for rice (Snapshot 10).
Snapshot 10
17.
Create a spreadsheet in Excel (Snapshot 12) similar to the information shown in the Access table in
Snapshot 11. The columns should be named: VCode (the variety code), VParent (the product), VDesc
(the variety description), and IsActive (the variety is active).
10
Snapshot 11
18.
Remember, “IsActive” means that price information for this item variety is available. Save the
spreadsheet as CountryVariety.
11
Snapshot 12
19.
Next, use Microsoft Access to import “CountryVariety” from the created Excel speadsheet. Open the
CPI Access Database, which was the database created in Snapshot 1 (Default Database File Location,
and Default CPI Database, i.e., CPI.mdb). On file menu, click Get External Data, then import.
Snapshot 13
12
Snapshot 14
20.
From the import dialog box, in the files of type, select Microsoft Excel (*.xls). Select
CountryVariety.xls that should have been created and saved (Snapshot 14), then click import.
13
21.
Append the worksheet in the existing “tblCountryVCode.”
Snapshot 15
22.
1.6
23.
When finished, close Microsoft Access.
Adding product and variety to each outlet
The next step is to define in each outlet, the product/s and varieties. Note, there is no easy way to
import the varieties for each outlet, since the system is building relationships and integrity. That is, a
Serial Number (SN) is being assigned to each product and variety.
on the Main PIPS window, select the outlet of interest, right click on the
Click
outlet, and then click Edit Product.
14
Snapshot 16
15
Snapshot 17
24.
Click Add Product, and then click the icon to select the product. At this step, the COICOP Product Code
Table will open. Next, select the product for which there is at least a variety item for collecting a price.
16
Snapshot 18
17
25.
Snapshot 19 shows how to select the varieties. Remember that the varieties were appended to the
products (Snapshot 15). Therefore, the varieties are associated with the products.
Snapshot 19
26.
Once the products and varieties have been entered, click Cancel to select another outlet. Click Cancel
to return to PIPS main menu.
18
1.7.
27.
28.
Entering Price Information
At this point, all the outlets with their products and varieties should have been entered. Recall also
those weights for each product were also entered (Snapshot 7, paragraph 10. More importantly, the
price information (base price, previous price, and current price) for the varieties should also be
entered.
Before entering price information into the PIPS, make sure the Excel spreadsheet with price
information is organized according to at least, Outlet ID, Outlet Name, Variety Code, Description, base
price, previous price, and current price (Snapshot 20). Columns, B, E and G are very important.
Snapshot 20
29.
Next, to enter the price information into the system, go to Utilities in the PIPS and select Create Excel
for Update.
19
Snapshot 21
30.
Click Select All to upload all the outlets, then click Create Excel Sheet. Click on the icon to open the
Excel spreadsheet. In the Excel menu, go to tools, then protection, then Unprotect Sheet. To unprotect the
sheet, use password 123. For Microsoft Excel 2007, click on ‘Review” to unprotect the sheet.
Snapshot 22
20
31.
Once the spreadsheet is unprotected, go to Data from the Excel toolbar, and filter the data. Filter
column D (IsProd) False. All the varieties with their prices for each outlet should be listed. Copy from
the Excel spreadsheet already created (Snapshot 22) into the PIPS Excel spreadsheet, only the base,
previous and current period prices. Make certain the correct information is copied for each outlet and
variety.
32.
After entering the price information, click Save Back to CPI Database, then exit. For Microsoft Excel
2007, go to the “View” menu, click on the Macro drop down menu, then run the macro to upload the
data.
33.
At this point, all the information necessary to compile the CPI should have been entered: areas,
products and their weights, outlets, varieties, and prices.
III.
ITEM WEIGHT DETERMINATION AND DISTRIBUTION
1.8.
Reviewing Item Weight Distribution
34.
At this time, products per outlets have been assigned and the system needs to distribute the item
weights. Hence, Click Utilities in the PIPS menu, then Global Distribute Item Weights.
35.
To understand how the PIPS distributes the item weight, consider:
Snapshot 23 (Products)
a CPI basket that has three products (rice, beef and sugar) with total expenditure of 36,000 shillings,
Snapshot 23. Note, rice accounts for 50 percent, beef, 22.2 percent, and sugar 27.8 percent. For these
products, prices are collected from at least one of the three outlets (Shoppers 2001, 2002, 2003).
There are three different varieties of rice: grades 1, 2, and 3, and only one variety of beef and sugar
respectively. Therefore, Shoppers 2001 provides prices for grade 1 rice, beef, and sugar; Shoppers
2002 provides prices for grade 1 and 2 rice, and sugar; and Shoppers 2003 provides prices for grade 1,
2, and 3 rice only.
21
Table 1:
Shoppers 2001
Shoppers 2002
Shoppers 2003
Grade 1 rice
Grade 2 rice
Grade 1 rice
Beef
Grade 3 rice
Grade 2 rice
Sugar
Sugar
Grade 3 rice
Snapshot 24 (Outlets)
Snapshot 25 (Shoppers 2001 Assigned Weight)
22
36.
To determine how the weights are assigned to Shoppers 2001 (Snapshot 25) suppose the three
outlets, Shoppers 2001, 2002, and 2003 provide prices for three products
(rice, beef, and sugar) and all three outlets provide a price of 3,000 shillings for grade 1 variety rice.
Then, based on the allocation mentioned in paragraph 35, the PIPS assumes Shoppers 2002 and
Shoppers 2003 provide prices for grades 2 and 3 rice varieties, and Shoppers 2003 provides prices for
all three grades of rice. Furthermore, Shoppers 2001 is the only outlet that provides a price for beef;
hence it was allocated 8,000 shillings for beef. Shoppers 2001 and 2002 both provides price for sugar;
therefore each outlet was attributed a weight of 5,000 shilling. See Table 2.
Table 2:
Variety
Shoppers
2001
Shoppers
2002
Shoppers
2003
Rice Grade 1
3,000.00
3,000.00
3,000.00
3,000.00
3,000.00
Rice Grade 2
Rice Grade 3
37.
3,000.00
Beef
8,000.00
Sugar 1 Kg
5,000.00
Variety
Weight
18,000.00
8,000.00
5,000.00
10,000.00
As a result, the total OUTLET ASSIGNED WEIGHT for Shoppers 2001 is: 16,000 shillings.
23
Snapshot 26 (Shoppers 2002 Assigned Weight)
38.
The second outlet, Shoppers 2002, has a total weight of 11,000 shillings. Each variety of rice, grades 1
and 2 have been assigned 3,000 shillings each. Sugar was assigned shillings 5,000.
Snapshot 27 (Shoppers 2003 Assigned Weight)
39.
The last outlet, Shoppers 2003, was assigned a weight of 9,000 shillings, since the outlet provided
prices for all three varieties of rice.
24
Snapshot 28
40.
Snapshot 28 shows the shares of each outlet after the total weight for the basket has been
distributed. In summary (Table 3):
Table 3:
Variety
Shoppers
2001
Shoppers
2002
Shoppers
2003
Rice Grade 1
3,000.00
3,000.00
3,000.00
3,000.00
3,000.00
Rice Grade 2
Rice Grade 3
3,000.00
Beef
8,000.00
Sugar 1 Kg
5,000.00
5,000.00
Outlet Assigned Weight
16,000.00
11,000.00
Variety
Weight
18,000.00
8,000.00
25
10,000.00
9,000.00
36,000.00
1.9.
41.
Checking for Data Consistency
It is important to check the data for errors each time a change is made; therefore click Data Check on
the PIPS main menu.
Snapshot 29
42.
If there are errors, messages such as those displayed in Snapshot 29 will appear. Hence, the errors
have to be solved before compiling the index. If there are no errors, then the box stating “no error has
been found” will appear.
43.
When finished checking the data checks, click
for the PIPS main menu to
compile the index. Select Current Period (t), Compilation Method, and Imputation Formula, and then
Preview to see the preview before compiling the index.
26
Snapshot 30
27
44.
Snapshot 31 shows the imputation results. These results can be exported to Excel.
Snapshot 31
45.
In conclusion, Snapshot 31 provides the CPI results. The results are provided for the All-Item CPI and
for each COICOP group. For example, the overall CPI in Snapshot 31 is 157.28, while the CPI for the health
group is 151.37.
Caution to Users of this Guide: The procedures provided in this Guide works best with Excel 2003 Version. The
PIPS system is currently being tested using the Excel 2007. In the meantime, Users are urged to use
other creative means of using Excel 2007 and the PIPS system.
28