1
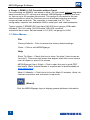
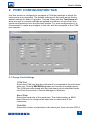
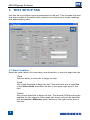
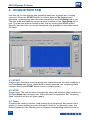
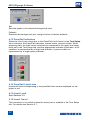
MESURgauge Software User’s Guide MESURgauge Software Thank you! Thank you for purchasing MESURgauge software, a data collection and analysis program developed to: Measure Collect data from digital force gauges, torque gauges, test stands, travel displays, and other devices. Graph View a real time graph of load vs. time or travel. Analyze View an analysis graph, calculate statistics, and zoom to selected locations on the graph. Store Save results to a file, or export directly to Microsoft® ExcelTM. Save and recall previously saved test data, test setups and gauge configurations. MESURgauge expands the functionality of a Mark-10 testing system, typically comprising a test stand, force gauge, grips, and accessories. This User’s Guide provides detailed operating instructions. For additional information or answers to your questions, please do not hesitate to contact us. Our technical support and engineering teams are eager to assist you. TABLE OF CONTENTS STARTUP.............................................................................................. 2 PORT CONFIGURATION TAB ............................................................. 6 TEST SETUP TAB ................................................................................ 9 ACQUISITION TAB ............................................................................. 13 ANALYSIS TAB .................................................................................. 18 DIGITAL DISPLAY TAB ..................................................................... 21 GAUGE SETTINGS TAB .................................................................... 22 REPORT TAB ..................................................................................... 23 TROUBLESHOOTING ....................................................................... 26 1 User’s Guide 1 STARTUP 1.1 Computer Requirements A personal computer running Microsoft® Windows 2000 or later operating system, with screen resolution of 1024 x 768 minimum, is required to run MESURgauge software. An RS-232C serial port or USB port (“COM” Port) is required to communicate with a gauge. A second COM port is needed to communicate with a digital travel display. A CD-ROM drive is needed for software installation. If USB communication is required, be sure to install the appropriate USB driver . A USB driver is included with Mark-10 gauges such as Series 5, 4, and 3, as well as the RSU100 RS-232 to USB adapter. 1.2 Installation Instructions Insert the MESURgauge installation CD into the computer’s CD-ROM drive. If AutoRun is enabled on the computer, the setup program will run automatically. If not, the setup program may be run manually. Click the START button on the Windows task bar, select “Run…”, type “D:Setup” in the dialog box and press ENTER. Alternately, using My Computer or Windows Explorer, navigate to the CD-ROM drive and double-click the file “Setup.exe”. Follow the prompts on the screen to install MESURgauge. 1.3 Running MESURgauge Software When the installation is complete, run MESURgauge by clicking the Windows START button, locating “MESURgauge by Mark-10” under “Programs”, and then clicking “MESURgauge”. 1.4 Windows Security Settings You must enable full Administrator privileges on your PC to ensure proper functioning of MESURgauge. Procedure for Windows 7 1. Log on to Windows as an administrator or as a user with administrator privileges. 2. Right-click on the MESURgauge software icon on the Desktop, select Properties, and then click Open file location. Navigate to the program folder directory in Windows Explorer where MESURgauge was installed (default location is C:\Program Files (x86)\Mark-10 Software). 3. Right-click the Mark-10 Software folder and select Properties. In the Security tab click Edit. For all of the Groups and user names desired, check the Allow 2 MESURgauge Software Full control box. Then click OK twice to close the dialog boxes. Procedure for Windows XP Note: This procedure may only be needed if your information technology administrator has changed the settings. 1. Log on to Windows as an administrator or as a user with administrator privileges. 2. Right-click the MESURgauge software icon on the Desktop, select Properties, then click Find Target. Navigate to the program folder directory in Windows Explorer where MESURgauge was installed (default location is C:\Program Files\Mark-10 Software). 3. Right-click the Mark-10 Software folder and select Properties. In the Security tab click Advanced, then click on all of the users or groups desired and click Edit. Check the Allow Full control box. Then click OK three times to close the dialog boxes. If further instructions are required, consult with your IT administrator. 1.5 MESURgauge Overview MESURgauge is divided into tabs, each with its own set of functions: Acquisition Start and stop the test, view live table and graph. Analysis View table, graph, and statistics, zoom in on graph, save and recall test data, export to Excel. Digital Display View live data in large format. Test Setup Configure test start and stop conditions, test units, single vs. continuous readings, default file locations. Port Configuration Configure communication parameters. Gauge Settings Convenient interface for configuring Series 5 and Series BG/CG digital force gauges. Report Generate a report for the test data. 3 User’s Guide 1.6 System Configuration Menu MESURgauge can be customized to interface with various test equipment through the Test Setup and Port Configuration tabs (details in the following sections). However, it is not necessary to manually input these parameters for typical Mark-10 configurations. The System Configuration menu includes four of the most common test configurations. Clicking on one of these selections will automatically populate the parameters of the aforementioned tabs as required (only the COM port number may need to be adjusted). The four options are as follows: 1. Gauge Only For connecting a Mark-10 gauge directly to a PC. MESURgauge is able to plot load vs. time at up to 50 samples per second. This configuration requires one available USB port on the computer, and a USB or RS-232 cable. Typical system: M3-20 force gauge (USB cable included) Instrument baud rate: Set gauge to 9,600 2. Gauge + Travel Display For connecting a Mark-10 gauge directly to a PC utilizing one channel and a Mitutoyo travel display to a PC utilizing the other channel. MESURgauge is able to plot load vs. distance at up to 2 samples per second. This configuration requires two available USB or serial ports, and cables/adapters. Typical system: ES30 test stand, ESM001 travel display option, M4-100 force gauge (USB cable included), 09-1066 cable, MRS100A converter, RSU100 converter Instrument baud rates: Set gauge to 9,600, travel display baud rate is fixed 3. Gauge + ESM301 / DC Controller with Travel For connecting an ESM301 test stand or other -DC test stand with integrated travel encoder to a PC utilizing one channel. MESURgauge is able to plot load vs. distance at up to 50 samples per second. The gauge is connected to the test stand controller, and the controller is connected to a PC. This configuration requires one available USB or serial port, and cables/adapters. Typical system: ESM301 test stand, ESM301-001 integrated travel indication option, M5-200 force gauge, 09-1162 cable, 09-1056 cable, RSU100 converter Instrument baud rates: Set test stand to 115,200, set gauge to 9,600 4 MESURgauge Software 4. Gauge + ESM301 / DC Controller without Travel For connecting an ESM301 test stand or other -DC test stand without integrated travel encoder to a PC utilizing one channel. MESURgauge is able to plot load vs. time at up to 50 samples per second. The gauge is connected to the test stand controller to allow for functions such as overload protection and stop/ reverse at load set points. The controller is connected to a PC. This configuration requires one available USB or serial port, and cables/adapters. Typical system: TSFM500-DC test stand, M5-500 force gauge (USB cable included), 09-1162 cable, 09-1056 cable, RSU100 converter Instrument baud rates: Set test stand to 115,200, set gauge to 9,600 1.7 Other Menus File Factory Defaults – Click to restore the factory default settings. Close – Click to exit MESURgauge. Help Show Tip Strips – Check this box to show “tip strips” (also known as “tool tips”). These are text boxes that appear when the cursor hovers over an object or area of the screen. MESURgauge User’s Guide – Click to open the user’s guide PDF document. (Note: Adobe Reader is required and is downloadable at www.adobe.com). Mark-10 Website – Click this to link to the Mark-10 website. (Note: An internet connection and a browser is required). (About) Click the MESURgauge logo to display general software information. 5 User’s Guide 2 PORT CONFIGURATION TAB Use this screen to configure the computer’s COM port settings to which the instruments are connected. The default settings are the same as the factory default settings for Mark-10 gauges. This tab, along with the Test Setup tab, allow the user to override settings as applied by selection of one of the four typical configurations from the previous section. For most configurations it is unnecessary to make any changes in this tab, with the exception of the COM port number. 2.1 Gauge Port Settings COM Port Select the COM port that the instrument is connected to from the dropdown list. Clicking REFRESH updates the list with all installed ports. The COM port associated with the instrument can be identified under the Ports sub-section of Device Manager in Windows. Baud Rate Select the baud rate of the serial port. The default setting is 9600 baud. Be sure to configure the baud rate to match that of the instrument. Data Bits Select the number of data bits for the serial port, then click the APPLY 6 MESURgauge Software button below. The default setting is 8 data bits. Parity Select the parity setting of the serial port. The default setting is “None” (no parity). Stop Bits Select the number of stop bits for the serial port. The default setting is 1 stop bit. APPLY Click this button to apply changes to the above settings. 2.2 Reading Request String String to Write Enter the command string to request a reading from the instrument. The default string is “?” (no quotes). Select either or both of the CR and LF check boxes to append the string as required. CR (default) or CR-LF may be used for Mark-10 gauges. The default string can be recalled by right-clicking in the box and selecting "Reinitialize to Default Value". The ability to specify the request data command adds flexibility in testing. For example, peak or average readings may be read from the gauge. Additionally, it allows for the compatibility of MESURgauge with gauges not manufactured by Mark-10. A different reading request string and other parameters are required when communicating with the ESM301 test stand and Series DC test stand controllers. Please refer to the section Communicating With The ESM301 Test Stand. String Read This is the raw character string read from the gauge. Display Codes Display control character '\' codes (\r = carriage return, \n = line feed, \s = space) 2.3 Gauge Name Optionally enter a name to be associated with the gauge settings in this text box. This is helpful in identifying the particular gauge being used. This name is automatically entered in the file dialog box which opens when the SAVE configuration button is clicked. Any name may be used. For further information on saving, see the SAVE button description in Section 2.6. 7 User’s Guide 2.4 Simulated Gauge Check this box to simulate data being received from an instrument. No serial connection is needed to a gauge. To start collecting data, click the Acquisition tab and click the START button. Data will populate the graph and table at the specified rate. This is provided for demonstration purposes only. 2.5 Travel Port Settings These settings apply to the second COM port. This COM port is intended only for use with an external digital travel display. The information about the settings in Section 2.1 (Gauge Port Settings) also applies to this section. 2.6 Travel & Load Data on Same Port Check this box for MESURgauge to accept two strings of data on one COM port, required when sending force and travel data from an ESM301 test stand. Configure the data string as required by selecting the appropriate line numbers, field numbers, and field delimiter. The default settings apply to Mark-10 test stands. 2.7 Configuration File Folder Enter a full path or browse for a folder to use for Gauge Configuration (*.cfg) files. To browse for a folder, click the folder icon at the right of the text box and navigate to or create the desired folder, then click the "Current Folder" button in the dialog box. 2.8 Shared Buttons SAVE Click this button to open a file dialog box prompting to save the current settings to a configuration file (this file has a .cfg extension). Any file name may be entered and any folder may be selected or created. SAVE AS DEFAULT Clicking this button saves the current settings to the default configuration file “Default.cfg”. (No file dialog box opens.) RECALL Click this button to open a dialog box in which to browse for previously saved configuration files. Parameter fields will be populated based on the information in the configuration file. 8 MESURgauge Software 3 TEST SETUP TAB Use this tab to configure various parameters for the test. This includes test start and stop conditions, pass/fail limits, selection of continuous or single readings, and data sampling rate. 3.1 Start Condition Select an option button for time delay, load threshold, or travel to begin the test. Time Set time delay, in seconds, to begin the test. Load Set a load threshold to begin the test (The load units are as specified in the Select Units drop-down list box in the upper right area of this tab). Travel Set a travel threshold to begin the test. The second COM port must be enabled for this selection to be made (the travel units are as specified with the Inches / Millimeter option buttons in the right-center area of this tab). 9 User’s Guide 3.2 Stop Condition Select an option button for time, load, the number of readings, or travel to stop the test. Time – Seconds Set the duration of the test, in seconds. Load – Threshold Set the load threshold at which to terminate the test (the load units are as specified in the Select Units drop-down list box in the upper right area of this tab). See Stop Threshold Options below for various load stop threshold options. Number of Readings – Readings Set the number of readings at which to terminate the test. Travel Set the travel threshold to end the test. The second COM port must be enabled for this selection to be made (the travel units are as specified with the Inches / Millimeter option buttons in the right-center area of this tab). 3.3 Load Stop Condition Four test stop options based on load threshold are available: Rising Edge Stop threshold is higher than the start threshold (increasing load). Falling Edge 1 Stop threshold is lower than start threshold (decreasing load). Falling Edge 2 Stop threshold is higher than Start threshold, but the load is decreasing. Break Detect Stop the test when the load decreases to a specified percentage of the maximum (peak) reading during the test. 3.4 Reading Mode Single Readings When this option is selected, single readings are taken from the gauge each time READ is clicked, or the DATA button on the gauge is pressed. This button appears below the graph in the Acquisition tab when this option is selected. 10 MESURgauge Software Continuous Readings When selected, readings are taken from the gauge at a rate set in the Readings per Second field. Readings per Second This numeric box sets the number of readings per second that MESURgauge requests data from the gauge in the “Continuous Readings” mode. Available range is 0.001 to 50 readings per second. Note: When using a Mitutoyo brand travel display, it is recommended to limit the readings per second at 2, to prevent communication errors. 3.5 Invert Load Check this box to invert the polarity (sign) of the load reading. This is useful, for example, in tensile strength testing. Tension readings, which have a negative sign, can be reversed so that the graph shows increasing values instead of decreasing values. Note: There is another instance of this check box in the Acquisition tab. Checking one box automatically checks the other. 3.6 Test Units Note: Reading and setting units is possible with Mark-10 gauges only. Select Units The gauge’s unit of measurement can be set by clicking on the appropriate selection from the drop-down menu. SET Sets the gauge to the units of measurement selected. READ Reads the unit of measurement to which the gauge is currently set. Units Read Displays the unit of measurement to which the gauge is currently set. 3.7 Travel Port This section refers to the input of travel data in addition to load data. Data may be received from an external travel display or through the integrated encoders from certain Mark-10 test stands. Travel readings are tabulated and plotted vs. load instead of load vs. time. Enable Check this box to enable the second COM port for travel data collection. The settings for this port can be configured in the Port Configuration tab. 11 User’s Guide Invert Travel Check this box to invert the polarity (sign) of the readings from the travel display. 3.8 Pass / Fail Limits Check this check box to enable high and low indicators for go / no go type testing. When checked, Pass, Fail High, and Fail Low indicators appear in the Acquisition tab, below the STOP button. 3.9 Folders Enter full paths or browse for folders to use for Test Data (*.log) and Test Setup (*.tst) files. To browse for a folder, click the folder icon at the right of the text box and navigate to or create the desired folder, then click the "Current Folder" button in the dialog box. 3.10 Shared Buttons SAVE Opens a file dialog box in which to save the current settings to a test setup file (.tst extension). Any file name may be entered and any folder may be selected or created. SAVE AS DEFAULT Clicking this button saves the current settings to the default test setup file, “Default.tst”. RECALL Click this button to open a dialog box in which to browse for previously saved test setup files. Parameter fields will be populated based on the information in the test setup file. 12 MESURgauge Software 4 ACQUISITION TAB Use this tab to view tabular and graphical data from a gauge as it is being received. When the START button is clicked, data will be graphed and tabulated, commencing when the start condition in the Test Setup tab is met. The test ends automatically when the stop condition in the Test Setup tab is met. The test can also be ended at any time by clicking the STOP button. Specific load and time (or travel) data points are displayed in the fields below the table. 4.1 START Starts a test. Readings from the gauge are captured when the start condition in the Test Setup tab is met. When data is being captured, the “Acquiring Data” indicator above the START button turns on (bright green). 4.2 STOP Stops a test. The test will stop automatically when the selected stop condition in the Test Setup tab has been met. When the test is completed, the “Acquiring Data” indicator will turn off (dark green). 4.3 Table Contains the reading number, load reading from the gauge, and relative time stamp (or travel datum) for each data point. Scroll to, or manually enter, the desired reading in the Reading box to display corresponding load and time (or 13 User’s Guide travel) data in the indicators to the right. 4.4 SAVE Click this button to open a file dialog box in which to save the data from the table to a tab-delimited text file. Enter a file name and optionally browse to any desired folder location. The default file folder location for the test data files is set in the Test Data Folder box in the Test Setup tab. After saving, the file can then be opened by common Windows programs such as Notepad and Excel. Note: Saving cannot be performed until the test has been completed. 4.5 Last Reading The most recent reading received from the gauge. 4.6 Total Readings The total number of readings taken during the test. 4.7 Units The unit of measurement received with the data (the gauge[s] must be configured to send units information). 4.8 Graph The graph plots load versus time or load versus travel (time is default). Scale minimum and maximum values can be set by double-clicking on the numerals long the X and Y axes. Change the numbers to the desired values and press ENTER or click away from the numbers. Several options are available by right-clicking anywhere within the graph. A pop -up menu appears as follows: The menu items are provided for quick access and convenience to some common functions. The AutoScale X and Y items are equivalent to the “padlock” icon on the scale palette at the lower right of the graph, described below. 14 MESURgauge Software 4.9 Tools (under the graph) View Clicking on this button brings up the following six viewing options: Set a zoom window with adjustable x- and ydimensions for a specific part of the graph Set a zoom window with adjustable x-dimension for a specific part of the graph Set a zoom window with adjustable y-dimension for a specific part of the graph View entire graph Zoom out Zoom in Pan This allows the user to reposition the graph. Click on the graph, move the mouse to the desired location, and release the mouse button. 4.10 X- & Y-scale Settings Auto-scale lock When in the locked position, the scale is in auto-scale mode (default). Auto-scale Click to auto-scale the axis. 15 User’s Guide Scale & grid properties Click to adjust various scale and grid properties. A pop-up context menu provides access to these properties. 4.11 Plot Palette (upper right corner of the graph) Several plot options are available by clicking on the Plot Palette icon. A menu of options will appear as follows: Plot settings and graph properties can be configured as desired. 4.12 Graph Colors Background Color Picker Box Select the background color of the graph. 16 MESURgauge Software Set Sets the graph to the selected background color. Defaults Restores the background, plot, and grid colors to factory defaults. 4.13 Pass/Fail Indicators When the Use Limits check box in the Pass/Fail Limits frame in the Test Setup tab is checked, the Pass/Fail indicators, shown below, become visible. While acquiring data, the load values received are compared to the upper and lower limits set in the Test Setup tab, and the appropriate indicator illuminates. A fail condition is represented by a bright red indicator. A pass condition is represented by a bright green indicator. 4.14 Pass/Fail Limit Lines Horizontal lines corresponding to the pass/fail limits set are displayed on the graph in red. 4.15 Invert Load See Section 3.5. 4.16 Invert Travel This checkbox is not visible unless the travel port is enabled in the Test Setup tab. For details see Section 3.7. 17 User’s Guide 4.17 ZERO GAUGE Sends a command to a Mark-10 gauge to zero the gauge display and perform the CLEAR function, as described below 4.18 CLEAR GAUGE Sends a command to a Mark-10 gauge to clear peaks and start a new average or external trigger test (if so enabled). The ZERO and CLEAR buttons in MESURgauge perform the same functions as the ZERO and CLEAR buttons on Mark-10 gauges. 4.18 ZERO TRAVEL Sends a command to a Mark-10 test stand controller to zero the travel display. Applicable only to the ESM301 test stand when equipped with travel indication option, or the DC4040 controller. 5 ANALYSIS TAB This tab is used to analyze the data obtained during a test. Saved data in a Series 5 or Series 4 may also be downloaded into this tab. Statistics are calculated and displayed automatically upon completion of the test or download of saved data. The graph cursor tools can be used to zoom to a specific area of the graph. Statistics may then be calculated for that region of the graph. Graph and table data from the Acquisition tab is automatically transferred to this graph and table when the test has been completed. 18 MESURgauge Software 5.1 Graph Graph functionality and tools are the same as in the Acquisition tab, with one additional active icon: Cursor Movement Tool Clicking this button allows the X-Y cursor to be dragged to the desired position. Pass/Fail Limit Lines Horizontal lines corresponding to the pass/fail limits set are displayed on the graph in red. 5.2 REFRESH GRAPH Redraws the graph based on the data collected during the test. 5.3 Cursor Palette Center Cursor Centers the cursor in the graph area. Cursor Control Click on the quadrants of this icon to move the cursor in the corresponding direction. Cursor Table Displays the cursor position’s X and Y values. Reading Number at Cursor Reading number corresponding to the current position of the cursor. 19 User’s Guide 5.4 Download Memory Downloads saved data from a Series 5 or Series 4 gauge. The gauge must be in the main operating mode (i.e. not in a menu or configuration area). A communication error message will appear if an incompatible gauge is used or if a Series 5 or 4 gauge is not in the main operating mode. 5.5 Graph Colors The graph color selection functionality is the same as described in the Acquisition tab. 5.6 Statistics This frame displays statistical data for the test. Maximum The maximum load reading measured during the test. Minimum The minimum load reading measured during the test. Average The average (mean) of the readings. Note that in situations where load fluctuates between positive and negative values, this function considers polarity, not the absolute values (for example, the average of +5 and -5 is calculated as 0). Area Under Curve The average of the absolute values of the load readings multiplied by the selected time interval. Standard Deviation The standard deviation for the acquired data. The above statistics are based on the data range specified in the X-scale Settings frame. This range defaults to the full range at completion of the test. This range can be modified by entering the desired range in the Minimum and Maximum numeric boxes. Click the CALCULATE button to calculate the statistics for the specified range. The graph will automatically adjust to reflect the new range. 5.7 Table The table functionality is the same as described in the Acquisition tab. 5.8 RECALL Opens a file dialog box prompting to recall a previously saved test data file. The table and graph will be populated with the previously saved data, and the statistics will automatically be calculated. Note: When recalling a test which used the travel port for travel measurement, 20 MESURgauge Software or single readings, those options must be selected in the Test Setup tab in order for the x-axis label of the graph and the statistics to be displayed correctly. 5.9 SAVE Opens a file dialog box prompting to save the data from the table to a tabdelimited text file. Enter a file name and optionally browse to any desired folder location. The default file folder location for the test data files is set in the Test Data Folder box in the Test Setup tab. After saving, the file can then be opened by common Windows programs such as Notepad and Excel. 5.10 Export to Excel Clicking this button launches Microsoft® ExcelTM (if installed, sold separately) and populates a worksheet containing reading numbers, load, and time or travel directly into a worksheet. 6 DIGITAL DISPLAY TAB This tab is provided to display real time load readings (and, if the travel port is enabled, travel readings) in large numerals. If the “Graph and Tabulate Data” check box is checked, the graph and table in the Acquisition tab is populated. Data acquisition may be started and stopped from this tab, as with the Acquisition tab. See image below: 21 User’s Guide 7 GAUGE SETTINGS TAB This tab provides a convenient utility with which to read and set gauge configuration parameters from a PC. Settings are applicable only for Mark-10 Series BG/CG and Series 5 gauges. Select the appropriate gauge at the bottom right corner of the screen. Changes may only be made if the gauge is connected directly to the PC (i.e. not through a test stand such as the ESM301). Refer to your gauge’s user’s guide for details on the various parameters. In the lower left-hand part of the screen, it is possible to enter commands to send to any gauge via the primary serial port. This facility allows the user to communicate with any gauge. 7.1 READ Populates the fields above with current settings from a Mark-10 gauge. 7.2 SAVE Saves the current gauge settings to the gauge’s non-volatile memory. These will be the default settings when the gauge powers on. Note: The desired settings must be individually written to the gauge (by clicking the Set button adjacent to the parameter menu) before clicking SAVE. It is recommended to click the READ button to confirm the current settings before clicking SAVE. 7.3 Set Buttons (all) Click to set the Mark-10 gauge with the parameter selected from the drop-down 22 MESURgauge Software menu adjacent to the respective Set button. 7.4 String to Send to Gauge Enter a command to send to the gauge via the primary serial port. This facility allows the user to communicate with and send commands to any gauge. Click Send to send the command. 7.5 String Read from Gauge This text box shows the response string, if any, that is received in response to the above command. 7.6 Display Codes Display control character '\' codes (\r = carriage return, \n = line feed, \s = space). Note: This tab and all gauge-related functions cannot be used while MESURgauge is collecting data from an ESM301 test stand. See Section 9 for details on communicating with the ESM301. 8 REPORT TAB Use this tab to set up a report for the test. The report may be printed to the selected printer or saved as an HTML file. A report template may be saved and recalled. 23 User’s Guide 8.1 Select Printer Select the printer to which the report will print. The Windows default printer is selected initially. 8.2 PRINT Prints the report on the selected printer. 8.3 HTML Report Folder Enter or browse for a folder in which to save the report files. 8.4 SAVE Opens a file dialog box prompting to save the report. Enter a file name and optionally browse to any desired folder location. The default file folder location for report files is set in HTML Report Folder, as described above. 8.5 Left Header Text Enter text to appear in the upper left corner of the report. The text will appear as bold in the report. 8.6 Right Header Check Boxes Check the Date and/or Time boxes to include the current date and/or time in the right header of the report. Date and time will appear as bold in the report. 8.7 Initial Text Enter any initial text here. 8.8 Additional Text Enter any additional text here. 8.9 Conclusion Text Enter any concluding text here. 8.10 Left Footer Text Enter text to appear in the lower left corner of the report. The text will appear as bold in the report. 8.11 Right Footer Text Enter text to appear in the lower left corner of the report. The text will appear as bold in the report. Use the above text boxes to enter information and comments pertaining to the test. This information can be saved to a file as a template and can be recalled. 8.12 Include Graph Check this check box to include an image of the graph in the report. 24 MESURgauge Software 8.13 Include Table Check this check box to include the table data in the report. 8.14 Include Table Grid Check this check box to include a grid for the table. 8.15 Save Template Saves a template of all the information in the text boxes and selected settings to a file for recall. 8.16 Recall Template Recalls a previously saved template. A sample HTML report is shown below as it would appear in a browser: 25 User’s Guide 9 TROUBLESHOOTING 1. Error message: No data received... This message appears when communication has not been achieved between the instrument and MESURgauge, due to a number of possible causes: 1. Incorrect settings in the Port Configuration or Test Setup tab, or the wrong system has been selected from the System Configuration menu. 2. Force gauge or test stand baud rate does not match the baud rate set in MESURgauge. 3. Incorrect COM port selected (identify the COM port number assigned to the instrument by referring to Windows Device Manager). 4. USB driver has not been installed properly. 5. Incorrect cables are being used. It is important to use Mark-10 connection cables only. Double check that all cables and connections are correct. Refer to the respective instruments’ user’s guides. 6. Hardware problems with the PC. Contact your IT administrator. 2. The graph is upside down. The Load (y-axis) and Time / Travel (x-axis) values can be inverted to achieve the desired graph appearance. Checkboxes are provided in the Acquisition and Test Setup tabs. 3. The START and STOP buttons do not start and stop test stand travel. MESURgauge is a data collection program only. It does not have any test stand control capabilities. 26 Mark-10 Corporation has been an innovator in the Force and Torque measurement fields since 1979. We strive to achieve 100% customer satisfaction through excellence in product design, manufacturing and customer support. In addition to our standard line of products we can provide modifications and custom designs for OEM applications. Our engineering team is eager to satisfy any special requirements. Please contact us for further information or suggestions for improvement. We make a measurable difference in force and torque measurement Mark-10 Corporation 11 Dixon Avenue Copiague, NY 11726 USA 1-888-MARK-TEN Tel: 631-842-9200 Fax: 631-842-9201 Internet: www.mark-10.com Email: [email protected] 32-1088 REV 9 0311