1
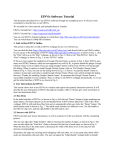
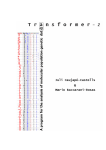
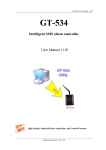
EINVis Software User Manual
This document describes the “Input Dataset Format”, “User Interfaces” and “User Interactions” for the
EINVis software.
1. Input Dataset Format
EINVis needs three input files: EIN Nodes file, EIN Edges file and LD Edges file.
EIN Nodes file: Each line contains the information for one SNP. Each line contains four tokens:
chromosome id, gene name, SNPs name and single-locus test statistic. The four tokens are separated by
space symbol “ ”. The SNPs are ordered by their positions on the chromosomes. One example Nodes file
is shown as follows:
Table 1. EIN Nodes file format
Line #
chrom_id gene_name SNP_name single-locus_test_statistic
1
1 CA6 rs7513804 0.382463
2
2 IL1A rs1894399 0.712872
3
7 MTPN rs1488004 0.477534
4
11 CD3E rs3782040 0.490576
5
21 CSTB rs743466 0.12148
6
22 TIMP3 rs130293 0.889259
EIN Edges file: Each line contains a SNP-pair and its two-locus test statistic. Each line contains three
tokens: Index of the First SNP, Index of Second SNP, and Two-Locus Test Statistic. The “Index of SNP”
means the index in the list of SNPs in the “Nodes file”. The index begins from “0”. The three tokens are
separated by space symbol “ ”. The SNP-pairs are sorted in descending order by their two-locus test
statistics. One example of this file is shown as follows:
Table 2. EIN Edges file format
Line #
SNP1-Index SNP2-Index two-locus_test_statistic
1
511
2
2 0 0.895698
3
2 3 0.741046
4
4 1 0.638908
5
0 5 0.000631648
6
340
From this example, we can see that the first line “5 1 1” means that SNPs “22 TIMP3 rs130293” (the 6th
line of the Table 1) and “2 IL1A rs1894399” (the 2nd line of the Table 1) have an interaction with the test
value 1.
The single-locus test value should be between 0 and 1. We recommend that single-locus test value is
normalized among the single-locus test values of all the SNPs. Two-locus test values also should be
between 0 and 1. The user can select the top ranked SNP-pairs, e.g., the top-400 SNP-pairs. Then the twolocus test values should be normalized among the selected SNP-pairs.
LD Edges file: Each line contains a SNP-pair and its LD value. Each line contains three tokens: Index of
the First SNP, Index of Second SNP, and LD value. The “Index of SNP” is the same as in “EIN Edge
file”, and it means the index in the list of SNPs in the “Nodes file”. The index begins from “0”. The three
tokens are separated by space symbol “ ”. One example of this file is shown as follows:
Table 3. LD Edges file format
Line #
SNP1-Index SNP2-Index LD-Value
1
0 4 0.5
2
2 1 0.495
3
1 3 1.0
4
4 2 0.923
5
0 2 0.054
6
1 4 0.1
The “LD value” can be a number between 0 and 1, for example, the
statistic.
2. User Interfaces
EINVis contains three bubbles: EIN tree ring view bubble, as show in Figure 1; EIN matrix view bubble,
as shown in Figure 2; and LD tree ring view bubble, as shown in Figure 3.
In the EIN tree ring view bubble, the left part shows the EIN tree ring view, and the right column shows
the control panel. The functions of these controls are described in Table 3. The node color is mapped from
single-locus test statistics; and the edge color is mapped from two-locus test statistics. We provide user
mouse interactions to let the user to select, expand or collapse the nodes. These user mouse interactions
are listed in Table 4.
Figure 1. EIN Tree Ring View Bubble
The EIN Matrix View is an auxiliary view for the EIN Tree Ring View. The color scheme is the same as
that used in the EIN tree ring view. The left margin and top margin shows the SNP name list in the format
of “gene.SNP_name”. And the background color represents the single-locus test value. In the matrix, each
square represents whether or not the two SNPs have interactions. If the small square is gray, then there is
no interaction. If it has a color, then the color represents the two-locus test value. Since the view space is
limited, we can only show part of the interaction matrix at one time. We provide the pan function, so that
the user can pan the matrix to view other parts of the matrix view. This mouse interaction is in Table 4.
Figure 2. EIN Matrix View Bubble
The LD Tree Ring View is an auxiliary view for the EIN Tree Ring View too. The color scheme is the
same as that used in the EIN tree ring view. The nodes are the same as in EIN tree ring view, and edges
are changed to LD information. The layout of LD tree ring view synchronizes with the EIN tree ring view.
When user points mouse to an edge, the LD information will be shown on the up right corner.
Figure 3. LD Tree Ring View Bubble
3. User Interactions
EINVis provides controls over the tree ring view bubble, e.g. slider, to let user to adjust the visualization
effect. EINVis also provides mouse user interactions combined with keys pressed to select, expand or
collapse the nodes.
The control panel of tree ring view is shown in Figure 3 with label for each control.
1
2
3
5
4
12
13
7
8
9
10
14, 15
16
17
11
6
Figure 3. Control Pannel with Labels.
The control functions in the tree ring view are listed in the following table. You can find these controls in
the controls panel (right column) in tree ring view bubble, as shown in Figure 1. You can also find these
control in Figure 3, with the labels for each control. The number index shown in Figure 3 corresponds to
the number in the “Index” column in Table 3.
Table 3. Control Function in the Tree Ring View bubble
Control
Type
Idx
1
2
3
Button
Control Name
Choose File
(Nodes File)
Choose File
(Edges File)
Choose File
(LD Edges File)
4
Start Rendering
5
Demo
6
View Rank
7
Edge Number
8
Edge Bundle
9
Font Size
Slider
Functions
Choose the EIN Nodes File
Choose the EIN Edges File
Choose the LD Edges File
Start to render the views after user choose the Nodes File and
Edges File.
Start to render the demo. EINVis will load the demo Nodes
File and Edges File automatically from server.
Open a new webpage to show the table of rank of SNPs based
on their degree.
Control how many edges are shown in tree ring view and
matrix view. Minimum: 10%, Maximum: 100% (All the
edges), Delta: 10%.
Control the edge bundle strength. Minimum: 0.0 (Straight
Line), Maximum: 1.00, Delta: 0.1.
Control the font size of the node name text shown in the tree
ring view.
Minimum: “10 px”, Maximum: “20 px”, Delta: “1 px”.
When user decrease the font size, the width of three levels in
the tree ring view will also decrease.
10
Node Name
Control that whether or not show the node name text in the
tree ring view. If unchecked, the node name will disappear; if
checked, the node name will appear.
11
Black
Background
Control whether use black background in tree ring view. If
checked, render black background, which will be much clear;
if unchecked, render white background.
12
Node Color Bar
13
Edge Color Bar
14
Highlight Any
15
Highlight All
Input Text
Box
16
Search
Help
17
Text
Checkbox
Drop-Down
Menu
Radio
Select one Node Color bar from the drop-down menu, the
contents is listed in Table 5.
Select one Edge Color bar from the drop-down menu, the
contents is listed in Table 5.
If user switches to this radio button and user has selected
multiple nodes, then the nodes related to any of the selected
nodes and induced edges will be highlighted with color.
If user switches to this radio button and user has selected
multiple nodes, then the nodes related to all of the selected
nodes and induced edges will be highlighted with color.
Input the Gene name or SNPs ID in this text box, then,
EINVis will highlight all the matched Genes or SNPs.
User Interaction Help.
The mouse user interactions are listed in the following table.
Table 4. User Mouse Interactions
Domains
Functions
Interactions
Move one bubble
Drag on the frame of the bubble (the blue frame region)
Move all bubbles
together
“M” key pressed + Left Button Down and Mouse Move
Change Layer
Click on one bubble, it will become the most forward layer
Expand one node
Left Button Down in one ring sector region
Collapse one node
“C” key pressed + Left Button Down in one ring sector region
Select one node
“S” key pressed + Left Button Down in one ring sector region
Unselect one node
“U” key pressed + Left Button Down in one ring sector region
Link to NCBI
Database
“L” key pressed + Left Button Down in one ring sector region,
then it will link to NCBI database.
Mouse over Node
The marginal test statistic will be shown in the up right corner
Mouse over Edge
The two-locus test statistic will be shown in the up right
corner
EIN Matrix
View
Pan the matrix
view
Left Button Down + Mouse Move (Drag mouse) in the Inner
Matrix View Region
LD Tree
Ring View
Mouse over Edge
The LD value will be shown in the up right corner
Bubbles
EIN Tree
Ring View
The color bar drop-down menu contains the items listed in the following Table.
Table 5. Items in Node and Edge Color Bar Drop-Down Menu
Item Names
Color Bars
Sequential YIGn
Sequential YIGnBu
Sequential YIOrBr
Sequential YIOrRd
Sequential PuRd
Sequential Greys
Diverging PiYG
Diverging PRGn
Diverging PuOr
Diverging RdBu
Diverging RdYIBu
Diverging RdYIGn
Continuous RdGn
Note: the “Sequential” and “Diverging” color bars are selected from ColorBrewer website.
The node and edge color bar drop-down menu share the common items in the above Table. However,
they are independent. If you change node color bar, it will not affect the edge color.
Please visit the homepage of EINVis: http://filer.case.edu/yxw407/einvis , we provide video tutorials
about EINVis software there: http://filer.case.edu/yxw407/einvis/tutorial.html . And, if you want to run
EINVis online, please visit this link: http://filer.case.edu/yxw407/einvis/run . Enjoy the visualization tool!
In conclusion, this document describes the “Input Data Format”, “User Interfaces” and “User Interactions”
for the EINVis software.