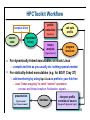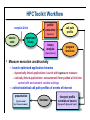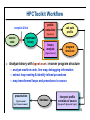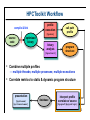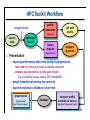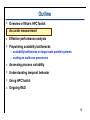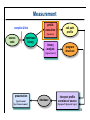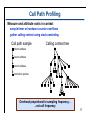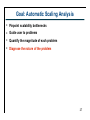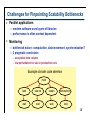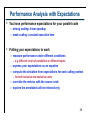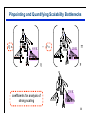
1
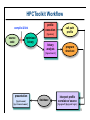
HPCToolkit: Sampling-based Performance
Tools for Leadership Computing
John Mellor-Crummey
Department of Computer Science
Rice University
[email protected]
http://hpctoolkit.org
CScADS Leadership Computing
July 24, 2012
1
Acknowledgments
•
Funding sources
— Center for Scalable Application Development Software
– Cooperative agreement number DE-FC02-07ER25800
— Performance Engineering Research Institute
– Cooperative agreement number DE-FC02-06ER25762
•
Project Team
— Research Staff
– Laksono Adhianto, Mike Fagan, Mark Krentel
— Students
– Xu Liu, Milind Chabbi, Karthik Murthy
— Collaborator
– Nathan Tallent (PNNL)
— Alumni
– Gabriel Marin (ORNL), Robert Fowler (RENCI), Nathan Froyd (Mozilla)
— Summer Interns:
– Reed Landrum, Michael Franco, Sinchan Banerjee, Philip Taffet
2
Challenges for Computational Scientists
•
Execution environments and applications are rapidly evolving
— architecture
– rapidly changing multicore microprocessor designs
– increasing scale of parallel systems
– growing use of accelerators
— applications
– MPI everywhere to threaded implementations
– adding additional scientific capabilities to existing applications
– maintaining multiple variants or configurations for particular problems
•
Steep increase in application development effort to attain
performance, evolvability, and portability
•
Application developers need to
—
—
—
—
assess weaknesses in algorithms and their implementations
improve scalability of executions within and across nodes
adapt to changes in emerging architectures
overhaul algorithms & data structures to add new capabilities
Performance tools can play an important role as a guide
3
Performance Analysis Challenges
•
Complex architectures are hard to use efficiently
— multi-level parallelism: multi-core, ILP, SIMD instructions
— multi-level memory hierarchy
— result: gap between typical and peak performance is huge
•
Complex applications present challenges
— for measurement and analysis
— for understanding and tuning
•
Supercomputer platforms compound the complexity
— unique hardware
— unique microkernel-based operating systems
— multifaceted performance concerns
– computation
– communication
– I/O
4
Performance Analysis Principles
•
Without accurate measurement, analysis is irrelevant
— avoid systematic measurement error
— measure actual executions of interest, not an approximation
– fully optimized production code on the target platform
•
Without effective analysis, measurement is irrelevant
— quantify and attribute problems to source code
— compute insightful metrics
– e.g., “scalability loss” or “waste” rather than just “cycles”
•
Without scalability, a tool is irrelevant for supercomputing
— large codes
— large-scale threaded parallelism within and across nodes
5
Performance Analysis Goals
•
•
Programming model independent tools
Accurate measurement of complex parallel codes
—
—
—
—
large, multi-lingual programs
fully optimized code: loop optimization, templates, inlining
binary-only libraries, sometimes partially stripped
complex execution environments
– dynamic loading (Linux clusters) vs. static linking (Cray, Blue Gene)
– SPMD parallel codes with threaded node programs
– batch jobs
•
Insightful analysis that pinpoints and explains problems
— correlate measurements with code for actionable results
— support analysis at the desired level
– intuitive enough for application scientists and engineers
– detailed enough for library developers and compiler writers
•
Scalable to petascale and beyond
6
HPCToolkit Design Principles
•
Employ binary-level measurement and analysis
— observe fully optimized, dynamically linked executions
— support multi-lingual codes with external binary-only libraries
•
Use sampling-based measurement (avoid instrumentation)
— controllable overhead
— minimize systematic error and avoid blind spots
— enable data collection for large-scale parallelism
•
Collect and correlate multiple derived performance metrics
— diagnosis typically requires more than one species of metric
•
Associate metrics with both static and dynamic context
— loop nests, procedures, inlined code, calling context
•
Support top-down performance analysis
— natural approach that minimizes burden on developers
7
Outline
•
•
•
•
Overview of Rice’s HPCToolkit
Accurate measurement
Effective performance analysis
Pinpointing scalability bottlenecks
— scalability bottlenecks on large-scale parallel systems
— scaling on multicore processors
•
•
•
•
Assessing process variability
Understanding temporal behavior
Using HPCToolkit
Ongoing R&D
8
HPCToolkit Workflow
compile & link
profile
execution
[hpcrun]
source
code
optimized
binary
binary
analysis
[hpcstruct]
presentation
[hpcviewer/
hpctraceviewer]
database
call path
profile
program
structure
interpret profile
correlate w/ source
[hpcprof/hpcprof-mpi]
9
HPCToolkit Workflow
compile & link
profile
execution
[hpcrun]
source
code
optimized
binary
binary
analysis
[hpcstruct]
•
call path
profile
program
structure
For dynamically-linked executables on stock Linux
— compile and link as you usually do: nothing special needed
•
For statically-linked executables (e.g. for BG/P, Cray XT)
— add monitoring by using hpclink as prefix to your link line
– uses “linker wrapping” to catch “control” operations
process and thread creation, finalization, signals, ...
presentation
[hpcviewer/
hpctraceviewer]
database
interpret profile
correlate w/ source
[hpcprof/hpcprof-mpi]
10
HPCToolkit Workflow
compile & link
profile
execution
[hpcrun]
source
code
optimized
binary
binary
analysis
[hpcstruct]
•
call path
profile
program
structure
Measure execution unobtrusively
— launch optimized application binaries
– dynamically-linked applications: launch with hpcrun to measure
– statically-linked applications: measurement library added at link time
control with environment variable settings
— collect statistical call path profiles of events of interest
presentation
[hpcviewer/
hpctraceviewer]
database
interpret profile
correlate w/ source
[hpcprof/hpcprof-mpi]
11
HPCToolkit Workflow
compile & link
profile
execution
[hpcrun]
source
code
optimized
binary
binary
analysis
[hpcstruct]
•
call path
profile
program
structure
Analyze binary with hpcstruct: recover program structure
— analyze machine code, line map, debugging information
— extract loop nesting & identify inlined procedures
— map transformed loops and procedures to source
presentation
[hpcviewer/
hpctraceviewer]
database
interpret profile
correlate w/ source
[hpcprof/hpcprof-mpi]
12
HPCToolkit Workflow
profile
execution
compile & link
[hpcrun]
source
code
optimized
binary
binary
analysis
[hpcstruct]
•
call path
profile
program
structure
Combine multiple profiles
— multiple threads; multiple processes; multiple executions
•
Correlate metrics to static & dynamic program structure
presentation
[hpcviewer/
hpctraceviewer]
database
interpret profile
correlate w/ source
[hpcprof/hpcprof-mpi]
13
HPCToolkit Workflow
compile & link
profile
execution
call path
profile
[hpcrun]
source
code
•
optimized
binary
Presentation
binary
analysis
program
structure
[hpcstruct]
— explore performance data from multiple perspectives
– rank order by metrics to focus on what’s important
– compute derived metrics to help gain insight
e.g. scalability losses, waste, CPI, bandwidth
— graph thread-level metrics for contexts
— explore evolution of behavior over time
presentation
[hpcviewer/
hpctraceviewer]
database
interpret profile
correlate w/ source
[hpcprof/hpcprof-mpi]
14
Outline
•
•
•
•
Overview of Rice’s HPCToolkit
Accurate measurement
Effective performance analysis
Pinpointing scalability bottlenecks
— scalability bottlenecks on large-scale parallel systems
— scaling on multicore processors
•
•
•
•
Assessing process variability
Understanding temporal behavior
Using HPCToolkit
Ongoing R&D
15
Measurement
compile & link
profile
execution
[hpcrun]
source
code
optimized
binary
binary
analysis
[hpcstruct]
presentation
[hpcviewer/
hpctraceviewer]
database
call path
profile
program
structure
interpret profile
correlate w/ source
[hpcprof/hpcprof-mpi]
16
Call Path Profiling
Measure and attribute costs in context
sample timer or hardware counter overflows
gather calling context using stack unwinding
Call path sample
Calling context tree
return address
return address
return address
instruction pointer
Overhead proportional to sampling frequency...
...not call frequency
17
Novel Aspects of Our Approach
•
Unwind fully-optimized and even stripped code
— use on-the-fly binary analysis to support unwinding
•
Cope with dynamically-loaded shared libraries on Linux
— note as new code becomes available in address space
•
Integrate static & dynamic context information in presentation
— dynamic call chains including procedures, inlined functions,
loops, and statements
18
Measurement Effectiveness
•
Accurate
— PFLOTRAN on Cray XT @ 8192 cores
– 148 unwind failures out of 289M unwinds
– 5e-5% errors
— Flash on Blue Gene/P @ 8192 cores
– 212K unwind failures out of 1.1B unwinds
– 2e-2% errors
— SPEC2006 benchmark test suite (sequential codes)
– fully-optimized executables: Intel, PGI, and Pathscale compilers
– 292 unwind failures out of 18M unwinds (Intel Harpertown)
– 1e-3% error
•
Low overhead
— e.g. PFLOTRAN scaling study on Cray XT @ 512 cores
– measured cycles, L2 miss, FLOPs, & TLB @ 1.5% overhead
— suitable for use on production runs
19
Outline
•
•
•
•
Overview of Rice’s HPCToolkit
Accurate measurement
Effective performance analysis
Pinpointing scalability bottlenecks
— scalability bottlenecks on large-scale parallel systems
— scaling on multicore processors
•
•
•
•
Assessing process variability
Understanding temporal behavior
Using HPCToolkit
Ongoing R&D
20
Effective Analysis
compile & link
profile
execution
[hpcrun]
source
code
optimized
binary
binary
analysis
[hpcstruct]
presentation
[hpcviewer/
hpctraceviewer]
database
call path
profile
program
structure
interpret profile
correlate w/ source
[hpcprof/hpcprof-mpi]
21
Recovering Program Structure
•
Analyze an application binary
— identify object code procedures and loops
– decode machine instructions
– construct control flow graph from branches
– identify natural loop nests using interval analysis
— map object code procedures/loops to source code
– leverage line map + debugging information
– discover inlined code
– account for many loop and procedure transformations
Unique benefit of our binary analysis
•
Bridges the gap between
— lightweight measurement of fully optimized binaries
— desire to correlate low-level metrics to source level abstractions
22
Analyzing Results with hpcviewer
costs for
• inlined procedures
• loops
• function calls in full context
source pane
view control
metric display
navigation pane
metric pane
23
Principal Views
•
Calling context tree view - “top-down” (down the call chain)
— associate metrics with each dynamic calling context
— high-level, hierarchical view of distribution of costs
•
Caller’s view - “bottom-up” (up the call chain)
— apportion a procedure’s metrics to its dynamic calling contexts
— understand costs of a procedure called in many places
•
Flat view - ignores the calling context of each sample point
— aggregate all metrics for a procedure, from any context
— attribute costs to loop nests and lines within a procedure
24
Outline
•
•
•
•
Overview of Rice’s HPCToolkit
Accurate measurement
Effective performance analysis
Pinpointing scalability bottlenecks
— scalability bottlenecks on large-scale parallel systems
— scaling on multicore processors
•
•
•
•
Assessing process variability
Understanding temporal behavior
Using HPCToolkit
Ongoing R&D
25
The Problem of Scaling
1.000
?
0.750
Ideal efficiency
Actual efficiency
0.625
6
65
53
4
38
16
96
40
24
10
6
25
64
16
4
0.500
1
Efficiency
0.875
CPUs
Note: higher is better
26
Goal: Automatic Scaling Analysis
•
•
•
•
Pinpoint scalability bottlenecks
Guide user to problems
Quantify the magnitude of each problem
Diagnose the nature of the problem
27
Challenges for Pinpointing Scalability Bottlenecks
•
Parallel applications
— modern software uses layers of libraries
— performance is often context dependent
•
Monitoring
— bottleneck nature: computation, data movement, synchronization?
— 2 pragmatic constraints
– acceptable data volume
– low perturbation for use in production runs
Example climate code skeleton
main
land
sea ice
ocean
wait
wait
wait
atmosphere
wait
28
Performance Analysis with Expectations
•
You have performance expectations for your parallel code
— strong scaling: linear speedup
— weak scaling: constant execution time
•
Putting your expectations to work
— measure performance under different conditions
– e.g. different levels of parallelism or different inputs
— express your expectations as an equation
— compute the deviation from expectations for each calling context
– for both inclusive and exclusive costs
— correlate the metrics with the source code
— explore the annotated call tree interactively
29
Pinpointing and Quantifying Scalability Bottlenecks
Q×
−
600K
P×
400K
Q
coefficients for analysis of
strong scaling
=
P
200K
30
Scalability Analysis Demo
• Parallel, adaptive-mesh
refinement
(AMR)
code
Code:
University
of
Chicago
FLASH
• Block structured AMR; a block is the unit of computation
Simulation:
dwarf
detonation
• Designed for white
compressible
reactive
flows
• Can solve a broad range of (astro)physical problems
Platform:
Gene/P
• Portable: runsBlue
on many
massively-parallel systems
• Scales and performs
Experiment:
8192 well
vs. 256 processors
• Fully modular and extensible: components can be
Scaling
type:to create
weak
combined
many different applications
Nova outbursts on white dwarfs
Magnetic
Rayleigh-Taylor
Laser-driven shock instabilities
Helium burning on neutron stars
Cellular detonation
Orzag/Tang MHD
vortex
Figures courtesy of FLASH Team, University of Chicago
Rayleigh-Taylor instability
31
Scaling on Multicore Processors
•
Compare performance
— single vs. multiple processes on a multicore system
•
Strategy
— differential performance analysis
– subtract the calling context trees as before, unit coefficient for each
32
S3D: Multicore Losses at the Loop Level
Execution time
increases 2.8x in the
loop that scales worst
loop contributes a
6.9% scaling loss to
whole execution
33
Outline
•
•
•
•
Overview of Rice’s HPCToolkit
Accurate measurement
Effective performance analysis
Pinpointing scalability bottlenecks
— scalability bottlenecks on large-scale parallel systems
— scaling on multicore processors
•
•
•
•
Assessing process variability
Understanding temporal behavior
Using HPCToolkit
Ongoing R&D
34
Parallel Radix Sort on 960 Cores
“Right click” on a
node in the CCT view
to graph values
across all threads
Values for all threads
graphed for the
selected context
NOTE: Must analyze
measurement data with
hpcprof-mpi to include
thread-centric metrics in
the performance database
35
Radix Sort on 960 Cores: Barrier Time
sorted by rank
sorted by value
value histogram
36
Outline
•
•
•
•
Overview of Rice’s HPCToolkit
Accurate measurement
Effective performance analysis
Pinpointing scalability bottlenecks
— scalability bottlenecks on large-scale parallel systems
— scaling on multicore processors
•
•
•
•
Assessing process variability
Understanding temporal behavior
Using HPCToolkit
Ongoing R&D
37
Understanding Temporal Behavior
•
Profiling compresses out the temporal dimension
—temporal patterns, e.g. serialization, are invisible in profiles
•
What can we do? Trace call path samples
—sketch:
–
–
–
–
N times per second, take a call path sample of each thread
organize the samples for each thread along a time line
view how the execution evolves left to right
what do we view?
assign each procedure a color; view a depth slice of an execution
Processes
Call
stack
Time
38
17
Process-Time Views of PFLOTRAN
8184-core execution on Cray XT5. Trace view rendered using hpctraceviewer on a Mac Book Pro Laptop.
Insets show zoomed view of marked region at different call stack depths.
39
17
Presenting Large Traces on Small Displays
•
How to render an arbitrary portion of an arbitrarily large trace?
— we have a display window of dimensions h × w
— typically many more processes (or threads) than h
— typically many more samples (trace records) than w
•
Solution: sample the samples!
samples (of samples)
p1
w
time
Trace with n processes
each
sample
defines
a pixel
process
process
pi
pn
time
40
h
Outline
•
•
•
•
Overview of Rice’s HPCToolkit
Accurate measurement
Effective performance analysis
Pinpointing scalability bottlenecks
— scalability bottlenecks on large-scale parallel systems
— scaling on multicore processors
•
•
•
•
Assessing process variability
Understanding temporal behavior
Using HPCToolkit
Ongoing R&D
41
Where to Find HPCToolkit
•
ALCF Systems
— intrepid: /home/projects/hpctoolkit/ppc64/pkgs/hpctoolkit
— vesta: /home/projects/hpctoolkit/pkgs/hpctoolkit
— eureka: /home/projects/hpctoolkit/x86_64/pkgs/hpctoolkit
•
OLCF (Interlagos)
— /ccs/proj/hpctoolkit/pkgs/hpctoolkit-interlagos
— /ccs/proj/hpctoolkit/pkgs/hpcviewer
•
NERSC (Hopper)
— /project/projectdirs/hpctk/hpctoolkit-hopper
— /project/projectdirs/hpctk/hpcviewer
•
For your local Linux systems, you can download and install it
— documentation, build instructions, and software
– see http://hpctoolkit.org for instructions
— we recommend downloading and building from svn
— important notes:
– using hardware counters requires downloading and installing PAPI
– kernel support for hardware counters
on Linux 2.6.32 or better: built-in kernel support for counters
earlier Linux needs a kernel patch (perfmon2 or perfctr)
42
HPCToolkit Documentation
http://hpctoolkit.org/documentation.html
•
Comprehensive user manual:
http://hpctoolkit.org/manual/HPCToolkit-users-manual.pdf
— Quick start guide
– essential overview that almost fits on one page
— Using HPCToolkit with statically linked programs
– a guide for using hpctoolkit on BG/P and Cray XT
— The hpcviewer and hpctraceviewer user interfaces
— Effective strategies for analyzing program performance with
HPCToolkit
– analyzing scalability, waste, multicore performance ...
— HPCToolkit and MPI
— HPCToolkit Troubleshooting
– why don’t I have any source code in the viewer?
– hpcviewer isn’t working well over the network ... what can I do?
•
Installation guide
43
Using HPCToolkit
•
Add hpctoolkit’s bin directory to your path
— see earlier slide for HPCToolkit’s HOME directory on your system
•
Adjust your compiler flags (if you want full attribution to src)
— add -g flag after any optimization flags
•
Add hpclink as a prefix to your Makefile’s link line
— e.g. hpclink mpixlf -o myapp foo.o ... lib.a -lm ...
•
Decide what hardware counters to monitor
— statically-linked executables (e.g., Cray XT, BG/P)
– use hpclink to link your executable
– launch executable with environment var HPCRUN_EVENT_LIST=LIST
(BG/P hardware counters supported)
— dynamically-linked executables (e.g., Linux)
– use hpcrun -L to learn about counters available for profiling
– use papi_avail
you can sample any event listed as “profilable”
44
Collecting Performance Data
•
Collecting traces
— dynamically-linked: hpcrun -t ...
— statically-linked: set environment variable HPCRUN_TRACE=1
•
Launching your job using hpctoolkit
— Blue Gene
– qsub -q prod-devel -t 10 -n 2048 -c 8192 \
--env OMP_NUM_THREADS=2:\
HPCRUN_EVENT_LIST=WALLCLOCK@5000:\
HPCRUN_TRACE=1 your_app
— Cray (with WALLCLOCK)
setenv HPCRUN_EVENT_LIST “WALLCLOCK@5000”
setenv HPCRUN_TRACE 1
aprun your_app
— Cray (with hardware performance counters)
– setenv HPCRUN_EVENT_LIST “PAPI_TOT_CYC@3000000 \
PAPI_L2_MISS@400000 PAPI_TLB_MISS@400000 PAPI_FP_OPS@400000”
setenv HPCRUN_TRACE 1
aprun your_app
45
Digesting your Performance Data
•
Use hpcstruct to reconstruct program structure
— e.g. hpcstruct your_app
– creates your_app.hpcstruct
•
Correlate measurements to source code with hpcprof and hpcprof-mpi
— run hpcprof on the front-end node to analyze a few processes
– no per-thread profiles
— run hpcprof-mpi on the compute nodes to analyze data in parallel
– includes per-thread profiles to support thread-centric graphical view
•
Digesting performance data in parallel with hpcprof-mpi
— run_cmd \
/path/to/hpcprof-mpi \
-S your_app.hpcstruct \
-I /path/to/your_app/src/’*’ \
hpctoolkit-your_app-measurements.jobid
— runcmd
– Cray: aprun
– Blue Gene: qsub -q prod-devel -t 20 -n 32 -m co
46
Analysis and Visualization
•
Use hpcviewer to open resulting database
— warning: first time you graph any data, it will pause to combine
info from all threads into one file
•
Use hpctraceviewer to explore traces
— warning: first time you open a trace database, the viewer will
pause to combine info from all threads into one file
•
Try our our user interfaces before collecting your own data
— example performance data for Chombo on hpctoolkit.org
47
A Special Note About hpcstruct and xlf
•
IBM’s xlf compiler emits machine code for Fortran that have
an unusual mapping back to source
•
To compensate, hpcstruct needs a special option
— --loop-fwd-subst=no
— without this option, many nested loops will be missing in
hpcstruct’s output and (as a result) hpcviewer
48
Manual Control of Sampling
•
Why?
— get meaningful results when measuring a shorter execution than
would really be representative.
— only want to measure solver without measuring initialization.
•
How
— Environment variable
– HPCTOOLKIT_DELAY_SAMPLING=1
— API
– hpctoolkit_sampling_start()
– hpctoolkit_sampling_stop()
— Include file
– -I /home/projects/hpctoolkit/ppc64/pkgs/hpctoolkit/include
– #include <hpctoolkit.h>
— Always against API library
– -L /home/projects/hpctoolkit/ppc64/pkgs/hpctoolkit/lib/hpctoolkit \
-lhpctoolkit
— API is a no-op unless used with hpclink or hpcrun
49
HPCToolkit Capabilities at a Glance
Attribute Costs to Code
Analyze Behavior
over Time
Pinpoint & Quantify
Scaling Bottlenecks
Shift Blame from
Symptoms to Causes
Assess Imbalance
and Variability
Associate Costs with Data
hpctoolkit.org
Outline
•
•
•
•
Overview of Rice’s HPCToolkit
Accurate measurement
Effective performance analysis
Pinpointing scalability bottlenecks
— scalability bottlenecks on large-scale parallel systems
— scaling on multicore processors
•
•
•
•
Assessing process variability
Understanding temporal behavior
Using HPCToolkit
Ongoing R&D
51
Ongoing R&D
•
Available in prototype form
— memory leak detection
— performance analysis of multithreaded code
– pinpoint & quantify insufficient parallelism and parallel overhead
– pinpoint & quantify idleness due to serialization at locks
•
Emerging capabilities
— data-centric profiling
— GPU support
— enhanced analysis of OpenMP and multithreading
•
Future work
— improving measurement scalability by using parallel file I/O
52
Ask Me About
•
•
•
•
•
•
•
Filtering traces
Derived metrics
Profiling OpenMP
Profiling hybrid CPU+GPU code
Data centric performance analysis
Profiling programs with recursion
Scalable trace server
53