1
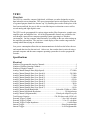
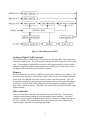
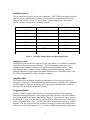
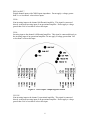
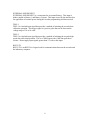
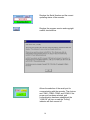
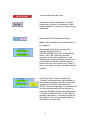
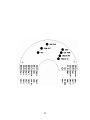
Instrumentation and
Engineering
Services, Inc.
VFR 1 Recorder
USER MANUAL
[email protected]
Tel: 1-850-515-1244
Fax: 1-850-515-1245
Tel. 850-244-2128
Fax
850-244-7979
IES, Inc.
7552 Navarre Parkway Suite 42
Navarre FL 32566
151 Mary Esther Blvd., Suite 311
Mary Esther, FL 32569
VFR 1............................................................................................................................... 1
Overview...................................................................................................................... 1
Specifications............................................................................................................... 1
Electrical .................................................................................................................. 1
Power ....................................................................................................................... 2
Physical .................................................................................................................... 2
Operational Theory ...................................................................................................... 2
Control Logic ........................................................................................................... 2
Analog-to-Digital (A/D) Converter ......................................................................... 3
Memory.................................................................................................................... 3
Micro-controller....................................................................................................... 3
Oscillator Speed ....................................................................................................... 4
Amplifier Gains ....................................................................................................... 4
Amplifier Bias.......................................................................................................... 4
Triggering Modes..................................................................................................... 4
Recorder Operational Modes ....................................................................................... 5
Sleeping.................................................................................................................... 5
Standby .................................................................................................................... 5
Recording................................................................................................................. 5
Awaiting T1 ............................................................................................................. 5
Data Downloading ................................................................................................... 5
Interface Signals Location and Description............................................................. 5
Operational Software ....................................................................................................... 9
VFR Software Program – Main Menu......................................................................... 9
Page 1 of the Main Menu......................................................................................... 9
Page 2 of the Main Menu....................................................................................... 20
Page 3 of the Main Menu....................................................................................... 31
VFR Software Program – Display Data..................................................................... 35
Encapsulation................................................................................................................. 47
Epoxy-Casting............................................................................................................ 47
Compound Formulation ......................................................................................... 47
Mold Preparation ................................................................................................... 47
Container Preparation ............................................................................................ 47
Compound Preparation .......................................................................................... 48
Compound De-aeration.......................................................................................... 48
Compound Application.......................................................................................... 48
Compound Cure ..................................................................................................... 48
Recorder Packaging ................................................................................................... 49
Epoxy Encapsulation ............................................................................................. 49
Glass Bead Encapsulation...................................................................................... 49
Paraffin Encapsulation ........................................................................................... 49
Appendix A.................................................................................................................... 51
Example VFR Settings............................................................................................... 51
Appendix B .................................................................................................................... 56
VFR 1 Signal Locations............................................................................................. 56
VFR 1
Overview
The VFR1 is a reusable, compact, high shock, solid-state, recorder designed to acquire
data in hostile test environments. The epoxy-encapsulated unit was designed to fit inside
of a general-purpose bomb fuze booster cup. By installing the recorder in the place of the
fuze booster and lead, the user is able to record the impact acceleration event as well as
several analog and eight digital events.
The VFR1 can be programmed for various trigger modes, filter frequencies, sample rates,
amplifier gain, and amplifier bias. All of the programmable features are available to the
user through a menu-driven computer operating system (operating in a Windows
environment). On-line computer aided assistance is available to the user when setting-up
the amplifier gain and bias. The user has a visual display of the recorder range and zero
settings rather than relying on calculations.
Low power consumption allows the test instrumentation to be built weeks before the test
and extends the time for data retrieval. After a test, the recorder data is retrieved using a
personal computer and the same computer operating system that is used to program the
recorder.
Specifications
Electrical
Number of Programmable Analog Channels.......................................................................1
Number of Buffered Analog Channels ................................................................................2
Number of Digital Channels ................................................................................................8
Analog Channel Sample Rate (High Speed)...........................................................57.8 kHz
Analog Channel Sample Rate (Low Speed 0) ........................................................28.9 kHz
Analog Channel Sample Rate (Low Speed 1) ..........................................................7.2 kHz
Analog Channel Sample Rate (Low Speed 2) ..........................................................1.8 kHz
Analog Channel Sample Rate (Low Speed 3) ...........................................................451 Hz
Analog Channel Sample Rate (Low Speed 4) ...........................................................112 Hz
Analog Channel Sample Rate (Low Speed 5) .............................................................28 Hz
Analog Channel Sample Rate (Low Speed 6) ...............................................................7 Hz
Analog Channel Sample Rate (Low Speed 7) ............................................................1.8 Hz
Analog Channel Signal Bandwidth......................................... Selectable 2.3kHz or 9.3kHz
Analog Channel Amplitude Resolution ..................................................... 256 digital steps
Analog Channel (Programmable) .......................................... Filter8-pole elliptic low-pass
Total Storage Capacity.........................................................524,288 data words (512K x 8)
External Trigger 1 Signal.................................................................... 3.0 to 10.0-volt pulse
External Trigger 2 Signal...................................................................... 2.3 to 3.3-volt pulse
External Trigger 2 Input Impedance .................................................................10,000 ohms
Internal Trigger ...................................................................................Slope Programmable
Internal Trigger ................................................................................... Level Programmable
1
Power
Supply Voltage...................................................................................................6 to 15 volts
Standby Current ............................................................................ 450 micro amps (typical)
Operating Current .............................................................................. 10 milliamps (typical)
Data Retention Current ................................................................. 450 micro amps (typical)
Sensor Reference Voltage........................................................................................3.3 volts
Sensor Supply Current (Per Channel)...........................................20 milliamps (maximum)
Physical
Shock Survivability................................................................................................100,000 g
Temperature Range.........................................................................................32oF to 160oF
Temperature Range (With Screening) .......................................................... -65oF to 160oF
Encapsulation.............................................................................................................. Epoxy
Size (VFR #1) ........................................................................................See Figure 1 Below
Figure 1. VFR 1 Size
Operational Theory
Figure 2 shows a simplified block diagram of the VFR1. The major components of the
recorder are the control logic, the memory, the analog-to-digital (A/D) converter, and the
micro-controller. Following is a description of each functional block.
Control Logic
The control logic provides the control logic that enables data collection when the recorder
is triggered, places the recorder in a data retention mode when the incoming data has
filled the memory, and enables an external computer to interrogate the memory to extract
the data. The control logic also provides correct timing for writing the data into memory
and sequentially addresses all available memory locations.
2
Figure 2. Block Diagram of VFR 1
Analog-to-Digital (A/D) Converter
The recorder utilizes a CMOS 8-bit A/D converter for digitizing data. The control logic
selects the sampling rate. The A/D contains a multiplexer that is controlled by the control
logic. The multiplexer sequentially switches the A/D input through all of the available
channels, samples the channel output, digitizes the sampled level, and then places the 8bit digital word on the data bus for transfer to memory.
Memory
The data storage device used is a CMOS low-power static, random access memory. The
recorder storage capacity is 524,288 data words (512K x 8 bits). Each sample digitized
by the A/D is an eight-bit word and is stored as a data word in the memory. The A/D
sequentially samples each analog channel, generating a data word for each and writing it
in memory. Once all of the analog channels have been sampled, an addition eight-bit
data word is written in memory. This data word contains the information from the eight
digital channels.
Micro-controller
The micro-controller is the brain that enables the recorder flexibility. The laboratory
computer communicates with the recorder through the micro-controller. The microcontroller accepts recorder configuration data from the laboratory computer through an
RS-232 serial link. The configuration data contains instructions for oscillator speed,
amplifier gains, amplifier bias, and triggering modes.
3
Oscillator Speed
The oscillator speed controls the recorder sample rate. The VFR1 has one high speed and
eight low speed options for the oscillator. The low speed is programmable and can be
changed between tests. Table 3-1 lists all of the available sample rates, the sample
periods, and the recording time available at that rate.
SAMPLE RATE
SAMPLE PERIOD
RECORDING TIME
57.8 kHz
.017 mSeconds
2.268 Seconds
28.9 kHz
.035 mSeconds
4.535 Seconds
7.2 kHz
.138 mSeconds
18.141 Seconds
1.8 kHz
.553 mSeconds
72.566 Seconds
450 Hz
2.215 mSeconds
4.838 Minutes
112 Hz
8.858 mSeconds
19.351 Minutes
28 Hz
35.433 mSeconds
77.404 Minutes
7 Hz
141.730 mSeconds
5.160 Hours
Table 1. Oscillator Sample Rates and Recording Times
Amplifier Gains
The amplifier gain sets the full-scale level of the data window. It is similar to setting the
volts/division on a laboratory oscilloscope. The gain adjustment allows the user to
reconfigure the recorder for different test requirements and different sensors. Unlike
other commercially available recorders requiring gain calculations using complex
formulas followed by gain settings through the installation of a calculated resistor value,
the VFR1 is programmable using a laboratory computer.
Amplifier Bias
The amplifier bias adjustment is similar to adjusting the vertical position control of a
laboratory oscilloscope. The bias adjustment allows the user to select the zero location of
the data amplitude. The bias adjustment allows the user to reconfigure the recorder for
different test requirements and different sensors.
Triggering Modes
The user is able to program the recorder, for either the standard G-switch triggering
and/or an auto-triggering mode. In the auto-trigger mode, the micro controller monitors
the recorder channel zero output and generate a trigger 2 signal when the signal crosses a
bit threshold. The bit level selection for triggering the recorder when in the auto-trigger
mode is programmable by the user so the level can be changed between tests or it can be
disabled. The auto-trigger allows the recorder to be triggered in the same manner that a
laboratory oscilloscope is triggered. If a G-switch is attached to the normal trigger pads,
4
the recorder is triggered by the first signal generated, either the G-switch or the autotrigger. The G-switch cannot be disabled; it must be removed to prevent it from
triggering the recorder.
Recorder Operational Modes
Sleeping
Sleeping indicates the recorder is in the low current mode. It draws 10-14 mA while the
serial link is connected. When the serial is disconnected, the recorder draws under 500
uA and is dormant. The recorder can be programmed, and data downloaded while the
serial link is connected, but the analog section remains off.
Standby
Standby indicates the analog section of the recorder is powered, but data is not being
stored into memory. This mode is useful for measuring the data collection current of the
recorder because the sensors are powered in this mode. Also, the analog outputs are
active, so signals can be connected to the recorder to test/calibrate the analog section.
Recording
Recording data indicates the analog section is on and the recorder is actually storing data
into memory. When the memory is full, the recorder will automatically turn itself off and
go into the “Sleep” mode to conserve power. If the recorder is recovered after a test, and
it is still in the “Recording” data mode (memory was not filled up), the “Stop” button
must be pressed before the data can be downloaded.
Awaiting T1
Awaiting External T1 indicates the recorder is in the “Sleep” mode, waiting for the
correct external 3.3-volt pulse on the T1 pin of the recorder to wake it. The external pulse
is ignored when the serial link is on. When T1 occurs, the recorder will automatically go
into the “Recording” mode, sampling at the slow sampling rate. Note: If there is a sensor
error, the recorder will be shut down into the “Standby” mode. So it is recommended that
the recorder be put into the “Recording” data mode on the bench, before the test, to verify
proper operation. After the recorder status indicates it is “Awaiting External T1”, the
serial connection can be removed.
Data Downloading
Data transfer for the VFR recorder is accomplished using the same menu-driven
computer operating system that is used to program the recorder. The software is a user
friendly, menu driven program that allows the user to retrieve, display, and store data
records. In addition, the software enables the user to magnify portions of the data record
and with a cross hair, obtain timing and amplitude information and print the display.
Interface Signals Location and Description
Figure 3 illustrates all of the VFR1 signal locations. Following is a description of each
input/output signal.
5
DIG 0 to DIG 7
Digital channel inputs with CMOS inputs impedance. Do not apply a voltage greater
than Vcc or less than 0 volts to these inputs.
CH 0 +
Non-inverting input to the channel 0 differential amplifier. This signal is connected
directly to the non-inverting input of an operational amplifier. Do not apply a voltage
greater than Vref or less than 0 volts to this input.
CH 0 –
Inverting input to the channel 0 differential amplifier. This signal is connected directly to
the inverting input of an operational amplifier. Do not apply a voltage greater than Vref
or less than 0 volts to this input.
Figure 3. VFR 1 Input / Output Signal Location
CH 1 IN
Non-inverting input to the channel 1 operational amplifier. This signal is connected
directly to the non-inverting input of an operational amplifier. Do not apply a voltage
greater than Vref or less than 0 volts to this input.
6
CH 2 IN
Non-inverting input to the channel 2 operational amplifier. This signal is connected
directly to the non-inverting input of an operational amplifier. Do not apply a voltage
greater than Vref or less than 0 volts to this input.
CH 0 OUT
CH O OUT is the recorder channel 0 amplifier output. This signal is also the input for
the analog multiplexer. Use only high impedance instruments to measure this signal.
OSC OUT
OSC OUT is the output signal of the internal recorder oscillator. The frequency of the
oscillator out signal is the sampling rate of each channel. This output is not active when
the recorder in a sleep mode.
Vcc
Vcc is the regulated power supply output. This output will source 10 milliamps for an
external load.
Vref
Vref is the regulated power supply for powering sensors. This power supply is only
active while the recorder is acquiring data. This output will source 30 milliamps.
GND
GND is the power and signal ground.
SW GND
This signal is a switched ground. When the recorder is collecting data, the SW GND is at
ground potential. When the recorder is in the sleep mode, the SW GND is at Vcc level.
This single can only source/sink 1 milliamp.
BATT
BATT is a connection for an external battery. This input is not diode-coupled to any of
the other battery connections and should not be used in conjunction with any other
battery. This connection is intended to power the recorder when only one battery is used.
Use of this connection for powering the recorder eliminates the diode voltage drop that
the other battery connections have.
BATT 1
BATT 1 is a connection for an external battery. This input is diode-coupled to Battery 2
and External Power Input.
BATT 2
BATT 2 is a connection for an external battery. This input is diode-coupled to Battery 1
and External Power Input.
7
EXTERNAL POWER INPUT
EXTERNAL POWER INPUT is a connection for an external battery. This input is
diode-coupled to Battery 1 and Battery 2 inputs. This input is used by the interface box
for application of external power during the recorder programming and data retrieval.
TRIG 1
TRIG 1 is a latched input signal that provides a method of initiating the recorder data
collection operation. This trigger signal is a positive pulse that can be between the
voltage range of 3.0 to 10-volts.
TRIG 2
TRIG 2 is a latched input signal that provides a method of initiating the recorder highspeed data collection operation. This is a CMOS input with a 10K ohm pull-down
resistor. Do not apply input signals greater than 3.3-volts to this input.
RS232-TX
RS232-TX is an RS232 level signal used for communications between the recorder and
the laboratory computer.
8
Operational Software
The operational software was written as a menu-driven computer operating
system utilizing the LabView programming language. This chapter is intended as
a user manual for the operating system. A graphics approach has been taken to
describe the operating system. Below is a display of each of the screen menu
followed by a description of each item on that menu.
VFR Software Program – Main Menu
Page 1 of the Main Menu.
This is the opening menu of the VFR program. It shows the current status
of the recorder, allows the control of the recorder, and download and display of
the data.
9
Displays the Serial Number and the current
operating status of the recorder.
Displays the program version and copyright
credits, shown below.
Allows the selection of the serial port for
communicating with the recorder. The choices
are COM1, COM2, COM3, and COM4. If the
proper port has been selected, and
communication has been established, the
“LINK OK” will turn on and the “Polling”
indicator will flash on and off.
10
The recorder cannot be found.
No serial link can be established. Possible
causes are no power to the recorder, a bad
cable connection, or the wrong serial com port
is selected.
Allows selection of different baud rates.
Note: This is the default value and should not
be changed.
Occasionally, when first connecting the
recorder to the serial port, a
“SERIAL ERROR” can occur. A beep will be
heard. This is OK, unless the recorder
continues to have error problems. It could
indicate more serious problems, such as loss
of serial link or a problem with the recorder.
Other errors can occur under “Error Status”. If
this occurs, there is a serious problem with the
recorder.
If a “Sensor Error” occurs, it means the
“Channel Auto Bias at Start” was enabled for
the channels displayed, and the recorder was
unable to set the Sensor bias when the
“START” button was pressed. The recorder will
not start recording data until the problem is
corrected. Possible solutions are disabling the
“Channel Auto Bias at Start” for that channel,
balancing the sensor, or reducing the gain for
that channel. This error could also indicate a
bad sensor or sensor wire.
11
This is the main section for controlling the
recorder.
Clears any “Error Status” or “Sensor Error
Status” warnings and silences the beeping. If
the errors are not cleared with this button,
there is a more serious problem with the
recorder.
These indicators flash to remind the User to
“READ SETUP” on page 2 of the Main
program, and “READ CHANNEL DATA” on
page 3 of the Main program. This is VERY
important to do as soon as serial link has been
established with the recorder. This allows the
User to verify the current settings programmed
into the recorder’s EEPROM. These will
usually flash when the recorder is first
connected to the serial port.
Note: Data can still be downloaded even if the
“READ CHANNEL DATA” or “READ SETUP”
indicators are flashing.
“Sleeping” indicates the recorder in the low
current mode. It will draw 10-14 mA while the
serial link is connected. When the serial is
disconnected, the recorder will draw under 500
uA and will be dormant. The recorder can be
programmed, and data downloaded while the
serial link is connected, but the analog section
will remain off.
12
“STOP” will put the recorder into the “SLEEP”
mode if it is currently “RECORDING” data, in
“STANDBY”, or “AWAITING T1”. If the recorder
is already in the “SLEEP” mode, nothing will
happen. NOTE: If the recorder is currently
“RECORDING” data, the “STOP” button MUST
be pressed before any data can be
downloaded.
“Standby” indicates the analog section of the
recorder is powered, but data IS NOT being
stored into memory. This mode is useful for
measuring the data collection current of the
recorder, because the sensors are powered in
this mode. Also, the analog outputs are active,
so signals can be connected to the recorder to
test/calibrate the analog section.
Pressing this button will put the reocrder into
the “Standby” mode. If the recorder is in the
“Recording” data mode, this button is ignored.
When in the “Standby” or “Recording” modes,
these indicators display the analog outputs (0255 bits) of the amplified analog channels. In
the “Standby” mode, these values will float
towards zero.
“Recording” data indicates the analog section
is on and the recorder is actually storing data
into memory. When the memory is full, the
recorder will automatically turn itself off and go
into the “Sleep” mode to conserve power. If the
recorder is recovered after a test, and it is still
in the “Recording” data mode (memory was not
filled up), the “Stop” button must be pressed
before the data can be downloaded.
13
The “Start” button must be pressed to start
recording data. Data will start at the beginning
of the memory and sample at the “slow”
sampling rate and ALL previous data will be
erased. A message (shown below) will prompt
the User to be sure they are ready to start
recording data. Pressing “Stop” will turn off the
data recording. After the recorder is in the
“Recording Data” mode, the serial connection
can be removed.
Note: If there is a “Sensor Error”, the recorder
will put itself into the “Standby” mode, an error
will sound, and no data will be recorded. You
will need to correct the sensor problem before
recording data.
“Awaiting External T1” indicates the recorder is
in the “Sleep” mode, waiting for the correct
external 3.3-volt pulse on the T1 pin of the
recorder to wake it. The external pulse is
ignored when the serial link is on. When T1
occurs, the recorder will automatically go into
the “Recording” mode, sampling at the slow
sampling rate. Note: If there is a sensor error,
the recorder will be shut down into the
“Standby” mode. So it is recommended that the
recorder be put into the “Recording” data mode
on the bench, before the test, to verify proper
operation. After the recorder status indicates it
is “Awaiting External T1”, the serial connection
can be removed.
INFO: The recorder will start recording data
when the “START” button is pressed in the lab.
This will work in most test applications,
14
because the recorder is collecting data at a low
speed until an external T2 occurs, or the auto
trigger is activated. But certain tests require
low current and the recorder may remain
dormant for long periods of time, such as, a
sled track test. This requires the recorder to be
in the “SLEEP” mode until woken by an
external 3.3-volt signal, T1. The width of the T1
pulse required to wake the recorder can be
selected on Page 2.
The “T1 Start” button will put the recorder into
the “Awaiting External T1” mode. Pressing the
“Stop” button will turn this off and put the
recorder back into the “Sleep” mode.
Displays the current battery voltage. A good
way to determine the strength of the battery is
to apply a load to it. Pressing the “Battery Test”
button can do this. This turns on the analog
section the recorder and which loads down the
battery.
The “LOW BATT” indicator blinks when the
battery voltage is below 5.0 volts. It is highly
recommended that a new battery be used if
this occurs. The recorder monitors the battery
voltage during a test and if it falls below a safe
limit, the recorder is put into high speed and is
shut down to conserve battery voltage.
Note: If the battery voltage falls below ~5 volts
while the recorder is collecting data, the
recorder will automatically put itself into “High
Speed” until the memory is full, and shut itself
down to save battery energy and prevent data
loss.
The current recorder temperature is displayed
while the serial link is connected. Also, the
maximum temperature the recorder has seen
in its lifetime is displayed. The display can be
either in F or C.
15
After a test has been completed, the highest
and lowest temperature during that test is
displayed. These values are reset when the
“Start” button is pressed and the serial link is
disconnected.
After a test has been completed, the starting
and ending battery voltages are displayed. The
recorder starts monitoring the voltage only after
the serial link is disconnected. The voltage is
monitored about once a minute.
The current memory size. This can be selected
for 512K or 32K data points.
The memory size dedicated for each channel.
The value is determined by the mode (number
of analog channels activated) and the memory
size selected (32K or 512K data points).
The Channel mode is either “0” or “1” for the
VFR2 recorder. Mode 0 has 3 programmable
analog channels, only. Mode 1 has 3
programmable analog channels, and 4
buffered analog channels. The VFR2 recorder
has only Mode 0, which is 1 programmable
analog channel, and 2 buffered analog
channels.
Displays the current high speed and low speed
settings, which are programmed, into the
recorder.
16
Controls the downloading of the data after the
test. If the recorder is still in the “Recording
Data” mode, the “STOP” button must be
pressed first, to stop the data collection. This
will put the recorder into “High” speed until the
memory is full.
Note: The data will remain valid in memory
until either power is removed from the
recorder, or the “START” button is pressed.
Also, data can still be downloaded even if the
“READ CHANNEL DATA” or “READ SETUP”
indicators are flashing, and do not need to be
read before downloading the data.
Downloads ALL the data in the recorder. Either
32K or 512K data points, depending on how
the recorder was programmed. When
downloading, this operation can be canceled. If
there is a problem while downloading, such as,
a parity error, the User will be warned, and the
data can be downloaded again.
Sometimes when data from a test is written
into memory, not all the memory is used. In
that case, the recorder indicates the “Valid
Memory Size”. By pressing the “Quick
Download” button, only the memory, which was
used during the test, is downloaded. This
reduces the time required for downloading. If
there are any uncertainties, the User can
simply download ALL the data by pressing the
“Download ALL Data” button.
17
This screen pops
up when
downloading data.
The User can stop
the downloading
process by pressing
the “ABORT
DOWNLOADING”
button. It is Normal
for the memory
counter to go
slightly past the
memory size and
stop for a short
period of time.
This message is displayed when ALL the data
has been successfully downloaded from the
recorder’s memory. The data can be
downloaded as many times as the Users
wants, but it will be erased if power is removed
from the recorder, or the “START” button is
pressed.
If this message appears, there was
a problem downloading the data.
Either there was a bad connection,
or the User aborted the download
process. Simply try downloading
the data again.
This message appears if not all the
data was downloaded, indicating
how much was actually received.
18
After the data is downloaded, it can be viewed
by pressing the “VIEW DATA” button.
For normal operation with a serial connection
to a recorder, the switch should be in the “VFR
Link” position. This allows communication
between the computer and the recorder. If
there is no recorder connected to the
computer, put the switch in the “View data
only” position. This disables the software from
trying to establish a serial link with the
recorder. This is used for viewing data files
only.
EXIT’S the software program, and returns you
to Windows.
19
Page 2 of the Main Menu.
This is the second page of the VFR Main Program. You can get to this
screen by sliding the bar at the bottom of the screen, or clicking just to the right of
the bar with the mouse arrow. This page is used to read and program the
recorder’s operational settings. The setup must be read first, before any changes
can be made. These settings are stored in EEPROM and will not be erased if
power is removed.
Note: The Channel Data information on page 3 should be read first, before
adjusting the Trigger Level or selecting the sensor High Range and Low Range.
These values are based on the sensor’s sensitivity, which is located on the third
page.
20
Slide bar used to go from page 1 to page 3.
These two controls are used to read and
program the settings to the recorder’s
EEPROM, found in this window. Note: Even
after power is removed from the recorder, the
settings will be retained. When powered back
up, the same settings will appear.
When the recorder is first connected to the
serial link, the “READ SETUP” indicator will
blink. This is a reminder to press the “Read
Setup” button to read the settings, which have
been stored in the recorder’s EEPROM. The
current settings must be read from the recorder
before they can be changed and saved.
The setting for this page are stored in the
recorder’s EEPROM and must be “Read”
before changes can be made and programmed
back into the recorder.
Note: Press the “Read Setup” before putting
the recorder in the “RECORDING” mode to
ensure the proper settings have been entered.
After the settings on this page have been
selected, they must be programmed back into
the recorder’s EEPROM before they will take
affect. Once programmed, they will not change
unless this button is pressed again. The battery
can be removed and the settings will not
change. The message below, appears when
this button is pressed, to verify that the User
really wants to change the EEPROM settings.
21
If blinking, the recorder is communicating
properly with the program. It will stop blinking
when the software is programming the
recorder, and resume when finished. If is
stops, inspect the power supply and the serial
cable.
This determines the mode of operation for the
VFR2 recorder. In Mode 0, there are 3
programmable analog channels that are active
(CH 0,1,2), and 8 digital channels. In Mode 1,
there are 3 programmable analog channels
and 4 buffered analog channels that are active,
and 8 digital channels. The VFR-1 recorder
has only one mode, which is 1 programmable
analog channel, 2 buffered analog channels,
and 8 digital channels. . The memory size
allocated for each channel is display on Page
1.
Two memory sizes can be selected: Either 32K
data points or 512K data points. The
advantage of using 32K is when battery power
is crucial. The smaller memory size will fill up
more quickly, conserving battery power.
This determines the analog filter for all the
programmable channels. The two selections
are 9.25 KHz and 2.3 KHz.
22
Controls for the External T1 signal.
The width of the external 3.3-volt T1 pulse
required to wake the recorder from sleep and
start it recording data, can be selected. The
pulse can range from a simple positive edge (0
milliseconds) up to a minimum pulse width of
approximately 2.55 seconds. If the pulse goes
negative during this, the pulse width counter
may reset itself.
If “Quick Startup” is disabled, the normal
analog warm-up and “Auto bias at Start” (if
enabled) occurs, but this can up to several
seconds, and data will not be recorded until
this is completed. If “Quick Startup” is enabled,
the normal warm-up and “Auto bias at Start”
are ignored, allowing a much quicker turn on
time. Note: If disabled, there may be garbage
data at the beginning of the file until the analog
section and sensor has had time to stabilize.
This section is
used to program
the gain and
bias level of the
sensor.
Note: The “CHANNEL DATA” on Page 3 must
be read first, to properly display the High and
23
Low Range of the data. The sensitivity for each
channel must be entered on Page 3.
Simply sliding the bars, or typing in a value
sets the Bias and Gain for each channel. The
range is 0 to 255. If the Bias is set for 127, the
voltage output of the analog channel will be ½
of Vref, or 1.65 volts (center scale). The Gain
setting is not the actual gain, but is displayed
just to the right.
Note: It is not recommended to set the bias
below a value of 20 when the channel is used
as differential inputs because of ground
distortion problem associated with single
supply amplifiers.
INFO: To use an analog channel as a single
ended input, set the Bias Setting to 0, and
ground the IN- input. DO NOT EXCEED 3.3
volts in the IN+ and IN- inputs!!!
When the Gain setting is changed, the actual
gain of the analog channel is display here.
This display is the Units per Bit value, based
on the current gain setting.
This is the important display. When the Bias
setting is moved up and down, the total range
remains the same, but the High and Low
Range will move up and down. If the Bias is set
for 127, the High and Low Range will be the
same magnitude. When the Gain setting is
changed, the total magnitude will increase or
24
decrease, but the bias (center point) will
remain the same.
IMPORTANT: The sensor sensitivity and
excitation voltage for each channel must be
entered on Page 3 before these values will
be correct.
This section controls the “Auto Trigger” of the
recorder. When the recorder is recording data,
it samples at the “Slow” sampling rate. When
an external T2 or auto trigger occurs, the
recorder is put into a “High” sampling rate for a
certain length of time.
Note: An external T2 pulse will put the recorder
into a “High” sampling rate, even if no auto
trigger occurred or the auto trigger is disabled.
Enables the Auto Trigger. If enabled, and the
signal exceeds the trigger level, the recorder is
put into a “High” sampling rate. If disabled, the
Auto Trigger is ignored and the only way the
recorder will go into “High” speed is if an
external T2 pulse occurs.
Note: An external T2 pulse overrides the Auto
Trigger.
Determines which channel is used as for the
Auto Trigger. For the VFR1 recorder, only
channel 0 is allowed. The VFR2 recorder can
use channel 0, 1, or 2.
25
The Auto Trigger level can be set by sliding the
bar switch, or typing in the value desired. The
range is 0 to 255. The trigger point is the
entered value ‘above the bias line’ of the
analog output. It requires a positive going
signal to cause a trigger.
IMPORTANT: The sensor sensitivity and
excitation voltage for each channel must be
entered on Page 3 before these values will
be correct.
There are two methods of determining at what
level the Auto Trigger will activate.
The first method (Above Starting Bias) triggers
the recorder into “High” speed when the signal
exceeds the delta Trigger Level, above the
Starting Bias line (the bias line when the
recorder first started to record data). Therefore,
if the signal exceeds the exact same voltage
level anytime during the test, the recorder will
be triggered.
The second method (Above Floating Bias)
triggers when the signal exceeds the delta
Trigger Level, above the current bias line.
Therefore, the bias line on which the Auto
Trigger is based on can continually change
throughout the test. This “Floating” point will
only change one bit at a time over several
seconds and DOES NOT change the actual
bias line setting of the analog channel. It is an
internal reference only.
When the Trigger Level slide switch is
changed, the actual trigger level value is
displayed here, based on the sensitivity
entered on Page 3. This value is either "Above
26
the Floating Bias” level or “Above the Starting
Bias” level.
This section Enables or Disables the “Auto
Sensor Balance” features of the recorder.
INFO: If the “Auto Sensor Balance at Start” is
enabled, and a “Sensor Error” occurs when the
“START” button is pressed, the recorder is
turned off and put in the “Standby” mode. The
reason can be a bad sensor, bad wire, or an
unbalanced sensor bridge caused by high gain.
This can be over ridden by disabling the “Auto
Sensor Balance at Start”, reducing the gain, or
fixing the sensor.
INFO: To balance the sensor bridge, set the
Bias level to 127, use the desired gain level for
the test, and program the settings. Press the
“Battery Test” button to put the recorder in the
“STANDBY” mode. Then put a resistor decade
box across IN- and ground or IN+ and ground,
and adjust the resistance until the output of the
analog channel is ~1.65 volts or bit level ~127.
Install the resistor and enable the “Auto Sensor
Balance at Start”.
The sensor can be automatically balanced
when the recorder first starts to record data. So
if the desired bias level is 50, but because of
gain and sensor unbalance, the output is 60,
this feature will automatically adjust the bias to
give the output of 50. This is done just before
the recorder starts collecting data, only.
This feature should be disabled when using
single-ended inputs.
27
The reason for this feature is compensate for a
sensor drifting due to temperature changes.
The higher the gain, the worse this problem
can become. If enabled, the recorder will
automatically adjust the bias to maintain it at
the starting bias level. This is only done during
the “Slow” sampling rates, occurs at slow
intervals of approximately 30-60 seconds, and
will only change up or down, one bit at a time.
This feature should be disabled when using
single-ended inputs.
This section controls the time functions and
speed modes of the recorder, including the
minimum time to sample at the “Fast” sampling
rate, the length of time the recorder is forced to
sample at the “Slow” rate after a “High” speed
event occurs, and the speed mode for
collecting data.
After a trigger event from either the Auto
Trigger or an external T2 pulse occurs, the
recorder is switched into a “Fast” sampling
rate. Even if the trigger event instantly
disappears, the recorder will stay in the “High
Speed” mode for at least the time chosen by
this switch, up to a maximum time of 255
milliseconds. The minimum time is 5
milliseconds. This guarantees that there will be
“High Speed” data collected for a minimum
length of time.
28
After the recorder is trigger into the “High
Speed” mode, it could stay in that mode as
long as the signal was above the Auto Trigger
threshold. This may not be desired, so by
setting this switch to a certain number of
seconds, the recorder will be forced back into
the “Slow” sampling rate for at least the time
selected. If the value is set to 0, this switch is
ignored and the recorder will stay in the “High
Speed” mode as long as the signal is above
the Auto Trigger threshold.
Note: An external T2 pulse will override this
switch setting. It is also ignored when the serial
link is connected to the recorder.
When an Auto Trigger occurs, several Speed
Modes can be programmed to occur.
If the “Slow Speed ONLY” mode is selected,
the Auto Trigger is ignored and the recorder
will remain in “Slow Speed”.
In the “Multi-Speed” mode, the recorder starts
out in “Slow Speed” and when an Auto Trigger
occurs, the recorder is put into “High Speed”
for a certain length of time, then returning to
the “Slow” sampling mode. If another trigger
event occurs, the recorder will go back into
“High Speed”. This can be repeated until
memory is filled.
In the “Slow-Fast Speed” mode, the recorder
starts in “Slow Speed”, until an Auto Trigger
occurs, and the recorder is then put into “High
Speed” until the memory is full.
Note: This switch does not control the external
T2 pulse, so when T2 occurs, the recorder is
put into “High Speed”.
29
The recorder is put into the “Fast Speed”
sampling rate when the Auto Trigger or
external T2 occurs. Otherwise, the recorder
samples at a “Slow Speed” rate, which can be
selected by this switch.
This is the “Fast Speed” sampling rate of the
recorder when an Auto Trigger of external T2
occurs. The User cannot change this.
The maximum time data will be collected,
based on the “Slow Speed” selected, and the
memory size. This can be shorter if there are
multiple “High Speed” events recorded.
30
Page 3 of the Main Menu.
This is the third page of the VFR Main Program. You can get to this
screen by sliding the bar at the bottom of the screen, or clicking just to the right of
the bar with the mouse arrow. This page is used to read and program the
recorder’s Channel Data and miscellaneous information concerning the test. The
Channel Data must be read first, before any changes can be made. These
settings are stored in EEPROM and will not be erased if power is removed.
Note: The Channel Data information on this page should be read first, before
adjusting the Trigger Level or selecting the sensor High Range and Low Range,
found on Page 2. The “Sampling Time”, Sensor Sensitivity, and Sensor
Excitation MUST be entered correctly for proper operation of the recorder.
31
When the recorder is first connected to the
serial link, the “READ CHANNEL DATA”
indicator will blink. This is a reminder to press
the “READ Channel Data” button to read the
channel information, which have been stored in
the recorder’s EEPROM.
The Channel Data must be read from the
recorder before the entered values can be
changed and saved.
Note: Press the “READ Channel Data” before
putting the recorder in the “RECORDING”
mode to ensure the proper data has been
entered.
After the Channel Data on this page have been
entered or edited, it must be programmed back
into the recorder’s EEPROM before it will take
affect. Once programmed, it will not change
unless this button is pressed again. The battery
can be removed and the Channel Data will not
change. The message below, appears when
this button is pressed, to verify that the User
really wants to change the EEPROM settings.
Note: When the “Program Channel Data”
button is pressed, the button will blink and the
“Serial Link” indicator will stop blinking, while
the EEPROM is being programmed. This will
take several seconds. When finished, the
“Serial Link” indicator will start blinking again. If
a “Serial Error” occurs, press the “Program
Channel Data” button again. Always re-read
the Channel Data to verify it was programmed
successfully.
32
If blinking, the recorder is communicating
properly with the program. It will stop blinking
when the software is programming the
recorder, and resume when finished. If is
stops, inspect the power supply and the serial
cable.
This section is for general information
concerning the test.
Note: The “Sampling Time” MUST be entered
correctly for proper operation of the recorder.
This section contains information about each
channel. Do not enter a value for the “Units per
Bit” or “Zero Level Bit” blocks. This is
calculated by the software when the data is
downloaded.
Note: The Sensor Sensitivity and Excitation
MUST be entered correctly for proper
operation of the recorder.
Analog Channel Title’s for Ch3 through Ch6,
which are only valid for theVFR2 recorder in
Mode 1.
33
Digital Channel Titles.
34
VFR Software Program – Display Data
This is the Display Data menu of the VFR program. It allow the User to Display
the data collected, modify the channel data, print it, and save it as an ASCII file.
When in this program, the recorder and computer will not communicate.
Press the “Read File” switch to load a data file
from disk. The data file should have a suffix of
“.IES”. If not, type in the entire name of the
data file. Then press “Open”.
35
36
Shows the data file name and path.
Displays the serial number of the recorder that
collected the data, the date of the test, and the
test title.
The date and time the data was downloaded,
and the name of the test operator.
The analog channel titles of Ch0, Ch1, and
Ch2.
The analog channel titles of Ch3, Ch4, Ch5,
and Ch6. This is valid for the VFR2 recorder, in
Mode 1.
The size of the file in K data points.
The tool bar for the manipulating the data in
the display window.
Displays the full data window in the X direction
(time).
37
Displays the full data window in the Y direction
(magnitude).
Magnifies the data.
Pans the data.
The cursor control. Allows grabbing the cursor
with the mouse pointer.
The amount of time the battery was used
during the test.
The starting and ending battery voltage during
the test. This does not start until the serial link
has been disconnected, and is sampled every
few minutes. If the test is too short, such as a
test where an external T1 pulse turns on the
recorder and T2 shuts the recorder down after
a short time, these values may be 0.
The maximum and minimum temperatures (in
degrees Celsius), which occur while recording
data during the test.
The maximum temperature (in degrees
Celsius), which has occurred during the life of
the recorder.
The Mode of the VFR2 recorder used to collect
the data. This does not apply to the VFR1
recorder.
Displays the “Fast” and “Slow” sampling rates
of this data file.
38
This is the display
window for the data.
The top window shows
the analog data. The
window below it, shows
the digital data
represented in an
analog type of display.
The two rows of
indicators show the
actual digital lines as
the cursor is moved
around in the window.
These buttons determine which
data channels are displayed on the
graph. CH3 to CH6 are valid for
only VFR2, Mode1.
The “amplitude” scale for the “current” selected
data channel is displayed here. The “colored”
bar on the left indicates the channel which has
been selected. In this case, channel 0 (the red
channel) is the scale, which is shown.
39
This section is used to control the cursor. The
“+” button must be pressed to put the graph in
the cursor mode. Picking it with the mouse
then can move the cursor.
This button determines which channel the
cursor is active with, and which amplitude
scale is displayed.
If the data window was zoomed and the
“Cursor” has disappeared, press this button to
bring the cursor back into the currently
displayed window.
The cursor can be moved with the mouse, or
my pressing these buttons. The inner ‘blue’
buttons will move the cursor by one data point.
The outer ‘green’ buttons will move it by 100
data points at a time.
As the cursor is moved, the current data point
amplitude and time positions are updated and
displayed. Both the delta and the actual value
are displayed. The “Zero” button is used to set
a reference.
Note: The timing information is ONLY VALID in
the “High Speed” areas. Even in the “Low
Speed” areas, each data point you move the
40
cursor, the time change will be at the “High
Speed” sampling rate. To allow this display to
work with “Low Speed” sampling rates, the
“Display Slow Data Only” button must be
pressed.
When this button is pressed, the ‘green’
displayed is zeroed at that cursor location.
When the “Zero” button is pressed and the
cursor is moved, the numbers displayed here
will change based on this “New” zero
reference. Effectively, the new values are the
“delta” value from this zero point. X Pts and Y
Pts are the actual BIT value of the data point.
This displays the actual time, amplitude, and
BIT values of the data at the cursor location of
the active channel.
Note: The Amplitude and the Y Pnt are based
on the “Zero Bias” found in the “View VFR
Settings”.
When “Show Multi-speed” is selected, all of the
data is displayed, both the “Slow Speed” and
“High Speed” data points.
Note: When the “Show Multi-speed” is
selected, only the “High Speed” sampling rate
is used to calculated the times when the cursor
is moved.
When “Show Slow Data Only” is selected, only
the “Slow Speed” data is displayed. When
there is a “High Speed” event, it is represented
as a single spike of date, with the correct
magnitude.
41
Note: When the “Show Slow Data Only” is
selected, the time is calculated using the “Slow
Speed” sampling rate when the cursor is
moved.
The digital data is displayed
both in an analog graph and
as indicators. The cursor
position determines which
indicators are lit, based on the
digital values.
This graph shows the digital
activity for the data window
currently displayed. The “red”
signal is Digital channel #0
and the “green” signal is
Digital channel #1.
Digital channel #0 contains
the recorder’s internal signals.
“LOW” indicates the recorder is sampling data
in the “Slow Speed” rate.
“HIGH” indicates the recorder is sampling in
the “Fast Speed” rate.
“uP OK” indicates no internal reset occurred
during the test. This should lit at all times.
When lit, this indicates that an external T1
pulse has occurred.
When lit, this indicates that en external T2
pulse has occurred.
42
Note: If the T2 pulse is too narrow, this
indicator may not light.
This is the “latched” T2 pulse indicator. This
also lights when an external T2 pulse occurs,
so if the pulse is too narrow to be recorded by
the “T2” indicator, the User will still know that
an external T2 occurred. It will turn off after the
recorder goes back into the “slow Speed”
mode.
Indicates the serial link is not connected to the
recorder.
Indicates the serial link is connected to the
recorder.
Always OFF.
Always ON.
Digital Channel #1 contains the 8
User defined digital channels. OFF
indicates a low signal and ON
indicates a high signal.
Indicates at the current cursor position, the
data was sampled at the “Low Speed” rate.
Indicates at the current cursor position, the
data was sampled at the “High Speed” rate.
43
This section controls the reading and saving of
that data file, converting the data to an ASCII
data file, changing the current channel settings
and viewing the test setup, and displaying the
data in High/Slow speeds.
When “Show Multi-speed” is selected, all of the
data is displayed, both the “Slow Speed” and
“High Speed” data points.
Note: When the “Show Multi-speed” is
selected, only the “High Speed” sampling rate
is used to calculated the times when the cursor
is moved.
When “Show Slow Data Only” is selected, only
the “Slow Speed” data is displayed. When
there is a “High Speed” event, it is represented
as a single spike of date, with the correct
magnitude.
Note: When the “Show Slow Data Only” is
selected, the time is calculated using the “Slow
Speed” sampling rate when the cursor is
moved.
Allows the User to view how the recorder was
programmed for the test. The Channel data
can be edited. This is covered in another
section of the software manual.
Data can be EXPORTED to an ASCII data file
in a spreadsheet form for further data analysis.
44
When pressed, this display
appears and gives several
options for making an ASCII
data file. This can be aborted
by pressing the “EXIT” button.
Note: The display data will be
saved in an ASCII file.
If “YES” is selected, the time
base in the spreadsheet data
file will begin with ZERO time.
Otherwise, the current time
displayed on the graph will be
used.
If “YES” is selected, the data
file size is reduced by the
“Reduction Factor” that is
entered. For example, if the
reduction factor is 10, every
10th data point is saved to the
ACSII file, reducing the
physical size of the file by
90%.
This saves any changes to the data file record.
Either the “ENTIRE” data file can be saved, or
just the “DISPLAYED” data.
Loads a data file from the disk.
45
Exits the Data Display section of the program
46
Encapsulation
Encapsulation is important for shock survivability. The general rule for shock
survivability is “if it can move, it will break”. Once the recorder or a battery pack
is constructed and tested, it should be stabilized using an encapsulation
compound. The Epoxy-casting section below describes the procedure used for
the encapsulation.
Having encapsulated the recorder and battery, an additional encapsulation is
required to physically locate the recorder within the test fixture, fill all of the voids,
and prevent any motion during hostile tests. This second encapsulation is
described below in Recorder Packaging section.
Epoxy-Casting
The compound selected for the VFR 1 and the batteries is a epoxy-casting resin
manufactured by Emerson and Cuming. A suitable mold should be constructed
out of nylon or Teflon to yield the desired final shape. The mold should also
include an overflow chamber for expansion of the encapsulating compound
during the de-aeration process. The following procedure is an encapsulating
example using an epoxy-casting resin manufactured by Emerson and Cuming.
Compound Formulation
The casting compound is formulated from the materials listed below, taken in the
requisite proportions on a weight basis. The tolerance on weights of materials is
+ 2 percent. Maximum batch size is 90 grams.
Part A
Part B
Stycast 1090SI
Catalyst 24-LV
100 parts by weight
23 parts by weight
Mold Preparation
The mold or housing should be clean and free of contaminants. When the mold
is not an integral part of the component, it should be cleaned and coated with a
suitable mold release agent and allowed to dry.
Container Preparation
All mixing or handling containers should be clean and moisture-free.
WARNING. The components of the casting compound may be
toxic. Hence, adequate ventilation should be provided in the handling of the components to prevent exposure to vapors. Ingestion
or skin contact with these materials shall be avoided. If accidental
skin contact should occur, the exposed areas should be washed
immediately with soap and water.
47
Compound Preparation
For best results during the subsequent de-aeration step, use a container whose
diameter is approximately equal to its height and whose volume is at least four
times the volume of the mixed compound. The requisite amounts of each
component should be combined in accordance with the following procedures:
Remove the Stycast 1090SI and Catalyst 24-LV from the refrigerator and allow
them to warm to room temperature. This should be done at least 24 hours in
advance.
Mix the entire contents of the Stycast 1090SI container to a uniform consistency.
During shipment and storage, the low-density filler may crust on the top. This is
normal, and it must be remixed for proper results.
Weigh the desired amount of Stycast 1090SI into a clean container. Castings
requiring more than 75 grams of Stycast should be done in steps to minimize the
heat from the exothermic reaction.
Weigh an amount of Catalyst 24-LV equal to 23 percent of the Stycast 1090SI
into another clean container. Add the Catalyst 24-LV to the Stycast 1090SI and
mix thoroughly.
Compound De-aeration
As soon as the mixing is complete, the mixture should be placed in a vacuum
chamber and evacuated to a pressure of less than 6 inches of Hg absolute
(greater than 24 inches of Hg gauge). This reduced pressure should be
maintained for at least 5 minutes. The de-aerated resin mix should be used in
the subsequent steps as soon as possible.
Compound Application
Introduce the de-aerated casting compound into the mold. The mold should be
filled to the final desired height of the casting. Place the filled mold in a vacuum
chamber and evacuate to a pressure of less than 6 inches of Hg absolute. The
reduced pressure should be maintained for 15 minutes. Return the mold to
atmospheric pressure and remove the mold from vacuum chamber. Remove the
overflow chamber from the mold. Additional casting compound may be required
to fill the mold to the final desired height.
Compound Cure
The filled mold should be cured at room temperature for at least 24 hours. Do
not leave the object in the mold for longer than 24 hours.
WARNING. Do not heat the filled mold to accelerate the curing process.
Externally applied heat can aggravate the natural exothermic reaction and
permanently damage the recorder or battery.
48
Recorder Packaging
The recorder has been encapsulated in a shock-resistant epoxy resin to enhance
the shock survivability. An additional encapsulation is required to physically
locate the recorder within the test fixture, fill all of the voids, and prevent any
motion during hostile tests. The three methods of encapsulation that have been
successfully used are listed below.
WARNING. It is important to prevent any motion of the recorder
while in a hostile environment. Failure to properly restrain the
recorder could result in permanent damage.
Epoxy Encapsulation
This encapsulation provides a rigid method of mounting the recorder to the test
fixture and requires the least amount of space. The recorder must first be
interfaced to all sensors that are to be contained within the encapsulation.
Provisions must be made for the relocation of the input signals and edge
connector pads outside of the encapsulation. The recorder is positioned and
centered within the test fixture. Follow the battery-encapsulating procedure to
totally encapsulate the recorder within the test fixture. The disadvantage of
physically locating the components in this manner is the inability to recover the
components after the test. This procedure should only be used in the cases
where the available space will not allow any of the other encapsulation methods.
Glass Bead Encapsulation
The recorder must first be interfaced to all sensors that are to be contained within
the glass beads. The recorder is positioned and centered within the test fixture.
The test fixture is filled with glass beads (beads with a diameter of less than
0.005-inch work well). The test fixture must be constantly vibrated during the
filling to insure that all air voids are filled, although a vibration table should be
avoided if possible. The vibration table could damage the accelerometer if the
frequency of the vibration is too high. After the test, the recorder must be
removed from the glass beads to enable the interface connection.
Paraffin Encapsulation
The recorder must first be interfaced with all sensors that are to be contained
within the paraffin. The recorder is positioned and centered within the test
fixture. Small strips of porous foam function well as centering devices. The test
fixture is filled with paraffin that has been preheated to 75oC (167oF). Fill the
test fixture approximately half full, and then slowly agitate the paraffin by moving
the test fixture to insure that all trapped air pockets are allowed to escape.
Complete the filling. As the paraffin cools, shrinking occurs and more paraffin
must be added to fill the void. After the test, the recorder must be removed from
the paraffin encapsulation to enable the interface connection. The procedure is a
time-consuming process due to the temperature limitation of the recorder.
Position the recorder in an oven and heat to 75oC (167oF) until all the paraffin
has turned to liquid. Care should be exercised in positioning the encapsulated
49
recorder to insure that the interface board does not make contact with a metal
surface as the paraffin melts.
WARNING. Using heat above 75oC (167oF) exceeds the
operating temperature limits of recorder components and could
result in failure of the recorder.
50
Appendix A
Example VFR Settings
51
This appendix contains four common tests that are performed at Eglin AFB and
suggested VFR settings for each.
Gun Shot with Triggering on Wall Impact.
Setting
Trigger 1 Pad
Trigger 2 Pad
Accelerometer
Speed Mode
Slow Speed Select
Mode 0/1
Memory Size
Min Fast Speed Time
Min Slow Speed Time
Auto Sensor Balance (Start)
Auto Sensor Balance (Test)
Trigger Channel
Trigger Level Above Bias
Auto Trigger Point
CH Bias
CH Gain
Battery Test
Stop
Quick Startup After T1
T1 Min Pulse Width
T1 Start
Start
Description
350 G-switch between this pad and Vcc. Position the G-switch
so that it will close on setback.
350 G-switch between this pad and Vcc. Position the G-switch
so that it will close on impact.
Connect so that deceleration provides a positive output
Slow-> Fast
0
As desired
512K
255
0
On
Off
Select channel with the accelerometer
Select a value that is below peak G level
Above Starting Bias
128
As desired
Press this button to verify accelerometer bias level. The Bias
Level should appear on the CH Bit Value of the Main Menu.
Press this button after Battery Test is completed.
Disabled
0
Press when ready to load VFR into test item
Do not press
Note: This setup will keep the VFR in a sleep mode until activity is seen on the T1
Trigger switch. The Trigger 1 switch will turn-on the recorder when the gun is fired.
The first 6 millseconds of data will be on the positive rail as the power supplies turn-on.
The data at the positive rail will cross the Auto Trigger Point and put the VFR in a Highspeed mode. The VFR will stay in the High-Speed mode until the memory is filled (after
approximately 2.2 seconds of data collection).
52
Gun Shot with Triggering on Gun Set-Back (Method #1)
Setting
Trigger 1 Pad
Trigger 2 Pad
Accelerometer
Speed Mode
Slow Speed Select
Mode 0/1
Memory Size
Min Fast Speed Time
Min Slow Speed Time
Auto Sensor Balance (Start)
Auto Sensor Balance (Test)
Trigger Channel
Trigger Level Above Bias
Auto Trigger Point
CH Bias
CH Gain
Battery Test
Stop
Quick Startup After T1
T1 Min Pulse Width
T1 Start
Start
Description
Unused
350 G-switch between this pad and Vcc. Position the G-switch
so that it will close on set-back.
Connect so that acceleration provides a positive output
Slow-> Fast
Select a slow-speed that will give you time to get the test item
from the lab to the gun. Selecting a 7 will give you
approximately 20 hours to get the test completed.
As desired
512K
255
0
On
On
Select channel with the accelerometer
Select a value that is below peak G level
Above Starting Bias
128
As desired
N/A
N/A
Disabled
0
Do not press
Press when ready to load VFR into test item
Note: This setup will start the recorder in the low-speed mode at the lab when the start
button is depressed. Insure that you have enough battery power to operate the VFR for
the time required to complete the test as it will be in a high current mode until the test is
completed. When the gun set-back forces close the Trigger 2 G-switch or the autotrigger circuit see a signal above the bias level, the VFR will go into a high-speed mode
and will remain in the high-speed mode until the memory is filled.
53
Gun Shot with Triggering on Gun Set-Back (Method #2)
Setting
Trigger 1 Pad
Trigger 2 Pad
Accelerometer
Speed Mode
Slow Speed Select
Mode 0/1
Memory Size
Min Fast Speed Time
Min Slow Speed Time
Auto Sensor Balance (Start)
Auto Sensor Balance (Test)
Trigger Channel
Trigger Level Above Bias
Auto Trigger Point
CH Bias
CH Gain
Battery Test
Stop
Quick Startup After T1
T1 Min Pulse Width
T1 Start
Start
Description
Wire to outside of test item with the circuit described below.
350 G-switch between this pad and Vcc. Position the G-switch
so that it will close on set-back.
Connect so that acceleration provides a positive output
Multi-Speed
Select a slow-speed that will give you time load and fire the gun.
Selecting a 5 will give you approximately 20 minutes of data.
As desired
512K
100 mSec
0
On
On
Select channel with the accelerometer
Select a value that is below peak G level
Above Starting Bias
128
As desired
N/A
N/A
Disabled
100 (1 sec)
Press when ready to load VFR into test item
Do not press
Note: The VFR will be in a low-speed mode until you apply an external Trigger 1 using
the circuit below. When the external Trigger 1 is applied the VFR will go into a highspeed mode for 100 mSec then go to the low-speed mode. When the gun set-back forces
close the Trigger 2 G-switch or the auto-trigger circuit see a signal above the bias level,
the VFR will go into a high-speed mode and will remain in the high-speed mode for 100
mSec then go back to a low-speed mode.
54
Sled Track Test with Triggering on Wall Impact.
Setting
Trigger 1 Pad
Trigger 2 Pad
Accelerometer
Speed Mode
Slow Speed Select
Mode 0/1
Memory Size
Min Fast Speed Time
Min Slow Speed Time
Auto Sensor Balance (Start)
Auto Sensor Balance (Test)
Trigger Channel
Trigger Level Above Bias
Auto Trigger Point
CH Bias
CH Gain
Battery Test
Stop
Quick Startup After T1
T1 Min Pulse Width
T1 Start
Start
Description
25 G-switch between this pad and Vcc. Position the G-switch so
that it will close on setback.
350 G-switch between this pad and Vcc. Position the G-switch
so that it will close on impact.
Connect so that deceleration provides a positive output
Multi-Speed
3
As desired
512K
200 mSec
0
On
Off
Select channel with the accelerometer
50
Above Starting Bias
128
As desired
Press this button to verify accelerometer bias level. The Bias
Level should appear on the CH Bit Value of the Main Menu.
Press this button after Battery Test is completed.
Disabled
2 (200 mSec)
Press when ready to load VFR into test item
Do not press
Note: This setup will keep the VFR in a sleep mode until activity is seen on the T1
Trigger switch. The Trigger 1 switch will turn-on the recorder when the when the test
item on the sled track is fired. The first 6 millseconds of data will be on the positive rail
as the power supplies turn-on. The data at the positive rail will cross the Auto Trigger
Point and put the VFR in a High-speed mode and the VFR will stay in the High-Speed
for 100 mSec them return to Low-Speed. At impact (when either the Trigger 2 switch
closes or the auto trigger feature is activated) the recorder will go to the High-Speed
mode and collect data for 100 mSec.
55
Appendix B
VFR 1 Signal Locations
56
57