1
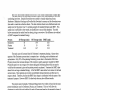
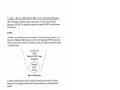
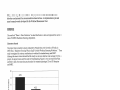
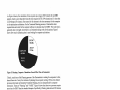
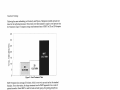
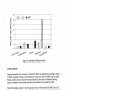
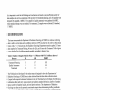
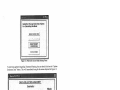
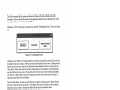
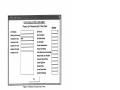
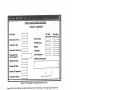
Radiation Oncology
Workload Measurement Tool Development
Final Report
University of Michigan Health System
Department of Radiation Oncology:
Marc Halman, Director of Administration
Program & Operations Analysis Department:
Mary Duck, Management Systems Coordinator
Student Team, University of Michigan
Industrial & Operations Engineering:
Brad Barker
Troy Brinlcman
Jim Denner
Heather White
April 26, 2004
Table of Contents
EXECUTIVE SUMMARY
ii
INTRODUCTION
GOALS AND OBJECTIVES
BACKGROUND
SCOPE
PROJECT APPROACH
Phase 1: Collected Data
Phase 2: Analyzed Data
Phase 3: Develop Recommendations
FINDINGS
Literature Search
Interviews
Flowcharts
Data Collection
Dosimetry
Physics
Treatment
CONCLUSIONS
RECOMMENDATIONS
ACTION PLAN
1
1
1
3
3
3
4
5
5
5
6
6
7
7
9
11
APPENDIX A: FLOWCHARTS
1 Patient Consult
2.1 Treatment Planning
2.2 Dosimetry Treatment Planning
2.2a Dosimetry Treatment Planning
3.1 Physics Treatment Planning
3.2a Physics Quality Assurance Measurement
3.2b Physics Quality Assurance Evaluation
3.3c Physics Quality Assurance Analysis
—
—
—
-
—
—
—
APPENDIX B: DATA COLLECTION SHEETS
1 Dosimetry
2 Physics
3 Treatment
—
—
—
APPENDIX C: WORKLOAD MEASUREMENT TOOL
12
13
13
19
19
20
21
22
23
24
25
26
27
27
28
29
30
EXECUTIVE SUMMARY
The University of Michigan Health System (TJMHS) houses one of America’s most
technologically advanced Radiation Oncology departments. As such, the Radiation Oncology
department constantly stands on the cutting edge of new developments in radiation therapy. The
most recent development instituted at UMHS is Intensity Modulated Radiation Therapy (IMRT).
This study was commissioned to study the workload for IMRT and compare it to standard
therapy workload, which includes two-dimensional and three-dimensional therapies. The study
began January 6, 2004 and ended on April 22, 2004. Tn particular, the project team studied the
Dosimetry, Physics, and Therapy processes.
Radiation Oncology currently lacks a consistent method for quantifying workload for any
radiation therapy. The purpose of this study was to develop a tool for correlating Dosimetry,
Physics, and Therapy workload to treatment type. The primary goal was to develop a method for
measuring this relationship and to create a tool that would allow Radiation Oncology to continue
such measurements.
This study’s scope included the Radiation Oncology department at UMHS in Ann Arbor,
MI. Furthermore, it included standard therapy and IMRT only, focusing on Dosimetry, Physics,
and Treatment. The study did not include any other methods of radiation therapy and did not
include studies of other UMHS satellite treatment centers. The project was divided into three
phases:
Phase
1 Collected data
Tasks
Conducted literature search; conducted 8 interviews;
observed Dosimetry, Physics, and Treatment processes;
developed process flowcharts, created and distributed data
collection sheets
Duration
21 days
2
Analyzed data
Collected data collection sheets and studied results, created
visual representations of data, discussed findings and
developed conclusions
21 days
Developed
recommendations
Use data to make recommendations and develop a method
for implementing recommendations
14 days
—
3
—
—
The conclusions in this paper are based on findings from interviews, observations,
literature searches, and data collection. Interviews with staff in Dosimetry, Physics, and Therapy
gave the project team perceptions of how IMRT is executed. It was noted that 11VIRT computer
calculations increase from three seconds to one hour in Dosimetry. For Physics, quality
assurance increases from ten minutes to ten hours. Treatment itself increases from an average of
twenty minutes to forty, according to interviews. The literature search helped to verify these
perceptions. A study done at the University of Florida measured that treatment planning
(includes both Dosimetry and Physics) takes about eight hours for IMRT, which is double that
for 3D therapy and four times more than 2D therapy.
Radiation Oncology Workload Measurement Tool Development
Program & Operations Analysis, UMMC
Page
ii
April 26, 2004
The team observed the individual processes to gain a better understanding of them after
conducting interviews. Detailed flowcharts were created to visually depict the process.
Members of Radiation Oncology staff verified the flowcharts’ accuracy and the flowcharts were
then used to create data collection sheets. The data collection sheets were distributed and total
sample size for this project was 73, including samples for standard therapies and TMRT. This
sample size is sufficient to draw trends, but insufficient to use as final standards. The table
below summarizes the results from the sheets, giving an overview of the difference in workload
of IMRT compared to standard therapy:
Process
Dosimetry
Physics
Treatment
2D Therapy (mm)
55
10
16.8
3D Therapy (mm)
199
10
16.7
IMRT (mm)
635
430
32.3
The main cause of increased time for Dosimetry is treatment planning. Almost three
quarters of the Dosimetry process time is computer time including point calculations and
optimization. Only 25% of the planning Dosimetry process time is Dosimetrist effort time.
Physics process time increases because of the extensive quality assurance required for JIVIRT.
Physicists spend over an average of two hours taking and developing films which are used to
verify that the treatment is given to the patient precisely as planned. Treatment for 1MRT takes
almost twice as long as standard therapy. All of the IMRT cases studied were tumors in the head
and neck area. These patients are severely uncomfortable during treatment and often have to
request a break. Therefore, the fact that IMRT takes longer is confounded with the nature of the
treatment’s purpose. However LMRT of other body sites may have different results.
—
The project team developed a Workload Measurement Tool which will provide the mean
person-minutes per case for Dosimetry, Physics, and Treatment. This tool will allow the
department to predict the total workload for each of these areas based on the expected volume of
cases. IJMHS can continue to take data and eventually reach a significant sample size. To have
95% confidence that the mean person-hours is within the range of +1- 15 minutes, 285 more
samples of Dosimetry are needed, 48 more samples of Physics data are needed, and 16 more
samples of Treatment data are needed. It will take approximately one year to collect the
Dosimetry and Physics data at this level of confidence if an average of one sample of Dosimetry
and five samples of Physics are collected per week.
The project team recommends that the Radiation Oncology department continue to take
data of the Dosimetry, Physics, and Treatment processes for standard therapy and IMRT
therapies. Using the Workload Measurement Tool, the department can predict the workload for
Dosimetry, Physics, and Treatment based on their projected volume. They can use this tool as
new methods of therapy are introduced into the department.
We also recommend that Radiation Oncology determine the root cause of increased time
IMRT.
Although many of the additional processing times are inherent because of the
for
newness of IMRT, there may be controllable factors that contribute to increased time.
Radiation Oncology Workload Measurement Tool Development
Program & Operations Analysis, UMMC
Page iii
April 26, 2004
INTRODUCTION
The University of Michigan Health System (LTMHS) has one of the country’s most reputable and
technologically advanced Radiation Oncology departments. To implement advancements in
technology, IJMHS must maintain up-to-date procedures and understand workload requirements.
Currently, there is no model used for any method of resource planning for radiation therapy. As
a result, when new technologies are introduced in Radiation Oncology, there is no quantification
of how the changes will affect the workload.
The Radiation Oncology department recently implemented Intensity Modulated Radiation
Therapy (LMRT) and needs a method for determining the necessary staff resources needed for
IMRT as the volume of cases treated with this method increases. The staff resources this project
focused on are: Dosimetrists, Physicists, and Therapists
The purpose of this project was to study Dosimetrist, Physicist, and Therapist workload for both
standard therapy and IMRT, and ultimately develop a way to relate the condition of a patient’s
treatment to the staffing resources needed. An accurate workload model was developed based on
data collected in this study as well as in previous studies. Additionally, the project team created
a Workload Measurement Tool that Radiation Oncology can use to determine resources needed
on an ongoing basis.
GOALS AND OBJECTIVES
To create a tool for measuring staff workloads, the following objectives were identified and met
during the project:
•
•
•
Develop a method for quantifying Dosimetrist, Physicist, and Therapist workload
Create a tool for measuring and updating workload as new technologies are implemented
Study the relationship between workload for standard therapy and IMRT
The student team first met with the project coordinator on Thursday, January 22, 2004, data
analysis ended on Thursday, April 22, 2004. During the data collection period of the project, the
team was unable to obtain a sufficient sample size. The team developed a Workload
Measurement Tool which can be used to complete the data collection and offer a method for
collecting workload data for any future therapy.
BACKGROUND
Standard radiation therapy refers to two types of therapy: two-dimensional and threedimensional. Two-dimensional (2D) therapy treats tumors on two axes. Three-dimensional (3D)
therapy uses three axes, and treats a tumor from 10 to 12 angles. Standard radiation therapy has
the following disadvantages, according to perceptions of Radiation Oncology:
•
•
Convex (complex-shaped) tumors are difficult to treat
Non-cancerous tissues can be subject to radiation
Radiation Oncology Workload Measurement Tool Development
Program & Operations Analysis, UMMC
Page 1
April 26, 2004
Thus, the Radiation Oncology department has introduced Intensity Modulated Radiation
Therapy. IMRT uses computer optimization to develop treatment plans in which a tumor can be
treated on three axes, from up to 100 angles. LMRT also uses a multi-leaf collimator (MLC)
which is part of the treatment equipment. The MLC contains moving leaves that dynamically
change shapes during treatment so the radiation beam can be modulated while the beam is on.
IMRT is preferred for the following reasons:
•
•
•
Complex-shaped tumor are easier to treat
Sensitive tissues surrounding the tumor are spared
Less dosage is needed in increased number of beams
However, the IMRT treatment method is perceived to be time-consuming, with a processing time
up to ten times greater than that of standard treatments based on perceptions of Dosimetrists and
Physicists. Specific tasks in which additional time is required for 1MRT are Treatment Planning,
Quality Assurance (QA), and Treatment. Table 1 gives a detailed definition of these tasks, as
well as the staff involved who performs the task.
Table 1: Key Task Definitions
Staff
Process
Treatment
Therapist
Treatment Planning
Dosimetrist
Quality Assurance
Physicist
Definition
Physical use of radiation on patient, begins with room
set-up and ends with clean-up
Definition of tumor and normal tissue volumes,
calculation of dosage, optimization of radiation in
areas of tumor
Verification of accurate treatment delivery as
compared to planned delivery
Compared to standard therapy, the time required to complete the IMRT-related tasks listed above
is perceived to increase by up to sixty times. However, complexity and tumor location also cause
increases in process times, regardless of what therapy is used. Location refers to the physical
location of a patient’s body where radiation is administered. Complexity, for this study’s
purpose, is measured in number of ports, segments, and fields. Table 2 defines these units.
Table 2: Definition of Complexity Terms
Measurement of
Complexity
Port
Segment
Field
Definition
The containment of one radiation beam
Division of a port, intense ports can be broken into two segments
Three-dimensional axis of a beamlet
An increase in number of ports, segments, and fields is used to spare sensitive, non-cancerous
tissue by focusing more angles of beams of less dosage on a tumor. Non-cancerous tissues like
the brain, spinal chord, and parotid gland, if affected, reduce quality of life following treatment.
IMRT and 3D therapies make a particular attempt to avoid these tissues, hence the increase in
demand for each.
Radiation Oncology Workload Measurement Tool Development
Program & Operations Analysis, UMMC
Page 2
April 26, 2004
According to a Physicist, UMHS handled 11 IMRT cases from January through December in
2003. The Manager of Operations, projects an increase to 145 cases in fiscal year 2005,
beginning in July 2004. This anticipated acceleration in demand for IMRT was the motivation
for this project.
SCOPE
The scope of this project consisted of the department of Radiation Oncology department of the
University of Michigan Health Systems in Ann Arbor. Only standard and IMRT therapies were
studied. In particular, the workload for Dosimetry, Physics, and Therapy were quantified. Figure
I outlines this scope.
Ann Arbor, MI
UMHS
Standard & IMRT Therapy
Workload for:
Dosimetry
Physics
Therapy
Figure 1: Project Scope
In addition to quantifying these specific workloads, the project team developed a Workload
Measurement Tool relating projected number of cases (per therapy type) and staff resources
required.
Radiation techniques such as brachytherapy and gamma knife were not included in this study.
Branches of UMHS in Providence, Novi, Jackson, Alpena, and Lansing were not studied. Also,
workload for Physicians was not directly quantified and was not included in the model.
PROJECT APPROACH
This project was performed in three phases: Data Collection, Data Analysis and
Recommendations. Details of these phases are outlined below.
Phase 1: Collected Data. The project team investigated various sources of data to determine the
current practices radiation therapy, both within and outside of UMHS. The following is a list of
the tasks completed in this phase:
•
•
•
Reviewed existing data staffing models at other hospitals
Conducted a literature search
Interviewed two Dosimetrists, two Physicists, one Therapist, two Physicians, and one
Resident Physician
Radiation Oncology Workload Measurement Tool Development
Program & Operations Analysis, UMMC
Page 3
April 26, 2004
•
•
•
•
Observed one Physicist, one Therapist, and one Resident Physician as they performed the
tasks being studied
Created flowcharts for major processes within Radiation Oncology
Developed data collection sheets
Distributed data collection sheets to Dosimetrists, Physicists, and Therapists
The Radiation Oncology department provided sources for benchmarking and the project team
conducted additional literature searches on the Internet. The team conducted interviews with
staff suggested by the client, and consisted of questions to further the project team’s
understanding of the radiation therapy processes. Observations were of similar nature to
interviews, and included detailed explanations of processes concurrent with tours and walk
throughs of the staff’s routines. Observations and interviews provided information for flowcharts
that were reviewed between the project team and Radiation Oncology staff. (See Appendix A).
The flowcharts depicted the overall process of therapy and these processes were captured in
detailed data collection sheets. The collection sheets, in addition to the processing time, took into
account various factors such as: CPI # (corporate patient identifier), date, visit number, machine
number, number of ports, fields, and segments, as well as spaces for multiple iterations. (See
Appendix B). The data collection sheets were distributed to Dosimetry, Physics, and Therapy
staff. The staff collected data for 21 working days. Data that was not properly captured or data
that was not captured at all will be accounted for in the Workload Measurement Tool introduced
later in this report.
Phase 2: Analyzed data. Data collection sheets were collected as soon as they were filled out
by the staff. The project team entered the data and used statistical as well as graphical tools to
analyze the data. The following are the major steps involved with Phase 2:
•
•
•
Updated and distributed data collection sheets when additional or different data was
needed
Created graphs and visuals of the current process
Statistically analyzed the data collected from data collection sheets
The purpose of the data analysis was to investigate the total process time for Dosimetry, Physics,
and Therapy. The project team used Microsoft Excel to compare the total time for each of these
three staffing areas for standard therapy and IMRT. Furthermore, the data showed how this time
was related to various aspects of the treatments such as the complexity (marked by number of
ports, fields, and segments) and tumor location. Table 3 below shows the breakdown of samples
collected for each of the therapies.
Table 3: Number of Samples Collected
Process
2D Therapy
3D Therapy
IMRT
2
0
4
8
0
31
6
4
17
Dosimetry
Physics
Treatment
Radiation Oncology Workload Measurement Tool Development
Program & Operations Analysis, UMMC
Page
4
April 26, 2004
Phase 3: Developed Recommendations. The project team used the data from Phase 2 to
develop conclusions and then recommendations based on these. An implementation plan and
user’s manual were also developed for the Workload Measurement Tool.
FINDINGS
The results of “Phase 1: Data Collection” are described below in detail and represent the current
state of UIVIHS’s Radiation Oncology department.
Literature Search
The project team consulted a study conducted by Palta & Ritz at the University of Florida in
2003 titled, “Radiation Oncology Physics Staff Variable Workload Estimating Worksheet.” The
study investigated the various contributions to workload for standard therapy and IMRT.
Although the team’s client advised that this study was in more detail than was necessary for this
project, the project team used the study for benchmarking. Figure 2 shows one result from Palta
and Ritz’s study: the mean time per procedure for treatment planning for 2D and 3D therapies
and IMRT.
10
8
1
IMRT
3-D
2-D
Source: Palta & Ritz, “Radiation Oncology Physics Staff Variable Workload Estimating Worksheet
April16, 2003
Figure 2: Treatment planning takes longer for IMRT than for standard therapy
The chart shows that IMRT takes almost twice as long to plan as standard therapy does. The
project team had limited access to this study and could not specify what was included in
“treatment planning” at the University of Florida.
A physicist from UMHS’s Radiation Oncology department attended a conference held at St.
Agnes Cancer Center in Baltimore Maryland. A presentation given there described the changes
required to implement IMRT at a hospital. Although UMHS has already instituted many of these
Page 5
Radiation Oncology Workload Measurement Tool Development
26, 2004
April
Program & Operations Analysis, UMMC
changes, St. Agnes suggested that two new cases per week of IMRT requires 0.5 1 FTE. This
is useful information for TJMHS as they plan to undertake three new cases of IMRT per week in
fiscal 2005. Additionally, the time required for treatment planning and quality assurance for
IMRT is two to ten times that of standard therapy.
—
Interviews
Interviews were held with various staff members at UMHS which helped the project team
understand the radiation therapy process as well as to quantify the department’s current practice.
Table 4: Perceived process times are longer for IMRT than for standard therapy
Process
Standard
IMRT
Dosimetry
3 seconds
1 hour
QA
10 minutes
10-12 hours
Treatment
10-20 minutes
45 minutes
Additionally, UMHS currently accepts only 1-2 new patients per week using IMRT because of
the constraints the method imposes on the staff resources.
Interviews as well as observations also demonstrated that there are processes within Dosimetry,
Physics, and Treatment that are not standardized. Lack of standardization is due to variation in
patient situation.
In more than one interview, subjects addressed the issue of down time due to computer
calculations. This included waiting for calculations, waiting for downloads, and searching for
files.
Flowcharts
Radiation Oncology staff walked through their individual processes with the project team.
Dosimetrists, Physicists, and Therapists interact in a way that was captured using multiple
flowcharts. The level of detail in these flowcharts is included so that the team would understand
the process and be able to create data collection sheets based on it. The total process is
represented in Figure 3.
Figure 3: Observed total treatment process
Patient consultation, treatment planning, and treatment all have detailed flowcharts in Appendix
A.
Radiation Oncology Workload Measurement Tool Development
Program & Operations Analysis, UMMC
Page 6
April 26, 2004
Data Collection
Information from the flowcharts was used to create data collection sheets that would give
multiple measurements of process times for Dosimetry, Physics, and Therapy. The data
collection sheets are in Appendix B. Data was collected for approximately six weeks. The
findings are outlined below categorized by process:
Dosimetry Findings
An example of the Dosimetry Data Collection Sheet can be found in Appendix B-i The total
Treatment Planning process was dissected into seven individual processes. These seven
processes were formed after original data collection. The Dosimetrists identified distinct
processes as being Contouring, Alignment, Expansion, Reviewing Volumes, Planning, Plan
Approval and VARIS Transfer. To simplify the collection sheet, minor processes were merged
into previously mentioned processes. Some examples of minor processes are listed in Table 4.
Table 4: Merging Minor Processes into Distinct Processes
Minor Processes Merged
Distinct Process
Contouring
Planning
Plan Approval
VARIS Transfer
Enter Normal Tissues, Enter Tumor Volume
Point Calculations, Optimizing Costs
Scripting
MUT Calculations, DRR’s, Vision, Charting
The Dosimetrists wrote down the start and end times of each process. A total process time was
then calculated from the difference between the two. The total times were then added together
and an average time for Treatment Planning was calculated. Figure 4 shows that IMRT requires
more time for IMRT than it does for standard therapy. The graph represents average total time
for the Dosimetrist to plan.
700
600
500
UI
I
IMRT
635 MIN
400
3D
199 MIN
300200
i00
2D
55M1N
0
Figure 4: Dosimetry takes longer for IMRT than for standard therapy
Radiation Oncology Workload Measurement Tool Development
Program & Operations Analysis, UMMC
Page
7
April 26, 2004
As Figure 4 shows, the calculation of dose requires an average of 635 minutes for an IMRT
patient, which is more than three times the time required of 3D (199 minutes) and 11 times that
of 2D therapy (55 minutes). One reason for this increase is the time necessary for the computer
to do optimization calculations. For the Treatment Planning process, a Dosimetrist enters
required data and waits for the computer software to calculate dose for IMRT. This wait time is
generally done overnight, while there is no Dosimetrist doing work for the patient. Figure 5
shows how much of planning time is used waiting for computer calculations.
195 MIN.
COMPUTER
495
28%OF
TOTAL
MIN.
72%OF
TOTAL
Figure 5: Planning: Computer Calculations Exceed Effort Time of Dosimetrist
Clearly, much time of the Planning process of the Dosimetrists is waiting for computers. In fact,
almost three out of every four minutes of planning time are spent waiting. Of the seven distinct
processes that make up Dosimetry Treatment Planning, two are characterized by computer
interaction. These are “Planning” and “VARIS”. Figure 6 shows that these two processes require
more time for IMRT than for standard therapies. Specifically, Planning takes almost 200 minutes
for IMRT, whereas 3D and 2D therapies require roughly 80 and 10 minutes, respectively. The
250% increase can be attributed to standard therapy’s independence of additional computer time.
250
E12DL13D!IJ
\(Q\S
G
Figure 6: Dosimetry individual process time is affected by JMRT
Radiation Oncology Workload Measurement Tool Development
Program & Operations Analysis, UMMC
Page 8
April 26, 2004
The increase in time required for Contouring should be noted. For JMRT and 3D, Contouring
takes 43 and 36 minutes, respectively. This process only takes 15 minutes for 2D therapy.
Additionally, Alignment and Expansion are not always done.
Physics Findings
Because IMRT is a new process at IJMHS and commercial software is not used, Quality
Assurance is much more rigorous for IMRT than for standard therapy. Standard therapy is more
established and QA is only composed of manually checking VARIS and the accuracy of data
transfers. This process was estimated by a Physicist to take about 10 minutes. A maximum time
of 15 minutes was given to the team. Hence, only IMRT was studied.
The Quality Assurance process for Physicists was studied similar to Dosimetry’s Treatment
Planning. A sample data collection sheet can be found in Appendix B-2. The major processes of
Quality Assurance were obtained from interviews and observations. Table 5 is a list of these
processes.
Table 5: QA Processes
[Process
QA Setup
Run Standard QA
QA Fields Setup
Conduct Ion Chamber Readings
Check Measurement Results
Setup for Filming Process
Take Films/Record Dynalogs
Prepare Films for Analysis
Convert Films to UMPlan
Create H&D Curve
Analyze Films
Create Dose Plots
Analyze Dynalogs
Just as the Dosimetry collection sheet was revised, the QA data collection sheet was revised
after one week of collection in order to obtain more accurate data. The Physicist recorded start
and end times for the processes listed in Table 5, in addition to time spent for any non-standard
communication. The start and end times were used to calculate a total time for each specific
activity, then these total times were added together to accumulate a total time for the entire QA
process. Figure 7 compares the total QA time for IMRT to the estimated time of 10 minutes for
standard therapy.
Radiation Oncology Workload Measurement Tool Development
Program & Operations Analysis, UMMC
Page
9
April 26, 2004
500
450
400
Ui
-
350
IMRT
430 MIN
300
Ui
250
200
-
-j
150
0
i_. 100
50
Standard
10 MIN
-
-
0
Figure 7: Average QA Process Time: IMRT vs. Standard
Quality Assurance requires an average 430 minutes to complete for IMRT, which is about 43
times that of standard therapy. It is important to reiterate that QA for IMRT is much more
rigorous than for standard because of its recent installation and because of the nature of the
IMRT process. Physicists and the Director of Administration have projected that once the
Radiation Oncology Department of UMHS becomes more experienced and the new equipment
and software have proven its validity, the QA process could become less rigorous.
Also, the numbers in Figure 7 do not include work done by the Chief Physicist. The workload of
the Chief Physicist would add approximately 150 minutes (2.5 hours) to the IMRT QA process.
This work includes the steps outlined in the flowchart in Appendix 3.lb.
The three processes that require the most time to complete during QA are those that deal with
films. Taking, preparing, and analyzing the films take 81, 119, and 52 minutes, respectively.
Figure 8 shows the times for all 13 processes of QA.
140
119
120
100
80
60LU
4O 19
20
—
0
81
52
6
5
—
—
16
18
36
34
.ilii
26
Figure 8: Individual Average Process Times of QA
Radiation Oncology Workload Measurement Tool Development
Program & Operations Analysis, UMMC
Page 10
April 26, 2004
Treatment Findings
Following the same methodology as Dosimetry and Physics, Therapists recorded start and end
times for the individual processes. These times were then summed to acquire a total process time
for Treatment. Figure 9 compares average total treatment times of IMRT to 2D and 3D therapies.
35
30
-
-
25
20
IMRT
29.27 MIN
w
p15-J
I.-
oI 10
-
50
2D
10.75 MIN
3D
12.67 MIN
Figure 9: Total Treatment Time
IMRT Treatment time averages 29 minutes, which is over twice as much as that for standard
therapies. From observations, the longer treatment time for IMRT appeared to be a result of
patient discomfort. Since IMRT is used for head and neck tumors, the patient generally has
materials and fluids placed in the mouth during treatment. The discomfort of the patient causes
treatment to stop intermittently, in order to allow the patient to swallow. IMRT was not used on
tumors outside of the head and neck area, so a decreased treatment time in other locations on the
patient could not be confirmed. Also, IMRT treatments are characterized by greater complexity.
The increase in ports, segments, and fields requires more time to be used for the physical
treatment. IMRT treatment averages 18 minutes, while standard treatments take 6 and 4 minutes
for 3D and 2D respectively. Figure 10 shows individual process times.
Radiation Oncology Workload Measurement Tool Development
Program & Operations Analysis, UMMC
Page 11
April 26, 2004
21
Cl)
LU
I
D
z
15
12
9
U)
U)
LU
Ci
0
0
6
3
0
se’
Figure 10: Individual Treatment Processes
CONCLUSIONS
Original perceptions of an increase in workload for IMRT are supported by findings as of April
22, 2004. Dosimetry, Physics, and Treatment all require more time for IMRT than for standard
therapy. Specifically, the major processes performed by these units of Radiation Oncology,
namely calculation of dose, quality assurance, and treatment, are extended by 1MRT.
Treatment planning requires 3 times the amount of time of Dosimetrists for IMRT than that of
3D therapy, and almost 12 times that of 2D. The Planning process of treatment planning sees the
largest increase for IMRT cases, increasing from 10 (2D) and 80 minutes (3D) to almost 200
minutes. The increase in planning can be attributed to computer wait time as well as increased
complexity. Seventy-two percent of Planning time is spent waiting for the computer to calculate
doses.
Physicists encounter a large increase in workload from standard to [MRT process. Quality
assurance requires an average of 430 minutes per IMRT case. This is 40 times the amount of
time verifying VARIS and that calculations are transferred correctly. Taking, preparing, and
analyzing films are the biggest contributors to the 430 minutes it takes to do QA.
Treatment of an IMRT patient requires twice as much time as standard therapy. Averaging
nearly 13 minutes for a standard therapy, a Therapist requires almost 29 minutes while treating
an IMRT patient. This difference is attributed to the discomfort of the patient while undergoing
treatment and the increase of treatment complexity. The physical administration of treatment
requires 3 times for time for [MRT than for 3D and 4 times more than 2D.
Radiation Oncology Workload Measurement Tool Development
Program & Operations Analysis, UMMC
Page 12
April 26, 2004
It is important to note that all findings and conclusions are based on an insufficient number of
data samples due to time constraints of the project. For treatment planning, only 16 samples were
obtained (10 standard, 6 IMRT). Five samples of quality assurance were gathered for IMRT,
while standard therapy was not studied. For treatment, 52 samples were collected (35 standard,
17 TMRT).
RECOMMENDATIONS
The team recommends the Department of Radiation Oncology of UMHS to continue collecting
data to add to current data until a confidence interval of 95% is achieved. In order to obtain mean
times, with a ±/- 15 minute range, the Radiation Oncology Department needs to gather 255 more
data samples for Treatment Planning, 46 more for QA, and 16 more for Treatment. Table 6 gives
a more detailed list of additional samples needed, according to therapy type.
Table 6: Number of Samples Needed for Mean +7- 15 Minutes with 95% Confidence Interval
IMRT
3-D
2-D
Process
Treatment Planning
Quality Assurance
Treatment
15
0
16
57
0
0
183
46
0
The Workload tool developed by the student team is designed to have the Department of
Radiation Oncology at UMHS enter in data collected from the three data collection sheets.
Coupled with expected volume and tolerance level, the Workload tool will display the following
information after each entry: person-minutes per patient, standard deviation, number of samples
taken, number of samples required, and total person minutes. The department of Radiation
Oncology can then use the previously mentioned outputs when determining staffing workloads
and requirements. Then the tool can be used to quantify other new treatments or other treatment
types utilizing a consistent data collection and analysis method.
ACTION PLAN
As mentioned earlier, the team recommends the Department of Radiation Oncology to continue
gathering data, in order to guarantee accurate statistics. Collection of data should continue
following the same approach the team used between March 15 and April 15, 2004. This
approach is described in detail in the above sections, entitled Approach. Data should be collected
using the existing data collection sheets for Dosimetry, Physics, and Treatment found in
Appendix A1-A3. This data should then be entered into the Workload tool developed by the
student team.
Figure 11 contains a display of the main page of the Workload tool. The user can choose
between 4 buttons: Update Dosimetry Data, Update Physics QA Data, Update Therapist
Treatment Data, and Go to Excel Output.
Radiation Oncology Workload Measurement Tool Development
Program & Operations Analysis, UMMC
Page 13
April 26, 2004
LI
Radiation Therapy Data Entry
For Cakulating WorklOad
System
Update Dosimetry Data
Update PhysIcs QA Data
I0pdate Therapist
LIrP.tJ
Goto Excel Output
Figure 11: Microsoft Access Main Startup Form
To enter data gathered regarding Treatment Planning, the user should click on the “Update
Dosimetry Data” button. This will immediately bring for the screen depicted in Figure 12.
DATA cLL
-
Dosimetry
Dontouring
CPI/VitNo
[___________________
j
Date (xx/xx/xxx)
oj
Alignment
Treatment Type
jIMRT
Expansion
Treatment Site
[
Review Volumes
I
nnit
Number Of Ports
Plan Approval
Number Of fields
Number Of Segments
[
I
L
I
Vans
Additinal Info
Figure 12: Dosimetry Data Entry Screen
Radiation Oncology Workload Measurement Tool Development
Program & Operations Analysis, UMMC
Page 14
April 26, 2004
The fields contained in this screen are the same as those on the data collection sheet for
Dosimetry. The user should then enter in the appropriate data from the collection sheet. After
entering data, the user can then click on “OK.”
Clicking on “OK” will pull up a second screen, entitled “Confirmation Form,” shown in Figure
13.
New Entry
Return To Main
Menu
Figure 13: Confirmation Screen
Clicking on the “Edit Entry” button brings the user back to the previous screen (in this case the
Dosimetry Data Entry screen), with the recently entered data still on the form. Clicking on this
button does not enter any data into the Microsoft Access database. However, clicking on the
“New Entry” button does enter the recently entered data into the database, while bringing the
user back to the previous screen. This screen allows for the user to enter another data sample.
The “Return to Main Menu” button will bring the user back to the main screen in Figure 11,
inputting entered data into the database.
From the Main Menu, the user can enter Physics QA data by clicking on the “Update Physics
QA Data” button the screen in Figure 14 will appear. This screen is similar to the Dosimetry
Data Entry screen in that it contains the fields from the QA data collection sheet.
Radiation Oncology Workload Measurement Tool Development
Program & Operations Analysis, UMMC
Page 15
April 26, 2004
DATA COLLECTION LOG SFEET
Physics QA Masrernent. Time Data
CPIfVisitNo
1
Date (xx/xx/xxxx)
Treatment Type
FRT
zJ
Minutes
QA Setup
0]
Run Standard
1
I
QA Fields Setup
Treatment Site
Ion hambér
Number Of Potts
Check Measurement
Number Of Fields
Setup For Filming
Additional Info
Take Films/Record Dynalogs
Prepare Films For Analysis
1
J__________
j
Convert films UMPIan
I
Create HCurve
Analyze l:Ilms
Create Dose Plots
Análye flynalogs
1
1
1
OK
Figure 14: Physics QA Data Entry Form
After entering data, the user then must click the “OK” button, which will bring up the screen in
Figure 13, which is explained above.
To enter Treatment data, from the main menu, the user must click on the “Update Therapist
Treatment Data” button. This will pull up the screen in Figure 15.
Radiation Oncology Workload Measurement Tool Development
Program & Operations Analysis, UMMC
Page 16
April 26, 2004
COLLECTION W(:
•
•
“•
•
Patient Treatmint
• Date (xx//xxxx)
I
I
Patient Setup
1
Treatment Machine #
1.: 1
Room Setup
I
Treatment Type
Treatment Site
On The Patient
Stop Time
Start Tkne
CP1/Vsit #
1
1
FrnIng
F
Treatment
I
Post Treatnient
I
I
I
AddIttonl Informalicin
Number Of Pots
Number Of Fields
Number Of Segments
I
•
OK
Treatment Number
Figure 15: Therapist Treatment Data Entry Form
Again, this form matches the data collection sheet. However, the Treatment Data Entry form
differs from the others, in that the start and stop time need to be entered. The Dosimetry and
Physics forms require the difference between the start and stop times to be entered. The “OK”
button should then be clicked on, and the choices are the same as explained before.
If the user wants to view the Workload tool, the “Go to Excel Output” button should be pressed.
This will open Microsoft Excel and display the Workload tool, as shown in Figure 16.
Radiation Oncology Workload Measurement Tool Development
Program & Operations Analysis, UMMC
Page 17
April 26, 2004
Personminutes per
patient
20
3D
MRT
Standard # Samples # Samples req’d Expected Total Personhours
Volume
(95% Cl.)
Taken
Deviation
.i7
0.00
4
20
0.00
123.58
8
65
0.00
16.74
10.22
31
Dosimetry
783.33
294.38
0.00
QA Measurements
422.60
95.89
0.00
Treatment
32.29
6.89
2x)
30
Dosimetry
55.00
7.07
2
Treatment
16.75
16.26
Dosimetry
201.00
Treatment
Tolerance Width: (+1- x mm
Calculate DosimetrYj
=
Calculate Physics
17J..
.
0.00
0.00
Calculate Treament
Figure 16: Workload Tool Excel Output
In the Excel sheet the user can officially enter all previously entered data (from the Access
database), into the appropriate Excel spreadsheet by clicking on the appropriate button,
“Calculate Dosimetry,” “Calculate Physics,” and “Calculate Treatment.” Clicking on any of
these buttons will also update the “Person-minutes per patient,” “Standard Deviation,” “Number
of Samples Taken,” and “Number of Samples Required” columns displayed in the Workload
Tool Excel sheet. The “Total Person-hours” column will also be updated, given that the
“Expected Volume” column has been filled in.
Another cell in which the user can enter information is the tolerance width cell. This allows the
user to specify the number of minutes, plus or minus, from the mean that are contained in the
95% Confidence Interval. Originally, the spreadsheet is set up for +/- 15 minutes (meaning 95%
of the time, the time required is the person-minutes per patient +1- 15 minutes). A detailed user’s
manual is given in Appendix C.
Radiation Oncology Workload Measurement Tool Development
Program & Operations Analysis, UMMC
Page 1 8
April 26, 2004