1
Final Design Review - Fall 2004
Autonomous Signal Strength Mapper
University of San Diego
Electrical Engineering Department
Submitted By
Matthew S. Dominick
Thomas J. Davis
Project Lead
Power Supply and Imagery Software
James D. Cervantes
Brandon K. Bailey
Micro-controller and GPS
Wireless Modem and PCB Layout
Faculty Advisors
Dr. Kathleen Kramer
Dr. Charles Pateros
December 3, 2004
Note: This document is best viewed in PDF format. All images are in color and references are hyper-linked. If this is a paper copy
the most recent electronic version can be obtained on the web at www.signalmaps.com.
ELEC 492
Autonomous Signal Strength Mapper
Fall 2004
Contents
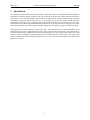
1
Introduction
3
2
Problem Statement
4
3
Market and Background
5
4
Technical Survey
6
5
Design Specifications
5.1 Deliverables . . . . . . . . . . . . . . . . . . . . . . . . . . . . . . . . . . . . . . . . . . . . . . . . . . . . . .
5.2 Parts . . . . . . . . . . . . . . . . . . . . . . . . . . . . . . . . . . . . . . . . . . . . . . . . . . . . . . . . . .
7
7
7
6
System Function
6.1 Micro-controller . . . . . . .
6.2 GPS . . . . . . . . . . . . .
6.3 Data Storage . . . . . . . . .
6.4 Signal Strength Measurement
6.5 LCD . . . . . . . . . . . . .
6.6 Data Mapping . . . . . . . .
6.7 Power Supply . . . . . . . .
7
8
9
.
.
.
.
.
.
.
.
.
.
.
.
.
.
.
.
.
.
.
.
.
.
.
.
.
.
.
.
.
.
.
.
.
.
.
.
.
.
.
.
.
.
.
.
.
.
.
.
.
.
.
.
.
.
.
.
.
.
.
.
.
.
.
.
.
.
.
.
.
.
.
.
.
.
.
.
.
.
.
.
.
.
.
.
.
.
.
.
.
.
.
.
.
.
.
.
.
.
.
.
.
.
.
.
.
.
.
.
.
.
.
.
.
.
.
.
.
.
.
.
.
.
.
.
.
.
.
.
.
.
.
.
.
.
.
.
.
.
.
.
.
.
.
.
.
.
.
.
.
.
.
.
.
.
.
.
.
.
.
.
.
.
.
.
.
.
.
.
.
.
.
.
.
.
.
.
.
.
.
.
.
.
.
.
.
.
.
.
.
.
.
.
.
.
.
.
.
.
.
.
.
.
.
.
.
.
.
.
.
.
.
.
.
.
.
.
.
.
.
.
.
.
.
.
.
.
.
.
.
.
.
.
.
.
.
.
.
.
.
.
.
.
.
.
.
.
.
.
.
.
.
.
.
.
.
.
.
.
.
.
.
.
.
.
.
.
.
.
.
.
.
.
.
.
.
.
.
.
.
.
.
.
.
.
.
.
.
.
.
.
.
.
.
.
8
8
10
10
11
12
12
15
Current Design Status
7.1 Schedule . . . . . . . . . . . . . . .
7.2 System Testing / Methodology . . .
7.2.1 Micro-controller . . . . . . .
7.2.2 GPS . . . . . . . . . . . . .
7.2.3 Data Storage . . . . . . . . .
7.2.4 Signal Strength Measurement
7.2.5 LCD . . . . . . . . . . . . .
7.2.6 Data Mapping . . . . . . . .
7.2.7 Power Supply . . . . . . . .
7.3 Printed Circuit Board . . . . . . . .
7.4 Product Casing . . . . . . . . . . .
7.5 Budget . . . . . . . . . . . . . . . .
.
.
.
.
.
.
.
.
.
.
.
.
.
.
.
.
.
.
.
.
.
.
.
.
.
.
.
.
.
.
.
.
.
.
.
.
.
.
.
.
.
.
.
.
.
.
.
.
.
.
.
.
.
.
.
.
.
.
.
.
.
.
.
.
.
.
.
.
.
.
.
.
.
.
.
.
.
.
.
.
.
.
.
.
.
.
.
.
.
.
.
.
.
.
.
.
.
.
.
.
.
.
.
.
.
.
.
.
.
.
.
.
.
.
.
.
.
.
.
.
.
.
.
.
.
.
.
.
.
.
.
.
.
.
.
.
.
.
.
.
.
.
.
.
.
.
.
.
.
.
.
.
.
.
.
.
.
.
.
.
.
.
.
.
.
.
.
.
.
.
.
.
.
.
.
.
.
.
.
.
.
.
.
.
.
.
.
.
.
.
.
.
.
.
.
.
.
.
.
.
.
.
.
.
.
.
.
.
.
.
.
.
.
.
.
.
.
.
.
.
.
.
.
.
.
.
.
.
.
.
.
.
.
.
.
.
.
.
.
.
.
.
.
.
.
.
.
.
.
.
.
.
.
.
.
.
.
.
.
.
.
.
.
.
.
.
.
.
.
.
.
.
.
.
.
.
.
.
.
.
.
.
.
.
.
.
.
.
.
.
.
.
.
.
.
.
.
.
.
.
.
.
.
.
.
.
.
.
.
.
.
.
.
.
.
.
.
.
.
.
.
.
.
.
.
.
.
.
.
.
.
.
.
.
.
.
.
.
.
.
.
.
.
.
.
.
.
.
.
.
.
.
.
.
.
.
.
.
.
.
.
.
.
.
.
.
.
.
.
.
.
.
.
.
.
.
.
.
.
.
.
.
.
.
.
.
.
.
.
.
.
.
.
.
.
.
.
.
.
.
.
.
.
.
.
.
.
.
.
.
.
.
.
.
.
.
.
.
.
.
.
.
.
.
.
.
.
.
.
.
.
.
.
.
.
.
.
.
.
.
.
.
.
.
.
.
.
.
.
.
.
.
.
.
.
.
.
.
.
.
.
.
.
.
.
.
.
.
.
.
.
.
.
.
.
.
.
.
.
.
.
.
.
.
.
.
.
.
.
.
.
.
16
16
16
16
17
17
18
18
18
19
19
19
20
User Manual
8.1 Supplying Power . . . . . . . .
8.2 Device Placement . . . . . . .
8.3 User Interface . . . . . . . . .
8.3.1 Layout . . . . . . . . .
8.3.2 Operation . . . . . . .
8.4 Data Mapping . . . . . . . . .
8.5 Routine Care and Maintenance
.
.
.
.
.
.
.
.
.
.
.
.
.
.
.
.
.
.
.
.
.
.
.
.
.
.
.
.
.
.
.
.
.
.
.
.
.
.
.
.
.
.
.
.
.
.
.
.
.
.
.
.
.
.
.
.
.
.
.
.
.
.
.
.
.
.
.
.
.
.
.
.
.
.
.
.
.
.
.
.
.
.
.
.
.
.
.
.
.
.
.
.
.
.
.
.
.
.
.
.
.
.
.
.
.
.
.
.
.
.
.
.
.
.
.
.
.
.
.
.
.
.
.
.
.
.
.
.
.
.
.
.
.
.
.
.
.
.
.
.
.
.
.
.
.
.
.
.
.
.
.
.
.
.
.
.
.
.
.
.
.
.
.
.
.
.
.
.
.
.
.
.
.
.
.
.
.
.
.
.
.
.
.
.
.
.
.
.
.
.
.
.
.
.
.
.
.
.
.
.
.
.
.
.
.
.
.
.
.
.
.
.
.
.
.
.
.
.
.
.
.
.
.
.
.
.
.
.
.
.
.
.
.
.
.
.
.
.
.
.
.
.
.
.
.
.
.
.
.
.
.
.
.
.
.
.
.
.
.
.
.
.
.
.
.
.
.
.
.
.
.
.
.
.
.
.
.
.
.
.
.
.
.
.
.
.
.
21
21
21
21
21
21
22
22
.
.
.
.
.
.
.
.
.
.
.
.
.
.
.
.
.
.
.
.
.
.
.
.
.
.
.
.
.
.
.
.
.
.
.
.
.
.
.
.
.
.
Personnel
23
A Full Campus Map with Data
24
B Project Schematic
25
C Printed Circuit Board Layout
26
D Prototype Pictures
27
E Source Code
E.1 C Source Code for PIC Micro-controller . . . . . . . . . . . . . . . . . . . . . . . . . . . . . . . . . . . . . . .
E.2 MATLAB Mapping Source Code . . . . . . . . . . . . . . . . . . . . . . . . . . . . . . . . . . . . . . . . . . .
28
28
32
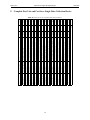
F Complete Part List and Cost for a Single Data Collection Device
36
1
ELEC 492
Autonomous Signal Strength Mapper
Fall 2004
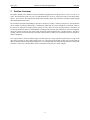
List of Figures
1
2
3
4
5
6
7
8
9
10
11
12
13
14
15
16
17
General System Block Diagram . . . . . . . . . . . . . . .
PICDEM 2 Plus Demo . . . . . . . . . . . . . . . . . . . .
Micro-controller Software Block Diagram . . . . . . . . . .
Garmin GPS 15L . . . . . . . . . . . . . . . . . . . . . . .
Rogue Robotics UMMC Serial Flash Module . . . . . . . .
Multitech GSM/GPRS Wireless Modem . . . . . . . . . . .
Data Mapping Software Block Diagram . . . . . . . . . . .
Datapoints collected during Tom’s Data Collection Bike Ride
Filter2 Rendered Plot of USD Campus . . . . . . . . . . . .
MATLAB Griddata Plot of USD Campus . . . . . . . . . .
Project Gantt Chart . . . . . . . . . . . . . . . . . . . . . .
Aluminum Control Panel CAD Layout . . . . . . . . . . . .
Final Project Aluminum Control Panel and Case . . . . . . .
Full Campus Map with Data . . . . . . . . . . . . . . . . .
Project Schematic . . . . . . . . . . . . . . . . . . . . . . .
Project PCB Layout . . . . . . . . . . . . . . . . . . . . . .
Project Casing Pictures . . . . . . . . . . . . . . . . . . . .
.
.
.
.
.
.
.
.
.
.
.
.
.
.
.
.
.
.
.
.
.
.
.
.
.
.
.
.
.
.
.
.
.
.
.
.
.
.
.
.
.
.
.
.
.
.
.
.
.
.
.
.
.
.
.
.
.
.
.
.
.
.
.
.
.
.
.
.
.
.
.
.
.
.
.
.
.
.
.
.
.
.
.
.
.
.
.
.
.
.
.
.
.
.
.
.
.
.
.
.
.
.
.
.
.
.
.
.
.
.
.
.
.
.
.
.
.
.
.
.
.
.
.
.
.
.
.
.
.
.
.
.
.
.
.
.
.
.
.
.
.
.
.
.
.
.
.
.
.
.
.
.
.
.
.
.
.
.
.
.
.
.
.
.
.
.
.
.
.
.
.
.
.
.
.
.
.
.
.
.
.
.
.
.
.
.
.
.
.
.
.
.
.
.
.
.
.
.
.
.
.
.
.
.
.
.
.
.
.
.
.
.
.
.
.
.
.
.
.
.
.
.
.
.
.
.
.
.
.
.
.
.
.
.
.
.
.
.
.
.
.
.
.
.
.
.
.
.
.
.
.
.
.
.
.
.
.
.
.
.
.
.
.
.
.
.
.
.
.
.
.
.
.
.
.
.
.
.
.
.
.
.
.
.
.
.
.
.
.
.
.
.
.
.
.
.
.
.
.
.
.
.
.
.
.
.
.
.
.
.
.
.
.
.
.
.
.
.
.
.
.
.
.
.
.
.
.
.
.
.
.
.
.
.
.
.
.
.
.
.
.
.
.
.
.
.
.
.
.
.
.
.
.
.
.
.
.
.
.
.
.
.
.
.
.
.
.
.
.
.
.
.
.
.
8
8
9
10
10
11
12
13
13
14
16
21
22
24
25
26
27
.
.
.
.
.
.
.
.
.
.
.
.
.
.
.
.
.
.
.
.
.
.
.
.
.
.
.
.
.
.
.
.
.
.
.
.
.
.
.
.
.
.
.
.
.
.
.
.
.
.
.
.
.
.
.
.
.
.
.
.
.
.
.
.
.
.
.
.
.
.
.
.
.
.
.
.
.
.
.
.
.
.
.
.
.
.
.
.
.
.
.
.
.
.
.
.
.
.
.
.
.
.
.
.
.
.
.
.
.
.
.
.
.
.
.
.
.
.
.
.
.
.
.
.
.
.
.
.
.
.
.
.
.
.
.
.
.
.
.
.
.
.
.
.
.
.
.
.
.
.
.
.
.
.
.
.
.
.
.
.
.
.
.
.
.
.
.
.
.
.
.
.
.
.
.
.
.
.
.
.
.
.
.
.
.
.
.
.
.
.
.
.
.
.
.
.
.
.
.
.
.
.
.
.
.
.
.
.
.
.
.
.
.
.
.
.
.
.
.
.
.
.
.
.
.
.
.
.
.
.
.
.
.
.
.
.
.
.
.
.
.
.
.
.
.
.
.
.
.
.
.
.
.
.
.
.
.
.
.
.
.
.
.
.
7
11
15
17
17
18
18
19
19
20
23
36
List of Tables
1
2
3
4
5
6
7
8
9
10
11
12
Project Completion Deliverables . . . . . . . . . .
GPGGA Data Stream Table . . . . . . . . . . . . .
Power Requirements . . . . . . . . . . . . . . . .
Micro-controller Tests . . . . . . . . . . . . . . .
GPS Tests . . . . . . . . . . . . . . . . . . . . . .
Flash Card Tests . . . . . . . . . . . . . . . . . . .
Cell Phone Modem Tests . . . . . . . . . . . . . .
Imaging Software Tests . . . . . . . . . . . . . . .
Power Supply Tests . . . . . . . . . . . . . . . . .
Budget . . . . . . . . . . . . . . . . . . . . . . . .
Personnel Task Distribution . . . . . . . . . . . . .
Parts List for One Complete Data Collection Device
2
.
.
.
.
.
.
.
.
.
.
.
.
.
.
.
.
.
.
.
.
.
.
.
.
.
.
.
.
.
.
.
.
.
.
.
.
.
.
.
.
.
.
.
.
.
.
.
.
.
.
.
.
.
.
.
.
.
.
.
.
ELEC 492
1
Autonomous Signal Strength Mapper
Fall 2004
Introduction
The information age has taken the Western World captive. Data reigns supreme. The populous demands instantaneous
information. The fastest growing companies in the past decade have been those that could provide the best information the fastest. One of the most notable is the Internet search engine Google. Google constantly crawls the Internet
with multiple “googlebots” that categorize and score every webpage for its keywords, relevance, and link popularity.
Google achieved great success by providing the largest amount of reliable data the fastest without a price to the user.
Their bottom line is fulfilled with plain unobtrusive advertisements on the right side of their web pages next to their
unbiased search results. This data has proved invaluable. People have been found to “google” just about everything.
This proposed project aims to follow a similar service path. The engineered device records mobile phone signal
strengths across a vast area. Additional data collection “bots” increase the data collection rate. The collected data is
processed and presented in a graphical format laid semi-transparently over a map. Ideally mobile phone users would
be able to access the information regarding cell phone carriers for their specific area via the Internet. The results would
be freely available and would provide the populous with a free tool to make more informed decisions regarding cell
phone service carriers.
3
ELEC 492
2
Autonomous Signal Strength Mapper
Fall 2004
Problem Statement
The public demands more detailed coverage information regarding their cell phone carrier’s service as well as it’s
rivals. The information needs to be easy to comprehend and easy to access. This project aims to solve these public
desires. To be effective the solution must rapidly and repeatedly gather large amounts of cell phone signal strength
data without much human effort.
The Autonomous Signal Strength Mapper provides a solution by creating a relatively inexpensive, mass-producible
device capable of working autonomously to continuously gather data as it moves through its environment. Many of
the devices are deployed on regularly moving vehicles in a city. Buses, taxi cabs, and pizza delivery vehicles are all
excellent potential host vehicles. Each additional recording unit increases the data collection rate. The device regularly
detects its current location on earth from a GPS unit and the signal strength from a cell phone modem. The data is
centrally collected from the small army of the data collection devices and is processed and presented in a format for
public consumption.
Once copious data is collected, analysis begins. The data points are merged together for placement on a map. Each
data point’s proximity to other points and the value of it’s measured signal strength is taken into account when the
data is colorized and placed with slight transparency over a standard map. The colorized maps allow the mobile phone
consumer to easily view a mobile phone carrier’s performance where they live, work, and play.
4
ELEC 492
3
Autonomous Signal Strength Mapper
Fall 2004
Market and Background
The data analysis provided by this device is in great demand. Over the twelve months that this project has been
underway, numerous ad campaigns have been run by mobile phone carriers touting their coverage and capability. Cingular uses slogan ”Raise the Bar” referring to the bars often seen on one’s mobile phone. Verizon has an obnoxious
spokesman who runs around asking: “Can you hear me now?” TMobile has recently announced the availability of
detailed coverage maps to customers online.
The advertising campaigns show that the wireless carrier’s realize the consumers care about their signal coverage and
reliability. However their attempts are not enough. The consumer demands greater knowledge about the service they
are receiving. TMobile appears to be rolling out detailed maps. However, these maps only show TMobile service
areas. Cingular and Verizon also claim to be working on similar consumer coverage mapping software [5].
It is known that all major cellular service providers have long employed signal strength mapping technology around
major urban areas. They not only monitor their own signal strength, but also those of competitors in order to always
have up-to-date service quality knowledge. However, they keep it proprietary and do not share it with other companies or the public. Even if Cingular and Verizon come out with similar service mapping services there will not be a
common standard between the carriers. The maps will most likely use different color standards and strength measurement techniques. The differences will not allow fair and direct comparisons between wireless carriers. A third party
evaluation technique is demanded by the consumer.
This project began before the wireless carriers announced their intent to provide coverage mapping to the public. However, their announcements in no way invalidate this project. An unbiased third party analysis can and will be provided
to the public.
5
ELEC 492
4
Autonomous Signal Strength Mapper
Fall 2004
Technical Survey
This project is a technically ideal senior design project. It showcases many of the skills learned in the USD Electrical
Engineering syllabus while remaining feasible within the time constraint of two semesters. The project has numerous
design challenges coupled with the project’s diverse design constraints. The major design challenges encountered as a
result of the constraints are described below.
Serial Communication This project uses a micro-controller that communicates serially with four different peripheral
devices. The chosen micro-controller (PIC 18F252) only has one hardware serial port. Three software serial
ports must be created. Each has varied parameters including baud rate and signal inversion. Additionally, each
peripheral has different instruction sets to understand and utilize. This variation across four devices is a difficult
design challenge to achieve on one small micro-controller.
Automated Mapping Software Mapping the data requires manipulation of complex matrices and image processing
in MATLAB. Recorded data must be calibrated to a matrix map and contoured to give it an understandable
appearance. Contouring data accurately involves many challenges such as interpolation and exponential decay
with distance.
Signal Strength Measurement The mobile phone signal strength is gathered by reading the RSSI (Received Signal
Strength Indicator) value from a cell phone modem. This requires requesting the information at regular intervals
and saving the returned value.
Location Tracking Each signal strength measurement requires a precise location data point. The points are taken
from a GPS that serially outputs latitude, longitude, and a valid data indicator. This data has to be received and
only saved if valid.
Data Storage The signal strength and location data has to be stored in a medium that is quick to save to and easy to
transfer from the micro-controller system to the data mapping software. A flash memory card module is used to
accomplish these requirements.
Status Updates The device autonomously collects the data but the user needs to periodically check on its progress. A
serial LCD is attached to the device for the user physically interacting with it. However, for remote management
the system responds to preset text messages. Specific commands sent in a text message will result in reply. For
example, sending the text message to the device saying “Status?” would result in the device replying in it’s own
text message with latitude, longitude, and current signal strength reading.
Printed Circuit Board The PCB had to fit on a 2.5” x 3.8” footprint. This small size and numerous non standard
connections make the PCB design challenging.
Power Supply The power supply must be suitable for the project. Because the unit is small, the power supply must
also be small, so as not to be the dominant feature. Also, because data collection sessions might take long
stretches of time, the power supply must have adequate total energy. Additionally, the power supply should be
compatible with an automobile power supply such as a cigarette lighter adaptor.
6
ELEC 492
5
Autonomous Signal Strength Mapper
Fall 2004
Design Specifications
This section outlines the required specifications that were specified and delivered by this project.
5.1
Deliverables
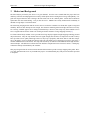
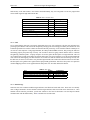
The deliverables have been organized in unique way. The first eight deliverables listed in Table 1 are required for this
project to be a success. The remainder of the deliverables are desired but are considered a bonus. It is felt that they are
accomplishable but are extraneous flashy displays of the value of the core project.
#
1
2
3
4
5
6
7
8
9
10
11
12
13
14
15
Table 1: Project Completion Deliverables
Objective
GPS data to flash memory at regular time intervals
Signal strength stored in flash memory at regular time intervals
System status viewable on LCD
Usable data available on flash memory card
MATLAB graphical interpretation of data (signal strength map)
Static website showing data maps
Usable and aesthetically pleasing user interface
Printed Circuit Board
Remote system status updated via text messaging
Data able to be retrieved remotely via cell phone modem
Dynamic web application showing map and data interface
Additional service provider for signal strength comparison
Live remote location tracking of sensor units
Live remote signal strength tracking
Live mapping of data resulting from live data link
Score
Required
Required
Required
Required
Required
Required
Required
Required
10 bonus points
20 bonus points
20 bonus points
15 bonus points
15 bonus points
15 bonus points
30 bonus points
Status
Complete
Complete
Complete
Complete
Complete
Complete
Complete
Complete
Complete
Incomplete
Incomplete
Incomplete
Impractical
Impractical
Impractical
All project required items were completed in addition to a 10 point bonus item. Project time constraints resulted in
not completing items 10, 11, and 12. Remote data retrieval was achievable through text messaging but the expense
in text messaging all the data when messages are limited to 160 characters was too great at $0.10 a message. Other
remote data transfer techniques are in testing, but are not far enough developed to be a success within the given time
contraints. GSM and GPRS wireless internet connections are complex to accomplish with only a PIC interfaced with
a cell phone modem. It is estimated that an additional two weeks of dedicated time would be required to develop these
technologies. Note however, the time restraints were appropriately considered when this project was first proposed
and remote data transfer was labeled a bonus item.
Items 13, 14, and 15 were determined to be possible but in fact an impractical use of the hardware. Adding the
capability to constantly report back each data point as it is collected to the central computer would slow the data
collection rate. Slowing the collection rate results in lower data resolution. On a truck moving at 65 MPH down the
freeway each second counts in data point resolution.
5.2
Parts
All parts necessary were acquired and successfully utilized. Table 12 in Appendix F lists all the parts and costs used
in the development of one prototype data collection device.
7
ELEC 492
6
Autonomous Signal Strength Mapper
Fall 2004
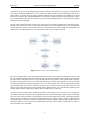
System Function
The goal of this project is to develop an autonomous signal strength recorder and the necessary software to analyze the
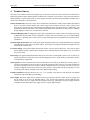
data and present it in a usable format. It is comprised of six major components: micro-controller, data storage, GPS
sensor, signal strength measurement, LCD, data mapping software, and power supply. The signal strength recording
device is block diagramed in Figure 1.
Figure 1: General System Block Diagram
6.1
Micro-controller
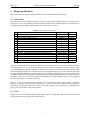
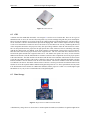
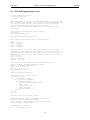
Figure 2: PICDEM 2 Plus Demo
A PIC 18F252 was selected as the micro-controller for the project. The project team has experience programming
on this chip at the assembly language level. However, the PIC-C software was utilized to write code in C for the
micro-controller. The CCS compiler has the capability to handle all of the needs of this project.
The micro-controller was initially installed and tested on a PICDEM 2 Plus Demo board and successfully programmed.
The PIC 18F252 has only one hardware serial port. There are four serial components to be interfaced. The hardware
serial port was utilized to communicate with the cell phone modem while three software serial ports were created to
8
ELEC 492
Autonomous Signal Strength Mapper
Fall 2004
communicate using some of the additional pins available on the PIC. The hardware serial port sits on pins RC6 and
RC7 which goes through a MAX232A to convert from TTL to RS-232 serial levels for communication with the cell
phone modem. A software serial port sitting on Pins RC4 and RC5 also goes through the same MAX232A to output
RS-232 levels with the GPS. Pins RB4 and RB5 are also made into a software serial port and communicate on TTL
levels with the flash memory card. The fourth serial port, also achieved through software, is only used for transmitting
updates to the LCD on Pin RB0.
The PIC reads in location and time from the GPS. It then retrieves the signal strength from the cell phone modem.
This data is then placed in a row in a comma-separated-variable (CSV) file on the flash memory card. The GPS feeds
location data every second, so each second results in a new location and a new signal strength value being added to an
additional row in the flash memory file. The current status of the system is output to the LCD.
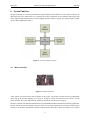
Figure 3: Micro-controller Software Block Diagram
The process described above is the main operational mode of the PIC micro-controller for this project. However, the
PIC is programmed to digress from its data collection mode into a data communication mode. When the user first turns
the device on the LCD prompts the user for specific data collection setup options. These options include requesting
the number of data points to collect as well as the data collection rate. The user selected options are saved as variables
and checked throughout the data collection mode. Once set to collect data the device will record data points until the
specified number have been obtained. When this occurs the device will send a text message either to the user’s cell
phone or AOL instant messenger account regarding its data collection status. The current latitude, longitude, signal
strength, and the number of data points collected will be contained in the text message.
The PIC can also go into the remote communication mode if a text message is sent to the device via a cell phone or
AOL Instant Messenger. The PIC has been programmed to detect specific incoming messages and reply accordingly.
The exact syntax of these messages is not posted here in order to prevent others from remotely requesting information
from the device. An example text message command sent to the device could be ”Status?” The PIC would detect this
message through the cell phone modem and respond with it’s latitude, longitude, signal strength, and the number of
data points collected. A few other message commands have also been created. Software version and error codes are
current examples of text commands.
9
ELEC 492
Autonomous Signal Strength Mapper
Fall 2004
Figure 4: Garmin GPS 15L
6.2
GPS
A Garmin 15L-Flex OEM GPS unit model, seen in Figure 4 is used to receive location data. There are two types of
OEM units in the 15 series, the 15L and 15H, each provide very accurate readings along with low power consumption.
These two units are similar in every aspect except for the voltage needed to run the units themselves. The input voltage
for the 15H unit is 8.0Vdc to 40Vdc with the input current ranging from 15mA to 60mA compared to the 15L being
3.3Vdc to 5Vdc and 85mA to 100mA of current. The choice to use the Garmin 15L was easy considering that the rest
of the components involved in the project use fairly low input voltage and draw about the same amount of current.
The 15L unit purchased for the project has an eight pin LIF Flex Cable connector, however interfacing and testing
with the flex cable became very difficult, so the group created its own homemade version of the 15L wire connector.
This GPS unit is ideal for the project because of its weight and size. The size of the GPS unit is about the same as
an American quarter and the unit weighs less than 0.50 oz. The Garmin 15L operates at a variety of user selectable
NMEA 0183 baud rates, but the default baud rate of 4800 is used since other components used in our project operate
at the same baud rate. The GPS unit has been interfaced with the PIC micro-controller and software has been written
so that the only NMEA sentence read serially is $GPGGA. This sentence provides longitude and latitude, and also
indicates whether or not our GPS has a true fix on an active satellite. The GA27C antenna is used with our Garmin
15L GPS unit. The GA27C has a BNC connection but a converter is used to get to the MCX connection found on the
Garmin 15L. It has the required 10dB to 30dB electrical gain and operates at 3.3V. These specifications not only make
it the ideal antenna for the Garmin 15L OEM sensor GPS unit, but the project as a whole. It is a small, light weight
antenna that is very easy to move around and secure when gathering data.
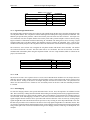
6.3
Data Storage
Figure 5: Rogue Robotics UMMC Serial Flash Module
A flash memory storage device is used to store a comma separated variable (CSV) database of signal strength and its
10
ELEC 492
Autonomous Signal Strength Mapper
Field
Sentence ID
UTC Time
Latitude
N/S Indicator
Longitude
E/W Indicator
Position Fix
Satellites Used
HDOP
Altitude
Altitude Units
Geoid Seperation
Seperation Units
DGPS Age
DGPS Station ID
Checksum
Terminator
Fall 2004
Table 2: GPGGA Data Stream Table
Example
Comments
$GPGGA
92204.999
hhmmss.sss
4250.5589
ddmm.mmmm
S
N = North, S = South
14718.5084 dddmm.mmmm
E
E = East, W = West
1
0 = Invalid, 1 = Valid SPS, 2 = Valid DGPS, 3 = Valid PPS
4
Satellites being used (0-12)
24.4
Horizontal dilution of precision
19.7
Altitude in meters according to WGS-84 ellipsoid
M
M = Meters
Geoid seperation in meters according to WGS-84 ellipsoid
M = Meters
Age of DGPS data in seconds
0
*1F
CR/LF
accompanying time and location. It is easily removed and transported to a PC for upload into the mapping software
if the automated call home modes are not available. The device used is manufactured by Rogue Robotics. Communication with the device is accomplished serially. A command line instruction set was created by Rogue Robotics.
The instruction set is simple but powerful enough to allow many different uses. The micro-controller software has
been written to communicate effectively with the flash card reader/writer. Specific subroutines for the PIC have been
developed by the team for use with the flash card device.
6.4
Signal Strength Measurement
Figure 6: Multitech GSM/GPRS Wireless Modem
The focus of this project is to determine signal strengths of different cellular providers. Signal strength is measured
on a cell phone with the RSSI (Received Signal Strength Indication) value ranging from 0 to 31. An RSSI value of
0 indicates a strength of -113dBm or less, and RSSI value of 1 to 30 indicates a strength -111dBm to -53dBm, and
an RSSI value of 31 indicates a signal strength of -51dBm or greater. A signal from 0-10 is deemed insufficient. The
greater the RSSI value the better the chance of a good connection and fewer dropped calls.
The Multitech modem is a general purpose wireless modem capable of performing many of the same functions as a
11
ELEC 492
Autonomous Signal Strength Mapper
Fall 2004
cell phone. More importantly for this project, it is capable of measuring an RSSI value and sending it serially to a
micro-controller. In the device, the modem receives a command from the PIC called an AT(tention) command. The
command, “AT+CSQ” is the AT command that returns the measured signal strength. The operation is much faster than
the refresh rate of the GPS and therefore will not decrease the rate of data collection.
6.5
LCD
An LCD is serially interfaced with the PIC as well. It is used by the device mainly during setup before initiating data
collection. Text is presented on screen to let the user know about the device’s current operations. The power source is
hardwired to a switch on the control panel so that when not in use the LCD can be shut off without affecting the rest
of the system. This allows the device to continue to collect data without losing battery power to the LCD when it is
unnecessary.
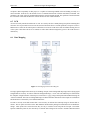
6.6
Data Mapping
Figure 7: Data Mapping Software Block Diagram
To image signal strength on the University of San Diego campus, both a background map image and overlying signal
strength data are necessary. In order to obtain the background image, a 17x11 inch scale USD map was scanned into
the computer at high resolution. This map was converted to a “jpeg” image and imported into MATLAB using the
“imread” command. The result is a background image of USD in which the dimensions of the campus are scaled down
and locations are referenced by a two-dimensional matrix.
In order to correctly scale GPS location data it was necessary to calibrate the USD map using two known GPS locations. The two points selected were the West Entrance Kiosk and the parking lot turnaround circle in Manchester
Village. These points were selected because they are easy to visualize on the map and are far apart. The farther
apart the calibration points are, the more likely it is that the data scaling will be accurate. Absolute GPS latitude and
12
ELEC 492
Autonomous Signal Strength Mapper
Fall 2004
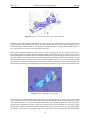
Figure 8: Datapoints collected during Tom’s Data Collection Bike Ride
longitude, as well as MATLAB row and column, were found for these two points. From these, vertical and horizontal
scaling constants for the actual data were derived. In order to match points, the software computes distances from the
West Kiosk, applies scaling constants to those distances and shifts the data to its appropriate MATLAB location. In
tests, sample points were found to be accurate within a few meters.
GPS location and signal strength data will be saved to a file by the mapping device. The imaging software accepts
tab-delimited columns of longitude, latitude, and signal strength. MATLAB separates these columns into vectors and
latitude and longitude are shifted using the aforementioned scaling code. Signal strength now assumes values only at
the points at which it was recorded. These points can be plotted over the USD map to ensure location match. A map of
all recorded data points for a comprehensive USD test is shown in Figure 8. However, to create a useful signal strength
representation, it is necessary to interpolate between points, to create a continuous map. Three different methods are
employed for this crucial step. Each method has positive and negative aspects in terms of accuracy and computing time.
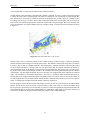
Figure 9: Filter2 Rendered Plot of USD Campus
The least accurate, but fastest method of data contouring is a two dimensional filter. A matrix of zeros is created with
peaks at locations that correspond to collected data. The MATLAB command “filter2” convolves this map of peaks
with a square matrix of ones, which is a Gaussian low-pass filter. This smoothes the peaks and creates continuously
contoured data. This method is good for a quick view of collected data, but it has fatal flaws in its portrayal. Closely
spaced points are additive in this method and therefore data reflects density of points as much as it does signal strength.
For example, a dark red spot corresponding to high value could represent either strong signal strength of high density
13
ELEC 492
Autonomous Signal Strength Mapper
Fall 2004
of any strength data. A sample map from this function is shown in Figure 9.
Another method of data contouring is the MATLAB “griddata” command. It creates a contour of data that is shaped
to assume all known values of signal strength. The result is a continuous, color contour map of signal strength data.
This method takes a few minutes to compute the full map of USD and is fairly accurate. However, “griddata” creates
a streaking effect in many cases due to the fact that it interpolates points from recorded points that are too far away
from it. Also, this method is programmed to assume all recorded values of signal strength. This creates an image with
severe discontinuities if the signal suddenly drops out or changes rapidly. A sample map from this function is shown
in Figure 10.
Figure 10: MATLAB Griddata Plot of USD Campus
Because neither of the two previous methods creates a highly accurate or attractive map, a customized contouring
function for highly detailed images was created for this project. This method is dead accurate but it takes several hours
to render a map of USD on a standard 2GHz PC. This method uses a weighting function in which weights of data
are given based on distance to a specific point. For each pixel on the map, the program determines the distance to
each recorded data point. If this distance is less than a user-defined radius, the data point is given a weight equal to
the product of the recorded signal strength, distance to the recorded point and an exponential decay that is a function
of the distance. The final signal strength at the pixel is the mean of all weighted data points within the user-defined
radius. Also included is a user-defined “falloff factor.” This value is a coefficient in the exponential distance decay
function and sets the weight of distant data points. The method works well because it does not necessarily assume the
recorded strength value at its recorded location. Instead, the data is much smoother and does not overreact to spurious
points. A resulting map from this customized function is shown in Appendix A.
Once the program contours the data, further contouring is necessary in order to present the data in an understandable
manner. Several discreet colors are chosen to represent ranges of data. This creates an “islands of strength” image
that is typical of a contour map. Once the data map is created, it is made semi-transparent and superimposed onto the
background USD map to create a useful signal strength map. Additionally, a high quality version of the data map can
be sent out as an image file and processed with third party software such as Adobe Photoshop.
14
ELEC 492
6.7
Autonomous Signal Strength Mapper
Fall 2004
Power Supply
Since the device will likely be run from a car’s 12V battery, the simplest solution for a power supply is the DC cigarette
lighter adaptor. A LM340-5 is used to step down the 12-volt source to 5-volts. Approximate power requirements of
the system are shown in Table 3. All other components will be powered by a single 5-volt regulator. Setup in this
configuration, the voltage regulator will never receive more than one ampere of current which is its maximum rated
current. The car’s electrical system has more than enough power to power the system. The device can also be made
more portable with batteries. Any combination of batteries that creates more than 9 volts is sufficient. To maintain
small size, the default batteries are size AA. Put into a six-battery holder, the pack takes up little space in the system
container. In tests, the AA batteries collected data for three hours straight without replacement.
For protection against reverse bias of the power supply, a diode bridge is installed at the power input. This creates an
initial voltage drop of 1.5 volts. For this reason, the minimum operable voltage is 7 volts. The maximum input voltage
is 35 volts and is set by the LM340-5. In addition the diode bridge there are several smoothing capacitors and an LED
to indicate power.
Device
Cell Phone Modem
GPS chip
Flash memory
PIC and misc. chips
Table 3: Power Requirements
Voltage Operating Current
5-32V
400mA @ 5V
3.3-5.4V
85mA @ 3.3-5.0V
5V
100mA @ 5V
5V
100mA @ 5V
15
Peak Current
2A @ 5V
100mA @ 3.3-5.0V
200mA @ 5V
200mA @ 5V
ELEC 492
7
Autonomous Signal Strength Mapper
Fall 2004
Current Design Status
The project progressed on schedule. A working prototype was successfully tested and developed. The device retrieves
signal strength from the modem and location from the GPS. It then stores it on the flash card. The data has been
successfully retrieved from the card and imports into Microsoft Excel and/or MATLAB. The USD campus has been
thoroughly sampled by Tom Davis on bicycle with the device running on battery power in his backpack. Below you
will find project schedule information and details regarding the current state of each section of the project.
7.1
Schedule
The project is following the developed Gannt Chart. Small changes have been made in minor task assignments but
major tasks have remained true to plan. Team member task distribution is seen later in Table 11 which is part of the
personnel section.
Figure 11: Project Gantt Chart
7.2
System Testing / Methodology
Numerous tests have been conducted in each area of design. A short summary and a table summarizing tests are
available for each design element.
7.2.1
Micro-controller
The first half of the Fall semester focused on using the PICDEM 2 Plus Demo Board to develop software to interact
with the peripheral components. The capabilities of the PIC were tested first. There are four interfaced serial components.
Each serial component was first tested with HyperTerminal. The devices were then each tested with their own uniquely
written PIC software to test features and develop interfacing solutions. Once solid software techniques were developed
for each component they were integrated one at a time with each other. The modem was integrated with the PIC and
the flash to store signal strength at regular intervals on the flash card. The GPS was then integrated with the PIC and
16
ELEC 492
Autonomous Signal Strength Mapper
Fall 2004
flash memory in the same manner. Once both worked individually, they were integrated to create one program that
retrieved both signal strength and location data.
Table 4: Micro-controller Tests
Test
Status
Completion
PIC Serial Communication
Pass
September 18, 2004
Modem and PIC
Pass
September 24, 2004
GPS and PIC
Pass
October 2, 2004
Flash and PIC
Pass
October 8, 2004
PIC Multiple Port Serial Communication Pass
October 11, 2004
Working Prototype
Pass
October 20, 2004
Working PCB Prototype
Pass
November 5, 2004
Working PCB II Prototype
Pass
December 1, 2004
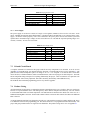
7.2.2
GPS
To be certain that the GPS unit was properly functioning, three tests were performed. The first test performed was
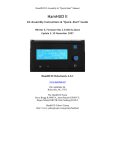
powering up the GPS unit. This tested was completed by setting up the circuit design provided by the Garmin 15L/15H
Technical Specifications. In order to make sure that the GPS was powered up, it was interfaced with the COM1 port of
one of L207’s lab computers. Using HyperTerminal, the GPS provided NMEA sentences, thus proving the GPS was
functioning properly and powered up correctly. The second test done was going outside with the GPS (w/ antenna)
and gathering valid data points. A laptop computer was used to gather the data points via HyperTerminal. This test
was completed successfully and to make sure that the data points were in fact valid, they were placed in the MATLAB
code used in our data mapping. The final test done was to make sure that the antenna was also working correctly. For
this final test, the same test from above was performed again but this time without the antenna connected to the GPS.
The data points were gathered once again with the laptop and HyperTerminal. Once these data points were placed in
our Data Mapping software it was apparent that the data points were not valid without the antenna.
Table 5: GPS Tests
Test
Status
Power GPS
Pass
Retrieve Data from GPS with Antenna Pass
Antenna Test
Pass
7.2.3
Completion
September 24, 2004
October 8, 2004
October 8, 2004
Data Storage
Numerous tests were conducted with the Rogue Robotics serial flash card reader and writer. These tests were initially
done via HyperTerminal to become familiar with the Rogue Robotics flash card reader/writer instruction set. Once
familiar with the interface procedures, specific PIC software in the form of subroutines were developed to handle
communication with the flash memory. Table 6 summarizes tests and results.
17
ELEC 492
Autonomous Signal Strength Mapper
Table 6: Flash Card Tests
Test
Status
HyperTerminal Interface Testing
Pass
PIC Software Testing
Pass
Save Data from GPS
Pass
Save Data from Modem
Pass
Save Data from GPS and Modem Pass
7.2.4
Fall 2004
Completion
September 24, 2004
October 8, 2004
October 10, 2004
October 12, 2004
October 20, 2004
Signal Strength Measurement
The signal strength component of this project has one goal in mind, having the PIC micro-controller communicate with
our cell phone modem. The cell phone is connected through serial and operates using AT(tention) commands. The
hardware part presented few problems, whereas the software part took a little more time to achieve. Two major tests
were conducted. First, the cell phone modem was tested by itself with a personal computer. This was done by using
Hyper Terminal to communicate with the modem using AT commands. The main goal was to test receiving a signal
strength reading from a cell phone modem, also familiarize ourselves with the AT commands. Also, a side test was
conducted successfully that proves the cell phone modem can communicate with an instant messenger program (AIM).
The second test, was a software test to integrate the cell phone modem with the PIC micro-controller. The modem
was connected to the PIC via serial. The reset button was set as a call button. This test was successful, as the PIC
communicated with another phone using the cell phone modem. The AT +CSQ command, which is essential to the
project, also worked well.
Table 7: Cell Phone Modem Tests
Test
Status
Modem calls with HyperTerminal AT commands Pass
Modem calls w/ PIC
Pass
Modem retrieving data
Pass
7.2.5
Completion
September 17, 2004
October 8, 2004
October 15, 2004
LCD
The chosen LCD was a more expensive choice as it uses serial communication. Parallel LCD’s are cheaper but more
difficult to interface both in software and in the physical number of lines required on the PCB. For this reason a serial
LCD was chosen. Testing of this device was simple and quick and does not warrant a table. The particular LCD
chosen uses inverted TTL levels. Characters were successfully written to the device with the command provided in
it’s manual.
7.2.6
Data Mapping
To create the imaging software, three specific milestones had to be met. First, the map had to be calibrated to GPS
data. This was tested by walking down the sidewalk and recording several GPS points at known geographical locations.
Once these data points were entered into the computer, their correspondence to map location was examined. This test
was successful, as the GPS mapping is accurate to a few meters. The next milestone to be met was verification that
signal strength at known locations can be represented with colored coded dots. This was tested by creating sample
signal strength data at the GPS locations from the previous test. By zooming in on the map in MATLAB, it was clear
that data was presented in color coded form. The last test was to map signal strength data as a continuous contour. This
was tested by setting the sample signal strength to follow a known pattern of increasing and decreasing signal strengths
along a linear path. This test was successful and testing for the imaging software, at this stage of development, was
complete.
18
ELEC 492
Autonomous Signal Strength Mapper
Fall 2004
Table 8: Imaging Software Tests
Test
Status
Completion
GPS Map Calibration
Pass
Spring 2004
Signal Strength Point Verification Pass
September 10, 2004
Continuous Contour Mapping
Pass
September 24, 2004
1st Data Mapping Run
Pass
October 27, 2004
Full Data Mapping Run
Pass
November 15, 2004
7.2.7
Power Supply
The power supply for all devices consists of a single 5-volt regulator (TM340-5) from a twelve volt source. Each
device, including development board, flash memory, cell phone modem, and GPS chip, were connected to the power
supply. All devices worked properly. Power was connected to the power pins in reverse bias and the system still
operated due to the diode bridge. Voltage was also varied from 0 to 25 volts and the expected operating ranges were
verified (7-25VDC). All tests were successful.
Table 9: Power Supply Tests
Test
Status
Completion
Development Board
Pass
October 8, 2004
Flash Memory
Pass
October 8, 2004
Cell Phone Modem
Pass
October 8, 2004
GPS Chip
Pass
October 15, 2004
Reverse Power Inputs
Pass
November 16, 2004
Voltage Varied from 0-25VDC Pass
November 16, 2004
7.3
Printed Circuit Board
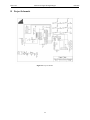
A complete schematic was drawn for this project and all necessary components were included. It can be seen in
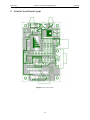
Appendix B. The PCB layout was designed from the schematic. The final PCB layout is seen in Appendix C. The
printed circuit board accomplishes quite a few things in its 2.5” x 3.8” footprint. It is laid out like a central hub
where the GPS, Cell Phone Modem, Flash Card Reader/Writer, and LCD all plug in for data and power. The PCB
and its components bring in and put out everything demanded by the project. Click in connectors were placed at each
connection point with exterior peripherals. This makes assembly, disassembly, and modification easy.
The PCB also has an onboard programming port for easy software upgrades.
7.4
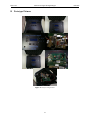
Product Casing
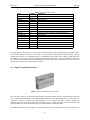
All of the hardware for the project is contained in a Pelican watertight protective case. The heavy duty case was chosen
because it is expected that the device will undergo heavy abuse while is transported around a city. The case if filled
in with customizable foam cut to hold components. The GPS antenna is attached to the outside rear of the case via a
bulkhead mounting BNC connector. On the inside a MCX to BNC conversion cable connects the GPS to the bulkhead
BNC connector.
A custom aluminum panel has been designed to fit in the case. The panel has cutouts for switches and the LCD. There
is an additional cutout for the programming port. This allows the device to reprogrammed without disassembly. The
project and group member names are engraved in the aluminum. The product casing can be view in Appendix D.
19
ELEC 492
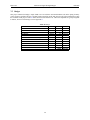
7.5
Autonomous Signal Strength Mapper
Fall 2004
Budget
This project remained on budget. Ample funds were received from Associated Students (AS) in the Spring for many
of the expensive purchases like the cell phone modem and GPS. In the Fall semester AS again contributed covering
the remainder of the project. Table 10 shows all items used and their cost. The PCB components are grouped together
in this list, however a full listing is seen in Appendix F.
Table 10: Budget
Part
Cost
PCB
$20.94
4-Line Serial LCD
$59.00
LCD Faceplace Kit
$12.00
PCB Parts
$46.96
Pelican Case
$44.00
Control Panel Frame Mounting Bracket
$7.00
Aluminum Control Panel
$67.00
Garmin OEM GPS15L-F
$98.25
GPS Antenna
$59.95
GSM/GPRS Multitech Cell Phone Modem $250.00
uMMC Serial Flash Card Module
$86.82
20
Quantity
3
1
1
n/a
1
1
1
1
1
1
1
Total:
Total
$62.82
$59.00
$12.00
$46.96
$44.00
$7.00
$67.00
$98.25
$59.95
$250.00
$86.82
$793.80
ELEC 492
8
8.1
Autonomous Signal Strength Mapper
Fall 2004
User Manual
Supplying Power
This device is capable of accepting a wide range of voltages (7.5 - 25 VDC) to accommodate the various power supplies
available to the user. Adapters can be ordered from the designers including an vehicle cigarette lighter adapter.
8.2
Device Placement
The device case can be placed anywhere on the moving vehicle as long as the GPS cable (6 ft) can reach a location
where the antenna will have a clear view of the sky. One example use has the device between the front passenger seats
with the antenna placed on the dash looking up through the windshield.
8.3
8.3.1
User Interface
Layout
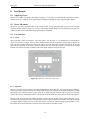
This project has a simple user interface. The CAD layout is seen in Figure 12. It is designed to be an autonomous
device so its interface is simple. There are three standard switches and five momentary switches that accompany the
LCD. The three standard switches are found to the right of the LCD. These three switches control from left to right
data collection start/stop, LCD On/Off, and Power On/Off. The five momentary buttons are located on the left and
bottoms sides of the LCD. These coordinate with menu options displayed on the LCD screen.
Figure 12: Aluminum Control Panel CAD Layout
8.3.2
Operation
There are two choices before turning on the signal strength mapper for the first time. If powered up with the Start/Stop
switch in the Start position then the device will immediately begin collecting data in its default configuration. 28800
data points will be collected (8 hours of data collection) at which point data collection will cease and a text message
will be sent to the user indicating the number of data points collected and the device’s location in latitude and longitude.
However, if the device is turned on with the Start/Stop switch in the Stop position the user will be allowed to set various data collection parameters before initiating data collection. There features are presented in the LCD and include
varying the number of data points to be collected, frequency of collection, and text message report periodicity. Once
the settings have been made the data collection can be started with the Start/Stop switch.
21
ELEC 492
Autonomous Signal Strength Mapper
Fall 2004
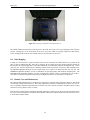
Figure 13: Final Project Aluminum Control Panel and Case
The middle standard switch directly controls power to the LCD. This exists to save power during the data collection
periods. Cutting power to the LCD allows the device to save power which is especially important if under battery
power. Turning off the LCD saves the 100mA drawn by the LCD when it is powered.
8.4
Data Mapping
If a map is to be created of a region for the first time, the user must know the GPS locations of two points on the
map, in order to calibrate the data. Once this is complete, the user must specify the comma separated variable file
that contains the signal strength data. Data will automatically be calibrated to match the background map. At this
point, the user can select between three contouring options based on preference for accuracy and computing time.
The FILTER2 algorithm should be used for a quick-check view of data. It is rather inaccurate, but very fast. The
GRIDDATA algorithm should be used for a combination of fair image quality and moderate computing time. The
EXPONENTIAL algorithm should be used only for high quality images of data as computation time is extensive.
After data is contoured and quantized, the map will be displayed on the screen and output as an image file.
8.5
Routine Care and Maintenance
The signal strength mapping device is designed to be rugged as it is constantly being transported. However, this should
not encourage careless use of the device. The casing is guaranteed for life by its manufacturer, Pelican. Any case defects or breakages should be reported directly to Pelican. For issues with the electronic components please contact
customer service by phone at (619) 917-0952.
Keep all surfaces clean and free from harsh chemicals and abrasives. Make sure the lid is securely clasped shut when
the device is out collecting data. Periodically check the BNC GPS cable to antenna connection at the rear of the device
to ensure that it remains sealed.
22
ELEC 492
9
Autonomous Signal Strength Mapper
Fall 2004
Personnel
The Autonomous Signal Strength Mapper project proposal was selected for continuation in the Spring 2004 semester.
The reviewing faculty and industry members chose to add two more members to the project. The addition of new
group members resulted in a call for a personnel and slight project realignment for the Autonomous Signal Strength
Mapper. Each member has been assigned a region of responsibility, but members work in other areas as the tasks
demand it. A breakdown of assigned tasks is found in Table 11.
Matthew S. Dominick Matt is a senior in Electrical Engineering at USD with minors in Physics and Mathematics.
His recent experience of designing and building an experiment to fly onboard NASA’s KC-135 microgravity research aircraft provided him with invaluable design project experience. The project development lessons learned
from the experience will enable him to effectively guide the team while designing his assigned components as
well.
Thomas J. Davis Tom is a senior Electrical Engineering and Physics major at USD. Currently he is employed at
Softmax Inc as a hardware engineer. His methodical, yet creative problem solving skills should produce quality
design and work in this project.
Brandon K. Bailey Brandon is currently an Electrical Engineer student here at USD. He has extensive knowledge
with image software such as Adobe Photoshop and Illustrator, and is also experienced in webpage design. He
was also enrolled in the EEE142 PIC Micro-controller class which helps with overall knowledge of how the PIC
operates.
James “Mito” D. Cervantes Mito is a senior Electrical Engineering student with a minor in mathematics here at
USD. His current internship with Lightwave Solutions Inc. has provided him with very valuable engineering
experiences, such as engineering design, practice and manufacturing of a product. With the completion of EEE
142 PIC Micro-controllers, he has a sufficient amount of design practice to complete the required tasks asked of
him during this project
Table 11: Personnel Task Distribution
Development Tasks
Bailey Cervantes
Overall PIC Software Development
Cell Phone Modem Instruction Set Setup
x
Flash Card Hardware and Software Interfacing
GPS Hardware and Instruction Set Setup
x
LCD Hardware and Software Interfacing
Power Supply Design
Static Website Development
x
MATLAB Mapping Software Development
Schematic and Printed Circuit Board Design
x
Control Panel CAD Design
x
23
Davis
Dominick
x
x
x
x
x
ELEC 492
A
Autonomous Signal Strength Mapper
Fall 2004
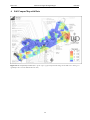
Full Campus Map with Data
Figure 14: Full Campus Map with Data (Note: If your copy is a grayscale printout this image will not make sense. Please go to
signalmaps.com to view this PDF document in color.)
24
ELEC 492
B
Autonomous Signal Strength Mapper
Project Schematic
Figure 15: Project Schematic
25
Fall 2004
ELEC 492
C
Autonomous Signal Strength Mapper
Printed Circuit Board Layout
Figure 16: Project PCB Layout
26
Fall 2004
ELEC 492
D
Autonomous Signal Strength Mapper
Prototype Pictures
Figure 17: Project Casing Pictures
27
Fall 2004
ELEC 492
E
E.1
Autonomous Signal Strength Mapper
Fall 2004
Source Code
C Source Code for PIC Micro-controller
/*;;;;;;;;;;;;;;;;;;;;;;;;;;;;;;;;;;;;;;;;;;;;;;;;;;;;;;;;;;;;;;;;;;;;;;;;;;;;;;;;;;;;;;;;
;
Signal Strength Mapper
;
;
ELEC 492 - Senior Design
;
;
;
;
Matthew S. Dominick
;
;
University of San Diego
;
;
;
;;;;;;;;;;;;;;;;;;;;;;;;;;;;;;;;;;;;;;;;;;;;;;;;;;;;;;;;;;;;;;;;;;;;;;;;;;;;;;;;;;;;;;;;*/
#include <18F252.h>
// chip definition file
/* Set the Configuration Bits Using #fuses */
#fuses HS,NOWDT,NOPROTECT,NOLVP
#use delay(clock=19660800)
// allows use of compiler delay routines delay_ms, etc.
/* LCD Command Setup */
BYTE CursorHome=0x01;
BYTE BigChars=0x02;
BYTE EndBigChars=0x03;
BYTE HideCursor=0x04;
BYTE ShowUnderCursor=0x05;
BYTE ShowBlockCursor=0x06;
BYTE Bell=0x07;
BYTE Backspace=0x08;
BYTE HTab=0x09;
BYTE Linefeed=0x0A;
BYTE VTab=0x0B;
BYTE Clear=0x0C;
BYTE CR=0x0D;
BYTE Bright=0x0E;
BYTE Dim=0x0F;
/* Setup the Serial Receive Buffers */
BYTE UTC[6];
BYTE Latitude[9];
BYTE Longitude[10];
BYTE N_S[1];
BYTE E_W[1];
BYTE Fix[1];
BYTE RSSI[20];
/* Other Variables */
int32 Datapoints;
int screen;
void WaitForPrompt() {
#use rs232(baud=9600,xmit=PIN_B4,rcv=PIN_B5,parity=n,bits=8)
printf("\r");
while(getc()!=’>’) {
delay_ms(250);
printf("\r");
}
}
void main()
{
BYTE IN,COUNT,comma,colon,next_in,next_out;
int rssi_in,rssi_out,rssi_chars;
28
ELEC 492
Autonomous Signal Strength Mapper
Fall 2004
COUNT=0;
IN=’0’;
comma=0;
colon=0;
next_in=0;
next_out=0;
rssi_in=0;
rssi_out=0;
Datapoints=0;
screen=0;
#use rs232(baud=9600,xmit=PIN_B0,rcv=PIN_B1,parity=n,bits=8,Invert)
printf("%c",Bright);
printf("%c",HideCursor);
printf("%c",Clear);
printf("%c",BigChars);
printf("USD");
delay_ms(500);
printf("%c",Clear);
printf("%c",BigChars);
printf("ENGR");
delay_ms(500);
printf("%c",EndBigChars);
#use rs232(baud=4800,xmit=PIN_C4,rcv=PIN_C5,parity=n,bits=8)
while(TRUE) {
if(getc()==’G’ && getc()==’P’ && getc()==’G’ && getc()==’G’ && getc()==’A’ && getc()==’,’) {
Datapoints=Datapoints+1;
//Get the UTC from the incoming string
while(comma!=1) {
UTC[next_in]=getc();
if(UTC[next_in]==’,’) {
comma=1;
}
next_in=next_in+1;
}
comma=0;
next_in=0;
//Get the Latitude from the incoming string
while(comma!=1) {
latitude[next_in]=getc();
if(latitude[next_in]==’,’) {
comma=1;
}
next_in=next_in+1;
}
comma=0;
next_in=0;
//Get the N_S from the incoming string
while(comma!=1) {
N_S[next_in]=getc();
if(N_S[next_in]==’,’) {
comma=1;
}
next_in=next_in+1;
}
comma=0;
next_in=0;
//Get the Longitude from the incoming string
29
ELEC 492
Autonomous Signal Strength Mapper
while(comma!=1) {
longitude[next_in]=getc();
if(longitude[next_in]==’,’) {
comma=1;
}
next_in=next_in+1;
}
comma=0;
next_in=0;
//Get the E_W from the incoming string
while(comma!=1) {
E_W[next_in]=getc();
if(E_W[next_in]==’,’) {
comma=1;
}
next_in=next_in+1;
}
comma=0;
next_in=0;
//Get the E_W from the incoming string
#use rs232(baud=9600,xmit=PIN_C6,rcv=PIN_C7,parity=n,bits=8)
printf("AT+CSQ\r");
getc();
getc();
rssi_in=0;
do {
RSSI[rssi_in]=getc();
rssi_in=rssi_in+1;
} while(RSSI[rssi_in-1]!=13);
#use rs232(baud=9600,xmit=PIN_B0,rcv=PIN_B1,parity=n,bits=8,Invert)
printf("%c",Clear);
delay_ms(50);
if(screen==0) {
screen=1;
printf("UTC: ");
for(next_out=0;next_out!=6;next_out++) {
printf("%c",UTC[next_out]);
}
printf("\r\n");
printf("Lat: ");
for(next_out=0;next_out!=9;next_out++) {
printf("%c",Latitude[next_out]);
}
printf(" N \r\n");
printf("Long: ");
for(next_out=0;next_out!=10;next_out++) {
printf("%c",Longitude[next_out]);
}
printf(" W \r\n");
printf("RSSI: ");
rssi_out=7;
rssi_chars=rssi_in-rssi_out-1;
while(rssi_out!=rssi_in-1){
printf("%c",RSSI[rssi_out]);
30
Fall 2004
ELEC 492
Autonomous Signal Strength Mapper
rssi_out=rssi_out+1;
}
}
else if(screen==1) {
screen=0;
printf("Datapoints:\r\n");
printf("%0lu\r",Datapoints);
printf("RSSI Chars: ");
printf("%d",rssi_chars);
}
#use rs232(baud=9600,xmit=PIN_B4,rcv=PIN_B5,parity=n,bits=8)
/* Prepare uMMC Flash Module for Data */
WaitForPrompt();
printf("C 1");
WaitForPrompt();
printf("O 1 A /data.csv"); //Open File
WaitForPrompt();
/* Save UTC to Flash Card */
printf("W 1 7 0\r");
for(next_out=0;next_out!=6;next_out++) {
printf("%c",UTC[next_out]);
}
printf(",");
WaitForPrompt();
/* Save Longitude to Flash Card */
printf("W 1 11 0\r");
for(next_out=0;next_out!=10;next_out++) {
printf("%c",Longitude[next_out]);
}
printf(",");
WaitForPrompt();
/* Save Longitude to Flash Card */
printf("W 1 10 0\r");
for(next_out=0;next_out!=9;next_out++) {
printf("%c",Latitude[next_out]);
}
printf(",");
WaitForPrompt();
/* Save RSSI to Flash Card */
printf("W 1 %d 0\r",rssi_chars+1);
rssi_out=7;
while(rssi_out!=rssi_in-1){
printf("%c",RSSI[rssi_out]);
rssi_out=rssi_out+1;
}
printf("\r");
WaitForPrompt();
printf("C 1");
WaitForPrompt();
}
}
}
31
Fall 2004
ELEC 492
E.2
Autonomous Signal Strength Mapper
MATLAB Mapping Source Code
% DataPlot_Exponential_Decay.m
% Written by Tom Davis
% December 1, 2004
%This code imports a text file containing information on GPS location and
%cellular phone signal strength. It then uses information from known points
%on campus at USD and creates scaling constants to match recorded GPS
%locations and their respective Matlab matrix location.
%Finally, signal strength is determined at all GPS points and a map
%is produced.
%Load USD Map as Background and supress warnings
warning off;
bg = imread(’USDMapBW.jpg’);
disp(’Background Input Successfully’);
%Find verticle and horizontal size of background image.
scale = 1;
sizeh1 = size(bg);
sizeh = sizeh1(2);
sizev1 = size(bg);
sizev = sizev1(1);
%Create parameters for data contouring. rad indicates radius (in pixels)
%to which a recorded signal point is effective. Falloff is the inverse
%coefficient in the exponential decay. The larger the Falloff is, the most
%weight will be given to remote points. Typical falloff value is 300-500.
rad = scale*50;
side = .707*rad;
falloff = scale*400;
falloff2 = 1/falloff;
%Imports the text file and create vectors for different values
%such as latitude, longitude and signal strength.
in_data = load(’NOV_16_LONG_ED.TXT’);
input_long = in_data(:,2);
input_lat = in_data(:,1);
input_strength = in_data(:,3);
disp(’Data Loaded Successfully’);
%Transform no signal to value of zero
lostpointcount = 0;
for I = 1:size(input_strength,1),
if I <= size(input_strength,1)
while input_strength(I) == 99
lostpointcount = lostpointcount+1;
%input_long(I) = [];
%input_lat(I) = [];
%input_strength(I) = [];
input_strength(I) = 0;
end;
end;
end;
disp(’Data Values of 99 changed to zero’);
%Normalize strength value to fit matlab colorbar scale
max_input_strength = max(input_strength);
%signal_strength = 64/max_input_strength.*input_strength;
signal_strength = input_strength;
%Convert Minutes to decimal.
for I = 1:size(input_long,1),
32
Fall 2004
ELEC 492
Autonomous Signal Strength Mapper
Fall 2004
input_long(I) = floor(input_long(I)/100) + ((input_long(I)/100)-floor(input_long(I)/100))*100/60;
input_lat(I) = floor(input_lat(I)/100) + ((input_lat(I)/100)-floor(input_lat(I)/100))*100/60;
end;
%Create a variable num_points to indicate the number of recorded points.
size_num1 = size(input_lat);
num_points = size_num1(1);
%Start Normalizing reference points. GPScalibrationData2.mat is a record
%of several locations around campus at USD and their respective locations
%on the Matlab map. The important points are included in the file below.
%(3) represents the stop sign at the West entrance Kiosk.
%(5) represents the stop sign at Manchester village entrance.
%Actual GPS Latitude
GPSlat(3) = 32.768725;
GPSlat(5) = 32.776111;
%Actual GPS Longitude
GPSlong(3) = 117.19507833;
GPSlong(5) = 117.18127167;
%Matlab row
lat(3) = scale*1067.660441176;
lat(5) = scale*319.8125;
%Matlab column
long(3) = scale*358.32166246;
long(5) = scale*1539.5125944;
%Find Distances Between West Kiosk and Manchester in Matlab
%coordinates and GPS coordinates.
delvm = abs(lat(5)-lat(3));
delvGPS = abs(GPSlat(5)-GPSlat(3));
delhm = abs(long(5)-long(3));
delhGPS = abs(GPSlong(5)-GPSlong(3));
%Find total lat and long GPS points across the map.
lat_total = sizev*delvGPS/delvm;
long_total = sizeh*delhGPS/delhm;
%Create verticle and horizontal scaling constants
Kv = sizev/lat_total;
Kh = sizeh/long_total;
%This part of the code takes each data point and converts its GPS latitude
%and logitude to Matlab matrix location.
%Use the West Kiosk as a reference point
GPSpointLATref = lat(3);
GPSpointLONGref = long(3);
%Take each recorded point and shift is from the know West Kiosk point
%by the difference from the point multiplied by its scaling factor.
for I = 1:num_points,
deltalat(I) = (input_lat(I)-GPSlat(3))*Kv;
deltalong(I) = (input_long(I)-GPSlong(3))*Kh;
GPSpointlat(I) = GPSpointLATref - deltalat(I);
GPSpointlong(I) = GPSpointLONGref - deltalong(I);
end;
disp(’Data Calibrated to Background Map’);
%THIS IS THE FILTER2 ALGORITHM FOR CONTOURING
%Create matrices called peaks2 and strength_interp to represent nan and
%recorded values and contoured plot respectively.
for I=1:sizev,
for J=1:sizeh,
peaks2(I,J) = 0;
33
ELEC 492
Autonomous Signal Strength Mapper
end
end
%Adjust peaks2 to assume values of signal strength at recorded locations.
for I=1:size(signal_strength,1),
peaks2(round(GPSpointlat(I)),round(GPSpointlong(I))) = signal_strength(I);
end;
%Create a two dimensional filter and apply it to the data.
h = 1/100*ones(100,100);
strength_interp = filter2(h,peaks2);
strength_interp = 64/max(max(strength_interp)).*strength_interp;
%THIS IS THE GRIDDATA ALGORITHM FOR CONTOURING
%Create a meshgrid the size of the map and use the griddata command
%as a means to interpolate between points.
%strength_interp is a continuous representation of signal strength.
t1 = 1:1:sizeh;
t2 = 1:1:sizev;
[XI,YI] = meshgrid(t1,t2);
strength_interp = griddata(GPSpointlong,GPSpointlat,signal_strength,XI,YI);
disp(’Data Contoured Successfully’);
%(This code allows viewing of signal strength on a 3D axis.)
%mesh(XI,YI,strength_interp), hold;
%plot3(GPSpointlong,GPSpointlat,signal_strength,’o’), hold off;
strength_interpcont = nan(sizev,sizeh);
strength_interpAlphaData = .5*ones(sizev,sizeh);
%This sets the transparency of the signal strength layer and creates
%discrete contours of colormap data.
%THIS IS EXPONENTIAL DECAY ALGORITHM FOR CONTOURING
%Create matrices called peaks2 and strength_interp to represent nan and
%recorded values and contoured plot respectively.
for I=1:sizev,
for J=1:sizeh,
peaks2(I,J) = nan;
strength_interp(I,J) = nan;
end
end
%Adjust peaks2 to assume values of signal strength at recorded locations.
for I=1:size(signal_strength,1),
peaks2(round(GPSpointlat(I)),round(GPSpointlong(I))) = signal_strength(I);
end;
%This is the contouring section of the code. For each pixel on the map,
%find the distance to each recorded data point. If the distance is less
%than the user-defined radius, the weight of the data point is given by an
%exponential decay function. This takes a lot of time to render.
for I=1:sizev,
for J=1:sizeh,
weight = nan;
L = 1;
for K = 1:size(signal_strength,1)
if abs(I-GPSpointlat(K)) < side
if abs(J-GPSpointlong(K)) < side
dist(K) = sqrt((I-GPSpointlat(K))ˆ2+(J-GPSpointlong(K))ˆ2);
if dist(K) < rad
weight(L) = signal_strength(K)*exp(-dist(K)*falloff2);
L = L+1;
end
34
Fall 2004
ELEC 492
Autonomous Signal Strength Mapper
end
end
end
strength_interp(I,J) = mean(weight);
end
end
disp(’Data contouring complete’);
%END CONTOURING SECTION
%This section of the code creates discete contours and colors are chosen
%from the colormap. Do not run with Filter2 algorithm.
for I = 1:sizev,
for J = 1:sizeh,
strength_interpcont(I,J) = nan;
if strength_interp(I,J) >= 20
strength_interpcont(I,J) = 56;
elseif strength_interp(I,J) >= 18
strength_interpcont(I,J) = 52;
elseif strength_interp(I,J) >= 16
strength_interpcont(I,J) = 49;
elseif strength_interp(I,J) >= 14
strength_interpcont(I,J) = 40;
elseif strength_interp(I,J) >= 12
strength_interpcont(I,J) = 36;
elseif strength_interp(I,J) >= 10
strength_interpcont(I,J) = 28;
elseif strength_interp(I,J) < 10
strength_interpcont(I,J) = 10;
end
end
end
disp(’Data Values Contoured and Transparency Applied’);
%This part of the code displays the Map of USD as a background image and
%overlays the interpolated signal as color coded regions.
%Each data point taken is shown with an asterisk.
ibg2 = image(bg);
hold on;
iim2 = image(strength_interpcont);
colormap(jet);
set(iim2,’AlphaData’,strength_interpAlphaData);
%colorbar;
%plot(GPSpointlong,GPSpointlat,’.’);
%This section converts the matrix data to image data and outputs the
%strength data as a .bmp file. Second party software such as Adobe
%Photoshop is required to put maps together.
mapdata = ind2rgb(strength_interp,jet);
imwrite(mapdata,’mapdata2_NOV_16.bmp’,’bmp’);
35
Fall 2004
Source
EXPRESS PCB
DIGI-KEY
S.E. ELECTRONICS
S.E. ELECTRONICS
DIGI-KEY
DIGI-KEY
DIGI-KEY
DIGI-KEY
DIGI-KEY
DIGI-KEY
DIGI-KEY
DIGI-KEY
DIGI-KEY
DIGI-KEY
DIGI-KEY
DIGIKEY
DIGI-KEY
DIGI-KEY
DIGI-KEY
DIGI-KEY
DIGI-KEY
DIGI-KEY
DIGI-KEY
DIGI-KEY
PELICAN
PELICAN
DIGI-KEY
DIGI-KEY
DIGI-KEY
GARMIN
GARMIN
MULTITECH
ROGUE ROBOTICS
FRONTPANEL
OFFICE DEPOT
Part
PCB
7 POSITION CONNECTION HOUSING .100
SERIAL LCD MOCULE
FACEPLATE KIT
BATTERY HOLDER
6-6 MOD JACK-PANEL MONT.
IC REGULATOR 5V TO -22V
RECTIFIER BRIDGE 1.5A 200V
CONN HEADER 7 POS .100 VERT.
CONN HEADER 8 POS .100 HI PRES
CONN HEADER 7 POS .100 HI. PRES
CONN TERM FEMALE 22-30 AWG
CONN HEADER 7 POS .100 R/A TIN
CONN D-SUB RECEPT R/A 9 POS PCB
SWITCH SLIDE SPST
FUSE FAST-ACT 1.00A 250 V
FUSEHOLDER TR5 MACHINE
RESISTOR 4.7K OHM 1/8W
RESISTOR 470 OHM 1/8W
SWITCH PB SPST SNAP-IN
CONN HEADER 3 POS .100 R/A TIN
CONN HOUSING 3 POS .100 HI PRES
CONN ADAPTER BNC STR 500 OHM 50A
CONN HEADER .100 R/A TIN
1300 WL/WF, BLACK CASE
PANEL MOUNTING FRAME
OSCILLATOR SOCKET FULL SIZE
IC MCU FLASH 16KX16 EE 28 DIP
6MM LIGHT TOUCH SWITCH 160GF
GPS15L-F
GA 27C
GSM/GPRS CELL PHONE MODEM
UMMC SERIAL FLASH CARD MODULE
CUSTOM ALUMINUM CONTROL PANEL
256MB SECURE DIGITAL FLASH CARD
Cost
$20.94
$0.51
$59.00
$12.00
$1.20
$2.89
$0.90
$0.46
$0.69
$0.57
$0.51
$0.07
$1.10
$2.36
$1.64
$0.60
$0.60
$0.06
$0.06
$5.46
$0.65
$0.27
$6.23
$1.11
$44.00
$7.00
$0.60
$8.48
$0.29
$98.25
$59.95
$250.00
$59.95
$67.00
$50.00
Quantity
1
1
1
1
1
1
1
1
1
1
1
28
1
1
3
1
1
6
6
5
2
2
1
1
1
1
1
1
1
1
1
1
1
1
1
Total:
Total
$20.94
$0.51
$59.00
$12.00
$1.20
$2.89
$0.90
$0.46
$0.69
$0.57
$0.51
$1.88
$1.10
$2.36
$4.92
$0.60
$0.60
$0.34
$0.34
$27.30
$1.30
$0.54
$6.23
$1.11
$44.00
$7.00
$0.60
$8.48
$0.29
$98.25
$59.95
$250.00
$59.95
$67.00
$50.00
$793.80
F
Part Number
N/A
WM2606-ND
BPP-420VY
BEZ-420
BH26AAL-ND
H9063-ND
LM340T-5.0-ND
W02GGI-ND
WM4205-ND
WM2607-ND
WM2606-ND
WM1114-ND
WM4305-ND
A2100-ND
SW331-ND
WK3048BK-ND
WK0001-ND
4.7KEBK-ND
470EBK-ND
CKN1610-ND
WM4301-ND
WM2602-ND
A24557-ND
WM4306-ND
1300-000-110
1200-300-110
A462-ND
PIC18F252-I/SP-ND
P8008S-ND
010-00240-12
010-10052-05
MTCBA-G-F2
N/A
N/A
N/A
ELEC 492
Autonomous Signal Strength Mapper
Complete Part List and Cost for a Single Data Collection Device
Table 12: Parts List for One Complete Data Collection Device
36
Fall 2004
ELEC 492
Autonomous Signal Strength Mapper
Fall 2004
References
[1] www.microchip.com
[2] www.garmin.com
[3] www.roguerobotics.com
[4] www.multitech.com
[5] Finkle, Jim. “Cell providers coming clean with customers.” The Orange County Register. October 3, 2004.
[6] Langberg, Mike. “Cell phone companies should level with public.” Mercury News. December 22, 2003.
37