
1
WISE Software Users Guide S2-R11-RW-2 TRANSPORTATION RESEARCH BOARD 2014 EXECUTIVE COMMITTEE* OFFICERS Chair: Kirk T. Steudle, Director, Michigan Department of Transportation, Lansing Vice Chair: Daniel Sperling, Professor of Civil Engineering and Environmental Science and Policy; Director, Institute of Transportation Studies, University of California, Davis Executive Director: Robert E. Skinner, Jr., Transportation Research Board MEMBERS Victoria A. Arroyo, Executive Director, Georgetown Climate Center, and Visiting Professor, Georgetown University Law Center, Washington, D.C. Scott E. Bennett, Director, Arkansas State Highway and Transportation Department, Little Rock Deborah H. Butler, Executive Vice President, Planning, and CIO, Norfolk Southern Corporation, Norfolk, Virginia (Past Chair, 2013) James M. Crites, Executive Vice President of Operations, Dallas–Fort Worth International Airport, Texas Malcolm Dougherty, Director, California Department of Transportation, Sacramento A. Stewart Fotheringham, Professor and Director, Centre for Geoinformatics, School of Geography and Geosciences, University of St. Andrews, Fife, United Kingdom John S. Halikowski, Director, Arizona Department of Transportation, Phoenix Michael W. Hancock, Secretary, Kentucky Transportation Cabinet, Frankfort Susan Hanson, Distinguished University Professor Emerita, School of Geography, Clark University, Worcester, Massachusetts Steve Heminger, Executive Director, Metropolitan Transportation Commission, Oakland, California Chris T. Hendrickson, Duquesne Light Professor of Engineering, Carnegie Mellon University, Pittsburgh, Pennsylvania Jeffrey D. Holt, Managing Director, Bank of Montreal Capital Markets, and Chairman, Utah Transportation Commission, Huntsville, Utah Gary P. LaGrange, President and CEO, Port of New Orleans, Louisiana Michael P. Lewis, Director, Rhode Island Department of Transportation, Providence Joan McDonald, Commissioner, New York State Department of Transportation, Albany Abbas Mohaddes, President and CEO, Iteris, Inc., Santa Ana, California Donald A. Osterberg, Senior Vice President, Safety and Security, Schneider National, Inc., Green Bay, Wisconsin Steven W. Palmer, Vice President of Transportation, Lowe’s Companies, Inc., Mooresville, North Carolina Sandra Rosenbloom, Professor, University of Texas, Austin (Past Chair, 2012) Henry G. (Gerry) Schwartz, Jr., Chairman (retired), Jacobs/Sverdrup Civil, Inc., St. Louis, Missouri Kumares C. Sinha, Olson Distinguished Professor of Civil Engineering, Purdue University, West Lafayette, Indiana Gary C. Thomas, President and Executive Director, Dallas Area Rapid Transit, Dallas, Texas Paul Trombino III, Director, Iowa Department of Transportation, Ames Phillip A. Washington, General Manager, Regional Transportation District, Denver, Colorado EX OFFICIO MEMBERS Thomas P. Bostick, (Lt. General, U.S. Army), Chief of Engineers and Commanding General, U.S. Army Corps of Engineers, Washington, D.C. Alison J. Conway, Assistant Professor, Department of Civil Engineering, City College of New York, New York, and Chair, TRB Young Members Council Anne S. Ferro, Administrator, Federal Motor Carrier Safety Administration, U.S. Department of Transportation David J. Friedman, Acting Administrator, National Highway Traffic Safety Administration, U.S. Department of Transportation LeRoy Gishi, Chief, Division of Transportation, Bureau of Indian Affairs, U.S. Department of the Interior, Washington, D.C. John T. Gray II, Senior Vice President, Policy and Economics, Association of American Railroads, Washington, D.C. Michael P. Huerta, Administrator, Federal Aviation Administration, U.S. Department of Transportation Paul N. Jaenichen, Sr., Acting Administrator, Maritime Administration, U.S. Department of Transportation Therese W. McMillan, Acting Administrator, Federal Transit Administration Michael P. Melaniphy, President and CEO, American Public Transportation Association, Washington, D.C. Victor M. Mendez, Administrator, Federal Highway Administration, and Deputy Secretary, U.S. Department of Transportation Cynthia L. Quarterman, Administrator, Pipeline and Hazardous Materials Safety Administration, U.S. Department of Transportation Peter M. Rogoff, Under Secretary for Policy, U.S. Department of Transportation Craig A. Rutland, U.S. Air Force Pavement Engineer, Air Force Civil Engineer Center, Tyndall Air Force Base, Florida Joseph C. Szabo, Administrator, Federal Railroad Administration, U.S. Department of Transportation Barry R. Wallerstein, Executive Officer, South Coast Air Quality Management District, Diamond Bar, California Gregory D. Winfree, Assistant Secretary for Research and Technology, Office of the Secretary, U.S. Department of Transportation Frederick G. (Bud) Wright, Executive Director, American Association of State Highway and Transportation Officials, Washington, D.C. Paul F. Zukunft, (Adm., U.S. Coast Guard), Commandant, U.S. Coast Guard, U.S. Department of Homeland Security * Membership as of July 2014. THE SECOND STRATEGIC HIGHWAY RESEARCH PROGRAM WISE Software Users Guide SHRP 2 Report S2-R11-RW-2 Dane Ismart Louis Berger Group, Inc. Chris Huffman Huffman Corridor Consulting Yi-Chang Chiu University of Arizona Vinay Dixit Louisiana State University Deborah Matherly Louis Berger Group, Inc. TRANSPORTATION RESEARCH BOARD Washington, D.C. 2014 www.TRB.org SUBSCRIBER CATEGORIES Construction Highways Operations and Traffic Management THE SECOND STRATEGIC HIGHWAY RESEARCH PROGRAM America’s highway system is critical to meeting the mobility and economic needs of local communities, regions, and the nation. Developments in research and technology—such as advanced materials, communications technology, new data collection technologies, and human factors science—offer a new opportunity to improve the safety and reliability of this important national resource. Breakthrough resolution of significant transportation problems, however, requires concentrated resources over a short time frame. Reflecting this need, the second Strategic Highway Research Program (SHRP 2) has an intense, large-scale focus, integrates multiple fields of research and technology, and is fundamentally different from the broad, mission-oriented, discipline-based research programs that have been the mainstay of the highway research industry for half a century. The need for SHRP 2 was identified in TRB Special Report 260: Strategic Highway Research: Saving Lives, Reducing Congestion, Improving Quality of Life, published in 2001 and based on a study sponsored by C ongress through the Transportation Equity Act for the 21st Century (TEA-21). SHRP 2, modeled after the first Strategic Highway Research Program, is a focused, time-constrained, management-driven program designed to complement existing highway research programs. SHRP 2 focuses on applied research in four areas: Safety, to prevent or reduce the severity of highway crashes by understanding driver behavior; Renewal, to address the aging infrastructure through rapid design and construction methods that cause minimal disruptions and produce lasting facilities; Reliability, to reduce congestion through incident reduction, management, response, and mitigation; and Capacity, to integrate mobility, economic, environmental, and community needs in the planning and designing of new transportation capacity. SHRP 2 was authorized in August 2005 as part of the Safe, Accountable, Flexible, Efficient Transportation Equity Act: A Legacy for Users (SAFETEA-LU). The program is managed by the Transportation Research Board (TRB) on behalf of the National Research Council (NRC). SHRP 2 is conducted under a memorandum of understanding among the American Association of State Highway and Transportation Officials (AASHTO), the Federal Highway Administration (FHWA), and the National Academy of Sciences, parent organization of TRB and NRC. The program provides for competitive, merit-based selection of research contractors; independent research project oversight; and dissemination of research results. SHRP 2 Report S2-R11-RW-2 ISBN: 978-0-309-12982-4 © 2014 National Academy of Sciences. All rights reserved. COPYRIGHT INFORMATION Authors herein are responsible for the authenticity of their materials and for obtaining written permissions from publishers or persons who own the copyright to any previously published or copyrighted material used herein. The second Strategic Highway Research Program grants permission to reproduce material in this publication for classroom and not-for-profit purposes. Permission is given with the understanding that none of the material will be used to imply TRB, AASHTO, or FHWA endorsement of a particular product, method, or practice. It is expected that those reproducing material in this document for educational and not-for-profit purposes will give appropriate acknowledgment of the source of any reprinted or reproduced material. For other uses of the material, request permission from SHRP 2. Note: SHRP 2 report numbers convey the program, focus area, project number, and publication format. Report numbers ending in “w” are published as web documents only. NOTICE The project that is the subject of this report was a part of the second Strategic Highway Research Program, conducted by the Transportation Research Board with the approval of the Governing Board of the National Research Council. The members of the technical committee selected to monitor this project and to review this report were chosen for their special competencies and with regard for appropriate balance. The report was reviewed by the technical committee and accepted for publication according to procedures established and overseen by the Transportation R esearch Board and approved by the Governing Board of the National Research Council. The opinions and conclusions expressed or implied in this report are those of the researchers who performed the research and are not necessarily those of the Transportation Research Board, the National Research Council, or the program sponsors. The Transportation Research Board of the National Academies, the National Research Council, and the sponsors of the second Strategic Highway Research Program do not endorse products or manufacturers. Trade or manufacturers’ names appear herein solely because they are considered essential to the object of the report. SHRP 2 REPORTS Available by subscription and through the TRB online bookstore: www.TRB.org/bookstore Contact the TRB Business Office: 202.334.3213 More information about SHRP 2: www.TRB.org/SHRP2 The National Academy of Sciences is a private, nonprofit, self-perpetuating society of distinguished scholars engaged in scientific and engineering research, dedicated to the furtherance of science and technology and to their use for the general welfare. On the authority of the charter granted to it by the Congress in 1863, the Academy has a mandate that requires it to advise the federal government on scientific and technical matters. Dr. Ralph J. Cicerone is president of the National Academy of Sciences. The National Academy of Engineering was established in 1964, under the charter of the National Academy of Sciences, as a parallel organization of outstanding engineers. It is autonomous in its administration and in the selection of its members, sharing with the National Academy of Sciences the responsibility for advising the federal government. The National Academy of Engineering also sponsors engineering programs aimed at meeting national needs, encourages education and research, and recognizes the superior achievements of engineers. Dr. C. D. Mote, Jr., is president of the National Academy of Engineering. The Institute of Medicine was established in 1970 by the National Academy of Sciences to secure the services of eminent members of appropriate professions in the examination of policy matters pertaining to the health of the public. The Institute acts under the responsibility given to the National Academy of Sciences by its congressional charter to be an adviser to the federal government and, upon its own initiative, to identify issues of medical care, research, and education. Dr. Victor J. Dzau is president of the Institute of Medicine. The National Research Council was organized by the National Academy of Sciences in 1916 to associate the broad community of science and technology with the Academy’s purposes of furthering knowledge and advising the federal government. Functioning in accordance with general policies determined by the Academy, the Council has become the principal operating agency of both the National Academy of Sciences and the National Academy of Engineering in providing services to the government, the public, and the scientific and engineering communities. The Council is administered jointly by both Academies and the Institute of Medicine. Dr. Ralph J. Cicerone and Dr. C. D. Mote, Jr., are chair and vice chair, respectively, of the National Research Council. The Transportation Research Board is one of six major divisions of the National Research Council. The mission of the Transportation Research Board is to provide leadership in transportation innovation and progress through research and information exchange, conducted within a setting that is objective, inter disciplinary, and multimodal. The Board’s varied activities annually engage about 7,000 engineers, scientists, and other transportation researchers and practitioners from the public and private sectors and academia, all of whom contribute their expertise in the public interest. The program is supported by state transportation departments, federal agencies, including the component administrations of the U.S. Department of Transportation, and other organizations and individuals interested in the development of transportation. www.TRB.org www.national-academies.org SHRP 2 STAFF Ann M. Brach, Director Stephen J. Andrle, Deputy Director Neil J. Pedersen, Deputy Director, Implementation and Communications Cynthia Allen, Editor Kenneth Campbell, Chief Program Officer, Safety JoAnn Coleman, Senior Program Assistant, Capacity and Reliability Eduardo Cusicanqui, Financial Officer Richard Deering, Special Consultant, Safety Data Phase 1 Planning Shantia Douglas, Senior Financial Assistant Charles Fay, Senior Program Officer, Safety Carol Ford, Senior Program Assistant, Renewal and Safety Jo Allen Gause, Senior Program Officer, Capacity James Hedlund, Special Consultant, Safety Coordination Alyssa Hernandez, Reports Coordinator Ralph Hessian, Special Consultant, Capacity and Reliability Andy Horosko, Special Consultant, Safety Field Data Collection William Hyman, Senior Program Officer, Reliability Linda Mason, Communications Officer Reena Mathews, Senior Program Officer, Capacity and Reliability Matthew Miller, Program Officer, Capacity and Reliability Michael Miller, Senior Program Assistant, Capacity and Reliability David Plazak, Senior Program Officer, Capacity Rachel Taylor, Senior Editorial Assistant Dean Trackman, Managing Editor Connie Woldu, Administrative Coordinator ACKNOWLEDGMENTS This work was sponsored by the Federal Highway Administration in cooperation with the American Association of State Highway and Transportation Officials. It was conducted in the second Strategic Highway Research Program (SHRP 2), which is administered by the Transportation Research Board of the National Academies. The project was managed by Monica Starnes, Senior Program Officer for SHRP 2 Renewal. The work on SHRP 2 R11 was led by a team from the Louis Berger Group, Inc., with Larry Pesesky, Principal-in-Charge; Dane Ismart, Principal Investigator; and Deborah Matherly, Project Management Coordinator. The researchers and authors of this guide are Dane Ismart, Principal Investigator, Orlando, Fla.; Chris Huffman, Co-Principal Investigator, Huffman Corridor Consulting, Lawrence, Kan.; Yi-Chang Chiu, Co-Principal Investigator, and Hong Zheng and Eric Nava, University of Arizona, Tucson, Ariz.; Brian Wolshon and Vinay Dixit, CoPrincipal Investigators, Louisiana State University, Shreveport, La. (Dr. Dixit is now with the University of New South Wales, Sydney, Australia); Essam Radwan, Orlando, Fla.; William Sampson, Tallahassee, Fla.; Juan Morales, Juan Morales Associates, McLean, Va.; Eric Perry, SAIC, Oak Ridge, Tenn.; Ed Bromage and Lindsay Bromage, E.J. Bromage LLC, Needham, Mass.; and Deborah Matherly, the Louis Berger Group, Inc., Washington, D.C. The authors also acknowledge the contributions of the four groups of participants in the workshops and pilot studies that provided critical input and guidance about needed content and focus early in the project development and critical userfriendly features such as error checks and range messages once the software was near completion. CONTENTS 1 CHAPTER 1 Introduction and Overview 1 1 4 5 CHAPTER 2 Getting Started 5 5 16 17 18 20 21 24 What Is WISE? Purpose and Application Limitations System Requirements Installation Minimum Data Requirements GUI Tools Create a WorkSpace or Open an Existing WorkSpace Save and Close a WorkSpace WorkSpace Folder Structure and Important Files CHAPTER 3 Planning Module 24 25 26 26 27 Importing, Creating, and Modifying a Network Importing Traffic Executing Static Assignment in WISE Defining Planning Characteristics Work Zone Construction Strategies 31 Using Project Information 35 Running the Planning Module WISE Analysis Engine 36 Performing Diversion 38 Using Project Information Tools 42References 43 CHAPTER 4 P lanning Module Detail Elements 43 Getting a Data Set into WISE: Converting a Data Set into NEXTA Format 49 Creating a Network from Scratch 52 Importing Traffic Information 56References 57 CHAPTER 5 Operation Module 57 Hand-Off from Planning to Operation (Interconnection) 59 Running a WISE Project in Operations (DynusT) 61 Operations Traffic Diversion 65Reference CHAPTER 6 H and-Off from Operation 67 CHAPTER 7 A cronyms and Glossary 67 Classification of Software Functionalities 68 Geographic Scale 69Functionality 70 Users and Proprietary Issues 70 Data Inputs 71 Measures of Effectiveness 71 Resource Requirements 72 Dynamic Demand Changes 66 Back to Planning CHAPTER 8 D ata Limits CHAPTER 9 Bibliography 73 75 1 INTRODUCTION AND OVERVIEW WHAT IS WISE? The Work Zone Impact and Strategy Estimator (WISE) software can evaluate the impact of multiple projects that have been incorporated into the Transportation Improvement Program (TIP) and the network. The WISE tool is intended to be a decision support system to be used by planners and engineers to evaluate the impact of work zones and determine strategies to reduce these impacts. The software has been developed so that the level of effort in conducting analysis is minimal. WISE is envisioned to be used by agencies to adhere to the Federal Highway Administration (FHWA) Work Zone Safety and Mobility Rule. For this reason, WISE has been developed based on the definitions and guidelines proposed in the rule (see box on next page). WISE GUI (graphical user interface) is the link between the key WISE tools and metadata within the WISE software package. These key tools consist of the WISE Planning Module, WISE Operation Module, the WISE Analysis Engine, DynusT, and NEXTA. The WISE GUI links these tools using a WorkSpace concept. A single WorkSpace gathers the metadata necessary to define the network, multiple projects, variables, and scheduling data needed to successfully perform an evaluation of a given scenario in the Operation and Planning Modules. PURPOSE AND APPLICATION The WISE tool has been developed with consideration of how the program delivery process flows and how planners and engineers would need to use this tool. Because continual analysis is needed in this process, the WISE tool allows multiresolution modeling (Figure 1.1), in which data can be passed from macro- to meso-level models to 1 Key Provisions in Section 630.1010 of the Work Zone Rule Significant Projects • Paragraph (a) of this section defines a significant project as “one that, alone or in combination with other concurrent projects nearby is anticipated to cause sustained work zone impacts (as defined in Section 630.1004) that are greater than what is considered tolerable based on State policy and/or engineering judgment.” • Paragraph (b) requires states to identify upcoming projects that are expected to be significant. It recommends that significant projects be identified as early as possible in the project delivery and development process and in cooperation with the FHWA. It also recommends that the state’s work zone policy provisions, the project’s characteristics, and the magnitude and extent of the anticipated work zone impacts be considered when determining whether or not a project is significant. Note: The purpose of identifying significant projects is to help develop and implement transportation management plans (TMPs) for projects based on their expected work zone impacts. This is addressed in Section 630.1012, Project-Level Procedures. • Paragraph (c) further qualifies significant project designations by requiring all Interstate system projects within the boundaries of a designated transportation management area (TMA) that occupy a location for more than 3 days with either intermittent or continuous lane closures to be considered as significant projects. • Paragraph (d) provides an exception clause for the above requirement in paragraph (c). For an Interstate system project or categories of Interstate system projects that are classified as significant through the applica tion of the provisions in paragraph (c), but in the judgment of the state they do not cause sustained work zone impacts, the state may request an exception from the FHWA. Exceptions specifically apply to Sections 630.1012(b)(2) and 630.1012(b)(3) of the rule. Exceptions may be granted by the FHWA based on the state’s ability to show that the specific Interstate system project or categories of Interstate system projects do not have sustained work zone impacts. work in a consistent manner with reasonable ease. The user must ensure data compatibility of these models at various levels. Therefore it is anticipated that a multiresolution approach with the ability to choose specific functionality and resolution will provide decision makers with a full range of strategic performance measures as they apply specific work zone strategies and alternatives to meet specific needs in the project delivery process. WISE includes two main elements: the Planning Module and the Operation Module. The Planning Module lets the user evaluate the effectiveness of various travel demand and construction duration strategies for multiple projects through comparisons of two main criteria: construction cost and traveler delay cost (which is converted to monetary cost). Its primary output is a proposed sequencing of projects to minimize overall costs. 2 WISE SOFTWARE USERS GUIDE Figure 1.1. Multiresolution modeling. The WISE tool can be used to address the following questions: • What is a good scheduling of renewal projects? • What strategies are cost-effective with mitigated user delays (congestion) for a program? • Which traffic management plans work best in given conditions? • What is the impact on traffic of the present program? DynusT is the main functionality behind the Operation Module. The concept behind the Operation Module is to dive deeper into the granularity of the time-varying interactions occurring between traffic and the network during a work zone project. What a static model cannot capture—time-dependent congestion and diversion caused by congestion—a simulation model such as DynusT can. DynusT can still use the macroscopic network, yet provide in-depth information of a microscopic simulation model. The Operation Module requires the sensitivity of a simulation model that responds to congestion so that diversion response is reported in a robust and intuitive manner. The Operation Module attains a more accurate estimation of diversion because of the capacity reduction (i.e., work zone project, based on the network and simulation outcome). This diversion is reported back to the WISE system, and the user can choose whether to use this estimated diversion rate (i.e., feedback) in the Planning 3 WISE SOFTWARE USERS GUIDE Module. On the basis of this new diversion rate, the user can model whether this diversion changes the sequencing of projects. The “handshake” feature between the Planning Module and Operation Module enables the power of microsimulation in a macrosimulation model. Note that simulation models other than DynusT can be used to simulate the work zone(s); these refined diversion estimates can be manually input into the Planning Module. For example, the Model Validation and Pilot Studies used TransModeler software to estimate diversion. WISE performs traffic diversions in the sequencing algorithm in its Planning Module to analytically evaluate interdependency of work zone construction projects and the resultant traffic impact and delays networkwide, and it recommends a feasible sequence with a rule of minimum traffic delay over the studied seasons and period that the algorithm can find. Although the traffic diversion is an internal analysis module packaged with the sequencing algorithm, WISE has the functionality to execute traffic diversion under three different modes: WISE supplied, user supplied, and operation supplied. The handshake between the Operation Module and Planning Module enables the operation-supplied option. LIMITATIONS • The model’s data structure links well with DynusT but needs to be expanded to include other software. • At the planning stage the model does not consider improvements in capacity and free flow speeds. • Significant effort is needed to calibrate the mesoscopic model. • Risks associated with construction are not considered. • Explicit consideration of materials and workflow of the construction process are not modeled. 4 WISE SOFTWARE USERS GUIDE 2 GETTING STARTED SYSTEM REQUIREMENTS General requirements follow: • Windows-only application. • x86-compatible processor. • Microsoft Windows Server 2008 (32 bit), Windows Vista (32 bit), Windows 7 (32 bit). • 512KB of RAM. GUI-specific requirements follow: • Operating system: Windows with .Net Framework. • DynusT 3.1. The GUI only has .Net Framework requirements. The only processing requirements should be defined by the WISE Engine, NEXTA, or DynusT. The GUI will work with anything running the appropriate Windows .Net Framework. INSTALLATION The CD or online application includes a setup file named WISE V2_0_5 Installer.exe, which is the installer for the entire WISE software package, including DynusT and NEXTA. This installer verifies that the computer in which WISE is being installed meets minimum .NET Framework requirements. If at any time you are prompted with a .NET Framework error, please visit www.microsoft.com to download the latest .NET Framework installer for your operating system. 5 Follow these steps to complete the WISE software package installation: 1. Double-click on the WISE installation file WISE V2_0_5 Installer.exe. 2. The Installation Wizard will launch (Figure 2.1). Click Next. Figure 2.1. WISE installation Welcome screen. 3. Verify the directory of the installation (Figure 2.2). Click Next. Figure 2.2. Directory for installation. 6 WISE SOFTWARE USERS GUIDE 4. Verify the shortcut folder options (Figure 2.3). Click Next. Figure 2.3. Shortcut Folder options. 5. Verify installation setup options (Figure 2.4). Click Install. Figure 2.4. Installation setup options. 7 WISE SOFTWARE USERS GUIDE 6. After WISE installation progress bar screen completes, DynusT 3.1 installation is launched. If you are the administrator of the computer, click Yes on User Account Control prompt (Figure 2.5). Figure 2.5. User Account Control. 7. You will see the Welcome message from the installation. Click Next on the Welcome window. 8. Enter the serial number 3979-3716-9135-2536 (Figure 2.6). Click Next. Figure 2.6. Serial Number. 8 WISE SOFTWARE USERS GUIDE 9. Click the “I agree to the terms of this license agreement” radio button on the License Agreement window (Figure 2.7). Figure 2.7. License Agreement. 10. Enter the user name and company name in the User Information window (Figure 2.8). Click Next. Figure 2.8. User Information. 9 WISE SOFTWARE USERS GUIDE 11.Verify the directory for the installation listed in the Installation Folder window. Click Next (Figure 2.9). Figure 2.9. Verify directory. 12.Click Next on the Ready to Install window (Figure 2.10) to proceed to the actual installation. Figure 2.10. Ready to Install. 10 WISE SOFTWARE USERS GUIDE 13.The installation will begin running. Three windows will open on the screen simultaneously. a. The original installation window (Figure 2.11) will show the progress. Figure 2.11. Progress of installation. 11 WISE SOFTWARE USERS GUIDE b. The Microsoft Visual C++ Redistributable Package window will open (Figure 2.12). Click Yes, and the installation of this package will be complete. Figure 2.12. Redistributable Package window. 12 WISE SOFTWARE USERS GUIDE c. The Setup window (Figure 2.13) will open simultaneously with the Microsoft Visual C++ Redistributable Package window. i. Click Next. Figure 2.13. Setup window. ii. Verify the location of this installation (Figure 2.14). Click Next. Figure 2.14. Verify location. 13 WISE SOFTWARE USERS GUIDE iii. If you are the administrator of the computer, click Yes on User Account Control prompt (Figure 2.15). Figure 2.15. User Account Control for setup. iv. The Installing Setup window will display the installation progress (Figure 2.16). Figure 2.16. Setup installation progress. 14 WISE SOFTWARE USERS GUIDE v. Click Close to complete the installation of Setup (Figure 2.17). Figure 2.17. Installation Complete. 14.Once DynusT Setup installations are complete, click Finish on the original installation window to complete the installation (Figure 2.18). Figure 2.18. Finish Installation. 15 WISE SOFTWARE USERS GUIDE 15.You will be returned to the WISE installation completion window. Click Finish, and WISE will be launched (Figure 2.19). Figure 2.19. WISE is launched. MINIMUM DATA REQUIREMENTS • The user has the option of importing a predefined network, creating a new network, or modifying the current network. The network data set will have to be created in or converted to DynusT format. It must contain node, link, and zone information. More details can be found in this guide in the detailed Network Conversion section of Chapter 4, Planning Module Detail Elements, and in the network importing and creating sections of Chapter 3, Planning Module. The SHRP 2 R11 publication, Work Zone Impact and Strategy Estimator (WISE) Software Validation and Pilot Tests, documents WISE limitations and provides suggested strategies and programming scripts to convert an existing network into a network that can be used by WISE. • All Planning Characteristic fields must be populated with valid values for the WISE Analysis Engine to run. The Planning Characteristics consist of the following: ——The Season Factor for each month of the year (defaults to 1); ——Start and End time of the entire program (MM/YYYY format); ——Value of Time for the program (dollars per hour); ——Demand Number of Hours for Day and Night; and ——A Program Description. 16 WISE SOFTWARE USERS GUIDE • The user has the option of Importing an Existing Static Assignment or Importing Day and Night demand and running the WISE OBA (Origin-Based Algorithm for the Traffic Assignment Problem) Evaluator. • Required project information includes the following: ——Earliest start time; ——Latest completion time; ——Precedence constraints, if any; ——Agency project cost; and ——Mapping of each project to links in the network. See Creating Projects in Chapter 3, Planning Module. • The Planning Module includes drop-down lists of demand-based and durationbased strategies that can be tested. At least one strategy must be selected, along with associated strategy attributes. GUI TOOLS The WISE software package is managed via a graphical user interface (GUI) (Figure 2.20). The four core topics are WorkSpaces, Planning Module, Operation Module, and Planning/Operation Hand-Off. These sections provide sufficient information to permit the user to navigate through the WISE software package utilizing all of the functions. Chapter 4 provides in-depth instructions for importing, converting, and/or creating a network and importing traffic information. Figure 2.20. WorkSpace screen. 17 WISE SOFTWARE USERS GUIDE CREATE A WORKSPACE OR OPEN AN EXISTING WORKSPACE Manage WorkSpaces All use of the WISE software package must be completed within a defined WorkSpace. A WorkSpace is a directory that contains all of the data related to an instance of WISE needed for a complete analysis. When you launch WISE, you must either open an existing WorkSpace or create a new WorkSpace in order to begin using WISE. The WorkSpace that you choose or create will contain all of the data that are utilized in the Planning and Operation Modules. The current WorkSpace is at all times displayed across the top of the GUI Window next to Current WorkSpace. In the event that a WorkSpace is not yet selected, the Current WorkSpace will be displayed as None (Figure 2.21), and none of the planning or operation functions will be available to the user. Figure 2.21. WorkSpace example. 18 WISE SOFTWARE USERS GUIDE Create a New WorkSpace To create a new WorkSpace, select File → Create New WorkSpace (Figure 2.22). A fter the browser window appears on the screen, navigate to where the WorkSpace is to be saved and provide a directory name for the WorkSpace. Then click OK. Once the WorkSpace has been successfully generated, WISE will create a notification: “The Following WorkSpace Has Been Created:” <WorkSpace Name>. Figure 2.22. WorkSpace drop-down menu. 19 WISE SOFTWARE USERS GUIDE Open an Existing WorkSpace To open an existing WorkSpace, select either File → Open Existing WorkSpace or File → Open Recent WorkSpaces. Recent WorkSpaces contains the last four WorkSpaces (Figure 2.23) that were accessed. The Open Existing WorkSpace function will display a browser window from which the user must navigate to the WorkSpace to be opened. Select the WorkSpace and click OK. If the selected folder is not a valid WISE WorkSpace, an error will be displayed, and no WorkSpace will be opened. Figure 2.23. Open Recent WorkSpace drop-down menu. SAVE AND CLOSE A WORKSPACE To save the current WorkSpace, select File → Save WorkSpace. WISE will run an initial validation of the WorkSpace and provide a list of errors, if applicable, and an option to save anyway via Yes or No. If you select Yes, then the WorkSpace will be saved containing all of the errors identified and will be available for you to continue updating or return to at a later time. If you select No, you will return to the current WorkSpace without losing any data. To close a WorkSpace, select File → Close WorkSpace. WISE will prompt you to save the WorkSpace before closing via Yes or No. If you select Yes, then WISE will run the same validation as performed during the Save function above and prompt you if you would like to Save with errors if errors are found. If errors are found and you select No, then WISE will not close and you will return to the active WorkSpace, allowing you to fix errors or Close without Saving. 20 WISE SOFTWARE USERS GUIDE WORKSPACE FOLDER STRUCTURE AND IMPORTANT FILES WorkSpaces have a specific file structure that WISE relies upon to operate. This file structure consists of a primary WorkSpace folder, which is the main folder you save as your WorkSpace name during creation. All subfolders and data related to a WorkSpace are stored within the primary WorkSpace Folder. The primary WorkSpace folder contains up to four documents along with two subfolders, Planning and Operation. All of the documents and subfolders are created or populated by the WISE GUI. Manual manipulation of these folders or documents is not necessary during typical use of WISE. The four documents that can be found in the primary WorkSpace folder are listed below with their origin (either WISE User Interface or Network Import File): • LinkMatrix.csv (WISE); • SavedLinkMatrix.csv (WISE); • WISE_Version.txt (WISE); and • WorkZone.date (Network). The two LinkMatrix files are used to store WorkSpace data related to the Network Links and the interface between the Planning and Operation Modules. The Planning subfolder is the main folder, which will contain all of the network data, error logs, and files necessary to run NEXTA and DynusT with the associated WISE WorkSpace. The Planning folder should contain only one Network File (file with .dws extension). Some files are duplicated in the Planning subfolder and the Primary WorkSpace folder; this is normal behavior for WISE. The Planning subfolder will also have three subfolders of its own, which contain the WISE Analysis Engines. These folders are Demand, Main_schedule, and OBA. All of the folders are generated at the creation of a new WISE WorkSpace and may take a little time to be created. The following files, which can be found in the Planning subfolder, are listed with their origin as either WISE or Network files (*indicates that the file must be present in all network analysis areas to import a network successfully): • ~~~.dws* (Network); • DynusT.exe (Network); • NEXTA.exe (Network); • NEXTA_Config.xml (Network); • bg_demand_adjust.dat* (Network); • bitmap.dat* (Network); • bus.dat* (Network); • control.dat* (Network); • demand.dat* (Network); • demand_HOV.dat* (Network); 21 WISE SOFTWARE USERS GUIDE • demand_superzone.dat* (Network); • demand_truck.dat* (Network); • destination.dat* (Network); • epoch.dat* (Network); • GradeLengthPCE.dat* (Network); • incident.dat* (Network); • leftcap.dat* (Network); • linkname.dat* (Network); • linkxy.dat* (Network); • movement.dat* (Network); • network.dat* (Network); • node.csv* (Network); • node_error.log* (Network); • origin.dat* (Network); • output_option.dat* (Network); • parameter.dat* (Network); • pathxyz.bat (WISE); • pricing.dat* (Network); • Project.html (WISE) (a document generated by WISE containing all of the WorkSpaces’ Project Characteristics); • ramp.dat* (Network); • scenario.dat* (Network); • sensor.dat* (Network); • StopCap2Way.dat* (Network); • StopCap4Way.dat* (Network); • subarea.dat* (Network); • super_space_split.dat* (Network); • super_time_split.dat* (Network); • superdemand.dat* (Network); • superzone.dat* (Network); • system.dat* (Network); • toll.dat* (Network); • TrafficFlowModel.dat* (Network); • version.dat* (Network); 22 WISE SOFTWARE USERS GUIDE • vms.dat* (Network); • WorkZone.dat* (Network); • xy.dat* (Network); • YieldCap.dat* (Network); • zone.dat* (Network); and • zone_mapping.dat* (Network). Additional error log files may be generated during WISE normal operation. At the time that an error log is necessary, the WISE User Interface will notify the user where the log file can be found. 23 WISE SOFTWARE USERS GUIDE 3 PLANNING MODULE IMPORTING, CREATING, AND MODIFYING A NETWORK All WorkSpaces must contain one valid network, which contains all projects. All networks that are imported must be imported in the NEXTA Format (see Chapter 4 for instructions on generating a NEXTA Network). The user has the option of importing a predefined network, creating a new network, or modifying the current network. All of these options are available under Planning → Import Analysis Area → Network (Figure 3.1). Figure 3.1. ImportAnalysisAreatab:Network. 24 Importing an Existing Network To import an existing network, select Import Analysis Area, and a browser window will appear. Navigate to the folder containing the network and click OK. If you already have a network defined in a WorkSpace, then this action will erase the current network in its entirety, which will not be reversed if you exit WISE without saving changes. See Chapter 4 for instructions on converting an existing network for use in WISE. Creating a New Network To create a new network, select Create Network, and NEXTA will launch. See Chapter 4 for instructions on creating a NEXTA Network. Once you have created the network, save it in the Planning folder of the WorkSpace and close NEXTA. Note: If you already have a network defined in a WorkSpace, then this action will erase the current network in its entirety. This erasure will not be reversed if you exit WISE without saving changes. Modifying Current Network To modify the existing network, select Edit Current Network, and NEXTA will launch with the current network open for editing. See the first sections of Chapter 4 for additional NEXTA instructions. Once you have modified the network, save the network and close NEXTA. IMPORTING TRAFFIC WISE provides the option of importing an existing static assignment or importing day and night demand and running the WISE OBA Evaluator. All of these options are available through Planning → Import Analysis Area → Traffic (Figure 3.2). All of the Import buttons (Import Existing Static Assignment, Import Day Demand, and Import Night Demand) open a browser window, and you must navigate to, highlight, and select OK for the file that you choose to import. The Evaluate button will run the OBA analysis as described previously. See Chapter 4 for greater detail on importing traffic data. 25 WISE SOFTWARE USERS GUIDE Figure 3.2. Import Analysis Area tab: Traffic. EXECUTING STATIC ASSIGNMENT IN WISE WISE has the capability to execute its own static assignment algorithm if the user does not have static assignment results. (See the subsection called Preparing Input File in the Importing Traffic Information section of Chapter 4 in this users guide). WISE implements an OBA called Algorithm B (1). To run the static assignment algorithm, the network and the demand that are imported from Importing Traffic Information in Chapter 4 must be in place. Figure 3.2 shows the buttons used to run the algorithm. At least Import Day Demand or Import Night Demand must be imported before running the algorithm. The Evaluate button will run the algorithm. Once the algorithm is completed, the Static_Import.csv file will be produced in the same format as explained in Preparing Input File in Chapter 4. DEFINING PLANNING CHARACTERISTICS Planning Characteristics for the entire program under evaluation are defined under Planning → Planning Characteristics as shown in Figure 3.3. All Planning Characteristic fields must be populated with valid values for the WISE Analysis Engine to run. The Planning Characteristics consist of the Seasonal Factor for each month of the year (defaults to 1), Start and End time of the entire program (MM/YYYY format), Value of Time for the program (dollars per hour), Demand Number of Hours for Day and Night, and a Program Description. To enter the Planning Characteristics values, select the text box associated with each and enter the value. Once you have entered all Planning Characteristics, you can validate all fields on the Planning Characteristics tab by 26 WISE SOFTWARE USERS GUIDE clicking Validate Planning Characteristics at the bottom of the tab. If there are any invalid values, then the text box for all invalid values will be highlighted red. Please see Chapter 8, Data Limits, for details on valid values for each Planning Characteristic. Figure 3.3. Planning Characteristics tab. WORK ZONE CONSTRUCTION STRATEGIES Assigning Project Strategies Each WorkSpace must contain at least one strategy to be assigned to projects within the WorkSpace. Project Strategies are created from the Planning → Project Strategies tab shown in Figure 3.4. Strategies are either Demand-Based or Duration-Based. You can enter strategies individually or import and export all strategies. Please see Chapter 8, Data Limits, for details on valid values for each Project Strategy. WISE allows users to evaluate a wide range of strategies. These strategies can be broadly classified as demand based or duration based. All strategies help either to reduce demand close to the work zone or to reduce the duration of the work zone (Table 3.1). For example, some strategies relate to the following issues: 1. Daytime and nighttime. Because night demand is usually much lower than day demand, undertaking work zones at night might have very little impact on traffic and thus save considerable user cost in comparison with undertaking work zones during the day. However, scheduling work zones at night usually costs more real dollars from the agency’s budget. Planners and policy makers must address the tradeoff between the magnitude of user cost and that of agency cost. See item 5 for a discussion of how WISE can address this issue. 27 WISE SOFTWARE USERS GUIDE 2. Seasonal impact. Another common factor in the cost induced by work zone scheduling is the seasonal factor. It is well known that traffic demand varies by season and by month. Particularly in tourism areas, for example, demand during nonpeak periods is much lower than during the peak tourism periods. Conducting work zone implementation during reduced demand periods saves user cost. The WISE tool allows you to put constraints on the months of the year during which renewal cannot take place, for example, by excluding the winter months that tend to bring heavy snowfall. 3. Demand reduction factor. Before work zone implementation, agencies usually carry out large-scale public involvement campaigns. These may reduce local demand near the projects, for example, non–work-based discretionary trips such as shopping trips or recreation. This local demand reduction is measured by the demand reduction factors. 4. Traffic diversion impact. With the presence of a work zone in the network, traffic usually diverges through a day-to-day learning process and continues toward a new equilibrium. This diversion effect involves a new traffic assignment computation in the work zone scheduling framework. Users can adopt the default WISE calculation for diversion, enter a value based on local knowledge or experience, or run the WISE Operation Module or any local, calibrated microscopic simulation model to develop a microscopic simulation value for diversion. 5. Putting weight on user cost with respect to monetary cost of the project. WISE uses a general cost that combines both agency and user costs to measure whether a project is cost-effective. Agency cost refers to the monetary expenses related to work zone project constructions; its unit is the dollar. User cost refers to the user travel time; its unit is the vehicle-minute. WISE utilizes a user-specified parameter, Value of Time (VOT), to convert vehicle-minutes of users’ travel time to monetary dollars. The VOT unit is dollar per vehicle-minute. Agencies may estimate the relationship between the road user’s cost and monetary dollars in various ways and thus have various values for VOT; accordingly, the modeler should specify VOT carefully. The general recommended value of VOT ranges from one-third to one-half of the average hourly wage rate in the specified work zone construction area. However, an agency usually assigns different weights to monetary dollars and user costs derived from VOT. For example, the agency cost might be considered equivalent to the user cost by a factor of 2, meaning every 2 dollars of the user cost that is converted by VOT merits 1 monetary dollar. In this instance a modeler should adjust the VOT by half, so that WISE computes the general cost as the sum of monetary dollars spent in construction plus converted and weighted monetary dollars “paid” by users. 6. Fast construction techniques. Fast construction techniques significantly reduce the duration of construction but come at increased cost. 28 WISE SOFTWARE USERS GUIDE Planning Operational TABLE 3.1. CLASSIFICATION OF STRATEGIES Demand-Based Strategies Duration-Based Strategies Dynamic message signs Daytime/nighttime work Signal optimization Programming/design/materials Improving parallel roads Scheduling around critical events Daytime/nighttime work Public information Improving parallel roads Total vs. partial closures Incentive/disincentive contracting Short-duration closures Project sequencing Construction techniques Daytime/nighttime work Figure 3.4. Project Strategies tab. Creating Demand-Based Strategies To create a Demand-Based Strategy, in the Demand-Based Strategy box on the Project Strategies tab, enter the Strategy Name, % Trip Reductions, Radius (in miles), and Demand Strategy Cost (in thousands of dollars). Then click Add Strategy in the Demand-Based Strategy box. Each Demand-Based Strategy must have a unique name. If you duplicate a name, then WISE will ask if you would like to write over the existing strategy. You can use this function to modify existing strategies by entering the exact name. 29 WISE SOFTWARE USERS GUIDE If an invalid value is entered, then WISE will generate a warning and highlight the incorrect field in red without saving the strategy to the list of strategies. Once you have added a strategy, it will be displayed in the Demand-Based Strategy list to the right of the GUI, as illustrated by Test Demand 1 and Test Demand 2 in Figure 3.4. Creating Duration-Based Strategies To create a Duration-Based Strategy, in the Duration-Based Strategy box on the Project Strategies tab, enter the Strategy Name, Duration Reductions (Months), and Demand Strategy Cost (in thousands of dollars). Then click Add Strategy in the Duration-Based Strategy box. Each Duration-Based Strategy must have a unique name. If you duplicate a name, then WISE will ask if you would like to write over the existing strategy. You can use this function to modify existing strategies by entering the exact name. If an invalid value is entered, then WISE will generate a warning and highlight the incorrect field in red without saving the strategy to the list of strategies. Once you have added a strategy, it will be displayed in the Duration-Based Strategy list to the right of the GUI, as illustrated by “Test Duration 1” in Figure 3.4. Deleting Strategies To delete one or more strategies of a given type (i.e., demand based or duration based), select the check box next to each strategy in the list of current strategies to the right of the GUI on the Project Strategies tab. Then click Delete at the bottom of the appropriate strategy listing (Figure 3.5). Figure 3.5. Delete a strategy. 30 WISE SOFTWARE USERS GUIDE Importing and Exporting Strategies WISE GUI allows you to import and export strategies. The process imports or exports all Demand-Based and Duration-Based strategies at once. When you import strategies, you delete all strategies that were previously in the WorkSpace. To import or export, click Import or Export at the bottom of the Planning Strategies tab. A browser window will open. Either navigate to the strategies that you would like to import or navigate to a folder and then name the file whatever you would like to call the strategies you are exporting. You can import strategies only from WISE-generated strategy files. USING PROJECT INFORMATION Creating Projects All WISE WorkSpaces must have multiple projects to perform an analysis. To create a project, you must define a network with valid links and at least one strategy. All projects are managed from the Planning → Project Info tab (Figure 3.6). If you modify a link or strategy after you have used it within a project, please see the next section on Viewing or Modifying Projects to update the strategy or links as needed. You can always identify how many projects have already been defined within a given WorkSpace by viewing the Project Counter at the Planning → Project Info tab (Figure 3.6). In Figure 3.6, the Project Counter is “0”; and the current project is a “New” project of the “0” projects currently defined. Figure 3.6. Project Info tab. 31 WISE SOFTWARE USERS GUIDE To create a new project, navigate to the Planning → Project Info tab and type in the appropriate values for the following fields: Project Name, Earliest Start Time and L atest End Time (MM/YYYY format), Total Duration of Project (in months), and P roject Precedence. Also select Day and/or Night and fill in the appropriate Total Project Construction Cost in millions of dollars. (You can fill in a cost for Day or Night only if you click the appropriate boxes.) You must select at least one strategy from the Project Strategies pull-down menus (one Demand- or Duration-Based Strategy or one of each). You must also select a Project Link from the pull-down menu (selecting a Project Link will automatically populate the Capacity, Speed, and Number of Lanes fields). If the Project Strategies or Project Link pull-down menus do not have any valid options, then you have not generated any strategies, you have not imported a valid network, or all of your Project Links have already been assigned (each link can be assigned to only one project). Before adding the new project, you must also select a Diversion. If you would like the WISE Diversion Engine to generate the Diversion automatically in the Planning Module, select User-Supplied and leave the value at “0.” The Planning Module uses static assignment. You also have the option of supplying a Diversion other than “0,” based on experience and judgment or on separate studies. If you desire additional accuracy for estimating potential traffic diversion due to construction delays, you can request or perform a microsimulation on your own model, and manually input the results to the Planning Module. If you desire additional accuracy and the convenience of the built-in “handshake” between the Operational and Planning Modules, you can apply the DynusT model as part of the Operation function, develop diversion estimates in the Operation Module, and rerun the Planning Module. Applying diversion estimates from the Operation Module is an explicit choice in the Planning Module. See the section Performing Diversion in this chapter for further information on the Operation-Supplied Diversion. The Operation Module–supplied Diversion will not be available for new projects until the Operation Module is run; until then the Operation Supplied box will indicate “null.” Once all project information is complete, click Save/Add Project to add the project to the All Projects list on the right-hand side of the Project Info tab. WISE will then validate all fields and highlight invalid fields in red. In addition, the GUI will return the Active Project screen to a New Project screen, and the Project Counter will display New of Total so that new projects can be added. At any time during the generation or modification of a project, you can click Validate Project, and WISE will highlight all fields that have errors or display an “error free” message. Please see Chapter 8, Data Limits, for details on valid values for each field within the Project Info tab. 32 WISE SOFTWARE USERS GUIDE Viewing or Modifying Projects To either view or modify an existing project you must select the check box next to the project of interest in the All Projects list on the Project Info tab and click Go To Project at the bottom of the list (Figure 3.7). This action will populate the Project screen to the left of the Project Info tab with the selected project. The Project Counter will now display Project x of total. You can now modify all project fields as when you created the project. When you click Save/Add Project, WISE will perform the same validation and operation as in creating a new project and will update the project in the All Projects list. This modification will also return the Active Project screen back to New of Total so new projects can be added. Figure 3.7. Project Info tab: View or modify a project. 33 WISE SOFTWARE USERS GUIDE Deleting Projects To delete a project from the WorkSpace, select the check box next to the project or projects in the All Projects List that you would like to delete, then select the Delete Project button from the bottom of the list (Figure 3.8). After prompting you to ensure that you would like to delete the specified projects, WISE will delete them. Once a project is deleted, it will no longer appear on the All Projects list. Figure 3.8. Project Information tab: Delete Project. 34 WISE SOFTWARE USERS GUIDE RUNNING THE PLANNING MODULE WISE ANALYSIS ENGINE Once all necessary inputs are entered into the Planning Module of the current WorkSpace, the user can run the WISE Analysis Engine. To do so, the entire WorkSpace must complete a successful WorkSpace Validation and Save. The WorkSpace Validation and WISE Analysis Engine are run from the Planning → Results tab (Figure 3.9). Figure 3.9. Planning Results tab. Validating WorkSpace To validate the entire WorkSpace, you must select Planning → Results → Validate Planning WorkSpace. This function will validate the entire WorkSpace and generate a log of any errors it detects. WISE will display the location of any error log in a pop-up window. Validation of the Planning Workspace prompts the user to save the current WorkSpace and validates as follows: • Checks for valid network. • Ensures that the link (including Speed/Capacity/Number of Lanes) and strategies have not been modified since they were applied to a project. • Validates the following, regarding schedules and dates: ——All projects fit within the duration of the program; ——Each project precedence is feasible (Note: projects can coincide); and ——All Duration-Based Strategies applied to projects have feasible Duration Reduction for Project Duration. 35 WISE SOFTWARE USERS GUIDE Generating Results Once the WorkSpace is ready for analysis of the Planning Module, the user can run the WISE Analysis Engine. To do so, select the Planning → Results → Analyze Program button (Figure 3.9). The program will first validate the planning network and then, if all validations are clear, run the WISE Analysis Engine. A command window will show that the Analysis Engine is running. At completion, the Analysis Results Box will populate the Planning → Results tab in the Analysis Results box (see Figure 3.9). See Display and Interpretation of Results later in this chapter for more information on the analysis results. PERFORMING DIVERSION WISE performs traffic diversions in the sequencing algorithm in the Planning Module to analyze interdependency of work zone construction projects and the resultant traffic impact and delays networkwide, and it recommends a feasible sequence with a rule of minimum traffic delay over the studied seasons and period. Although the traffic diversion is an internal analysis module packaged within the sequencing algorithm, WISE can execute traffic diversion under three different modes: WISE-supplied, user-supplied, and operation-supplied. Technical details of traffic diversion analysis in WISE are discussed in Optimization of Project Sequence. WISE-Supplied Mode WISE-supplied mode is the default setting. If the user or operation model does not supply traffic diversion information, then WISE executes the default mode automatically. WISE analyzes traffic diversions through an internal logic, which finds a set of alternatives to the route through the work zone construction link. If WISE’s analysis indicates that the work zone construction link involves congestion, then WISE diverts a portion of traffic on the work zone construction link to the set of alternative routes if doing so would lead to less delay. The internal logic seeks an equilibrium state between the work zone link route and its alternative routes. Analytically, the WISE-supplied diversion module achieves equal travel time between both (sets of) routes. To enable the WISE-supplied traffic diversion rate, in the Diversion box on the Planning → Project Info tab, keep the User Supplied box checked and enter the number “0” in the field (Figure 3.10). 36 WISE SOFTWARE USERS GUIDE Figure 3.10. Define WISE-supplied traffic diversion rate. User-Supplied Mode WISE provides an interface that allows users to provide a traffic diversion rate, if it is known by those who are familiar with local traffic performance or is obtained by addi tional traffic studies outside of WISE (including the use of separate microsimulation models, as described in the R11 pilot test report). To execute the user-supplied mode, in the Diversion box on the Planning → Project Info tab, select User Supplied and enter a positive number (at least 1 and no more than 100) in the field (Figure 3.11). For example, the number 15 shown in Figure 3.11 means that 15% of the traffic on the work zone construction link is to be diverted to the set of alternative routes. Figure 3.11. Define user-supplied traffic diversion rate. 37 WISE SOFTWARE USERS GUIDE Given the user-supplied traffic diversion rate, WISE finds a set of alternatives to the route through the construction link, as in the default mode, and it diverts the usersupplied portion of traffic from the work zone construction link to the alternative routes regardless of the computed travel time. Operation-Supplied Mode The operation-supplied diversion rate provides an interface to feed the traffic diversion data analyzed in the Operation Module back to the Planning Module (Figure 3.12), illustrating the “handshake” between the two modules. To enable this operationsupplied mode, the user must first run the Operation Module. If the Operation Module has not produced analysis data, then the operation-supplied check box on the Planning → Project Info tab is gray and not checkable. After the Operation Module has been run, and with the traffic data produced by WISE, the check box becomes activated. When the check box is selected, WISE identifies the simulation data set, reads the produced outputs internally, and automatically displays the diversion rate in the field. Figure 3.12. Define operation-supplied traffic diversion rate. USING PROJECT INFORMATION TOOLS Running the Algorithm Validate Planning Workspace Upon completion of project setup and directly before executing the Algorithm program, you can click Planning → Results → Validate Planning WorkSpace button to ensure that the input numbers are valid. This step provides an additional safeguard to ensure that the numbers of project setup are feasible within a reasonable domain supported by WISE. Invalid numbers and inputs are identified in a warning message. The program cannot run until all invalid inputs that the validation procedure identified have been cleared. 38 WISE SOFTWARE USERS GUIDE Analyze Program The Planning → Results → Analyze Program button executes the sequencing algorithm in WISE, to analyze traffic delays in the network with the project setup. The algorithm evaluates interdependency of construction projects as well as the resultant traffic delays under a set of logically generated feasible schedules, and it recommends the best schedule plan with the lowest generalized cost. Display and Interpretation of Results When the analyzing program is completed, the sequence results are automatically displayed in the Analysis Results box on the right-hand side of program window (Figure 3.13). Figure 3.13. Display analysis results. The first part of the WISE output summarizes the basic inputs of the analyzed scenario. It displays the overall planning horizon, month-specific seasonal factors, and number of projects specified by inputs. The second part of the output displays the recommended sequence of each project, as well as its associated traffic variables, in an order of construction modes following daytime construction, nighttime construction, and both. Figure 3.14 illustrates how the project sequence results are displayed. It shows a quick summary of the project setup, including the project ID, link where the project resides, capacity reduction rate, original posted speed limit, new posted speed limit during construction, and agency cost involved for implementation. 39 WISE SOFTWARE USERS GUIDE Figure 3.14. Display project sequence and its associated traffic variables. The recommended project sequence follows. It displays the year and month that are recommended for the start of construction. The completion time is not displayed, but the user can compute it from the starting construction time and project duration (taking into account any Duration-Based Strategy). The output also includes the average flow, in units of vehicles per hour, and average travel time, in units of minutes, on the work zone construction link. Those numbers are averaged by work zone construction period. For example, if a work zone project lasts for 3 months, then the displayed flow and travel times are averaged over 3 months. To facilitate a comparison, the output also displays the original flow and travel time before construction, which are annual average numbers. Usually the user will see a reduced flow with increased travel time. Reduced flow implies WISE analysis traffic diversion for the analyzed work zone project. Two factors lead to an increased travel time: the drop of capacity and the reduced posted speed limit during construction. Optimization of Project Sequence WISE selects the best schedule plan based on the generalized cost, which contains both user cost and agency cost. User cost is also known as traffic delays, measured by vehicle hours prolonged for all travelers in the network arising from the work zone constructions. Traffic delay is converted to user cost by multiplying value of time. Agency cost represents the monetary dollars spent out-of-pocket to implement the evaluated construction plan. Agency cost is specified by users when defining demandbased and duration-based construction strategies. See the Work Zone Construction Strategies section earlier in Chapter 3. Given the user cost derived from traffic delay and the agency cost, WISE evaluates the generalized cost summarized for the entire analysis period. Logically, WISE generates a number of schedule scenarios and eventually selects the one with the lowest whole-period generalized cost among all schedule plans evaluated. 40 WISE SOFTWARE USERS GUIDE The main task of the sequencing algorithm is to evaluate traffic delay for use in computing user costs. Traffic delay varies from month to month because of geometric features of the network (e.g., links are partially closed for construction in a specific month), travel demand varies month to month, and delays are scenario-specific depending on the individual construction schedule plan. In this regard, WISE evaluates traffic delay for each month and then summarizes the overall delay for the entire analysis period. For a specific month, traffic delay is measured in a manner that considers the traffic diversion effect. It is assumed that some travelers will respond to the construction event and choose their own alternate route to minimize their own delay. The traffic diversion effect indicates the need to measure the interdependency of work zone projects. If a work zone project involves a route that is an alternative to a route in another work zone project, then the algorithm can measure a worse delay when construction is concurrent rather than sequential. As a general rule, interdependent projects are usually not recommended for construction in overlapping time windows because such a situation increases traffic delay. Delay caused by work zone construction networkwide is measured by a k-shortest path (KSP) algorithm that appropriately captures travelers’ diversion. The KSP algorithm in WISE is a revised version of the ranking algorithm based on the work of Martins (2). As a general rule, it finds the shortest path by considering paths one by one between a set of diversion points and merging points. More specifically, WISE identifies a set of upstream nodes r of a work zone project as diversion points, specifies a set of downstream nodes s as merging points, and then solves k shortest paths between sets r and s. A set of paths among KSPs that leads to a shorter travel time than the one through a construction link is specified as a set of alternative routes for traffic diversion. Traffic diversion shifts flow from the longer route (in time) to the shorter route, so that travel times along two routes are identical after flow shifting, indicating an equilibrium state. A set of feasible schedules is generated by a large-scale neighborhood search heuristic. A feasible schedule, or plan, means that the schedules identified for each project satisfy the earliest starting time and latest completion time, the duration is within the domain that users specify, and the precedence constraints, if any, are valid. The heuristic starts from a feasible schedule plan, computes month-specific traffic delay, and obtains the overall generalized cost for the entire analysis period. Based on the current plan and evaluation result, WISE generates another plan that may lead to an improvement and performs the same evaluation again. In each iteration, the heuristic usually identifies a better plan. The analysis procedure continues until the program cannot identify further improvement within a certain number of iterations. 41 WISE SOFTWARE USERS GUIDE REFERENCES 1.Dial, R. A Path-Based User-Equilibrium Traffic Assignment Algorithm That Obviates Path Storage and Enumeration. Transportation Research Part B: Methodological, Vol. 40, No. 10, 2006, pp. 917–936. 2.Martins, E. D. V. An Algorithm for Ranking Paths in Acyclic Networks. OR Spektrum, Vol. 5, No. 2, 1983, pp. 87–90. 3.Transportation Research Circular E-C153: Dynamic Traffic Assignment—A Primer. Transportation Research Board of the National Academies, Washington, D.C., 2011. http://www.trb.org/publications/blurbs/165620.aspx. 42 WISE SOFTWARE USERS GUIDE 4 PLANNING MODULE DETAIL ELEMENTS GETTING A DATA SET INTO WISE: CONVERTING A DATA SET INTO NEXTA FORMAT Network Conversion DynusT adopts the approach of a flexible and robust interface, using an Excel template file—with existing GIS-based demand forecasting and network planning software packages. This arrangement provides the appropriate stages of importing an existing network (i.e., links, nodes, and zones) to a DynusT data set. An Excel template is included in the software package, in the directory in which the software is installed (file name: GIS_Network.xls). The typical path to this folder is C:\Program Files \DynusT 3.1 (32 bit). Because DynusT is a simulation-based model, typically the centroids and centroid connectors from a static network are not used but are replaced by a more detailed (block face level) zonal system with connectors. For the purposes of DynusT in WISE, removal of that information is optional. However, it can be done either in the existing planning software from which the importing network originates, or by carefully modifying these items in the Excel conversion template. An overall explanation of the centroid methodology can be found in the DynusT Online User’s Manual (1). The general procedure for network conversion is as follows. 1. Export network-related tabular information regarding nodes, links, and zones from the original network-modeling software. Most software packages can export this information either as an Excel file or as a comma-delimited file (*.csv). 2. Copy the node, link, and zone information to the appropriate worksheet in the Excel template file. 43 3. Import the Excel template file to NEXTA to convert the network to DynusT format. Note: The pilot test report documents a user’s experience with downloading, importing, and troubleshooting complex freeway networks into compatible NEXTA and DynusT formats. Users may find useful suggestions and “work-arounds” in that document. The following describes the necessary information to copy into the Excel template file. NODE Worksheet The NODE worksheet contains columns for ID, Longitude, Latitude, TAZ, and CTRL_TYPE (Figure 4.1). Figure 4.1. NODE worksheet. The node IDs are listed in the ID column, and they should be consistent with their association with the network links. That is, the node IDs used to describe links in the “Link” section should be consistent here. (Basically the input file has two sections, a node section and a link section. A link is defined as traveling from Node A to Node B. The node IDs in the node section must match up with the nodes used to define the links.) The Longitude and Latitude columns contain the x and y coordinates of each node. Any coordinate plane format is accepted because NEXTA will convert it to its own coordinate system. The TAZ column indicates each node’s association with a TAZ, that is, the node is within the geographical boundary of the TAZ. If for any reason a node does not have a TAZ, you may enter a “0.” The CTRL_TYPE column refers to the type of traffic control designated to that node. Table 4.1 lists traffic control types and describes each control type’s identification record. It is suggested that the user set up default-actuated signal control. More information can be found in the DynusT Wiki Online User’s Manual (2). 44 WISE SOFTWARE USERS GUIDE TABLE 4.1. TRAFFIC CONTROL TYPES FOR NODES Type Description 1 No control 2 Yield sign 3 Four-way stop sign 4 Pretimed signal control 5 Actuated signal control 6 Two-way stop sign LINK Worksheet This worksheet contains the following columns (Figure 4.2). Note that users may fill in the columns denoted by an asterisk (*) at their discretion; WISE will apply default settings to any fields in those columns that are not filled. • ID; • GRADE*; • Length; • NAME*; • Dir; • LEFTTURNBAY*; • TYPE; • LIMIT*; • LANES; • ADJSPEED*; • TAZ; • SATURATION_FLOW_RATE*; • From_ID; • MAX_SERVICE_RATE*; and • To_ID; • RIGHTTURNBAY*. Figure 4.2. LINK worksheet. 45 WISE SOFTWARE USERS GUIDE Although not always used in DynusT, the ID column is a reference that is necessary for the user. The Length column contains the length of each link in feet. The Dir column should contain a 0, 1, or –1 value. All links in DynusT are directional, and DynusT will convert links that are bidirectional into two separate links in opposing directions. (WISE will accept only two-way links, so if a WISE network is sent to DynusT, DynusT will convert it to one-way pairs. But it will not go the other way. That is, if a network exists in DynusT as one-way pairs, it must be manually converted to two-way links for use in WISE.) The Type column refers to the link’s functional class or functional type. Table 4.2 describes each link type’s identification record. The user must aggregate link classes from the planning network to these classes used in DynusT. Additional classes cannot be made or recognized in DynusT. TABLE 4.2. LINK FUNCTIONAL CLASSES Type Description 1 Freeway 2 Freeway segment with detector (for ramp metering) 3 On-ramp 4 Off-ramp 5 Arterial 6 HOT 7 Highway 8 HOV 9 Freeway HOT 10 Freeway HOV The Lanes column represents the number of lanes in each directional link. As stated earlier, all links in DynusT are directional links. Because many planning tools represent links by one link that is marked as bidirectional, the user must be diligent when creating a bidirectional link from one link listed. NEXTA may generate a warning message during the eventual import of the Excel template file (see the Importing Completed Data Sets section). The TAZ column indicates each link’s association with a TAZ, that is, the link is within the geographical boundary of the TAZ. If for any reason a link does not have a TAZ, you may enter a “0.” The From_ID and To_ID columns are the start node and end node of a link. As mentioned in the NODE Worksheet section earlier in this chapter, these node IDs should be listed in the NODE worksheet. You may fill in the remaining columns, denoted by an asterisk (*) in the list, at your discretion; WISE will apply default settings to any fields in those columns that are not filled. The Grade column contains the percentage highway grade of the link. The Name column designates the name of the link. The LeftTurnBay column contains the number of left turn bays downstream of the link. The Limit column is the speed limit of the link mph. The AdjSpeed column is a speed adjustment factor applied to 46 WISE SOFTWARE USERS GUIDE the speed limit. The Saturation_Flow_Rate column contains each link’s saturation flow rate; this value is used for arterial links because this rate is measured at intersections. DynusT uses this value for all arterial links, and the remaining link types will not use this value. The Max_Service_Rate column contains each link’s maximum service flow rate. The RightTurnBay column contains the number of right turn bays. ZONE Worksheet This worksheet contains columns for ZONENO and TAZ (Figure 4.3) Figure 4.3. ZONE worksheet. Entries to the ZONENO column must be in increasing, consecutive order starting from “1.” The TAZ column should be filled with the actual TAZ IDs from the user’s planning travel demand or similar traffic model. In a typical planning model, the TAZ number designation could be a sequence with skipped numbers not necessarily starting from a TAZ ID of 1; however, DynusT requires the zone numbers to start from 1 and be consecutive. This worksheet maintains the mapping between the DynusT zone number and the actual TAZ numbers from the user’s planning model. SIGNAL Worksheet This worksheet contains columns for MaxGreen, MinGreen, and Amber (Figure 4.4). Figure 4.4. SIGNAL worksheet. 47 WISE SOFTWARE USERS GUIDE As noted in the NODE Worksheet section earlier in this chapter, default traffic control can be placed on nodes. Because of the great possibility that the network is in a large, regional area, the network might be too large and the effort too time consuming for manual placement of signals at every intersection. It may be more realistic to indicate “default” traffic signals applied to the whole network from the start. This worksheet allows the user to quickly assign a default-actuated signal control. After the conversion process, the user may manually change signal timings if desired. The default signal type can only be actuated (i.e., not “pre-timed” or “none”). Importing Completed Data Sets Once the Excel template file is prepared, the user can import the file by navigating to File → Import Files → Import GIS Data Set → Import Network Table (Figure 4.5). NEXTA must have a new, blank project open. To open such a project, click File → New. Figure 4.5. Importing the Excel template file. As indicated earlier regarding the number of lanes and bidirectional links, during the import and conversion of the Excel template file, NEXTA will ask the following question as a warning: “Is the number of lanes on a two-way link for one direction only?” (Figure 4.6). Figure 4.6. NEXTA link direction warning. 48 WISE SOFTWARE USERS GUIDE This question refers to links in the spreadsheet that are labeled with Dir = 0 and asks whether the number of lanes for such a link is for one direction or the link is split evenly to be bidirectional. In other words, answering Yes imports the links as a 1, which is one-directional, and answering No imports the links as a 0, which is bidirectional. Once the import is complete, the user can see the network produced on NEXTA. To complete the conversion process, simply save the network by going to File → Save, create a new folder to contain all input files, and name the project file. For more information regarding the conversion process and other information regarding DynusT and NEXTA, see the DynusT Wiki Online User’s Manual (3). CREATING A NETWORK FROM SCRATCH To create a network from scratch, click Create Network under the Planning → Import Analysis Area tab (Figure 4.7). This will open the NEXTA interface. Figure 4.7. Create Network button. Once NEXTA is open, a new, blank NEXTA project should already be opened. If it is not, then click File → New in NEXTA. This will create a blank project. You can create new nodes, links, and zones using the network creation tools, as demonstrated in Figures 4.8 and 4.9. For more information, see the DynusT Wiki Online User’s Manual (4). 49 WISE SOFTWARE USERS GUIDE Figure 4.8. Create new nodes, links, and zones in NEXTA. Source: DynusT Online User’s Manual (4). Figure 4.9. Create new nodes, links, and zones in NEXTA (close-up of screen). Source: DynusT Online User’s Manual (4). 50 WISE SOFTWARE USERS GUIDE It is best to save the NEXTA project before engaging in network creation and editing. You must save the network in the location of the WISE WorkSpace, specifically in “*WISE WorkSpace folder*\Planning,” where “*WISE WorkSpace folder*” is the location and folder name of the WISE WorkSpace. Saving the network in this location is important. If the network is not in the correct folder, then WISE will experience and show an error (Figure 4.10). Unsuccessful Figure 4.10. WISE reports error in creating network from scratch. Once you have created the desired network, close the NEXTA window, and WISE will then recognize the network. To ensure that the network is correctly saved and recognized by WISE, click Edit Current Network (Figure 4.11). Figure 4.11. Edit Current Network button. 51 WISE SOFTWARE USERS GUIDE IMPORTING TRAFFIC INFORMATION The Planning Module can use existing traffic information available from an external source or separate traffic study. For example, users have the option to perform t raffic assignment analysis through an external traffic software package (e.g., TransCAD or CUBE) and then import the results as existing traffic information into WISE. The information that WISE uses is the link travel time and link flows from assignment. WISE supports imported traffic information for up to two different time periods, to recognize demand variance during the time of day. By default, WISE recognizes one peak demand as “day demand” and the other nonpeak demand as “night demand” (Figure 4.12). The user has the option to import two demand periods of interest in analyzing delay for either day or night or both, and the user may also define how many hours the two respective demand periods represent. WISE analyzes and estimates hourly traffic delay caused by the representative demand and then multiplies by the number of hours to obtain the daily traffic delay (i.e., user cost) that will be utilized in the sequencing algorithm. For example, if the user anticipates that major daytime traffic delay will occur during the morning peak of 6:00–9:00 a.m., then he or she can import a demand averaged from the period 6:00–9:00 a.m. as a day demand and define the number of hours associated with this demand as 3 h. WISE analyzes and estimates hourly delay and then multiplies by 3 to obtain daytime delay resulting from the representative demand. To import existing traffic information, follow the steps described in the next sections. Figure 4.12. Define number of hours of representative demand. 52 WISE SOFTWARE USERS GUIDE Preparing Input File A comma-delimited file (*.csv) titled Static_Import.csv must be prepared for the WISE software to import. The file contains columns for the following information. Figure 4.13 shows the format that is required to populate this information. • FROM_ID; • TO_ID; • DAY_TIME; • NIGHT_TIME; • DAY_FLOW; and • NIGHT_FLOW. Figure 4.13. STATIC_IMPORT.csv file opened in Excel. The FROM_ID and TO_ID are the start and end node IDs, respectively, of all existing links in the network. Every link must be represented in this file. The DAY_TIME and NIGHT_TIME columns refer to the link travel time in minutes. The DAY_FLOW and NIGHT_FLOW columns refer to the assigned flow rate in vehicles per hour (vph). If the WISE tool is being used for only daytime or only nighttime, enter “0” in the appropriate cells for whichever time period is not being used. Importing Origin–Destination Trip Demand Importing origin–destination (OD) trip demand involves importing OD trip tables that represent the daytime period and nighttime period being modeled in WISE. The demand information should correspond to the zonal count of the imported network. The demand serves as the input for the static assignment if the user is running the static assignment function in WISE (i.e., Import Existing Static Assignment is not being used). Preparing OD Trip Demand File The general procedure to prepare the OD trip tables in the format that WISE requires for conversion follows. 53 WISE SOFTWARE USERS GUIDE 1. Export from the user’s planning software the demand (OD) data to a commadelimited (*.csv) text file (Figure 4.14). 2. Save the file as a *.txt file. For daytime demand, save the file as day.txt. For nighttime demand, save the file as night.txt. Figure 4.14. Three-column format of OD trip table. Importing Demand Data Once the demand text files have been prepared, click Import DAY Demand (or Import Night Demand), as shown in Figure 4.15, and a file browser will open. Choose the location of the day.txt file (Figure 4.16). The function will then convert the demand information to the format required by the WISE software. Figure 4.15. Import demand data. 54 WISE SOFTWARE USERS GUIDE Figure 4.16. Select the demand text file. REFERENCES 1. DynusT Wiki Online User’s Manual. Getting Started: Generation Links and Destination Nodes. http://dynust.net/wikibin/doku.php?id=start:getting_ started#generation_links_and_destination_nodes. 2. DynusT Wiki Online User’s Manual. Getting Started: Generation Links and Destination Nodes—Default Control Signals. http://dynust.net/wikibin/doku. php?id=start:getting_started#default_control_signals. 3. DynusT Wiki Online User’s Manual. Getting Started: Importing Datasets. http:// dynust.net/wikibin/doku.php?id=start:getting_started#importing_datasets. 4. DynusT Wiki Online User’s Manual. Getting Started: Network Basics. http:// dynust.net/wikibin/doku.php?id=start:getting_started#network_basics. 55 WISE SOFTWARE USERS GUIDE 5 OPERATION MODULE HAND-OFF FROM PLANNING TO OPERATION (INTERCONNECTION) Traffic diversion resulting from work zone congestion is an important input to the WISE model. The WISE default diversion, based on static assignment, is not optimal. Users can manually input their own estimates of diversion, as explained previously. Users also can choose to simulate work zones in their network models and manually input the diversion factors into the WISE model. (This is the alternative that was implemented for the Phase 4 operational tests for validation and pilot test sites.) Alternatively, users can create and implement the DynusT networks and models, as described below; this option allows for direct transfer of diversion factors between the Operation and Planning modules of WISE. DynusT DynusT is a software package for dynamic traffic simulation and assignment (DTA) that can support engineers and planners in addressing emerging transportation planning and operations issues. With DynusT, engineers and planners can estimate the evolution of systemwide traffic flow dynamics patterns that result from individual drivers’ seeking the best routes to their destinations and responding to changing network demand, supply, or control conditions. DynusT was not developed to replace travel demand models or microscopic simulation approaches; instead, by integrating with these models, it is aimed at supporting application areas in which realistic traffic dynamic representation is needed for a large-scale regional or corridor network. These application areas include assessing the impacts of alternate traffic operations and control strategies and evaluating strategies for work zone, incident, and special event management. Engineers or planners can also use the software to assess the impacts of intelligent transportation system technologies, 56 such as dynamic message signs, ramp meters, and in-vehicle guidance systems, on the transportation network. In addition, DynusT can both evaluate congestion-pricing schemes for toll roads and produce traffic operations data for air quality analyses. DynusT consists of iterative interactions between its two main modules: traffic simulation and traffic assignment. Vehicles are created and loaded into the network based on their respective origins and follow a specific route based on their intended destinations. The large-scale simulation of networkwide traffic is accomplished through the mesoscopic simulation approach that omits inter-vehicle car-following details while maintaining realistic macroscopic traffic properties (e.g., speed, density, and flow). After simulation, necessary measures of effectiveness (MoEs) are fed into the traffic assignment module. It consists of two algorithmic components: a timedependent shortest-path (TDSP) algorithm and time-dependent traffic assignment. The TDSP algorithm determines the time-dependent shortest path for each departure time, and the traffic assignment component assigns a portion of the vehicles departing at the same time between the same OD pair to the time-dependent least-travel time path, following the “route swapping” type of traffic assignment procedure. DynusT in WISE DynusT provides the main functionality for the Operation Module. The module’s function is to dive deeper into the time-varying interactions occurring between traffic and the network during a work zone project. What a static model cannot capture— time-dependent congestion and diversion caused by congestion—a simulation model such as DynusT can. DynusT can still use the macroscopic network yet provide indepth information of a microscopic simulation model. The Operation Module requires the sensitivity of a simulation model that responds to congestion so that diversion response is reported in a robust and intuitive manner. The Operation Module attains a more accurate estimation of diversion due to the capacity reduction (i.e., work zone project, based on the network and simulation outcome). In WISE, this diversion is reported back to the WISE system, and the user can choose whether to use this estimated diversion rate (i.e., feedback) in the Planning Module. Based on this new diversion rate, the user can model whether this diversion changes the sequencing of projects. Dynamic Traffic Assignment DTA models have become a viable modeling option. They supplement existing travel forecasting models and microscopic traffic simulation models. Travel forecasting models represent the static regional travel analysis capability, whereas microscopic traffic simulation models are superior for dynamic corridor-level travel analysis. DTA models fill in the gap by enabling dynamic traffic to be modeled at a range of scales from the corridor level to the regional level with expanded and unique functional capabilities enabled by the DTA methodology. The objective of static traffic assignment is to determine network traffic flows and conditions resulting from demand or supply interactions via route choices from travelers. Route choice behavior is based on the assumption that all travelers intend to travel from their origin to their destination in the shortest time. When every traveler 57 WISE SOFTWARE USERS GUIDE succeeds in finding such a route, every used route has the minimum time or cost between its origin and destination; moreover, for each OD pair, every route used has the same travel time. This condition is known as user optimal or user equilibrium. DTA has a similar objective but with a representation of time variations in traffic flows and conditions, thus attempting to reflect the reality of traffic networks. Dynamic network analysis models seek to provide another, more detailed means to represent the interaction among travel choices, traffic flows, and time and cost measures in a temporally coherent manner (e.g., to further improve the existing time-of-day static assignment approach). More specifically, DTA models aim to describe such timevarying network and demand interaction using a behaviorally sound approach. The DTA model analysis results can be used to evaluate many more meaningful measures related to individual travel time and cost as well as systemwide network measures for regional planning purposes. To learn more about DTA, see Dynamic Traffic Assignment—A Primer (1). RUNNING A WISE PROJECT IN OPERATIONS (DynusT) Importing Time-Dependent Demand Because the Operation Module is aimed at examining the time-varying congestion interactions, the user has the option to input time-dependent demand to represent changes in service demand over time, especially for the peak periods of congestion. DynusT uses OD trip demand as the input for vehicle generation for simulation. With NEXTA, the modeler can create time-dependent demand for a peak period of interest. The demand being imported is a single demand matrix being divided into several demand periods. The general procedure for time-dependent demand conversion follows: 1. Export from the planning software the demand (OD) data to a comma-delimited (*.csv) text file. 2. Go to the installation directory of DynusT. The typical path to this folder is C:\ Program Files \DynusT 3.1 (32 bit). 3. Copy the demand.txt file to another working location. This is the file that will be edited and imported to create the demand for DynusT. 4. Open the demand.txt file. It should look similar to the file shown in Figure 5.1. 5. Replace the information in this text file. The fields are explained in the following steps. a. Line 3: Number of zones in the network; b. Line 6: Number of demand periods that will be created from this import file; c. Line 8: The uniform time duration of the demand periods being imported; and d. Line 10: The percentage of demand to each demand period from the single demand table being imported. 6. Copy the exported demand data from step 1 and paste the data starting at line 12. 7. Save the demand.txt file. 58 WISE SOFTWARE USERS GUIDE 8. Open NEXTA and open the existing network project to which the demand will be imported. 9. In NEXTA go to File → Import Files → Import GIS Data Set → Import Demand Table (Figure 5.2). Figure 5.1. Text file of importing time-dependent demand. Figure 5.1 explains the fields more completely. The “2000” indicates the number of zones in the network and should be changed to reflect the correct number of zones in the WISE network at the time of use. The user must provide this number as input since the program does not have any way of distinguishing a zone from a node. The “4” indicates the number of demand matrices that this importing demand data is going to represent (e.g., if a demand matrix from the planning tool represents a 24-hour time period and this table is being divided 24 times, then there will be 24 demand intervals). The “60” represents the length of time (in minutes) that each demand interval represents. Line 10 provides the percentage of demand that each demand interval will have from the total demand data. For example, the first OD pair is from zone 1 to zone 1, 59 WISE SOFTWARE USERS GUIDE and the demand for this pair over the 4 h (four demand intervals at 60 min per interval) is 46.3333. The demand for each 1-h interval will then be 11.12, 13.90, 12.1, and 8.80, based on the percentages provided in line 10. Figure 5.2. Importing time-dependent demand text file. OPERATIONS TRAFFIC DIVERSION The Operation Module can only be utilized once the Planning Module has been set up with projects and a valid network. The Operation Module is used to calculate a diversion for each project to be used in the WISE Analysis Engine as specified in the Project Information for each project. Once the Planning WorkSpace is set up, the Operation tab will populate with a list of all projects in the WorkSpace (Figure 5.3). The user must run a base scenario for all projects and an individual project scenario for each project for which the user would like the Operation Module to provide Diversion calculations. Figure 5.3. Operation Module’s list of all projects in WorkSpace. 60 WISE SOFTWARE USERS GUIDE Base Scenario To run the base scenario for all projects, click Operation tab →Run Base Scenario (Figure 5.4). The Operation Module will perform a validation check of the Planning Module and only run if the WorkSpace passes Planning WorkSpace Validation. If the Planning WorkSpace Validation is clear, the WISE GUI will launch NEXTA for the base scenario. You must then launch DynusT to perform an analysis. Once DynusT has completed the analysis of the base scenario, close NEXTA/DynusT, and, if the analysis was successful, the WISE Operation module will then populate the Base Volume column with the Base Volume value generated by the DynusT analysis of each project (Figure 5.4). WISE will display an error if the DynusT run was unsuccessful. Figure 5.4. Operation Module: Project Volume population. 61 WISE SOFTWARE USERS GUIDE Individual Scenario To run the individual scenario for a project, from the Operation tab’s Projects list, select the check box next to the desired project and then select Run Selected Project Scenario (Figure 5.5). Figure 5.5. Operation Module: Run Selected Project Scenario. 62 WISE SOFTWARE USERS GUIDE The Operation Module will perform a validation of the Planning Module and only run if the WorkSpace passes Planning WorkSpace Validation. If the Planning W orkSpace Validation is clear, the WISE GUI will launch NEXTA for the specific Project Scenario. The user must then launch DynusT to perform an analysis. Once DynusT has completed the analysis of the project scenario, close NEXTA/DynusT, and if the analysis was successful, the WISE Operation Tab will now populate the Project Volume column with the Volume from the DynusT analysis of the specific project scenario, as seen for Project 1 in Figure 5.6. WISE will display an error if the DynusT run was unsuccessful. (Note: WISE does not provide information on why a DynusT run might be unsuccessful. DynusT is supported by the University of Arizona, and as such users should contact the University of Arizona for support.) Figure 5.6. Operation Module: Project Volumes. 63 WISE SOFTWARE USERS GUIDE Modifications to Projects after Operation Scenario Runs If a project is modified within the Planning Module, then the project and base scenarios may need to be run again to collect the correct volumes for the new Project scenario. You can identify whether a project has been modified since collection of the Base and Project volumes by viewing the Project Modified column on the Operation tab’s Projects list (Figure 5.7). An entry of FALSE in that column means that no changes have been made to the project or any of its associated attributes since the volumes were last collected. An entry of True in the column (Figure 5.7, Project 1) means that the project or attributes associated with it have been modified since the volumes were last collected, and the user may want to rerun the base and/or project scenarios. Figure 5.7. Operation Module: internal checks. REFERENCE 1. Chiu, Y.-C., J. Bottom, M. Mahut, A. Paz, R. Balakrishna, T. Waller, and J. Hicks. Transportation Research Circular E-C153: Dynamic Traffic Assignment—A Primer, Transportation Research Board of the National Academies, Washington, D.C., 2011. www.trb.org/DataInformationTechnology/Blurbs/165620.aspx. 64 WISE SOFTWARE USERS GUIDE 6 HAND-OFF FROM OPERATION BACK TO PLANNING Once a given project has collected the data for the Base and Project scenarios, you can use the operation-supplied diversion in the Project Info tab in the Planning Module (see Creating Projects in Chapter 3). Thus, to modify a project, the user can now go back and select Operation-Supplied Diversion. The operation-supplied diversion is available only if the Operation Module produced a valid diversion (see Chapter 8, Data Limits, for details on valid diversion values). Otherwise the operation-supplied diversion will remain “null” in the Project Info tab. Once the Operation Module has a valid diversion, the user may choose to go back to the WISE Planning Module’s Analysis Engine and rerun the analysis with the new diversion. 65 7 ACRONYMS AND GLOSSARY CLASSIFICATION OF SOFTWARE FUNCTIONALITIES Transportation Modeling Categories analytical or deterministic. Analytical and deterministic tools are usually based on the procedures found in the Highway Capacity Manual. The resulting factors—capacity, density, level of service (LOS), delay, queue—from these tools are based on empirical equations derived from field data and small-scale experiments. This type of tool is able to analyze small-scale effects but is not practical for large-scale, network applications. DynusT. This dynamic traffic assignment simulation model was released under a GNU General Public License as a precondition for award of SHRP 2 Project C10B, Partnership to Develop an Integrated, Advanced Travel Demand Model with Fine-Grained, Time-Sensitive Networks: Sacramento-Area Application. (A GNU General Public License is a free software license. DTALite and DynusT were released under this license for use in SHRP 2 Projects C05 and C10B) A dynamic traffic assignment model is a computerized analysis package that tracks the movements of individual vehicles in a model street network and quantifies the performance of the network by summing the results of individual vehicle movements. DynusT is being enhanced and mated with SACSIM, which is an activity-based traffic model released in an open-source format by the Sacramento Area Council of Governments. This model will be enhanced and mated with DynusT in the SHRP 2 C10B project. DynusT is also the platform for the WISE Operation Module. GUI. Graphical user interface. 66 simulation, macroscopic. Macroscopic simulation models use the fundamental traffic qualities of speed, volume, and density on a sectional basis (i.e., network links). This means that tracking individual cars in a macroscopic model is impossible. They require less detailed network link data to operate than do microscopic models, but they do not offer as much detail. simulation, mesoscopic. Mesoscopic simulation models provide middle ground between the macro- and microscopic approaches. Mesoscopic models typically are able to track individual vehicles, but they also rely on speed, volume, and density relationships to determine the movement of these vehicles. simulation, microscopic. Microscopic simulation models are capable of tracking individual vehicles on a second-by-second basis to capture the ways that these vehicles interact with each other. This means that these models employ car-following and lanechanging algorithms to determine individual vehicle behaviors. tool suite. A tool suite is a computer software package that combines two or three of the simulation types described above. In this way, a user is able to easily model a network with different fidelities when necessary. Examples include VISSIM with VISUM and TransCAD with TransModeler. traffic signal optimization. Traffic signal optimization software packages are tools used to develop signal-timing plans at both isolated locations and synchronized corridors or grids. These tools also require basic information such as traffic counts for intersections. travel demand model. Travel demand models are mathematical models that are used to determine the travel patterns based on demand. Originally, these types of models were developed to determine the impact of infrastructure improvements. They forecast specific outputs, such as mode choice, destination choice, and route choice. GEOGRAPHIC SCALE The geographic scale of a work zone becomes important when attempting to model potential traffic impacts. A variety of software packages exists across a broad spectrum for modeling different sizes of networks. Software on the lower end of the spectrum, such as Highway Capacity Software (HCS), describes traffic with simple in/out patterns and is a good match for isolated work zones. Other types of software that are capable of modeling entire regional road systems would be a good fit for network (grid) and regional work zones where detours may need to be analyzed. The geographic scale of a work zone is a consideration of both the size and impact of any potential road work. The types of work zone geographic scales fall into four main categories: isolated, corridor (pipe), network (grid), and regional. 67 WISE SOFTWARE USERS GUIDE corridor (pipe). A corridor work zone (or pipe work zone) is any road work that occurs along a major highway segment. An example of this type of work zone would be an interstate widening or repaving project. This type of work zone is slightly larger in size and has the potential to cause more traffic disruption on the regional level. isolated. An isolated work zone can be thought of as a single point within a much larger network. Examples of isolated work zones can include rural lane closures or redesigned intersections. This type of work zone is small in size and should have minimal impact on traffic over the regional network. network (grid). A network work zone (or grid work zone) is any project that involves construction on connected, interdependent roads with multiple access points. This type of construction may also require one or more viable alternate routes. Examples include interstate reconstruction, full roadway closures, and work zones in urban centers. This type of work zone is large in size and will disrupt traffic patterns on a large scale. However, the impact is usually restricted to an urban area. regional. A regional work zone is similar to a network work zone in that it involves construction taking place on connected and interdependent routes and may require detours. The difference between the two is the size of the traffic impacts. Regional work zones will cause regional-level traffic impacts. This could possibly mean disrupting several urban areas or several towns in a region. FUNCTIONALITY Software tools are used to make decisions regarding planning, operations, construction management, and logistics. Based on each field’s purpose, the functionality ranges from cost–benefit analysis to traffic impacts and delay to efficient material transport and management. construction management. Construction management involves the overall planning, coordination, determination of resource requirements, and implementation of the project. Determination of time-of-day for construction, project design and optimal construction scheduling, and traffic impact analysis are considered as part of the analysis for estimating the impact of management strategies. logistics. Logistics involves determining efficient practices to transport materials and optimal scheduling to reduce operational and storage costs. The work zone logistics would involve, for example, the duration of the closure of lanes and determining construction techniques and how the workers will put up the cones. operations. Operations involve analysis of current management and safety of traffic and other users. Operations typically involve planning and maintaining signs, signals, pavement markings, and lighting. The management of ITS and safety initiatives to 68 WISE SOFTWARE USERS GUIDE improve driver behavior are considered. Determination of traffic measurements such as delay, speed, occupancy, levels of service, queue lengths, and others are used to evaluate the behavior and functionality of traffic operations and management. planning. Planning involves making long-term decisions and goals. The involvement of all users of the system is normally considered as part of the process as improvement strategies are evaluated to improve the overall functionality of the system. Forecasting future demand growth, employment, and land use are normally considered, as well as estimating impacts of proposed future improvements. USERS AND PROPRIETARY ISSUES Users such as engineers and transportation planners are intended to incorporate software packages that were evaluated for various functionalities identified in the previous section. engineers. Use by engineers typically involves studying traffic impacts from an operational aspect as well as the planning process of project-specific construction and operational management strategies. Project design and coordination are topics considered with the engineers interested in actual implementation of such strategies. planners. Use by planners typically involves the advanced long-term planning of strategies for a road network depicting various projects to improve systemwide functionality. Demand forecasting, employment, and land use strategies are topics of interest for such planners, as well as system effects and air quality issues based on traffic and population growth. proprietary. Proprietary software is defined as software that is licensed under exclusive legal right of the developer and/or owner. The user is given the right to use the software under license agreements and is restricted from tampering with and modifying such software. Other software may be termed as open source or freeware, meaning the use and licensing are more liberal in the use of, the study of, and changes and improvements of software made by users. Freeware focuses more on the free use of software, and open source is focused on the community use and development of software to benefit the overall software community. DATA INPUTS cost of various strategies. Different construction strategies have different implications on life-cycle costs. Use of fast construction material and techniques can result in reduction in the period of time work zones are implemented but may require higher regular maintenance costs during the life cycle of the project. These costs and benefits need to be evaluated at a life-cycle level. 69 WISE SOFTWARE USERS GUIDE pavement. As identified in the interviews in Phase 1, for most departments of transportation (DOTs) and metropolitan planning organizations (MPOs), pavement management systems play a critical role in determining projects and project sequencing. Therefore, it is critical to determine the software tools that need pavement inputs and how they are used. production rate for various strategies. Several construction strategies identified during the interviews have different production rates depending on the materials being used, the construction technique, weather, and night versus day. Such factors have a significant effect on the duration of the work zone. traffic. Traffic data include volume counts, speeds, travel time, and density and are used to calibrate and validate simulation models. MEASURES OF EFFECTIVENESS agency cost. For the WISE Software Program, agency cost is the project-related cost to construct each of the renewal projects listed in the analysis. The construction cost includes all expenditures necessary for the design, construction, and maintenance of traffic costs incurred during construction. Agency cost does not include the delay cost incurred by the driving public. If a project is delayed, the agency cost includes the increase in the project cost due to postponing the construction of the project. environmental impact. The environmental impact is directly related to the amount of emissions vehicles make during their trips. This measure is especially relevant when a large amount of congestion is present. road user cost. This figurative cost is ascribed to all road users who face delay and congestion It represents the negative impact of such road conditions and the road user’s preference to avoid such costs. safety surrogate. Any data set that can act as a surrogate to safety. For example, speed variance, number of lane changes, and conflicting points. traffic conditions. Traffic conditions represent a broad data set used by traffic engineers and planners to assess the traffic conditions (such as speed, delays, accelerations, lane changing) on any particular roadway. queue length and delay. Queue lengths and delays are used as a measure of effectiveness to evaluate the type and level of impact a work zone will have. RESOURCE REQUIREMENTS animation or presentation. When applied to software, the term often means its ability to make animations or presentations. This is very important for traffic simulation, not only to present results but also to locate trouble spots in the network. 70 WISE SOFTWARE USERS GUIDE availability of source code or algorithm. Open-source software is any computer program that allows fellow developers to see the actual code that makes up the software. This visibility makes it easier for developers in similar areas to calibrate. Open-source software is usually free or donation-based. computational speed. The computational speed of software is a measure of the amount of time it takes to execute all of the required steps from start to finish. Most steps can be performed in a matter of minutes, but steps in more complicated systems can take several hours. cost. The cost of software is the price that the developer and/or publisher asks the user to pay for the product. This is the opposite of nonproprietary software, which is available for free or by donation. effort in application. The amount of effort required to transfer an existing network or data set into a newer system. Excel based. Excel-based software uses Microsoft Excel as a “window” into which the software is entered. This means that the software is merely an extension of Excel rather than a unique software package. level of effort for training. A measure of a software package’s ease of use. Easy software can be understood after only a few demonstrations, but more complicated software may require several days of training. As a general rule, open-source software is usually more complex and less user-friendly than commercially developed software. memory. The amount of memory a given program will take up is a measure of the size (in bytes) of the program and its files. transferability of data to other packages. The ability of data to be exchanged across multiple packages is important in order to coordinate output between packages. This is usually facilitated by either file conversion or reliance on a universal file format. DYNAMIC DEMAND CHANGES departure time choice. Departure time choice is usually a facet of the mode choice a traveler must make. For instance, a traveler using a passenger car may depart at any time, while a traveler using bus transit must wait until the next bus arrives in order to depart. destination change. A destination change occurs when a traveler diverts to a destination other than the one originally intended when the trip began. induced or foregone demand. Induced demand (latent demand) is a phenomenon that occurs when traffic volumes increase when facility LOS and/or capacities increase. Foregone demand is the opposite effect, when facilities with low LOS and/or capacities experience lower volumes because of travelers’ hesitancy to use such facilities. 71 WISE SOFTWARE USERS GUIDE mode shift. Any shift in mode that a traveler makes in order to complete a trip. This action could be part of an overall trip plan or could result from dissatisfaction with the current mode. route diversion, en route. A diversion that occurs when travelers decide to alter their route during the trip. This diversion might be because of any of a number of factors, including Intelligent Transportation System (ITS) signs warning of impending congestion, radio announcements, word-of-mouth, or approaching traffic congestion perceived first-hand. route diversion, pretrip. A type of diversion that occurs when a traveler decides to alter his or her route before the trip begins. 72 WISE SOFTWARE USERS GUIDE 8 DATA LIMITS TABLE 8.1. “PROJECT INFORMATION” CONSTRAINTS Field GUI Value Comment Work zone speed 5 ≤ x ≤ the original speed limit; integer The work zone speed limit cannot be zero or cannot be faster than original speed limit. User-supplied diversion rate If user-defined diverge is TRUE, then 1 ≤ x ≤ 100; integer. If user-defined diverge is FALSE, then x = 0 If the route divergence uses user-defined rate, then 1 ≤ x ≤ 100; integer. If the route divergence computes diverge rate internally, then x = 0. Day cost Integer and nonnegative Night cost Integer and nonnegative Agency cost should be realistic. Capacity/lane reduction x ≥ 0.01; float Percentage of capacity reduction due to work zone construction. Should be greater or equal to 0.01. Duration Integer; 1 ≤ x ≤ (latest end time – earliest start time); Note the caution below about duration-based strategies. Such strategies must not result in zero or negative duration. Duration-based strategy* If one project i was applied by a duration-based strategy k, then the duration of project i ≥ duration-based strategy + 1 Duration-based strategy cannot reduce the project duration to zero or negative. Link Single use Each project is unique link. *The reduction amount of the duration strategy specified in “Project Information” must be less than the project duration. Each strategy and duration reduction is applied on a project-by-project basis. 73 TABLE 8.2. “STRATEGY INFORMATION” CONSTRAINTS Field GUI Value Comment Demand-reduction rate 1 ≤ x ≤ 5; integer Demand-based strategy cannot reduce demand more than 5%. Demand-based radius 1 ≤ x ≤ 5; integer Demand-based strategy is only effective to reduce demand within a radius of 1 and 5 miles around the construction link. Demand-based cost Integer, nonnegative Agency cost. Duration reduction* Integer x ≥ 1 Duration-based cost Integer, nonnegative Agency cost. *Reduction means a reduction in construction duration time when the strategy is applied to a project. Each duration strategy is applied to a project on a case-by-case basis. TABLE 8.3. “PLANNING CHARACTERISTICS” CONSTRAINTS Field GUI Value Comment Value of time $5 < x < $300; float Between $5 and $300. Start time year 2010; integer Cannot be less than the year 2010. End time year 2030; integer Cannot exceed the year 2030. Day number of hours 1 ≤ x ≤ 12; float Between 1 and 12 hours of day. Night number of hours 1 ≤ x ≤ 12; float Between 1 and 12 hours of night. Seasonal factors 0.5 ≤ x ≤ 1.5; float Stay within reasonable range. Number of projects 1 ≤ x ≤ 20; integer The engine cannot exceed more than 20 projects. If any errors related to these data limitation fields are made, the user will be prompted by the engine, which will indicate that an error has been made and that an error file called “error_log.txt” was produced. 74 WISE SOFTWARE USERS GUIDE 9 BIBLIOGRAPHY Anastasopoulos, P., S. Labi, B. McCullouch. Identifying the Appropriate Contract Types for Highway Maintenance and Rehabilitation Projects on the Basis of Project Characteristics. Presented at 88th Annual Meeting of the Transportation Research Board, Washington, D.C., 2009. This report analyzes traditional versus innovative contracts using simultaneous equation models. This work will provide useful insights into cost–benefit decision making with regard to innovative contracting. The use of calendar completion versus working day completion contracts as well as incentive or disincentive clauses in contracts shifts some of the risk of late completion onto the contractor, but agencies may pay a significant premium for such a shift. Anderson, S. NCHRP Report 574: Guidance for Cost Estimation and Management for Highway Projects During Planning, Programming, and Preconstruction, Transportation Research Board of the National Academies, Washington, D.C., 2007. Analysis of complex variables of material, labor, and right-of-way costs with imprecise or incomplete information at the planning and program management stages is inherently difficult and uncertain. This report is helpful in building scenario analysis capabilities. Anderson, S. D., and I. Damnjanovic. NCHRP Synthesis of Highway Practice 379: Selection and Evaluation of Alternative Contracting Methods to Accelerate Project Completion. Transportation Research Board of the National Academies, Washington, D.C., 2008. This report presents a methodology for identifying, evaluating, and selecting alternative contracting procedures. Cambridge Systematics. SHRP 2 Report S2-C02-RR: Performance Measurement Framework for Highway Capacity Decision Making. Transportation Research Board of the National Academies, Washington, D.C., 2009. SHRP 2 Capacity Project C01 may be of interest. 75 Cambridge Systematics. Tool Summary Sheets. NCHRP Project 20-57. 2005. http://tam. transportation.org/Documents/TAM%20Files%20-%20Tools/Task4AppC.pdf. These sheets summarize the capabilities and limitations of 11 modeling software packages, including HDM-4, HERS/ST, and STEAM, that evaluate econometric and other parameters. The sheets assisted in the identification and evaluation of commercially available software products called for under Task 5 of this project. Cambridge Systematics, PB Consult, and System Metrics Group. NCHRP Report 545: Analytical Tools for Asset Management. Transportation Research Board of the National Academies, Washington, D.C., 2005. This report provides a useful framework for evaluating trade-offs in decision-making processes in transportation program development. Evaluation of trade-offs is critical to the selection and weighting of performance measures and is the foundation of the development of scenario analysis/comparison models. Chiu, Y.-C., J. Bottom, M. Mahut, A. Paz, R. Balakrishna, T. Waller, and J. Hicks. Transportation Research Circular E-C153: Dynamic Traffic Assignment—A Primer. Transportation Research Board of the National Academies, Washington, D.C., 2011. www.trb.org/ DataInformationTechnology/Blurbs/165620.aspx. DynusT Online User’s Manual. http://dynust.net/wikibin/doku.php?id=start. FHWA, U.S. Department of Transportation. Work Zone Mobility and Safety Program. www.ops.fhwa.dot.gov/wz. This webpage provides sections on performance measurement development, work zone traffic management guidance and examples (includes state-developed traffic management resources), peer-to-peer program for work zones, and work zone mobility and safety self-assessments (includes an assessment by state departments of transportation on the integration of work zone mobility and safety as part of the planning process). ICF International and URS Corporation. SHRP 2 Report S2-C01-RW-1: A Framework for Collaborative Decision Making on Additions to Highway Capacity. Transportation Research Board of the National Academies, Washington, D.C., forthcoming. Ma, W., R. L. Cheu, and D.-H. Lee. Scheduling of Lane Closures Using Genetic Algorithms with Traffic Assignments and Distributed Simulations. Journal of Transportation Engineering, Vol. 130, No. 3, 2004, pp. 322–329. This article presents findings of scheduling of lane closures, particularly the redistribution of traffic across a network as a result of such closures. The genetic algorithms presented will provide useful insights into sequencing multiple lane closures so that traffic is not redistributed onto already bottlenecked portions of the network. 76 WISE SOFTWARE USERS GUIDE Maze, T., and J. Wiegand. Lane Closure Policy Development, Enforcement, and E xceptions: A Survey of Seven State Transportation Agencies. Center for Transportation Research and Education, 2007. This report provides a useful summary of performance measure selection by several state departments of transportation. Zhu, Y., and I. Ahmad. Developing a Realistic-Prototyping RUC Evaluation Tool for FDOT. Florida Department of Transportation, 2008. This report outlines a software tool developed to calculate road user costs (RUCs) for various scenarios using readily available data. 77 WISE SOFTWARE USERS GUIDE RELATED SHRP 2 RESEARCH Project Management Strategies for Complex Projects (R10) Analytical Procedures for Determining the Impacts of Reliability Mitigation Strategies (L03) Evaluating Alternative Operations Strategies to Improve Travel Time Reliability (L11) TRB OVERSIGHT COMMITTEE FOR THE STRATEGIC HIGHWAY RESEARCH PROGRAM 2* Chair: Kirk T. Steudle, Director, Michigan Department of Transportation MEMBERS H. Norman Abramson, Executive Vice President (retired), Southwest Research Institute Alan C. Clark, MPO Director, Houston–Galveston Area Council Frank L. Danchetz, Vice President, ARCADIS-US, Inc. Malcolm Dougherty, Director, California Department of Transportation Stanley Gee, Executive Deputy Commissioner, New York State Department of Transportation Mary L. Klein, President and CEO, NatureServe Michael P. Lewis, Director, Rhode Island Department of Transportation John R. Njord, Executive Director (retired), Utah Department of Transportation Charles F. Potts, Chief Executive Officer, Heritage Construction and Materials Ananth K. Prasad, Secretary, Florida Department of Transportation Gerald M. Ross, Chief Engineer (retired), Georgia Department of Transportation George E. Schoener, Executive Director, I-95 Corridor Coalition Kumares C. Sinha, Olson Distinguished Professor of Civil Engineering, Purdue University Paul Trombino III, Director, Iowa Department of Transportation EX OFFICIO MEMBERS Victor M. Mendez, Administrator, Federal Highway Administration David L. Strickland, Administrator, National Highway Transportation Safety Administration Frederick “Bud” Wright, Executive Director, American Association of State Highway and Transportation Officials LIAISONS Ken Jacoby, Communications and Outreach Team Director, Office of Corporate Research, Technology, and Innovation Management, Federal Highway Administration Tony Kane, Director, Engineering and Technical Services, American Association of State Highway and Transportation Officials Jeffrey F. Paniati, Executive Director, Federal Highway Administration John Pearson, Program Director, Council of Deputy Ministers Responsible for Transportation and Highway Safety, Canada Michael F. Trentacoste, Associate Administrator, Research, Development, and Technology, Federal Highway Administration * Membership as of March 2014. RENEWAL TECHNICAL COORDINATING COMMITTEE* Chair: Daniel D’Angelo, Recovery Acting Manager, Director and Deputy Chief Engineer, Office of Design, New York State Department of Transportation MEMBERS Rachel Arulraj, President, InfoInnovation Michael E. Ayers, Consultant, Technology Services, American Concrete Pavement Association Thomas E. Baker, State Materials Engineer, Washington State Department of Transportation John E. Breen, Al-Rashid Chair in Civil Engineering Emeritus, University of Texas at Austin Steven D. DeWitt, Chief Engineer (retired), North Carolina Turnpike Authority Tom W. Donovan, Senior Right of Way Agent (retired), California Department of Transportation Alan D. Fisher, Manager, Construction Structures Group, Cianbro Corporation Michael Hemmingsen, Davison Transportation Service Center Manager (retired), Michigan Department of Transportation Bruce Johnson, State Bridge Engineer, Oregon Department of Transportation, Bridge Engineering Section Leonnie Kavanagh, PhD Candidate, Seasonal Lecturer, Civil Engineering Department, University of Manitoba Cathy Nelson, Technical Services Manager/Chief Engineer (retired), Oregon Department of Transportation John J. Robinson, Jr., Assistant Chief Counsel, Pennsylvania Department of Transportation, Governor’s Office of General Counsel Ted M. Scott II, Director, Engineering, American Trucking Associations, Inc. Gary D. Taylor, Professional Engineer Gary C. Whited, Program Manager, Construction and Materials Support Center, University of Wisconsin–Madison AASHTO LIAISON James T. McDonnell, Program Director for Engineering, American Association of State Highway and Transportation Officials FHWA LIAISONS Steve Gaj, Leader, System Management and Monitoring Team, Office of Asset Management, Federal Highway Administration Cheryl Allen Richter, Assistant Director, Pavement Research and Development, Office of Infrastructure Research and Development, Federal Highway Administration J. B. “Butch” Wlaschin, Director, Office of Asset Management, Federal Highway Administration CANADA LIAISON Lance Vigfusson, Assistant Deputy Minister of Engineering & Operations, Manitoba Infrastructure and Transportation *Membership as of March 2014.


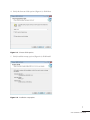

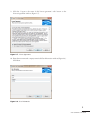
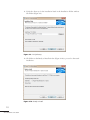
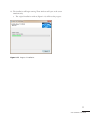
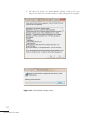
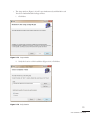
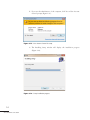
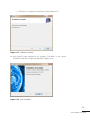

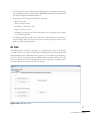
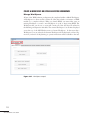
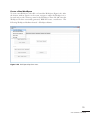
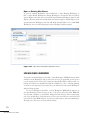


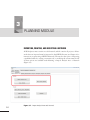


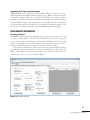


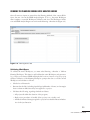

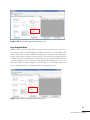

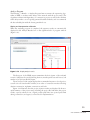


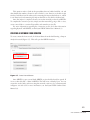
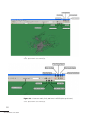
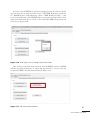

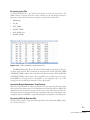

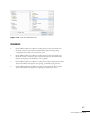


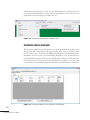

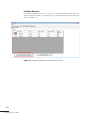

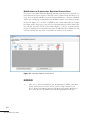


![印刷用ファイル [ PDF : 1.17MB ]](http://vs1.manualzilla.com/store/data/006692730_2-bd661243baf3a597f77c31ad567709e6-150x150.png)