1
gdb960 User's Manual
Order Number: 485546-003
Revision
Revision History
Date
-001
Original Issue.
05/94
-002
Revised for R5.0.
02/96
-003
Revised for R5.1.
01/97
In the United States, additional copies of this manual or other Intel literature may be obtained by writing:
Literature Distribution Center
Intel Corporation
P.O. Box 7641
Mt. Prospect, IL 60056-7641
Or you can call the following toll-free number:
1-800-548-4725
In locations outside the United States, obtain additional copies of Intel documentation by contacting your local Intel
sales office.
Intel Corporation makes no warranty of any kind with regard to this material, including, but not limited to, the implied
warranties of merchantability and fitness for a particular purpose. Intel Corporation assumes no responsibility for any
errors that may appear in this document. Intel Corporation makes no commitment to update nor to keep current the
information contained in this document.
Intel Corporation assumes no responsibility for the use of any circuitry other than circuitry embodied in an Intel
product. No other circuit patent licenses are implied.
Intel software products are copyrighted by and shall remain the property of Intel Corporation. Use, duplication or
disclosure is subject to restrictions stated in Intel's Software License Agreement, or in the case of software delivered to
the government, in accordance with the software license agreement as defined in FAR 52.227-7013.
No part of this document may be copied or reproduced in any form or by any means without prior written consent of
Intel Corporation.
Intel Corporation retains the right to make changes to these specifications at any time, without notice.
Contact your local sales office to obtain the latest specifications before placing your order.
* Other brands and names are the property of their respective owners.
printed on
recycled paper
Copyright 1994, 1996, 1997. Intel Corporation. All rights reserved.
Contents
Chapter 1 The gdb960 Debugger
gdb960 Features and Benefits...........................................1-1
What’s New in gdb960? .....................................................1-2
About this Manual ..............................................................1-4
Contents ........................................................................1-4
Audience .......................................................................1-6
Notational Conventions .................................................1-6
UNIX* and Windows* Command Line Differences ........1-7
Related Publications ..........................................................1-7
Online Help ........................................................................1-7
Contacting Intel Support Services......................................1-8
Chapter 2 Getting Started
Setting Up Your Target Board............................................2-1
Using the MON960 Debug Monitor with gdb960................2-2
Compiling for Debugging....................................................2-3
Starting gdb960..................................................................2-4
Starting the gdb960 Windows Graphical User
Interface ........................................................................2-4
Starting the gdb960 UNIX Graphical User Interface......2-4
Starting the Command Line Interface............................2-5
Changing Your Target Settings After Starting
gdb960......................................................................2-6
HDIL Arguments .......................................................2-8
iii
gdb960 User's Manual
Combining Serial Communication and PCI
Downloading .............................................................2-8
Emacs Invocation......................................................2-9
Batch Mode Invocation .............................................2-9
Mode Options............................................................2-9
Chapter 3 Using the gdb960 Windows Graphical
User Interface
Overview ............................................................................3-2
Online Help ........................................................................3-2
Starting and Stopping the Debugger..................................3-3
Starting the Debugger ...................................................3-3
Stopping the Debugger..................................................3-3
A Sketch of the Debugger ..................................................3-4
Connecting to a Target.......................................................3-6
Setting the Search Path .....................................................3-7
Opening a File....................................................................3-9
Listing Code .......................................................................3-10
Debugging With gdb960.....................................................3-11
Debugger Buttons..........................................................3-12
The Debug Menu...........................................................3-15
Downloading a Module ..................................................3-15
Setting Breakpoints .......................................................3-16
Navigating through a Program.......................................3-17
Viewing Alternate Stack Levels .....................................3-21
Using the Auxiliary Debugger Windows.........................3-22
Inspect...........................................................................3-22
Locals ............................................................................3-24
Back Trace ....................................................................3-25
Registers .......................................................................3-25
Memory..........................................................................3-26
Source Views.................................................................3-29
iv
Contents
Using the gdb960v Text Editor...........................................3-32
Editing a File..................................................................3-32
Opening a File ..........................................................3-32
Creating a New Text File ..........................................3-33
Cutting, Copying and Pasting Text ...........................3-34
Moving to a Line .......................................................3-34
Finding a Text String.................................................3-34
Finding and Replacing Text ......................................3-34
Printing the Contents of an Active Window ...............3-35
Customizing a Print Job ............................................3-35
Saving a File .............................................................3-35
Saving A New File or Renaming an Existing One .....3-36
Setting the Save Options ..........................................3-36
Customizing the Text Editor ..........................................3-36
Setting the Attribute Pane.........................................3-36
Changing the Tab Settings .......................................3-36
Changing Font Type and Font Size ..........................3-37
Changing Syntax Coloring in a Source File ..............3-37
The Debugger Command Line Window .............................3-37
Chapter 4 Using the gdb960 UNIX Graphical User Interface
Overview ............................................................................4-1
Online Help ........................................................................4-2
Running the GUI Debugger................................................4-2
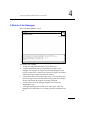
A Sketch of the Debugger..................................................4-3
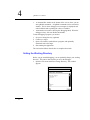
Setting the Working Directory.............................................4-4
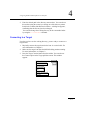
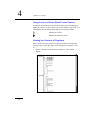
Connecting to a Target ......................................................4-5
Opening a File....................................................................4-8
Listing Code ..................................................................4-9
Setting the Search Directories ...........................................4-11
v
gdb960 User's Manual
Using the Debugger ...........................................................4-12
Code Display Options ....................................................4-13
Setting Breakpoints .......................................................4-13
Running Your Program ..................................................4-14
Using the Up and Down Stack Frames Feature ............4-16
Viewing the Contents of Registers.................................4-16
Using the Backtrace Window.........................................4-17
Using the Print/Print Star Options..................................4-17
Editing Source Code ..........................................................4-18
Creating a New File............................................................4-18
Exiting the Debugger..........................................................4-18
Customizing the GUI ..........................................................4-18
Chapter 5 Configuring the gdb960 Environment
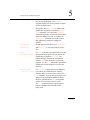
Rules for Using gdb960 Commands...................................5-1
File-specifying Options .......................................................5-2
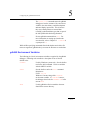
gdb960 Environment Variables ..........................................5-5
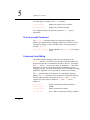
The help Command............................................................5-6
The show Command ..........................................................5-7
The info Command.............................................................5-7
The set prompt Command..................................................5-8
Command Line Editing .......................................................5-8
Using the History Feature...................................................5-9
History Expansion..........................................................5-10
shell and make Commands................................................5-11
Screen Size........................................................................5-11
Setting Radix......................................................................5-12
Messages, Complaints and Cautions .................................5-13
Exiting gdb960 ...................................................................5-14
vi
Contents
Chapter 6 Example gdb960 Session
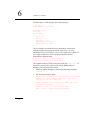
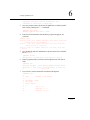
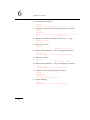
Example Session ...............................................................6-1
Chapter 7 Running Your Program with gdb960
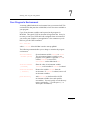
Running Programs .............................................................7-1
Setting Your Program's Arguments....................................7-2
Setting Your Program's Working Directory .........................7-2
Your Program's Environment .............................................7-3
Chapter 8 Program Execution Control
Breakpoints ........................................................................8-1
Watchpoints...................................................................8-5
Deleting Breakpoints and Watchpoints..........................8-6
Disabling Breakpoints and Watchpoints ........................8-7
Break Conditions ...........................................................8-9
Commands Executed on Breaking ................................8-11
Continuing..........................................................................8-13
Stepping.............................................................................8-13
Continuing at a Different Address ......................................8-15
gmu Commands.................................................................8-17
gmu detect gmu protect.................................................8-17
Syntax ...........................................................................8-18
Examples.......................................................................8-20
Chapter 9 Examining the Program Stack
Stack Frames .....................................................................9-1
Backtraces .........................................................................9-2
Selecting a Frame ..............................................................9-4
Frame Information..............................................................9-5
Chapter 10 Examining Source Files
Displaying Source Lines.....................................................10-1
linespec Definition .........................................................10-3
Searching Source Files ......................................................10-4
Specifying Source Directories ............................................10-5
vii
gdb960 User's Manual
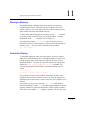
Chapter 11 Displaying Program Data and Symbols
Expressions........................................................................11-1
Program Variables..............................................................11-2
Assignment to Variables.....................................................11-3
Artificial Arrays ...................................................................11-4
Format Options ..................................................................11-5
Output Formats ..................................................................11-9
Examining Memory ........................................................11-10
Storing to Memory ..............................................................11-15
Automatic Display...............................................................11-15
Examining the Symbol Table..............................................11-17
Value History......................................................................11-19
Convenience Variables ......................................................11-20
Registers ............................................................................11-22
Examples.......................................................................11-23
Profile Data File Manipulation ............................................11-24
Chapter 12 gdb960 Command and Option Reference
gdb960 Invocation Arguments ...........................................12-1
gdb960 Commands............................................................12-3
add-symbol-file ..............................................................12-3
aplink enable .................................................................12-3
aplink reset ....................................................................12-3
aplink switch ..................................................................12-4
aplink wait......................................................................12-4
awatch ...........................................................................12-4
backtrace .......................................................................12-4
break .............................................................................12-5
call .................................................................................12-6
cd...................................................................................12-6
clear...............................................................................12-6
commands .....................................................................12-6
condition ........................................................................12-7
viii
Contents
continue.........................................................................12-7
define ............................................................................12-8
delete ............................................................................12-8
delete display ................................................................12-8
directory.........................................................................12-8
disable ...........................................................................12-9
disassemble ..................................................................12-9
display ...........................................................................12-10
document.......................................................................12-10
down..............................................................................12-10
down-silently..................................................................12-11
echo ..............................................................................12-11
enable ...........................................................................12-11
exec-file .........................................................................12-12
file..................................................................................12-12
finish ..............................................................................12-12
forward-search...............................................................12-13
frame .............................................................................12-13
gmu detect define..........................................................12-14
gmu detect disable ........................................................12-14
gmu detect enable.........................................................12-15
gmu protect define.........................................................12-15
gmu protect disable .......................................................12-16
gmu protect enable........................................................12-16
hbreak ...........................................................................12-17
help ...............................................................................12-17
ignore ............................................................................12-17
info ................................................................................12-18
jump...............................................................................12-20
list ..................................................................................12-20
lmadr .............................................................................12-21
lmmr ..............................................................................12-21
ix
gdb960 User's Manual
load................................................................................12-22
make..............................................................................12-22
mcon..............................................................................12-22
next................................................................................12-22
nexti...............................................................................12-23
output ............................................................................12-23
path ...............................................................................12-23
print ...............................................................................12-23
printf ..............................................................................12-24
printsyms .......................................................................12-24
profile.............................................................................12-24
ptype..............................................................................12-25
pwd................................................................................12-25
quit.................................................................................12-25
rbreak ............................................................................12-25
regs ...............................................................................12-26
reset ..............................................................................12-26
reverse-search...............................................................12-26
run .................................................................................12-26
search............................................................................12-27
select-frame...................................................................12-27
set..................................................................................12-27
shell ...............................................................................12-32
show ..............................................................................12-32
source............................................................................12-32
step................................................................................12-33
stepi...............................................................................12-33
symbol-file .....................................................................12-33
target .............................................................................12-34
tbreak ............................................................................12-34
thbreak ..........................................................................12-34
undisplay .......................................................................12-34
x
Contents
unset .............................................................................12-35
until................................................................................12-35
up ..................................................................................12-35
up-silently ......................................................................12-36
watch .............................................................................12-36
whatis ............................................................................12-36
where.............................................................................12-36
wwatch ..........................................................................12-37
x ....................................................................................12-37
Chapter 13 Storing Commands
User-defined Commands ...................................................13-1
User-defined Command Hooks .....................................13-3
Command Files ..................................................................13-4
Commands for Controlled Output.......................................13-5
Appendix A
Using gdb960 Under GNU Emacs
Setting Up gdb960 in Emacs..............................................A-1
If you have GNU Emacs version 19 or greater ..............A-1
If you have an earlier version of GNU Emacs................A-1
Either version ................................................................A-2
Using Emacs Commands with gdb960 ..............................A-3
Appendix B
Command Line Editing
Introduction to Line Editing ................................................B-1
Readline Interaction ...........................................................B-2
Readline Bare Essentials ..............................................B-2
Readline Movement Commands ...................................B-3
Readline Killing Commands...........................................B-3
Readline Arguments ......................................................B-5
Readline Init File ................................................................B-5
Readline Variables ........................................................B-6
Readline Key Bindings ..................................................B-7
xi
gdb960 User's Manual
Commands For Moving ......................................................B-7
Commands For Manipulating History .................................B-8
Commands For Changing Text ..........................................B-9
Killing And Yanking ............................................................B-10
Specifying Numeric Arguments ..........................................B-11
Letting Readline Type For You...........................................B-11
Some Miscellaneous Commands .......................................B-12
Readline vi Mode ...............................................................B-12
Appendix C
GNU History Library
History Interaction ..............................................................C-2
Event Designators .........................................................C-2
Word Designators ..........................................................C-3
Modifiers ........................................................................C-3
Appendix D
Using gdb960 with ApLink
ApLink Commands .............................................................D-1
Using gdb960 With ApLink ............................................D-2
gdb960 Scripts...............................................................D-4
Index
Figures
1-1
3-1
3-2
3-3
3-4
3-5
3-6
3-7
3-8
3-9
3-10
3-11
xii
Sample GUI Debugger Windows (Windows NT*) ......1-3
Debugging Windows..................................................3-4
The Debug Menu.......................................................3-5
Target Connected Window ........................................3-7
Source Search Path Window.....................................3-8
Open Window............................................................3-9
File/Function Lister Window.......................................3-10
Debug Toolbar...........................................................3-12
The Run Window .......................................................3-17
The Context Pointer ..................................................3-18
Inspect Windows in the Debugger.............................3-23
Inspect: Partly Hidden Structure Hierarchy................3-24
Contents
3-12
3-13
3-14
3-15
3-16
Locals Window ..........................................................3-24
Backtrace Window.....................................................3-25
Registers Window .....................................................3-26
Memory Window........................................................3-27
Source View Window ................................................3-29
Tables
1-1
1-2
3-1
3-2
3-3
3-4
3-5
Chapter Summaries ..................................................1-4
Appendix Summaries ................................................1-5
Summary of Debug Buttons ......................................3-12
Breakpoint Buttons....................................................3-16
Buttons for Stepping Through a Program..................3-19
Buttons for Navigating Up and Down the Stack ........3-21
Buttons for Bringing Up Auxiliary Debugger
Windows....................................................................3-22
3-6 Options for Bringing Up the Memory Window............3-26
3-7 Memory-display Formats and Units ...........................3-28
3-8 Print Options .............................................................3-35
8-1 Access Types............................................................8-20
12-1 Access Types............................................................12-16
xiii
The gdb960 Debugger
1
This manual tells you how to use the gdb960 debugger in Microsoft*
Windows* 95/Windows NT* and UNIX*. gdb960 is a source-level
symbolic debugger that helps you find problems in your application code.
When used with a target platform (such as a Cyclone evaluation platform)
and monitor software running in the target (e.g., MON960) gdb960 lets
you:
• Run your program with any command line arguments.
• Stop and restart your program at specified locations and conditions.
• Examine the internal state of your program when execution has
stopped.
• Change the values in your program so that you can experiment with
corrections and continue debugging without re-invoking the program.
This chapter provides the following information:
• A list of features and benefits of the gdb960 software debugger.
• A description of the new features in gdb960.
• Information about this manual including chapter and appendix
descriptions and notational conventions.
• Instructions on how to access the online help systems that are
provided with gdb960.
gdb960 Features and Benefits
•
Graphical and command line user interfaces. With gdb960v provides
a windowed environment where you can access almost all of gdb960’s
command line features (listed below).
1-1
1
gdb960 User's Manual
•
•
•
•
•
•
•
•
Source-level debugging. You can set and display breakpoints directly
in source code, browse through program modules, and examine the
procedure call chain.
Watch expressions. You can select specific program variables to
display, and you can watch the values of these variables change as
you step through your program.
Breakpoints. You can define a breakpoint at a function name, sourcecode line, an assembly instruction, an execution address, or (on the
i960 Cx, Jx, Hx, and RP processors) a data address.
Stepping. You can execute your program as single assembly-language
steps, high-level-language statement steps, or high-level-language
procedure call or return steps.
Register access. You can examine and modify the processor registers.
Memory access. You can display and modify memory and system
tables. You can also display and assemble code in memory as
assembler mnemonics.
Symbolic support. You can use symbols to debug all programs
written in the C language. You can also display and modify program
memory using program symbols.
Downloading. You can download i960 processor ELF/DWARF,
Common Object File Format (COFF) files, or b.out files.
What’s New in gdb960?
With release 5.1, gdb960v adds a Graphical User Interface (GUI) that
combines the best features of graphical and command-line debugging
interfaces. The most common debugging activities, such as setting
breakpoints and controlling program execution, are available through
convenient point-and-click interfaces in both Windows 95/NT and UNIX.
Similarly, program listings and data-inspection windows provide an
immediate visual context for the crucial portions of your application.
1-2
The gdb960 Debugger
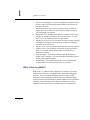
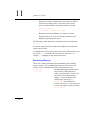
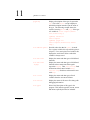
Figure 1-1
1
Sample GUI Debugger Windows (Windows NT)
Figure 1-1 shows some sample gdb960v windows in a Windows NT
environment. See Chapter 3 for complete instructions on using the
Windows 95/NT GUI debugger. See Chapter 4 for instructions on using
the gdb960 UNIX GUI.
1-3
1
gdb960 User's Manual
About this Manual
Contents
This guide includes the following chapters and appendices:
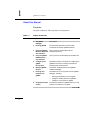
Table 1-1
Chapter Summaries
Chapter
Description
1.
The gdb960
Debugger
This chapter.
2.
Running gdb960
Provides setup instructions and invocation
procedures for all three gdb960 interfaces.
3.
Using the gdb960v
Windows Graphical
User Interface
Tells you how to use all features of the
Windows 95/NT GUI.
4.
Using the gdb960
UNIX Graphical
User Interface
Tells you how to use all features of the UNIX GUI.
5.
Configuring the
gdb960
Environment
Describes the basic commands for configuring the
gdb960 environment, including commands for
specifying files and directories.
6.
Example gdb960
Session
Provides an example session of the gdb960
Software Debugger.
7.
Running Your
Program with
gdb960
Describes how to run programs from the gdb960
debugger, including:
8.
Program Execution
Control
•
specifying arguments for your program
•
setting the working directory for gdb960
•
setting the environment for gdb960
Describes the features of gdb960 that let you halt,
examine, and restart your program.
continued ☛
1-4
1
The gdb960 Debugger
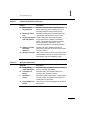
Table 1-1
Chapter Summaries (continued)
Chapter
Description
9.
Provides information about manipulating stack
frames, selecting frames, creating traces, and
extracting information from selected frames.
Examining the
Program Stack
10. Examining Source
Files
Describes commands and techniques that allow
you to display specified pieces of source files.
11. Displaying Program Contains information about examining data
Data and Symbols
through expressions, variables, and artificial
arrays. This chapter also presents information
about accessing the value history, using
convenience variables, and accessing registers.
Table 1-2
12. gdb960 Command
and Option
Reference
Provides a list of the gdb960 command line
options and commands, along with common HDIL
invocation options.
13. Storing Commands
Tells you how to define custom commands, create
command files to execute commands sequences
automatically, and control gdb960’s output.
Appendix Summaries
Appendix
Description
A. Using gdb960
Under GNU Emacs
Describes setting up gdb960 in Emacs and using
Emacs commands with gdb960.
B. Command Line
Editing
Describes GNU’s command line editing and
provides some examples of its use.
C. GNU History
Library
Describes the GNU history library, a programming
tool that provides a consistent user interface for
recalling lines of typed input.
D. Using gdb960 with
ApLink
Tells you how to use the debugger with the ApLink
debug probe.
1-5
1
gdb960 User's Manual
Audience
To use this product, you must be familiar with your host operating system,
the i960 processor architecture, and the i960 processor program
development tools (CTOOLS). See the list of related publications listed in
Getting Started with the i960 Processor Development Tools for more
information on the i960 processor. This manual assumes that you know
techniques for writing and debugging software.
Notational Conventions
The following notational and terminology conventions are used throughout
this manual:
debugger, debug tool
refers to the gdb960 software debugger.
i960 Cx processor
refers generically to the i960 CA and CF
processors.
i960 Hx processor
refers to the i960 HA, HD, and HT processors.
i960 Jx processor
refers to the i960 JA, JF, and JD processors.
i960 Kx processor
refers generically to the i960 KA, KB, SA, and
SB processors.
target processor
refers to the i960 processor on the target board.
This processor can be an i960 Sx, Kx, Cx, Jx,
Hx, or RP processor.
This type style
indicates an element of syntax, a reserved word,
a keyword, a filename, computer output, or part
of a program example. The text appears in
lowercase unless uppercase is significant.
l
1
O
0
1-6
is lowercase letter L in examples.
is the number 1 in examples.
is the uppercase O in examples.
is the number 0 in examples.
1
The gdb960 Debugger
This type style
indicates the exact characters you type as input
in examples.
This type style
indicates a place holder for an identifier, an
expression, a string, a symbol, or a value.
Substitute one of these items for the place holder.
[]
means the syntactic symbols enclosed by the
braces are optional.
{}
means you must select one, and only one, of the
syntactic symbols enclosed in the braces.
|
means exclusive or. Select only one of the
syntactic items on opposite sides of the bar.
&
means and. In syntax specification (except when
used in a C expression as a unary operator),
shows that symbols on both sides of the & must
appear together.
UNIX and Windows Command Line Differences
Most examples in this manual show a UNIX command line. Unless
otherwise specified, examples work in both UNIX and Windows 95/NT
environments. In Windows you can precede optional arguments with
either a - or /; however, you must use a backslash (\) in directory
pathnames.
Related Publications
This manual contains the information needed to use the debugger. The
publications list in Getting Started with the i960 Processor Development
Tools provides the order numbers and brief descriptions of related manuals
and books. For information on ordering these and other Intel publications,
contact your local Intel sales office or write to the Intel Literature Sales
Department, P.O. Box 7641, Mt. Prospect, IL 60056-7641 or call
1-800-548-4725.
1-7
1
gdb960 User's Manual
Online Help
All three gdb960 interfaces (Windows GUI, UNIX GUI, and
Windows/UNIX command line) provide online help.
In Windows 95/NT, reference information is available to you anytime by
pressing F1 in any window, or by opening the Help menu and choosing
any of the help options listed there. Using the F1 key provides you with
context-sensitive information about the current active window.
The UNIX help system is HTML-based and can be viewed with any web
browser such as Mosaic* or Netscape*. To view the file, simply open the
file wingdb960.htm with your web browser. At installation this file is
placed the in directory [$G960BASE/$i960BASE]/html/tools/.
When running gdb960 from the command line, use the help command as
described in Chapter 5. This allows you to access reference information
about specific gdb960 commands.
Contacting Intel Support Services
If you need service or assistance with the debugger, refer to Getting
Started with the i960 Processor Development Tools.
1-8
2
Getting Started
This chapter provides information on setting up your target platform and
host PC to use with gdb960. In this chapter you:
• Set up your target board
• Learn about MON960, the onboard monitor software that gdb960
uses to communicate with your evaluation board.
• Learn about recompiling your software for debugging.
• Learn how to start gdb960’s Windows, UNIX, and command line
interfaces
For some operations, you may need to refer to your target board manual,
the MON960 Debug Monitor User’s Guide, and the i960 Processor
Compiler User’s Guide.
Setting Up Your Target Board
To run your software, you must have a target board connected to the host
computer. Target boards such as the Cyclone evaluation platform support
communications via serial port, parallel port, or PCI bus. The table below
shows the host requirements for using each type of communication:
Communication Media
Resource(s) Required
Serial Communication
•
One available serial port
Serial Communication
/Parallel Download
•
One available serial port
•
One available parallel port
PCI Communication/
Download (fastest)
•
One available full length PCI slot
2-1
2
gdb960 User's Manual
If your PC host and target support PCI communication, you will probably
want to take advantage of the superior host-to-target transfer speeds that
PCI communication provides. See the MON960 Debug Monitor User’s
Guide for a list of i960 evaluation boards that support PCI communication.
Refer to your target board documentation for steps on connecting the
board to your host system.
Using the MON960 Debug Monitor with gdb960
The MON960 debug monitor software is resident in ROM or Flash on all
evaluation boards provided by Intel. This software allows a debugger such
as gdb960 to communicate with the evaluation board, and view and
modify memory. If you are using a Cyclone evaluation board, you
probably do not need to install the files from the MON960 installation
media, since the software in your evaluation board is sufficient for all
gdb960 debugging features.
If, however, you need to update the version of MON960 in your
evaluation board or want to retarget MON960 for a custom board, you
must install the MON960 software to the host. The MON960 installation
media includes ROM images (hex files) for all currently supported target
boards and source code. MON960 also ships with its source code, so you
can modify MON960 to support custom boards. For more information,
refer to the MON960 Debug Monitor User’s Guide.
Because MON960 is a separate product from CTOOLS, versions of
MON960 may be released between releases of CTOOLS. Dependencies
between versions of MON960 and versions of the tools are described in
the release notes. For details on versions and dependencies, refer to the
release notes and the MON960 Debug Monitor User's Guide.
Updated versions of MON960 are available free on the Intel World-Wide
Web server at:
http://www.intel.com
2-2
Getting Started
2
Compiling for Debugging
To debug a program effectively, you need to recompile your code to
include debug information. This information is stored in the object file,
and describes the data type of each variable or function and the correlation
between source line numbers and addresses in the executable code.
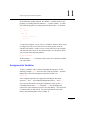
To include debugging information, specify the -g option when you invoke
the compiler (gcc960 or ic960). For example, the commands:
gcc960 -g -ACA t1.c
ic960 -g -ACA t1.c
tell the compiler to compile the file t1.c for use with the i960 CA
architecture and to include debugging information.
You can use the -g option with or without -On (capital "Oh"), where n is
an optimization level, making it possible to debug optimized code. Note,
however, that some debugging operations do not work as well with -g -On
as with just -g. Many optimizations can make debugging optimized code
more difficult. In particular, source line information in the program may
be incorrect, which can cause confusion while debugging. Also, variables
that exist in your source programs may not exist at run-time, or their
values may not be current. These difficulties appear most often at higher
levels of optimization.
You can reduce problems caused by compiler optimizations greatly by
compiling with ELF/DWARF object module format whenever possible.
(Use the -Felf compiler option.) The ELF/DWARF debug data is
specifically enriched to aide debugging of highly optimized code. If
problems persist, disable optimization features and compile with -g only.
For more information on compiler options, refer to the i960 Processor
Compiler User’s Guide.
2-3
2
gdb960 User's Manual
Starting gdb960
Starting the gdb960 Windows Graphical User
Interface
You can start the debugging session by double-clicking the icon that was
installed into your gdb960 program group during CTOOLS installation.
The installation also sets the proper environment variables for you.
When the debugger is running, you can interact with it through the editor
window, through the Debugger command window, and through the Debug
menu and toolbar. See Chapter 3 for details.
Starting the gdb960 UNIX Graphical User Interface
To start the gdb960 UNIX GUI, use the syntax:
gdb960v [options]
where options is any of the options allowed by the gdb960 command line
interface (see Chapter 12 for more information). For example, in Bourne
shell you might enter:
$G960BASE/bin/gdb960v -r /dev/tty0 myprogram
You can also use -d display option, which allows you to explicitly set the
X terminal type used for the display. For example:
gdb960v -r /dev/tty0 -d system.company.com:0.0 myprogram
selects the X DISPLAY as the console of system.company.com. If
no -d option is given, the debugger uses the current setting of the
DISPLAY environment variable. If it is not set, the debugger issues a
fatal error.
When the debugger is running, you are ready to load an executable’s
symbols and begin debugging. See Chapter 4 for details.
2-4
2
Getting Started
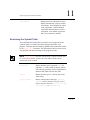
Starting the Command Line Interface
You can invoke gdb960’s command line interface from a Windows
command prompt box, a UNIX command line, an Emacs command line,
or with a batch command file executed from a Windows or UNIX
command line. Once started, gdb960 interactively reads commands from
standard input until you exit the debugger by entering the quit command.
NOTE. Unless otherwise specified, command line options in examples
are presented using the UNIX -x option specification syntax. Either the
-x syntax or the /x syntax is allowable on Windows systems. Command
line options apply to both the GUI and the command line versions of
gdb960.
The command name for invoking the debugger is gdb960. Enter gdb960
along with associated options to start an interactive debugging session.
The following invocation example starts the gdb960 software debugger
and establishes communication with a MON960 debug monitor connected
to tty X running at the default baud rate (38400 bps). The debugger reads
symbols from the file program, then downloads program to the MON960
debug monitor:
gdb960 -r port [program]
•
•
for example, to specify a serial port on a host and load the program
with symbols for the executable myprogram, you would enter the
command in Windows and UNIX:
gdb960 -r com2 myprogram
(Windows Host)
gdb960 -r /dev/tty0 myprogram
(UNIX Host)
To specify serial communication and parallel download
gdb960 -r com2 -par lpt1 myprogram
(Windows Host)
gdb960 -r /dev/tty0 -par /dev/bpp0 myprogram
(UNIX Host)
2-5
2
gdb960 User's Manual
For PCI communication:
gdb960 -pci myprogram
(Windows Host)
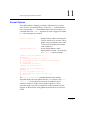
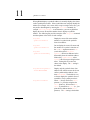
Changing Your Target Settings After Starting gdb960
After you have run gdb960, you can change your target communications
settings using the target command at the gdb960 prompt:
gdb960 executable
(gdb960) target mon960 port [ hdil arguments ]
The following is a list of command line options and their descriptions:
r port
Specify the serial port name of a serial interface
to use to connect to the target system. If no
target type is set using the -t option or target
command, the debugger assumes that MON960
is the target monitor.
You can specify port as any of:
• a full pathname (e.g., -r /dev/ttya)
• a device name in /dev (e.g., -r ttya)
• the unique suffix for a specific tty
(e.g., -r a)
2-6
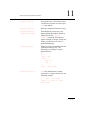
t mon960
Use MON960 as the target type. This is the
default target type.
b bps
Set the line speed, baud rate or bps of the serial
interface to the target system. MON960 supports
baud rates of 1200, 2400, 9600, 19200, and
38400 bps (the default) on UNIX hosts; some of
these may not be available on every host. The
additional, unsupported, baud rates 57600 and
115200 may work on some hosts.
2
Getting Started
brk
Send a break (of about 1/4 second in duration) to
the target system after opening the connection
but before trying to communicate. If the target
board is equipped with a break-triggered reset
circuit, this allows you to connect to a running
system.
par device
Use parallel download instead of serial
download. Use parallel device, device, for
downloading (typically LPT1 or LPT2 on
Windows, varies on UNIX). The parallel device
is used only for downloading. Other host/target
communications use the serial port specified with
-r or the PCI target specified with -pci. For
more information about UNIX parallel download
from gdb960, refer to Appendix F in this guide.
pci
Selects a target connected to the host’s PCI bus
(if available).
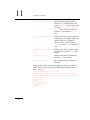
pcib bus_no dev_no
func_no
Selects a target connected to the host’s PCI bus
(if available). This option selects the target using
an absolute PCI bus address. All arguments are
specified in hex.
pciv vendor_id
device_id
Selects a target connected to the host’s PCI bus
(if available). This option selects the target using
using an algorithm that searches for the first
available PCI device that matches the specified
PCI vendor and device ID. All arguments are
specified in hex.
2-7
2
gdb960 User's Manual
pcic {io | mmap}
Configures PCI communications. By default,
gdb960 always attempts to communicate with a
PCI device via I/O space. This option permits
the user to explicitly specify the interface.
io
Communicate via I/O space (i.e., use
in/out instructions to access the PCI
device).
mmap
Communicate via memory-mapped
access.
HDIL Arguments
The MON960 Host Debugger Interface Library (HDIL) routines allow
interaction with the target monitor. Several optional HDIL arguments may
be specified on the target mon960 command line. These options affect
the communication between the host and target. For more information on
the HDIL routines, refer to the MON960 Debug Monitor User's Guide.
Combining Serial Communication and PCI Downloading
If your PC host and target support PCI communication, but application
requirements make it undesirable for the monitor to tie up the PCI bus with
I/O and various service requests (e.g., register dumps), then use PCI
download to augment serial communication.
Examples
> gdb960 -r com1 -pci myprog
This example connects to the target via serial port COM1 and
downloads the program myprog via the PCI bus. The PCI bus is used
only for downloading; all other host/target communication use the
serial port.
> gdb960 -r com1 -pcib 0 c 0 myprog
This example is similar to the previous one, except that the PCI device
is explicitly specified by bus (0), device (0xc), and function number (0).
2-8
2
Getting Started
Emacs Invocation
On UNIX hosts, if you are a GNU Emacs user, you can set up gdb960 to
run in an Emacs window. This has many advantages over the normal,
single line gdb960 command line, notably the source code buffer that
Emacs keeps updated for you as you debug your application. For more
information on running gdb960 under Emacs, refer to Appendix B, Using
gdb960 Under GNU Emacs.
Batch Mode Invocation
You can also start gdb960 in batch mode. You can get more detailed
control over how gdb960 starts by using the command-line options listed
in Appendix E of this manual.
All the options and command line arguments listed in a batch file are
processed in sequential order. Sometimes order is important. For
example, when the x option is used, you need to load an object before you
can manipulate it.
Mode Options
Mode options specified in the gdb960 invocation line determine how the
software debugger accepts input, produce output, and processes debugging
commands. The following is a list of the available mode options along
with brief descriptions of their effects on gdb960's operation:
batch
Run in batch mode. Terminate gdb960 with exit
code 0 after processing the commands in the file
specified with -x and in .gdbinit, if not
inhibited. Terminate with non-zero status if an
error occurs in executing the gdb960 commands
in the command file. On Windows hosts, the
initiation batch file is named init.gdb instead
of .gdbinit. Only one command file can be
specified on the command line. Execution of
gdb960 terminates when the command file ends.
2-9
2
gdb960 User's Manual
Batch mode allows you to run gdb960 as a filter.
For example, you can download and run a series
of programs and capture their output.
2-10
G
Informs gdb960 that the target has big-endian
memory.
help
gdb960 briefly describes usage details.
nx
Suppress execution of commands in the
.gdbinit initialization file. Normally, the
commands in .gdbinit execute after the
command line options and arguments have been
processed. For more information on command
files, refer to Chapter 13.
pc picoffset
Debug position-independent code. Download
code sections to link-time-address + picoffset
instead of the usual link-time-address. When
gdb960 reads the symbol table from your
program, code section labels and symbols will
have picoffset added to their link-time
addresses to account for this relocation.
pd pidoffset
Debug position-independent data. Download
data and bss sections to link-time-address +
pidoffset instead of to link-time-address.
When gdb960 reads the symbol table from your
program, data and bss symbols will have
pidoffset added to their link-time addresses to
account for this relocation.
px offset
Enter the same offset for both -pc and -pd.
Download all sections to link-time-address +
offset instead of to link-time-address. When
gdb960 reads the symbol table from the program
to debug, all labels and symbols have offset
added to their link-time addresses to account for
this relocation.
2
Getting Started
q
"Quiet." Do not display the introductory and
copyright messages. These messages are
automatically suppressed in batch mode.
2-11
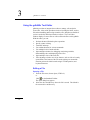
Using the gdb960 Windows
Graphical User Interface
3
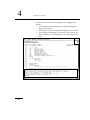
This chapter provides information on running gdb960 using its Graphical
User Interface (gdb960v) in Windows 95 and Windows NT. Topics
include:
• Overview
• Online Help (page 3-2)
• Starting and Stopping the Debugger (page 3-3)
• A Sketch of the Debugger (page 3-4)
• Connecting to a Target (page 3-6)
• Setting the Search Path (page 3-7)
• Opening a File (page 3-9)
• Listing Code (page 3-10)
• Debugging with gdb960v (page 3-11)
• Using the dgb960v Text Editor (page 3-32)
• The Debugger Command Line Window (page 3-38)
See Chapter 4 for information on running the UNIX version.
3-1
3
gdb960 User’s Manual
Overview
The design of the gdb960v GUI debugger combines the best features of
graphical and command-line debugging interfaces. The most common
debugging activities, such as setting breakpoints and controlling program
execution, are available through convenient point-and-click interfaces.
Similarly, program listings and data-inspection windows provide an
immediate visual context for the crucial portions of your application.
For more complex or unpredictable debugging needs, a command-line
interface gives you full access to a wealth of specialized debugging
commands. For instructions on running gdb960 from the command line,
see Chapters 5 through 13.
Online Help
Reference information is available to you anytime you are running the
debugger simply by pressing F1 in any window, or by pulling down the
Help menu and choosing any of the help options listed there. Using the F1
key provides you with context-sensitive information about the current
active window. The Help menu provides you with options that let you
start your search in the more general areas of the online help system and
then move to the more specific topics.
3-2
Using the gdb960 Windows Graphical User Interface
3
Starting and Stopping the Debugger
Starting the Debugger
You can start the debugging session by double clicking the icon that was
installed into your gdb960v program group during installation of the
toolset. The installation also sets the proper environment variables for
you. You can modify the Windows start up properties to include any
command line options you want used, such as the specifying the baud rate
for the communications port.
When the debugger is running, you can interact with it through the editor
window, through the Debugger command window, and through the Debug
menu and toolbar. The section titled “A Sketch of the Debugger” provides
an outline of these interaction modes.
Stopping the Debugger
You can end the debugging session in any of the following ways:
•
•
•
•
In the debug toolbar, press the
button.
Click on the Stop Debugging command in the Debug menu.
Close the Debugger command window.
Close the debugger.
3-3
3
gdb960 User’s Manual
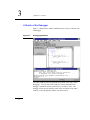
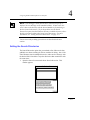
A Sketch of the Debugger
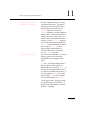
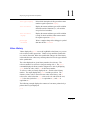
Figure 3-1 illustrates the windows and buttons you can use to interact with
the debugger.
Figure 3-1
Debugging Windows
The editor window (in the background) keeps track of the code you are
debugging. You can click in this window to specify information for
debugger commands (such as symbol names, or lines of code). The
debugger in turn uses the attribute panel, in the left margin of the editor
window, to show breakpoints and the execution context.
3-4
Using the gdb960 Windows Graphical User Interface
3
The Debug toolbar (near the top of Figure 3-1; shown by itself in
Figure 3-7) has shortcuts for the most common debugging actions. See
“Debugger Buttons” for a description of each button.
The gdb960v buttons window provides you with options for connecting to
a target board and opening a binary file. Once you a open file, this
window provides you with the option of listing code.
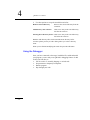
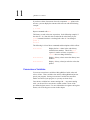
The commands in the Debug menu (Figure 3-2) include alternatives to the
buttons in the Debug toolbar, as well as other debugger functions.
Keyboard shortcuts (shown to the right of the commands in the menu in
Figure 3-2) are available for many graphical debugger commands.
The Debugger window (at bottom right of Figure 3-1) is a command-line
interface to the debugger (see “The Debugger Command Line Window”
on page 3-38). This window is rarely needed, because the graphical
controls provide easy access to the most common debugger actions. Many
developers keep the Debugger window minimized.
Figure 3-2
The Debug Menu
3-5
3
gdb960 User’s Manual
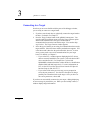
Connecting to a Target
Now that you are more familiar with the parts of the debugger window,
you are ready to connect to a target board.
1. If you have not already done so, physically connect the target board to
the host. For details, see Chapter 2.
2. Press the Target Connect button in the gdb960v buttons pane. You
can also open File pull down menu, select the Target Connect option
and from the submenu select the type of media used for
communication between the host and the target. You can then skip
step 3 below. The Target Connect window appears.
3. Select the type of media you are using for communication between the
target and host. Select the fastest media your hardware supports. PCI
is the fastest and is therefore the preferred media, however, in some
cases you may need to use serial communications for your target
board. For details, see Chapter 2.
If you select PCI, a window appears displaying the PCI devices
that are currently installed in your system. Select the desired PCI
device and choose OK. For example, the Cyclone i960
IQ80960RP evaluation board has vendor and device identification
numbers 8086 and 0960 respectively. For more information on
PCI, see the PCI Local Bus Specification from the PCI Special
Interest Group (1-800-433-5177).
If you select Serial in the previous step, you are prompted to
select the port parameters. You also have the option of using a
parallel port to download code to the target. Once you have set
the correct parameters, choose OK.
If you have not successfully connected to your target, a dialog displaying
an error message is presented to you. When you successfully connect, a
window displays target information.
3-6
Using the gdb960 Windows Graphical User Interface
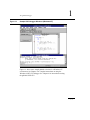
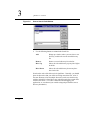
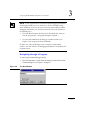
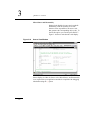
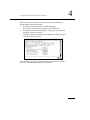
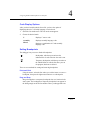
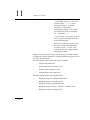
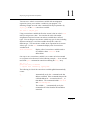
Figure 3-3
3
Target Connected Window
When you have successfully connected to your target, the following
changes appear in the main window:
• The Target Connect button in the gdb960v buttons pane disappears.
• The status line at the lower left corner indicates that you have
connected to a host running MON960.
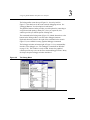
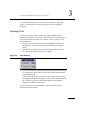
Setting the Search Path
The debugger maintains a list of directories where it searches for source
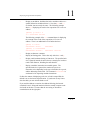
code. This list is called the source search path. To edit this list:
1. Open the Debug pull down menu, and then select Source Search Path.
This window shown in Figure 3-4 appears.
3-7
3
gdb960 User’s Manual
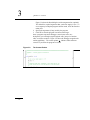
Figure 3-4
Source Search Path Window
2. Use the following buttons to maintain the Search list:
Add
Brings up a window where you can select a new
directory to add to the current search directory
list.
Remove
Removes a search directory from the list.
Move Up
Moves the selected directory up one place higher
in the list.
Move Down
Moves the selected directory down one place
lower in the list.
Note that the order of the directories is significant. Generally, you should
place the directories that you will be accessing most often first. Also, if
the same filename exists in multiple directories, make sure the directory
with the desired file is listed above any other directories that contain files
with the same name. (To reduce confusion while debugging your
application, we recommend you consider using unique filenames across
directory boundaries.)
3-8
Using the gdb960 Windows Graphical User Interface
3
You can set the debugger source paths prior to starting the debugging
session. The directories you enter here persist to the next debugger
invocation.
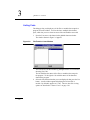
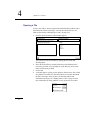
Opening a File
You are now ready to open a program file, load its symbols, and/or
Download code from it to the target. (You can edit a file using the Open
file menu item in the File menu. See “Source Views” on page 3-29 for
more information.)
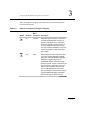
1. Press the Open Binary button located in the gdb960v buttons pane.
Alternatively, you can pull down the File menu and choose Open
Binary.
2. In the File select dialog, select the desired program file and choose
OK. This window shown in Figure 3-5 appears.
Figure 3-5
Open Window
3. You can now load the symbols and/or download the code to the target.
For the purposes of this chapter, select Load symbols and download
code and choose OK.
The status line in the lower left corner of the window tells you when
the debugger has finished loading the symbols and/or downloading the
file. Also, the List source code button replaces the Open Binary
button in the gdb960v buttons pane.
You are now ready to use the debugger’s options for listing code, as
described in the next section.
3-9
3
gdb960 User’s Manual
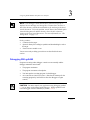
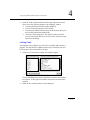
Listing Code
The debugger lets you display any of the files or modules that comprise a
program in an edit window. You can also have multiple edit windows
open, which lets you move between source files and modules as needed.
1. Press the List source code button in the gdb960v buttons window.
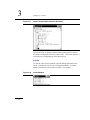
The window shown in Figure 3-6 appears.
Figure 3-6
File/Function Lister Window
You can also access this window by pulling down the View menu and
choosing List Code.
The left field lists the names of the files (or modules) that comprise
the program. To the right is a list with the names of the functions
found in the program.
2. Select the file and function that you want displayed, then press the List
button. An edit window appears displaying the selected file or
module. By default it appears in C code. The two other file viewing
options are described in “Source Views” on page 3-29.
3-10
Using the gdb960 Windows Graphical User Interface
3
NOTE. If the debugger cannot find the file or function you specify, it
displays an error message in a message box. In most cases, the error is
due to the directory with the desired module or file not being in the list of
search directories. To fix this problem, use the Source Search Path option
from the Debug menu to add the directory where the file or function
resides to the list of search directories. For more information, see “The
Debug Menu” on page 3-15.
So far, you have:
• Connected to the target
• Opened a binary file reading its symbols and downloading its code to
the target
• Listed a source module or two.
You are now ready to debug your software as described in the next
section.
Debugging With gdb960
Programs executing under debugger control execute normally and the
debugger maintains control until:
•
The program terminates.
•
The program encounters a breakpoint.
•
You interrupt the executing program via the debugger.
•
An event such as a fatal error occurs. (Note that an interrupt for the
executing program by itself will not cause the debugger to regain
control.)
CAUTION. You must compile your application using debugging symbols
(-g) to use many of the features of the debugger. Highly optimized code
is best debugged with ELF/DWARF file format (-Felf).
3-11
3
gdb960 User’s Manual
You can interrupt program execution with Interrupt Debugger in the
Debug menu, by pressing CTRL+BREAK in the Debugger command
window, or by using the keyboard shortcut ALT+SHIFT+F5.
Debugger Buttons
Figure 3-7
Debug Toolbar
The Debug toolbar (shown as a floating palette in Figure 3-7) has buttons
for the most common debugging commands. Table 3-1 summarizes each
button.
Table 3-1
Summary of Debug Buttons
Button
Description
Button
Description
Download
Next
Run program
Continue
Stop debugging
Finish
Toggle breakpoint
Up stack
Toggle Temporary
breakpoint
Down stack
Step
You can get the same help using the “tool tip feature”. Place the mouse
over the button and pause. A bubble pops up, letting you know what the
button does.
3-12
Using the gdb960 Windows Graphical User Interface
3
The following paragraphs describe each button.
Download an object module to the connected
target. This button is equivalent to the Download
command in the Debug menu; it opens a file
browser to find the module. See “Downloading
a Module” on page 3-15.
Run a program on the target under debugger
control. A Run dialog box allows you to specify
initial arguments for the program. This button is
equivalent to the Run command in the Debug
menu. See “Navigating through a Program” on
page 3-17 for more information.
Stop the debugger. This button is equivalent to
the Stop Debugging command in the Debug
menu.
Set or remove a breakpoint or temporary
breakpoint on the current line of the editor
window. To insert a breakpoint, place the mouse
cursor on the desire line, press the left mouse
button to select the line, then press to insert a
breakpoint or to insert a temporary
breakpoint. The breakpoint is inserted at the
next valid stopping point.
To delete a breakpoint, place the mouse cursor
on a line that is already marked with the
breakpoint icon, press the left button, and then
press or .
This button is equivalent to the Toggle
Breakpoint command in the Debug menu; see
“Setting Breakpoints” on page 3-16.
3-13
3
gdb960 User’s Manual
Step to the next line of code. This button is
equivalent to Step in the Debug menu; see
“Navigating through a Program” on page 3-17.
This button causes the debugger to step one
machine instruction when the edit window
contains assembly language?
Step over a function call: instead of stepping to
the next statement executed, this button steps to
the next line on the screen. If there is a function
call on the current line, the button executes that
function in its entirety, then stops at the line after
the function call. This button is equivalent to the
Next command in the Debug menu; see
“Navigating through a Program” on page 3-17.
The next button behaves analogously to the step
button when assembly language is displayed in
the edit window.
Continue program execution. This button allows
the program to continue execution from its
current IP location until the debugger regains
control. The debugger regains control when:
•
The program terminates.
•
The program encounters a breakpoint.
•
You interrupt the program.
•
An event such as an interrupt or a fatal error
occurs.
This button is equivalent to Continue in the
Debug menu; see “Navigating through a
Program” on page 3-17.
3-14
Using the gdb960 Windows Graphical User Interface
3
Finish the current execution continues until the
current function completes, then the debugger
regains control in the calling statement. This
button is equivalent to the Finish command in the
Debug menu; see “Navigating through a
Program” on page 3-17.
Move one level up the function stack. This
button is equivalent to the Up Stack Frame
command in the Debug menu; see “Viewing
Alternate Stack Levels” on page 3-20. The
change is reflected in the Backtrace and Register
windows.
Move one level down the stack. This is the
converse of the up button. This button is
equivalent to the Down Stack Frame command in
the Debug menu; see “Viewing Alternate Stack
Levels” on page 3-20. The change is reflected in
the Backtrace and Register windows.
The Debug Menu
The Debug menu provides an alternate method from debugger buttons to
invoke commands, and also presents supplementary debugger commands.
Refer to the online help for detailed descriptions of each option.
Downloading a Module
Once the debugger is running and you have connected to a target, you can
download code to the target board.
1. Click on the Download button. Alternatively, you can pull down the
Debug menu and choose Download, or press Shift+F6.
2. Select a program to download to the target for debugging. You can
also do this operation while opening a binary file. (See “Opening a
File” on page 3-9 for details). This brings up the Download objects
dialog box, where you can select one or more object modules.
3-15
3
gdb960 User’s Manual
3. Click the Download button to download the selected object modules to
the target. Debugging information for these modules is contained in
each object module.
Setting Breakpoints
To set a breakpoint:
1. Place the text cursor in the line where you want the program to stop.
2. Choose Toggle Breakpoint or Toggle Temporary Breakpoint.
Table 3-2
Breakpoint Buttons
Button
Shortcut
Debug Menu
Command
Description
F9
Toggle
Breakpoint
Places a breakpoint that stops
execution at that point each time you
run the program.
F8
Toggle
Temporary
Breakpoint
Places a breakpoint that stops
execution at the selected point only
once. The debugger disables it
automatically as soon as the program
stops there.
The same breakpoint symbols used on the buttons for these commands
mark breakpoints in the editor’s left margin, so that you can readily
distinguish the two kinds of breakpoints.
If you try to create a breakpoint on a line that has no corresponding object
code (such as a comment line or a declaration), the breakpoint appears on
the next line that does have corresponding object code.
To remove either type of breakpoint, select the breakpoint line, then click
the appropriate breakpoint command.
3-16
Using the gdb960 Windows Graphical User Interface
3
NOTE. If your application was compiled without debugging information,
the debugger displays an error when you try to set a breakpoint using
these commands. If you are forced to work on an object module without
debugging information, you can still break at the start of any function in
the following ways:
•
Check the Break at main check box in the Run dialog box when you
start the program (See “Navigating through a Program”).
•
Use the break command in the debugger command window (see
Chapter 13 for usage of the break command).
In either case, when the debugger stops, it displays a Disassembly
window, as it does whenever no debugging information is available for the
program context.
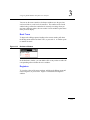
Navigating through a Program
To run a program under debugger control:
1. Press the Run button, or pull down the Debug menu and choose Run.
The Run dialog box (see Figure 3-8) appears.
Figure 3-8
The Run Window
3-17
3
gdb960 User’s Manual
Figure 3-8 shows the Run dialog box with an argument list (optional).
The default for required arguments that you do not supply is zero. To
set a temporary breakpoint program function main, check the Break at
main() box.
2. Specify the arguments (if any) used by the program.
3. Click OK to start the program execution on the target.
Once a program stops under debugger control (most often, at a
breakpoint), you can single-step through the code, jump over function
calls, or resume execution. Figure 3-9 shows the debugger stopped at the
routine graphInit( ). The context pointer
indicates what statement
executes if you allow the program to resume.
Figure 3-9
3-18
The Context Pointer
3
Using the gdb960 Windows Graphical User Interface
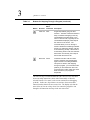
When the program is stopped, you can use any of the following options
from the Debug menu:
Table 3-3
Buttons for Stepping Through a Program
Button
Shortcut
Debug
Menu
Command
F5
Continue
Restarts program execution. If there are
no remaining breakpoints, interrupts, or
signals, the program runs to completion.
A common example of using Continue is
to set a breakpoint at the end of a loop,
then use Continue repeatedly to stop once
in each loop iteration, while monitoring a
loop variable.
F10
Step
Steps through the code one line at a time.
If you have auxiliary debugger windows
open (See “Using the Auxiliary Debugger
Windows” on page 3-22), they are
updated with current values as you step
through the code. If there is a function call
in the current line, Step takes you to the
first line of that function, not to the next
line currently displayed on your screen.
The only exception is for functions that are
compiled without debugging information;
Step cannot step into these functions.
Description
continued ☛
3-19
3
gdb960 User’s Manual
Table 3-3
Buttons for Stepping Through a Program (continued)
Button
Shortcut
Debug
Menu
Command
CTRL+F5
Next
SHIFT+F5 Finish
Description
Single-steps without going into other
functions. The Next command is similar to
Step, but instead of stepping to the very
next statement executed (which, in the
case of a function call, is typically not the
next statement displayed), Next steps to
the next line on the screen. The
command allows you to run through a
function call without considering its details.
If there is no intervening function call, this
is the same thing as Step. When there is
an intervening function call, Next executes
that function in its entirety, then stops at
the line after the function call.
Continues execution until the current
function completes, then the debugger
regains control in the calling statement.
This option is useful if, after stepping
through a program, you conclude that the
problem you are interested in lies in the
current function’s caller, rather than at the
stack level where your program is
suspended.
The effect of Step is somewhat different if the current view in the editor
shows assembly instructions (when either Disassembly or Mixed is
selected from the View menu, or the current routine has no debugging
symbols). In this case, Step advances execution to the next machine
instruction rather than to the next source line. The display style has the
same effect on Next as on Step: thus, Next causes the program to run
through a call instruction and stop on the next source line.
3-20
Using the gdb960 Windows Graphical User Interface
3
Viewing Alternate Stack Levels
Each function call creates a new stack frame. A stack frame contains auto
variables, local variables, and register values for the called function. The
Backtrace window displays all active stack frames. The Backtrace
window can be opened with the menu command Debug: Back Trace or
Alt+6. The deepest frame, #0, is where program execution stopped. The
debugger displays data, symbols and source code from the current stack
frame. This also means that which variable definitions are visible depends
on the selected stack frame. The data for that frame is related to the
function which created the frame. The Up Stack Frame command in the
Debug menu selects the context to the current function’s caller. You can
then click it again to get to function’s caller stack frame, and so on.
This command does not change the location of the program counter; it
only affects what data, symbols, and source code are visible. If you
continue or step the program, execution still takes up where it left off,
regardless of whether you have used this command.
Use the Down Stack Frame command to retrace your steps through the
stack. Like Up Stack Frame, it changes only your view of the program,
not the program’s state.
As you move up and down the stack frames, the Backtrace window
changes the highlight to the currently selected stack frame and the
Register window contents change to reflect the register values associated
with the selected stack frame.
Table 3-4 lists displays the toolbar button, keyboard shortcut, and Debug
menu commands for using the Up and Down Stack Frame features.
Table 3-4
Buttons for Navigating Up and Down the Stack
Button
Shortcut
Debug Menu Command
CTRL+U
Up Stack Frame
CTRL+D
Down Stack Frame
3-21
3
gdb960 User’s Manual
Using the Auxiliary Debugger Windows
When a program stops under debugger control, you can examine local and
global program variables, arguments, registers, target memory, and the
execution stack. Table 3-5 provides you with a summary of these window
types.
Table 3-5
Buttons for Bringing Up Auxiliary Debugger Windows
Button
Shortcut
Debug Menu Command
n/a
ALT+2
Inspect
n/a
ALT+3
Locals
n/a
ALT+4
Registers
n/a
ALT+5
Memory
n/a
ALT+6
Back Trace
The sections below describe the Debug menu commands that open
auxiliary windows for these purposes.
NOTE. The sub-windows described in this section update each time your
program stops in the debugger. Each update highlights values that
changed since the previous display.
Inspect
To monitor an expression or a symbol’s current value:
1. Select an expression or symbol name in the editor,
2. Pull down the Debug menu and choose Inspect, or press Alt+2. This
opens a sub-window for the selected symbol; the window is updated
automatically each time the program stops. Alternatively, if you
choose Inspect with nothing selected and specify the symbol name in
the dialog provided.
3-22
Using the gdb960 Windows Graphical User Interface
3
Several different kinds of data-inspection windows are available,
depending on the data structure. The debugger chooses the right one
automatically.
Figure 3-10 shows two Inspect windows: one for the ordinary numeric
variable ix, and one for the structure dB. Each Inspect window’s title bar
shows the name of the variable it displays, preceded by a parenthesized
display number.
Figure 3-10
Inspect Windows in the Debugger
To display a C struct, the debugger displays the data structure graphically,
grouping hierarchical structures. The dB window in Figure 3-11 is an
example of a structure browser.
Each level of a hierarchy that groups other data is marked with a small
(minus sign) icon. To hide data that is not of current interest, double-click
on any intermediate hierarchy level in a structure browser; the debugger
changes the level-marker to a small (plus sign) to indicate that hidden data
is available. To reveal a hidden hierarchy level, click the plus-sign icon.
Figure 3-11 shows an Inspect window with some hidden hierarchy levels.
3-23
3
gdb960 User’s Manual
Figure 3-11
Inspect: Partly Hidden Structure Hierarchy
You can also click on pointers (marked with a small asterisk) to open a
new Inspect window that shows the pointer value. This feature provides a
convenient way of exploring list values interactively
Locals
To view the value of local variables, open the Debug menu and choose
Locals. Alternatively, use the Alt+3 keyboard command. A window
appears, showing the values of local variables. For example:
Figure 3-12
3-24
Locals Window
Using the gdb960 Windows Graphical User Interface
3
You can use the same controls as for Inspect windows (see the previous
section) to hide or reveal levels of structures. The contents of the Locals
window always reflect the routine that is currently executing; when you
step into a different routine, the new routine’s local variables replace those
in the previous display.
Back Trace
To inspect the calling sequence leading to the current routine, pull down
the Debug menu and choose Back Trace, or press Alt+6. A window opens
to monitor the stack.
Figure 3-13
Backtrace Window
In the Backtrace window, you can double-click on any routine to make the
corresponding editor window the active window.
Registers
To view the values of the target registers, pull down the Debug menu and
choose Registers, or press Alt+4. Figure 3-14 illustrates the Registers
window.
3-25
3
gdb960 User’s Manual
Figure 3-14
Registers Window
You can use the same hierarchy controls described in “Inspect” to hide or
reveal groups of registers.
3-26
Using the gdb960 Windows Graphical User Interface
3
Memory
Table 3-6
Options for Bringing Up the Memory Window
Button
Shortcut
Debug Menu Command
n/a
ALT+5
Memory
Click the Memory item in the debug menu to open a window that displays
a range of target memory starting at a specified address. Figure 3-15
shows a maximized Memory window, displaying memory in Hex/ASCII
format. The numbers in the left margin of Figure 3-15 identify the control
fields described below.
Figure 3-15
Memory Window
3-27
3
gdb960 User’s Manual
NOTE. You can choose whether to update the Memory window only on
demand, or automatically. Check the box labeled Refresh on debugger
stop to update the Memory window each time the debugger takes control.
To update the memory display immediately, press the
button.
The following controls specify what memory range to display, and in what
format:
3-28
Start Address
Enter the beginning address for the range of
memory. The debugger saves each address you
type here. You can select a previously displayed
address from the drop-down list associated with
this box.
Format
Select a display format from this drop-down list
box.
Size
Type the amount of memory to display here.
The units are specified in the adjacent in field.
For example, if the in field has the value Word,
the Memory window displays 4 × Size bytes of
data.
in
Select the unit of memory to display.
Using the gdb960 Windows Graphical User Interface
Table 3-7
3
Memory-Display Formats and Units
Format Values
Unit Values (in)
Hex/ASCII
Byte
Octal
Halfword
Hex
Word
Decimal
Giant (8 bytes)
Unsigned decimal
Binary
Float
Address
Instruction
Char
String
See the description of the x (“examine”) command in Chapter 13 for a
discussion of the memory-display formats.
Source Views
While the debugger is running, you have control how your program is
displayed. By default the debugger displays your code in C style. You
also have the option of displaying the source as disassembly or a
combination of C and disassembly. To change the view, simply pull down
the View menu and choose one of these options:
Source
Displays the C source code. This is the default
style of program display. To choose this option,
you can also press the F7 key.
Disassembly
Displays a symbolic disassembly of your
program’s object code. This style of display is
the default for routines compiled without
debugging information (such as the C runtime
library routines supplied as object code only).
To choose this option, you can also press Alt+F7.
3-29
3
gdb960 User’s Manual
Mixed Source and Disassembly
Displays both high-level source and a symbolic
disassembly, with the assembly-level code
shown as close as possible to the source code
that generates the corresponding object code. To
choose this option, you can also press Shift+F7.
Figure 3-16 shows a mixed-mode code display.
Figure 3-16
Source View Window
Source display (in either the Source or the Mixed Source and Disassembly
view) requires that your application modules be compiled with debugging
information using the -g option.
3-30
Using the gdb960 Windows Graphical User Interface
3
NOTE. For some source lines, compilers generate code that is not
contiguous, because it is sometimes more efficient to interleave the object
code from separate source lines.
In this situation, the mixed-mode display rearranges the assembly listing
to group all object code below the line that generates it. The display
indicates any rearranged chunks of the assembly with an asterisk at the
start of each non-contiguous segment in the mixed-mode display.
The debugger is fully operational no matter what view you select. For
example, you can set breakpoints in a line of assembly code, and you can
use the Step and Next commands in either assembly or source. In views
that show assembly, these commands step by instructions rather than by
source lines; see “Navigating through a Program” on page 3-17.
The editor, however, works only on source code. Thus, when you display
a view with disassembled instructions, the editor display goes into readonly mode until you either stop debugging or switch to the Source view.
NOTE. Disassembly takes a long time the first time you switch to a view
that requires it. Subsequently, in the same debugging session, you can
switch views quickly. The disassembly information is not persistent; the
debugger discards it when you stop debugging (or if you close the source
file with the Close command in the File menu).
Note also that if you have a relatively slow PC, (e.g., has slower than a
100 MHz Pentium processor, and/or your modules are larger than 500
lines of C code, the time to disassemble will be quite slow. The status line
shows progress as it disassembles as percentages of the modules.
3-31
3
gdb960 User’s Manual
Using the gdb960v Text Editor
gdb960v provides an integrated text editor to manage, edit, and print
source files. Most of the procedures involved in using the editor, such as
file and text handling and moving around in a file, should seem familiar if
you have used other Windows-based text editors. The Text Editor
window displays C source files as well as all header files used in gdb960.
With the editor, you can:
• Perform advanced find and replace operations.
• Specify syntax coloring.
• Customize tab stops.
• Use toolbar shortcuts for various commands.
• Use multiple levels of undo and redo.
• Open multiple windows for debugging, monitoring variables,
disassembling code, and displaying source files.
• Open multiple views of the same file.
• Take advantage of other ease-of-use features, such as a list of recently
opened files at the bottom of the File menu, parsing text around the
insertion point as the initial search string in a Find operation, and
keyboard shortcuts.
Editing a File
Opening a File
1. From the File menu, choose Open (CTRL+O).
or
Click
on the Standard Toolbar.
The Open dialog box appears.
2. Select the drive and directory where the file is stored. The default is
the current drive and directory.
3-32
Using the gdb960 Windows Graphical User Interface
3
3.
Set the types of files to display in the Files of Type box. Files with
the chosen extension are displayed in the File name box.
This box serves as a filter to display all files with a given extension.
The drop-down box initially lists commonly-used file extensions. The
default shows the .TXT, .C, .CPP, .H, .HPP, and .TCL extensions.
Alternatively, you can specify wildcard patterns in the File name box
to display file types. The new wildcard pattern is retained until the
dialog box is closed. You can also use any combination of wildcard
patterns, delimited by semicolons. For example, entering "*.
displays all files with these extensions.
4. In the File name box, click a filename, then click Open.
or
Double-click on a filename.
You are now ready to edit the file.
Creating a New Text File
1. From the File menu, choose New (CTRL+N). The New dialog box
appears.
2. Select C Source File, then click OK.
or
Click
on the Standard toolbar.
3. From the File menu, choose Save (CTRL+S).
or
Click
on the Standard toolbar.
The Save As dialog box appears.
4. Double-click a directory where you want to store the source file (or
move down a path to the appropriate directory).
5. Type a filename in the File name box, then choose OK. The default
extension given to a file is the last extension used when you saved a
file. You can type another extension or select one from the Save as
Type box.
You are now ready to enter text into the file you created.
3-33
3
gdb960 User’s Manual
Cutting, Copying and Pasting Text
1. Select the text you want to paste.
2. From the Edit menu, choose the Cut (CTRL+X or SHIFT+DEL ) or
Copy (CTRL+C or CTRL+INS).
3. Place the insertion point in any source window where you want to
insert the text.
4. From the Edit menu, choose the Paste (CTRL+V or SHIFT+INS).
Moving to a Line
1. From the Edit menu, choose Go To.
The Go To dialog box appears.
2. In the Line box, type a line number.
3. Click OK.
If you type a line number greater than the last line in your source file, the
editor moves to the end of the file.
Finding a Text String
1. Position the insertion point where you want to start your search.
If you select some text, the editor uses that text as the default search
string.
2. From the Edit menu, choose Find (ALT+F3).
The Find dialog box appears.
3. Type the search text in the Find What box.
4. Select any of the Find options.
5. To begin your search, choose Find Next.
The find dialog box disappears when the search begins. To repeat a
find operation, you can use the F3 shortcut key.
To begin a find without bringing up the Find dialog box, select a text
string in a source file, then press ALT+F3.
Finding and Replacing Text
1. Position the insertion point where you want to start your search.
If you select some text, the editor uses that text as the default search
string.
3-34
Using the gdb960 Windows Graphical User Interface
3
2. From the Edit menu, choose Replace.
The Replace dialog box appears.
3. Type the search text in the Find What box.
4. Type the replacement text in the Replace With box.
5. Select any of the Replace options.
Begin replacing text by choosing Find Next or Replace All.
Printing the Contents of an Active Window
1. From the File menu, choose Print.
The Print dialog box appears.
2. Under Print Range, select the All option button.
3. Click OK.
Customizing a Print Job
1. From the File menu, choose Page Setup.
2. Type the header or footer text, codes (see Table 3-6), or both.
3. Click OK.
Table 3-9
Print Options
To Print
Use
Filename
&f
Page # of current page
&p
Current system time
&t
Current system date
&d
Left aligned
&l
Centered
&c
Right aligned
&r
Saving a File
1. From the File menu, choose Save (CTRL+S).
or
Click
on the Standard Toolbar.
3-35
3
gdb960 User’s Manual
2. If your file is unnamed, the environment displays the Save As dialog
box. In the File name box, type the filename.
3. Select the drive and directory where you want the file saved. The
default is the current drive and directory.
4. Specify the type of file you're saving in the Save as type box.
5. Click Save.
Saving A New File or Renaming an Existing One
1. Make the file active by clicking the editor window.
2. From the File menu, choose Save As.
The Save As dialog box appears.
3. Type a filename and extension in the File name box.
4. Choose the drive and the directory where you want to save the file.
5. Click Save.
Setting the Save Options
1. From the Tools menu, choose Options>Editor.
The Editor Preferences dialog box appears.
2. To save open files before running any tool, select the Save Before
Running Tools/Builds check box.
3. Click OK.
Customizing the Text Editor
Setting the Attribute Pane
1. From the Tools menu, choose Options>Editor.
The Editor Preferences dialog is displayed.
2. Select the Attribute Pane check box (this box is checked by default).
When the mouse is moved into the Attribute Pane, the cursor changes
to an up-and-right-pointing select cursor (a mirror image of the
standard select arrow).
Clicking the left mouse button in the margin selects the entire line
to the right of the click. Dragging the mouse cursor in the
selection margin selects multiple consecutive lines.
3-36
Using the gdb960 Windows Graphical User Interface
3
Clicking the left mouse button or dragging the mouse cursor with
the Shift key held down extends the selection.
Changing the Tab Settings
1. From the Tools menu, choose Options>Editor.
The Editor Preferences dialog box appears.
2. Under Tab Settings, in the Tab Stops box, type the number of spaces
to be used as a tab stop. The default is four spaces.
3. Click OK.
Changing Font Type and Font Size
1. From the Tools menu, choose Options>Font.
The Font dialog box appears.
2. Select the font from the Font box. The text sample in the Sample box
will change to the font you selected.
3. Select the size in points from the Size box. The text sample in the
Sample box will change to the font size you selected.
Changing Syntax Coloring in a Source File
1. Click the editor window or use the Window menu to make the source
window active.
If there are multiple windows open on the source file, select one of
them. Syntax coloring changes will appear in all windows opened on
the source file.
2. From the Tools menu, choose Options>Color.
The Color Preferences dialog box is displayed. The Items list box
displays the current setting for syntax coloring.
3. Select a window or text element for which you want to specify a
color.
4. Click a color from both the Foreground and Background color areas.
5. Click OK.
Note that syntax coloring must be enabled before you can set the
syntax coloring properties for any specific file. To enable global
syntax coloring, select the Syntax Coloring check box in the Color
Preferences dialog box.
3-37
3
gdb960 User’s Manual
The Debugger Command Line Window
The gdb960v graphical interface is usually the most convenient way to run
the debugger. However, you can also use the command-line interface,
which in some cases is the best way to perform a particular action (and in
some cases, the only way to perform an action). The Debugger window
provides full access to the command language described in Chapters 5-13.
3-38
Using the gdb960 UNIX
Graphical User Interface
4
This chapter provides step-by-step instructions for running gdb960 using
its UNIX Graphical User Interface (gdb960v). Topics include:
• Overview
• Online Help
• Running the Debugger
• Setting the Working Directory
• Connecting to a Target
• Opening a File
• Using the Debugger
• Editing Source Code
• Creating a New File
• Setting the Search Directories
• Exiting the Debugger
• Customizing the GUI
• See Chapter 3 for information on running the Windows 95/NT
version.
Overview
gdb960v provides users with a Graphical User Interface to access many of
the features of its line-oriented interface. The most common debugging
activities, such as setting breakpoints and controlling program execution,
are available through convenient point-and-click interfaces. Similarly,
program listings and data-inspection windows provide an immediate visual
context for the crucial portions of your application.
4-1
4
gdb960 User's Manual
For more complex or unpredictable debugging needs, a command-line
interface gives you full access to a wealth of specialized debugging
commands. For instructions on running gdb960 from the command line,
see Chapters 5 through 13.
Online Help
The UNIX help system is HTML-based and can be viewed with any web
browser such as Mosaic or Netscape. To view the file, simply open the file
wingdb960.htm with your web browser. At installation this file is placed
the in directory [$G960BASE/$i960BASE]/html/tools/.
Running the GUI Debugger
To start the gdb960v UNIX GUI, use the syntax:
gdb960v [options]
where options is any of the options allowed by the gdb960 command line
interface (see chapter 12 for more information). For example, in borne
shell you might enter:
$G960BASE/bin/gdb960v -r /dev/tty0 myprogram
You can also use -d display option, which allows you to explicitly set the
X terminal type used for the display. For example:
gdb960v -r /dev/tty0 -d system.company.com:0.0 myprogram
selects the X DISPLAY as the console of system.company.com.
If no -d option is given, the debugger uses the current setting of the
DISPLAY environment variable. If it is not set, the debugger issues a
fatal error.
4-2
Using the gdb960 UNIX Graphical User Interface
4
A Sketch of the Debugger
Here is the initial gdb960v screen:
The initial screen includes:
• A menu bar with pull down menus for File and Target.
• A toolbar with buttons that vary depending on the state of the
debugger. For example, the Target connect button disappears after
you have connected to a target board. In the above figure, the toolbar
contains the Target connect and Open file buttons.
• A target status line near the upper right corner. This area shows the
state of the target connection, the name of the program that is loaded
(if any), and whether the program is running or stopped.
• A source pane, where the debugger displays source code and
disassembly to you.
• A debug margin along the left side of the source pane, where the
debugger shows which line it is executing, and where breakpoints are
set.
4-3
4
gdb960 User's Manual
•
•
A command line window at the bottom of the screen, where you can
enter gdb960 commands.. All gdb960 commands can be used in this
window. This is where debugger error messages are displayed, and
other feedback such as printing the values of variables.
An animation area (above showing the debugging hand). When the
debugger is busy, this area flashes and animate.
To start debugging a program, you need to:
1. Set your working directory (optional).
2. Connect to a target.
3. Open a file, load the symbols from a program, and optionally
download code to the target.
4. Start running the application.
The sections that follow describe how to complete these tasks.
Setting the Working Directory
Before you get started debugging, you can optionally change your working
directory. This can be done anytime you are in the debugger.
1. Open the File menu and choose Change Directory. This window
appears:
4-4
Using the gdb960 UNIX Graphical User Interface
4
2. Enter the desired path in the directory name textbox. You can also set
this textbox using the mouse by selecting one of the directory names
listed in the Contains Sub-Directories listbox . A dialog box appears,
confirming that the directory has been changed.
You can also change the working directory in the command window
by using the cd <dirname> command.
Connecting to a Target
Now that you have set the working directory, you are ready to connect to a
target board.
1. Physically connect the target board to the host via a serial cable. For
more information see Chapter 2.
2. Make sure the target board has the MON960 debug monitor running.
For more information, see Chapter 2.
3. Press the Target Connect button from the toolbar. You can also use
the Connect option in the Target pull down menu. This window
appears:
4-5
4
gdb960 User's Manual
4. Enter the serial port name in the top text box of the dialog.
Typically in a UNIX system, there is a file named /dev/tty?? used
for serial communication. In the Serial port field, you can enter either
the entire name (/dev/tty??), or just the ?? portion.
You can set this value by including the -r command line option when
you initiate gdb960win as you would using the line oriented debugger.
(see your system administrator for the specific name of the serial port
on your system).
You can also set this option in the command window using the
target mon960 <portname> ... command.
5. If needed, specify the baud rate used to communicate with the target
board. The default setting is 38,400 BPS, and is the maximum rate (on
UNIX). You need only use this option to specify a slower baud rate
than the default.
6. If you wish to use a parallel port for code downloading, make sure the
parallel cable is connected from target to host, and enter the port name
in the field provided.
7. To connect to the target, press the connect button.
NOTE. You can set variables so that the proper communication
parameters are set automatically whenever you run gdb960. These
variables are stored in the TCL configuration files. For more information,
see “Customizing the GUI” on page 4-18.
If you have not successfully connected to your target, an error message
appears in the command window.
4-6
Using the gdb960 UNIX Graphical User Interface
4
When you have successfully connected to your target, the following
changes appear in the main window:
• The Target Connect button on the toolbar disappears.
• The No target portion of the status line becomes MON960.
• The Windows pull down menu appears, which gives you options for
viewing the contents of registers.
• A dialog box appears indicating various information about the target
to which you have connected.
Note also that if you have previously opened a file and read the symbols
from it, the Download button appears on the toolbar.
4-7
4
gdb960 User's Manual
Opening a File
You are now ready to open a program file and then load its symbols and or
download code from it to the target. You can also edit the file in a text
editor as described in “Editing Source Code” on page 4-18.
1. Press the Open File button. This window appears:
You can also access this window by opening the File menu and
choosing Open.
2. Select the desired file by entering the directory and filename in the
text boxes provided, or by selecting one of the directory or file items
in the two list boxes provided.
3. Choose OK.
4. A window appears, giving you the option to edit the source file or load
its symbols. If you choose to load the symbols you can also download
the file to the target. In this section, you load the symbols and
download to the target. See “Editing Source Code” on page 4-18 for
more information on using gdb960v to run your favorite text editor.
4-8
Using the gdb960 UNIX Graphical User Interface
4
5. Select the Load symbols and Download to target options and choose
Open. Notice the following changes to the Debugger window:
• The Open file button from the toolbar disappears.
• The List Code button appears on the toolbar.
• The status line indicates the basename of the file from which you
have loaded symbols/downloaded code.
• The Source list menu appears. The options in this menu allow
you to set the search directories for source files, and also to bring
up the list code dialog.
Listing Code
The debugger lets you display any of the files or modules that comprise a
program. You can also have multiple windows open, which lets you move
between source files and modules as needed.
1. Choose List Code from the toolbar. This window appears:
The left field displays the names of the files or modules that comprise
the program. To the right are the names of the functions found in the
program
2. Select the file or function that you want displayed.
4-9
4
gdb960 User's Manual
3. Choose List. Notice the following changes to the debugger main
window:
• Two buttons for setting permanent or temporary breakpoints
appear on the toolbar.
• If the target is connected, the Run button appears on the toolbar.
• The List mode menu appears. The options in this menu let you
specify whether you want to display C code, assembly code or
both.
4-10
Using the gdb960 UNIX Graphical User Interface
4
NOTE. If the debugger cannot find the file or function you specify, it
displays an error message in the command window. In most cases, the
error is due to the directory with the desired module or file not being in
the list of search directories. To fix this problem, use the Search
Directories option from the Windows directory to add the directory where
the file or function resides to the list of search directories. For more
information, see “Setting the Search Directories” on page 4-11.
You are now ready to debug your software as described in the next
section.
Setting the Search Directories
The Search Directories option lets you maintain a list of directories that
gdb960v uses when searching for files or modules for listing. Also, if the
same filename exists in multiple directories, make sure the directory with
the desired file is listed above any other directories that contain files with
the same name.
1. Open the Source list menu and choose Search directories. This
window appears:
4-11
4
gdb960 User's Manual
2. Use these options to set up the search directories list:
Remove selected directory
Removes the selected directory from the
search list.
Add directory after selection
Adds a new entry to the search directory
list after the selection.
Pressing Insert directory before Adds a new entry to the search directory
list before the selection.
Both the Add directory after selection and the Insert directory before
selection options present you with a dialog where you select a directory
name.
When you are finished modifying the search list press the OK button.
Using the Debugger
Once you have connected to the target, loaded the file, and downloaded
your program, you are ready to use gdb960’s debugging features. In this
section you learn how to
• List the code in C, assembly language, or mixed code.
• Set permanent or temporary breakpoints.
• Run the program.
• Step through your code.
4-12
Using the gdb960 UNIX Graphical User Interface
4
Code Display Options
After you have loaded symbols from a file, you have the option of
displaying them in C, assembly language, or mixed code.
1. Select the List mode menu. The List mode menu appears.
2.
Choose the desired mode:
C
Displays C source code.
Assembly
Displays assembly language code.
Mixed
Displays a combination of C and assembly
language code.
Setting Breakpoints
The debugger lets you set two kinds of breakpoints:
Breakpoints, which stop execution at the
indicated line of code each time the code is run.
Temporary breakpoints, which stop execution at
the indicated line of code the first time you run
the program, but then are deleted.
There are two methods for setting and removing breakpoints:
Point and Click
Using the mouse, select the line where you wish to insert or remove a
breakpoint, then press the right mouse button to set a breakpoint.
Drag and Drop
Drag a breakpoint or a temporary breakpoint icon to a location in the
source pane. The breakpoint or temporary breakpoint icon appears in
the debug margin at the file line number where you dropped the icon.
4-13
4
gdb960 User's Manual
Running Your Program
Now that you have set your breakpoints, you are ready to run your
program.
1. Press the Run button. The Target Run dialog appears.
2. In the Target Run, enter any program command line options.
For example, you might enter “-debug” in the box, and then your
initial program module (main() ?) can parse these using the usual
techniques of parsing argc, argv. This assumes you are using Intel’s
standard crt960.o startup routine.
3. Press Run.
NOTE. You can set the default invocation arguments by assigning them to
the targetRunArgs variable in your tcl configuration file See
“Customizing the GUI” on page 4-18 for more information.
When your program starts executing, the debugger changes the
appearance of the screen in a number of ways. In the main window, the
Run button changes to the re-Run button and the following new buttons
appear:
Target interrupt: Lets you interrupt processing
on the target board. Your board must have a
break detect circuit to use this option (see xyz for
more information on this). To resume execution
from where it stopped, press the step, next,
continue or finish buttons.
Step/next: Causes execution to resume for one
line of C code, or assembly instruction
(depending on which list mode is currently
selected). The step button steps into calls,
whereas the next button steps over calls.
Continue: Continues execution from where it
stopped.
4-14
Using the gdb960 UNIX Graphical User Interface
4
Finish: Continues execution until the current
subroutine completes, then the debugger regains
control in the calling statement.
Backtrace
Displays the backtrace window. See backtrace
window below.
Up stack frames: Causes the debugger to go to
the scope of the caller of the current frame.
Down stack frames: Causes the debugger to go
down in stack frames closer to where the
machine is actually executing.
print/print star: Lets you print (or, print with
one level of indirection) what is currently
selected in the source pane, and display it in the
command window.
Display/display *: Display the value of the
selection (or the selection with one level of
indirection) in a separate window. The window
updates whenever the variable changes values.
Once a program starts executing, the debugger regains control after:
• the program encounters one of the breakpoints you inserted, or
• the program encounter a fatal error, or
• you press the Target interrupt button.
When the debugger regains control, the source pane displays the C source
code or assembly language corresponding to the location where execution
halted, and the arrow icon ( ) appears in the debug margin adjacent to the
C source statement or the assembly instruction where execution halted.
4-15
4
gdb960 User's Manual
Using the Up and Down Stack Frames Feature
Pressing the up and down the stack frame buttons causes the debugger to
display the contexts of the previous or next stack frames respectively. Two
icons displayed in the debug margin help you in using this feature:
indicates the call site.
indicates the innermost frame.
Viewing the Contents of Registers
After you have run your program or stopped execution at a breakpoint,
you may want to check the values of the i960 processor registers. To do
so:
1. Open the Windows menu and choose Registers. This window
appears:
4-16
Using the gdb960 UNIX Graphical User Interface
4
The window is updated each time the target halts, and if a value differs
from the previous display, the value appears in bold. For example, in the
register window above, the three registers pfp, sp, and rip have changed
since the previous execution.
Using the Backtrace Window
When debugging software, it is often useful to step backwards through the
calling sequence. gdb960v lets you do this any time after you have halted
program execution. To use this feature:
1. Select the Windows menu and choose Backtrace, or press the
Backtrace button on the toolbar. An interactive window displaying
the program’s call stack appears:
The frame that corresponds to the source pane is set in bold. The
Debug margin displays the current execution point going up and down
in the backtrace. The register window changes to display the register
values for the selected stack frame.
2. Click on any member of the call stack to display its contents in the
source pane.
Using the Print/Print Star Options
The print and the print * buttons let you print (or, print with one level of
indirection) what is currently selected in the source pane, and display it in
the command window. For example, suppose in the source pane there is a
line of source code that says:
foo(bar);
If you select the variable bar and press the print button, the command
window displays the current value of the variable in the command
window.
4-17
4
gdb960 User's Manual
Editing Source Code
To edit your source code, drag the edit icon to the line that you want to
change. If you drag the Edit icon, by default, the vi editor is brought up.
You can specify a different editor by setting the EDITOR environment
variable. See “Customizing the GUI” on page 4-18 for more information.
Creating a New File
To create a new source file:
1. Open the File menu, and choose New.
2. In the dialog provided, enter the name of the file that you would like
to create and the directory where it will reside.
The debugger brings up the text editor specified with the TCL EDITOR
environment variable. See “Customizing the GUI” on page 4-18 for
information on setting this option.
Exiting the Debugger
To exit the debugger:
1. Open the File menu and choose Exit.
Alternatively, you can type quit in the command window.
Customizing the GUI
You can customize your configuration for many of the GUI’s dialogs by
editing the following TCL files. To set the options, you need to edit either
of the following files:
$I960BASE$G960BASE/gui/host/resource/tcl/app-config/<host-type>.tcl
$HOME/.wind/crosswind.tcl
4-18
Using the gdb960 UNIX Graphical User Interface
4
The second file is read in after the first one, and so can override values in
the first file, which in turn overrides the default configuration. The first
file is for customizations visible throughout the whole system, affecting all
users, whereas the second file is for customizations specific to a user.
For example you may enter lines to set your target communication
parameters:
set targetConnectSerialPort “01”
set targetConnectSerialBaud “9600”
set targetConnectSerialPPort “/dev/bpp0”
You may want to set the default invocation arguments by assigning them
to the targetRunArgs. For example:
set targetRunArgs “-debug”
You may also want to specify the editor to use by setting the EDITOR
environment variable, or by setting the textEditor TCL variable in the
above .tcl files. For example:
set textEditor emacs
4-19
Configuring the gdb960 Environment
5
In this chapter, you learn some of the basic commands for configuring the
gdb960 environment. Topics include:
• Rules for using gdb960 commands
• Commands for specifying files and directories
• gdb960 environment variables
• Using the help command, to access reference information on gdb960
commands
• Using the show command to determine the current gdb960 settings
• Using the info command to display register and breakpoint settings
• Setting the gdb960 command prompt
• Command line editing
• Using the History feature
• Shell and Make options
• Setting the gdb960 screen size
• Setting the radix (octal, decimal, hexadecimal)
• Message options
• Quitting gdb960
Rules for Using gdb960 Commands
Commands consist of a command name followed by arguments whose
meaning depends on the command name. For example, the command
step accepts an argument that is the number of times to step, as in step 5.
You can also use the step command with no arguments. Some
commands do not allow any arguments.
5-1
5
gdb960 User's Manual
Command names may be truncated if the abbreviation is unambiguous.
Some commands have pre-defined abbreviations. These are listed in the
description for individual commands. For example, s is specially defined
as equivalent to step even though there are other commands whose names
start with s. For more information on command line shortcuts, refer to
Appendix B.
Entering a blank line at the gdb960 prompt repeats the previous command.
Commands whose unintentional repetition might cause trouble are
restricted from repeating in this way. Other commands (e.g., list and x)
act differently when repeated. For example, list n shows the next n lines
beyond those already listed rather than repeating the lines already
displayed.
An input line starting with # is a comment; it does nothing. This is useful
in command files. For additional information on command files, refer to
Chapter 13.
File-specifying Options
When you invoke gdb960 from the command line, the debugger assumes
that the first argument not preceded by one of the file-specifying
command line options or by the option flags “-” or “/” specifies an
executable file. For example, in this command line program1 is the name
of the executable from which symbolic information is read:
gdb960 -pci program1
This is equivalent to using the -se option described below. There are
other options that let you perform such functions as changing the working
directory, specifying additional search directories, and specifying whether
the debugger loads a program’s symbols before downloading and
executing it.
add-symbol-file
filename address
5-2
The add-symbol-file command reads
additional symbol table information from
filename. Use this command when that file has
been dynamically loaded (by some other means)
Configuring the gdb960 Environment
5
into the running program. The address
argument must be the memory address at which
the file has been loaded.
The symbol table of filename is added to the
symbol table originally read with the symbolfile command. You can use the add-syms
command any number of times; the new symbol
data keeps adding to the old. In contrast, the
symbol-file command loses all the symbol
data gdb960 has read before loading new
symbols.
cd directory
Set gdb960's working directory to directory.
d directory
Add directory to the search path for source
files.
e file
Use file as the file to download and/or execute.
exec-file filename
Specify that the program to be run (but not the
symbol table) is found in filename. The
gdb960 debugger searches the environment
variable PATH, when necessary, to locate the
program. Use the file command to get both the
symbol table and the program to run from the
same file.
file filename
Use filename as the program to be debugged.
[ -p{c|d|x} offset ] It is read for its symbols and pure memory
contents, and it is executed when you give the
run command. If you do not specify a directory
and the file is not found in gdb960's working
directory, gdb960 uses the PATH environment
variable as a list of directories to search.
The file command with no argument leaves
both the executable file and symbol table
unspecified.
5-3
5
gdb960 User's Manual
If you specify -pc, -pd, or -px, symbols are
relocated by adding offset to their values.
These arguments act the same as their commandline counterparts. Refer to Chapter 12 for more
information.
After loading the debug data with the file
command, you can download the code with the
load command.
info files
Display the current target, including the names of
the executable files currently in use by gdb960,
and the files from which symbols were loaded.
load [ filename ]
This command downloads filename to the
current target. If you have already specified an
exec-file with the file or exec-file
commands, then leaving out filename causes
the current exec-file to be downloaded.
readnow
Read each symbol file’s entire symbol table
immediately, rather than the default, which is to
read it incrementally as needed. This slows the
symbol-file command, but speeds up other
operations.
s file
Read symbol table from file.
se file
Read the symbol table from file and use it as
the executable.
symbol-file
filename
Read symbol table information from file
filename. PATH is searched when necessary.
Use the file command to get both the symbol
table and the program to run from the same file.
The symbol-file command with no argument
clears out gdb960's information on your
program’s symbol table.
5-4
Configuring the gdb960 Environment
5
The symbol-file command causes the gdb960
debugger to lose the contents of its convenience
variables, the value history, and all breakpoints
and auto-display expressions. This is because
they may contain pointers to internal data
recording symbols and data types that are part of
the old symbol table data being discarded.
x file
Execute gdb960 commands from file. For
more information on setting up a batch mode
execution file, refer to Chapter 13. -command is
a synonym for -x.
While all file-specifying commands allow both absolute and relative file
names as arguments, gdb960 always converts the file name to an absolute.
gdb960 Environment Variables
The following is a list of environment variables recognized by the gdb960
debugger. Following each variable is a description of its use and its
default value:
COMSPEC
Used by Windows systems only. Sets the shell to
run for the shell command. Can be overridden
with the SHELL variable.
SHELL
Sets the shell to run for the shell command.
Defaults are:
UNIX: /bin/sh
Windows: Current setting of the $COMSPEC
environment variable. If $COMSPEC is not set,
the debugger then looks for COMMAND.COM in the
current PATH.
PATH
Used by gdb960 to find executables when not
found in the current directory.
5-5
5
gdb960 User's Manual
HOME
Used by gdb960 to find .gdbinit and
.inputrc. No defaults. The debugger always
looks in the current directory for .gdbinit
whether or not $HOME/.gdbinit is found. The
debugger always takes .inputrc from the
$HOME directory.
HISTSIZE
Sets number of gdb960 commands to save in
history file. Default is 256.
GDBHISTFILE
Sets name of history file. Defaults are
.gdb_history in the current directory for
UNIX hosts; hist.gdb in the current directory
in Windows.
TERM
Used to set up screen width and height from
termcap database. Default is 80 x 24.
I960ERR
Windows only. If set, send stdout and stderr
to different streams. Default is to mix stdout
and stderr.
G960BAUD
Sets the default baud rate. Default is 38400 bps.
Command line -b overrides $G960BAUD.
The help Command
The help command displays category- or command-specific help. The
help command syntax is as follows:
help [ option ]
Displays information about gdb960 commands.
When option is a command name, help displays
a paragraph on how to use the command. With
no arguments, help displays a short list of
command categories; you can then enter the
help command using one of the listed categories
to replace option. The result is a list of the
individual commands in the specified category.
5-6
Configuring the gdb960 Environment
5
The show Command
The show command displays the gdb960 software debugger's internal
state. The following is the show command syntax:
show option
Where option is one of the set command
options.
The following are some of the more commonly used show command
options:
version
Displays version information for the currently
running gdb960 software debugger.
print
Displays gdb960's print settings.
editing
Tells you whether command line editing is on or
off.
prompt
Displays the current prompt string. For more
information on the prompt string, see the set
prompt command.
For a complete listing of the show options, refer to Chapter 12.
The info Command
The info command displays information about the program being
debugged, for example, the program's registers or the status of the
program's breakpoints. Following is the info command syntax and a
description of the effects of two examples of the use of info:
info option
Where option is one of the info options listed
in Chapter 12.
5-7
5
gdb960 User's Manual
The following are examples of the info command:
info registers
Displays the registers of the program.
info breakpoints
Displays the current breakpoints.
For a complete listing of the possible arguments to info, refer to
Appendix E.
The set prompt Command
The set prompt command changes the prompt string displayed by
gdb960. The gdb960 software debugger indicates its readiness to read a
command by printing a string called the prompt. This prompt string is
normally (gdb960).
set prompt newprompt Directs gdb960 to use newprompt as its prompt
string.
Command Line Editing
The gdb960 software debugger reads its input commands via the
readline interface. This GNU library provides consistent behavior for
programs that provide a command line interface to the user. Advantages
are Emacs-style or vi-style in-line editing of commands, csh-like history
substitution, as well as storage and recall of command history across
debugging sessions. For detailed information on the command line editing
capabilities of gdb960, refer to Appendix B, Command Line Editing.
The set command controls the behavior of command line editing in
gdb960. The show command checks the status of command line editing.
The following examples demonstrate the use of set and show. For a
complete list of the options available for set and show, refer to
Chapter 12.
5-8
set editing
set editing on
Enable command line editing (enabled by
default).
set editing off
Disable command line editing.
show editing
Show whether command line editing is enabled.
Configuring the gdb960 Environment
5
Using the History Feature
The set history save command causes each command entered at the
gdb960 command line to be stored for later retrieval. You can store the
commands to either a buffer or a file. History expansion commands allow
retrieval of commands stored by history. Below is the set history
command syntax followed by a list of and a description of the effects of
the possible replacements for option in a set history command:
set history [ option ]
Where option may be any of the following:
filename
Set the gdb960 command history file to
filename. The gdb960 debugger reads an initial
command history list from this file and writes a
history list to this file when you exit gdb960.
The history list is accessed through history
expansion or through the history command
editing characters.
By default, filename is ./.gdb_history for
UNIX hosts, and ./hist.gdb for Windows
hosts. However, when the GDBHISTFILE
environment variable is set, the value of the
GDBHISTFILE is used.
save on
Record the gdb960 command history in a file.
By default, filename is ./.gdb_history for
UNIX hosts, and ./hist.gdb for Windows
hosts. However, when the GDBHISTFILE
environment variable is set, the value of
GDBHISTFILE is used. You can also specify a
filename using the set history file command.
By default, set history save is off.
save off
Stop recording command history in a file.
5-9
5
gdb960 User's Manual
size [size]
Set the number of commands that gdb960 keeps
in its history list. The default is the value of the
HISTSIZE environment variable, or 256 when
HISTSIZE is not set.
History Expansion
History expansion assigns special meaning to the exclamation point
character (!). Since ! is also the logical not operator in C, history
expansion is off by default.
NOTE. When using ! as a logical not in an expression while history
expansion is enabled, you may sometimes need to follow ! with a space or
a tab to prevent it from being expanded. The readline history facilities
do not attempt substitution on the strings "!=" and "!(" even when history
expansion is enabled.
The set history options to control history expansion are:
expansion on
Enable history expansion. History
expansion is off by default.
expansion off
Disable history expansion.
The show history options to display the state of the gdb960 history
parameters are:
filename
save
size
expansion
show history by
itself displays all four
states.
For additional information about command line editing using Emacs or vi,
refer to Appendix A. For additional options, refer to Chapter 12.
5-10
Configuring the gdb960 Environment
5
shell and make Commands
You can execute a shell command from within gdb960 in either Windows
or UNIX systems by entering the shell command.
shell
Causes gdb960 to spawn a shell with a command
prompt. Enter the exit command to the shell to
return to gdb960.
shell command
Causes gdb960 to spawn a shell to execute
command. The debugger uses the environment
variable SHELL when it is set, otherwise gdb960
uses /bin/sh.
The utility make is often needed in development environments. The
shell command is not needed to execute make. However, make must
appear in the PATH:
make …
Causes gdb960 to spawn a shell run the make
program with the arguments specified with the
make command. This is equivalent to shell
make …
Screen Size
Certain gdb960 commands may output large amounts of information to the
screen. To help you read all of it, gdb960 pauses and asks you for input at
the end of each page. Enter RET to continue. On UNIX, gdb960 sets the
screen size based on settings from the termcap database, the value of the
TERM environment variable, and the stty rows and stty cols settings.
In Windows, gdb960 queries the host for the current screen dimensions.
You can override the default settings with the set height and set width
commands.
5-11
5
gdb960 User's Manual
The gdb960 software debugger also uses the screen width setting to
determine when to wrap lines of output. It tries to break the line at a
readable place, rather than simply letting it overflow onto the following
line.
show height
show width
set height lpp
set width cpl
These set commands specify a screen
height and a screen width, where lpp
contains the number of lines on the
screen, and cpl contains the number of
columns on the screen. The associated
show commands display the current
setting. If you specify a height of zero
lines, gdb960 does not pause during
output, no matter how long the output is.
This is useful if output is to a file or to
an editor buffer.
Setting Radix
You can enter numbers in octal, decimal, or hexadecimal in gdb960 using
the standard conventions: Octal numbers begin with "0" and hexadecimal
numbers begin with "0x." Numbers that begin with none of these are, by
default, entered in base ten; likewise, the default display for numbers
when no particular format is specified is base ten. You can change the
default base for both input and output with the set radix command.
5-12
set radix base
Set the default base for numeric input
and display. Supported choices for base
are decimal 8, 10, 16. base must be
specified either unambiguously or using
the current default radix.
show radix
Display the current default base for
numeric input and display.
set input-radix base
Set the default base for numeric input
that you provide.
5
Configuring the gdb960 Environment
set output-radix base
Set the default base for numeric output
printed by gdb960.
set radix base
Set both input and output bases.
Messages, Complaints and Cautions
By default, gdb960 is silent about its inner workings. The set verbose
command forces gdb960 to display messages during lengthy internal
operations.
Currently, the messages controlled by set verbose announce that the
symbol table for a source file is being read.
set verbose on
Enables gdb960's output of informational
messages.
set verbose off
Disables gdb960's output of informational
messages.
show verbose
Displays whether set verbose is on or off.
You can tell gdb960 to display a message when it encounters a bug in an
object file's symbol table. By default, gdb960 does not display such
messages.
set complaints
limit
Permits gdb960 to output limit complaints
about each type of unusual symbol before
becoming silent about the problem. The default
is zero, off. Set limit to a large number -- five
is reasonable -- to prevent complaints from being
suppressed.
show complaints
Displays how many symbol complaints gdb960
is permitted to produce.
5-13
5
gdb960 User's Manual
By default, gdb960 provides cautions in its queries for information. For
example, if you try to run a program that is already running, the debugger
displays the message shown in the following example:
(gdb960) run
The program being debugged has been started already.
Start it from the beginning? (y or n)
You can use these options to enable or disable this feature:
set confirm off
Disables cautions.
set confirm on
Enables cautions (the default).
show confirm
Displays state of cautious questions.
Exiting gdb960
To exit the gdb960 software debugger, use the quit command
(abbreviated q), or type an end-of-file character, usually CTRL + d. An
interrupt, often CTRL + c, does not exit from gdb960, but terminates the
action of any gdb960 command that is in progress and returns control to
the gdb960 command line.
5-14
Example gdb960 Session
6
This chapter contains an example session of the gdb960 Software
Debugger. The session provided here uses a variation on "hello, world."
In the example, you perform the following tasks:
1. list the program
2. compile the program
3. invoke the debugger
4. load the program
5. set a breakpoint
6. list lines
7. set another breakpoint
8. execute to the breakpoints
9. examine data
10. exit from the program and the debugger
Example Session
This extended example demonstrates a minimal set of gdb960 commands.
Follow the example sequence to familiarize yourself with the debugger
and the command line interface. Experiment with the other commands
described in this manual.
6-1
6
gdb960 User's Manual
The following is a UNIX listing of the example program:
$ cat hello.c
char buf[20] = "hi there";
main(argc, argv)
int argc;
char *argv[];
{
int i = 8;
buf[i++] = ',';
buf[i++] = '\0';
strcat(buf, " ya'll");
printf ("%s\n", buf);
}
The two compiler invocation lines below demonstrate a build of the
example program using gcc960 and ic960, respectively. For more
information on the two compilers, refer to your compiler user’s guide. In
the example compile lines, the test program is built for the Intel
EV80960CA evaluation board:
$ gcc960 -g -Tmevca -o hello hello.c
$ ic960 -g -Tev960ca -o hello hello.c
The example assumes a UNIX system and a serial port, /dev/tty01. To
familiarize yourself with a work session with the gdb960 software
debugger, perform the following actions:
1. Invoke the gdb960 debugger by entering the following command:
$ gdb960 -r 01
2. The following messages appear:
GDB is free software and you are welcome to distribute
copies of it under certain conditions; type "show
copying" to see the conditions.
There is absolutely no warranty for GDB; type "show
warranty" for details.
gdb960 2.4, Thu Mar 10 09:14:12 PST 1995
GDB 5.0 (host --target i960-intel-mon960),
6-2
6
Example gdb960 Session
Copyright 1993 Free Software Foundation, Inc.
Connected to /dev/tty01 at 38400 bps.
3. Once the prompt returns, specify the file gdb960 is to read the symbol
table from by entering the file command:
(gdb960) file hello
Reading symbols from hello...done.
4. Enter the load command to download the program and prepare for
execution:
(gdb960) load
section 0, name
writing
section 1, name
writing
section 2, name
-- noload
.text, address 0xe0008000, size 0x4c9c, flags 0x20
section at 0xe0008000
.data, address 0xe000cca0, size 0x18, flags 0x40
section at 0xe000cca0
.bss, address 0xe000ccc0, size 0x68c, flags 0x80
5. Set a breakpoint after the initialization code and at the first executable
line in main():
(gdb960) b main
Breakpoint 1 at 0xe0008100: file hello.c, line 8.
6. Run the program until it encounters the breakpoint at the first line of
main:
(gdb960) run
Starting program: /ffs/a/peters/gdb960/tutorial/hello
Breakpoint 1, main (argc=1, argv=0xe000d0c0) at hello.c:8
8
int i = 8;
7. List ten lines, centered around the encountered breakpoint:
(gdb960) list
1
2
char
buf[20] = "hi there";
3
4
main(argc, argv)
5
int argc;
6
char *argv[];
7
{
8
int i = 8;
9
buf[i++] = ',';
10
buf[i++] = '\0';
6-3
6
gdb960 User's Manual
8. Set a breakpoint on line 10:
(gdb960) b 10
Breakpoint 2 at 0xe0008120: file hello.c, line 10.
9. Continue execution until the second breakpoint is encountered:
(gdb960) c
Continuing.
Breakpoint 2, main (argc=1, argv=0xe000d0c0) at hello.c:10
10
buf[i++] = '\0';
10. Display the contents of the eighth element of the buf array:
(gdb960) p buf[8]
$1 = 44 ','
11. Step to the next line:
(gdb960) n
11
strcat(buf, " ya'll");
12. Display the string held in buf after executing the eighth line:
(gdb960) p buf
$2 = "hi there,\000\000\000\000\000\000\000"
13. Step to the next line:
(gdb960) n
12
printf("%s\n", buf);
14. Display the string held in buf after executing the eleventh line:
(gdb960) p buf
$3 = "hi there, ya'll\000\000\000\000"
15. Continue execution until the program terminates:
(gdb960) c
Continuing.
hi there, ya'll
Program exited with code 020.
16. Quit the debugger:
(gdb960) q
Terminating old session with dev/tty01
$
6-4
Running Your Program with gdb960
7
This chapter describes how to complete the following tasks:
• Run programs from the gdb960 debugger
• Specify arguments for your program
• Set the working directory for gdb960
• Set the environment for gdb960
Running Programs
Complete the following steps:
1. Make sure you recompile your software to include debugging
information as described in Chapter 2.
2. Run gdb960 and specify the name of the file that you would like to
execute, as described in Chapter 2. For example:
gdb960 -pci myprogram
Note that you can use the file specification options (e.g., file, execfile) described in Chapter 5 to specify a different file to execute after
gdb960 has loaded.
3. Enter the run command, using the syntax:
run [arguments]
where arguments specifies any arguments that your program
accepts on the run command. Alternately, use set args to set the
program arguments.
Entering a run command begins program execution immediately. For
a discussion of how to stop and restart a program by using
breakpoints, refer to Chapter 8.
7-1
7
gdb960 User's Manual
Setting Your Program's Arguments
The arguments to your program are specified as arguments to the run
command. The run command passes them directly to the monitor target to
be used during the invocation of your program.
NOTE. Entering run with no arguments invokes your program with the
same arguments used by the previous run.
The following commands allow you to change or examine the arguments
to be passed the next time your program is invoked by the run command:
set args
[ arguments ]
The command set args can be used to specify
the arguments to use the next time the program is
run. If set args has no arguments, it means to
use no arguments the next time the program is
run. This way, you can run your program with
arguments and set it to run again with no
arguments.
show args
Show the arguments to be used by your program
when it next starts.
Setting Your Program's Working Directory
Each program invocation with run inherits its working directory from
gdb960's current working directory. The gdb960 debugger's working
directory is initially inherited from its parent process (typically the shell).
The cd command allows specifying a new working directory in gdb960.
The gdb960 working directory also serves as a default for the commands
that specify files on which gdb960 operates.
7-2
cd directory
Set gdb960's working directory to directory.
pwd
Display gdb960's working directory.
Running Your Program with gdb960
7
Your Program's Environment
At startup, gdb960 inherits the environment from your current shell. This
environment is then passed on to MON960, where it becomes available to
your program.
Up to 20 environment variables can be passed to the program via
MON960. The typical UNIX environment is larger than that. It may be
necessary to start your UNIX shell with a stripped-down environment if
you need to pass variables to your application. One common way to do
this is to give the UNIX command:
env - /bin/ksh
where /bin/ksh is the shell that is used to start up gdb960.
The following commands allow you to change or examine the program
environment:
set environment
varname [value]
Set environment variable varname to value.
The environment change is visible to your
program, not to gdb960. If optional value is
omitted, varname is set to NULL.
environment can be abbreviated env.
show environment
[varname]
Show the value of environment variable
varname, or all variables if varname is omitted.
unset environment
[ varname ]
Remove the variable varname from the
environment. If varname is omitted, remove all
environment variables.
path directory
Add directory to the front of the PATH
environment variable. (the search path for
executables). You may specify several directory
names, separated by ‘:’ or white space (‘;’ or
white space on Windows).
7-3
Program Execution Control
8
This chapter describes the features of the gdb960 debugger that allow you
to halt, examine, and restart your program.
A debugger allows you to interrupt program execution to inspect the
internal state of the program. The gdb960 debugger provides breakpoints,
conditional breakpoints, and watchpoints to monitor execution and halt
execution at instructions you have identified, or when conditions you have
defined develop.
Breakpoints
A breakpoint halts program execution when the execution point reaches a
pre-selected instruction in the program. Set breakpoints explicitly with
gdb960 commands, specifying by line number, function name, or exact
address the line on which the program should halt execution. Conditions
describing the internal state of the program can be added to breakpoints.
When the breakpoint is encountered, the debugger interrupts the programs
operation and evaluates the stop conditions. If the conditions evaluate to
false, then the debugger silently continues program execution. If the
conditions evaluate to true, then the debugger announces the interruption.
The effects of momentary interruptions to a real-time system must be
considered when setting conditional breakpoints.
When each breakpoint is created, the debugger assigns it a number. The
numbers are successive integers starting with 1. In commands for
controlling breakpoint features, the breakpoint number determines which
breakpoint is affected. Each breakpoint can be enabled or disabled; if
disabled, it cannot effect program execution until enabled.
8-1
8
gdb960 User's Manual
Breakpoints are set with the break command (abbreviated b). The
gdb960 software debugger allows any number of breakpoints on the same
line in a program. When it resumes execution, the gdb960 debugger
ignores breakpoints until at least one instruction has been executed.
Otherwise, you could not proceed past a breakpoint without first disabling
it.
Refer to Chapter 2 for more information on breakpoints and symbolic
debugging of optimized code.
The following is a list of commands that create, examine, or manipulate
breakpoints. Accompanying each command is a description of its use:
break
Set a breakpoint at the next instruction to
be executed in the selected stack frame.
A breakpoint set with break in the
innermost frame halts execution the next
time it reaches the current location.
In any selected frame but the innermost,
the breakpoint causes the program to
halt as soon as control returns to that
frame.
For more detail on how stack frames are
selected and moving from frame to
frame, refer to Chapter 9.
break *address
Set a breakpoint at address. You can
set breakpoints in parts of the program
that do not have debugging information
or source files. The asterisk allows the
command line parser to identify
address as an address rather than a
number.
break [ filename: ]
function
Set a breakpoint at entry to function in
filename. Specifying a file name is
unnecessary except when multiple files
contain functions with the same name.
8-2
8
Program Execution Control
break [ filename: ]linenum
break ... if cond
Set a breakpoint at line linenum in
source file filename. If filename is
not specified, it defaults to the current
file.
Set a breakpoint with condition cond;
evaluate the expression cond each time
the breakpoint is reached, and halt only
if the value is non zero.
An ellipsis, "...", stands for one of the
possible arguments described above (or
no argument) specifying where to break.
See the Break Conditions section in this
chapter for more information on
breakpoint conditions.
break +offset
break -offset
Set a breakpoint offset number of lines
forward or back from the execution
point in the currently selected frame.
hbreak args
For MON960, only. Set a hardware
breakpoint, abbreviated hb. The
arguments list, args, allows the same
arguments that are listed in the break
command, and the breakpoint is set the
same way. Hardware breakpoints allow
breakpoints in non-writeable code (e.g.,
code that resides in ROM or FLASH).
Breakpoints set with the break command
are silently ignored when set in code that
resides in non-writeable memory. You
may set any number of hardware
breakpoints, but i960 processor
architectures allow only two to be
enabled at any one time. If more than
8-3
8
gdb960 User's Manual
two are enabled, the lowest two
breakpoint numbers are honored and all
others are automatically disabled.
info break [ bnum ]
The command info break displays a
list of all breakpoints set and not deleted,
showing their numbers, where in the
program they are, and any special
features related to them. Disabled
breakpoints are included in the list and
marked as disabled.
Specifying a breakpoint number after the
info break command lists only
information about the breakpoint
associated with the specified number.
The info break command sets the
convenience variable $_ and the default
examining-address for the x command to
the address of the last breakpoint listed.
8-4
info watch
This is a synonym for info break.
rbreak regex
Set a breakpoint on all functions
matching regex. This command sets an
unconditional breakpoint on all matches,
displaying a list of all breakpoints set.
Once the breakpoints are set, they are
treated just like the breakpoints set with
break. They can be deleted, disabled,
made conditional, etc., in the standard
ways.
8
Program Execution Control
tbreak args
Set a breakpoint that only halts
execution once. The arguments list,
args, is the same as in the break
command, and the breakpoint is set the
same way, but the breakpoint is
automatically disabled the first time it is
encountered. For more information on
disabling breakpoints, refer to the
Disabling Breakpoints and Watchpoints
section in this chapter.
Watchpoints
A watchpoint is a breakpoint that halts your program only when a
specified expression’s value changes. Watchpoints are set with the watch
command. Watchpoints are managed like other breakpoints and are
enabled, disabled, and deleted using the same commands used for other
breakpoints.
There are two types of watchpoints:
1. Hardware-assisted watchpoints use i960 registers and evaluate at
normal execution speed.
2. Software watchpoints depend on single-stepping and are slower.
Hardware watchpoints are available on i960 C-series, J-series, RP-series,
and H-series processors. A maximum of two hardware watchpoints can
be set at any one time (six on the H-series processors).
When you specify a watchpoint with the watch command, gdb960
determines automatically if the target hardware supports hardware
watchpoints. If so, and if there are sufficient hardware watchpoint
registers available, they are allocated to your watchpoint. Otherwise, a
software watchpoint is generated. The awatch and wwatch commands
are available for setting only hardware-assisted watchpoints.
8-5
8
gdb960 User's Manual
Watchpoints find bugs when the module, function or location causing the
problem is unknown. For all types of watchpoints, provide a specifier for
a memory location (expr below; i.e., not a register or machine address,
but a variable like arg[10]). The gdb960 debugger converts the
expression into an address.
awatch expr
Set a memory access hardware
watchpoint. Memory access
watchpoints halt program execution
when any read or write is attempted at
the address of expr.
watch expr
Set a watchpoint on expr. Use
hardware resources if available.
wwatch expr
Set a memory write hardware
watchpoint. Memory write watchpoints
halt program execution when a write is
attempted at the address of expr.
Deleting Breakpoints and Watchpoints
The clear command lets you delete breakpoints according to their
placement in the program. The delete command lets you delete
individual breakpoints by specifying their breakpoint numbers. A deleted
breakpoint no longer exists in any sense; it is forgotten.
NOTE. The gdb960 debugger automatically ignores breakpoints on the first
instruction to be executed when you continue execution without changing the
execution address. This prevents the debugger from stalling on a breakpoint.
8-6
8
Program Execution Control
The following is a list of commands that remove breakpoints or
watchpoints:
clear
Delete any breakpoints at the next
instruction to be executed in the selected
stack frame. When the innermost frame
is selected, clear deletes the breakpoint
at which the program halted.
clear function
clear filename:function
Delete any breakpoints set at the entry to
the function function.
clear linenum
clear filename:linenum
Delete any breakpoints set at or within
the code of the specified line.
delete breakpoints
bnums...
delete bnums...
delete
Delete the breakpoints of the numbers
specified as arguments. If no argument
is specified, delete all breakpoints.
Disabling Breakpoints and Watchpoints
Once a breakpoint is created, it can be set to one of the four following
states:
• Enabled. The breakpoint halts the program. A breakpoint made with
the break command starts out in this state.
• Disabled. The breakpoint has no effect on the program.
• Enabled once. The breakpoint halts the program, but when it does so
it is disabled. A breakpoint made with the tbreak command starts
out in this state.
• Enabled for deletion. The breakpoint halts the program, but
immediately after the breakpoint is deleted permanently.
Disabling renders a breakpoint inoperative. However, a disabled
breakpoint can be enabled again.
Disable and enable breakpoints with the disable and enable commands,
optionally specifying one or more breakpoint numbers as arguments.
8-7
8
gdb960 User's Manual
NOTE. Use info break to display a list of breakpoints if you don't know
which breakpoint numbers to use.
The following is a list of commands and descriptions for enabling or
disabling breakpoints:
disable breakpoints bnums
Disable the breakpoints listed in bnums.
disable bnums
Any number of breakpoints may be
listed by number. Separate each number
from the next by a space. The
breakpoint keyword is not necessary
unless differentiating between disabling
display and disabling breakpoints. The
default is to disable breakpoints.
disable
If no list of breakpoints is specified, all
breakpoints are disabled. A disabled
breakpoint has no effect but is not
forgotten. All options such as ignorecounts, conditions and commands are
remembered in case the breakpoint is
enabled again later.
enable breakpoints bnums
enable bnums
enable
Enable the breakpoints specified in
bnums. If bnums is not specified, enable
all defined breakpoints.
enable once bnums
Enable the specified breakpoints
temporarily. Each is disabled the next
time it halts your program.
enable delete bnums
Enable the specified breakpoints
temporarily. Each is deleted the next
time it halts your program.
Except for a breakpoint set with tbreak, breakpoints are enabled or
disabled only when you use one of the above commands.
8-8
8
Program Execution Control
NOTE. The command until can set and delete a breakpoint, but it does
not change the state of your breakpoints. The until command is
described later in this chapter.
Break Conditions
Execution is halted every time an enabled breakpoint is encountered. To
customize a breakpoint to halt execution only under special conditions, a
conditional expression can be attached to the breakpoint. Conditional
breakpoints cause momentary program interruption, which can affect realtime programs. Execution halts only if the expression evaluates to true.
Any valid C expression in scope when the breakpoint is reached can be
used in a breakpoint condition.
Breakpoint conditions can have side effects, and may even call functions
in your program. This can useful, for example, to activate functions that
log program progress, or to use your own print functions to format special
data structures. The effects are predictable unless there is another enabled
breakpoint at the same address. In that case, gdb960 might encounter the
unexpected breakpoint first and halt execution without checking the
expected breakpoint. Note that breakpoint commands are usually more
convenient and flexible for the purpose of performing side effects when a
breakpoint is reached.
When a breakpoint is set, break conditions can be specified by using if in
the arguments to the break command. Breakpoint conditions can also be
changed at any time with the condition command. The following is a
list of condition commands and their effects on the breakpoints to which
they are applied:
condition bnum expression
Specify expression as the break
condition for breakpoint number bnum.
The breakpoint halts the program only if
the value of expression is true (non
zero, in C). The expression is not
8-9
8
gdb960 User's Manual
evaluated when the condition
argument is given. When you enter the
condition argument to the break
command, the expression you specify
is checked immediately for syntactic
correctness and to determine whether
symbols in it are defined in the scope of
your breakpoint. For more information
on examining data, refer to Chapter 11.
condition bnum
Remove the condition from breakpoint
number bnum to make it an
unconditional breakpoint.
Each breakpoint has an integer value called an ignore count associated
with it. The integer is set to 0 for enabled, unconditional breakpoints. The
ignore count command sets the integer to a positive value. Each time
execution encounters the breakpoint, the ignore count value is
decremented by 1. When the value reaches 0, the breakpoint halts
execution and any set conditions are evaluated. The following is a list of
commands that manipulate count and execution:
ignore bnum count
continue [ count ]
fg [ count ]
8-10
Set the count of breakpoint number bnum to
count. The next count times the breakpoint is
reached, your program’s execution does not halt;
other than to decrement the ignore count, gdb960
takes no action.
To make the breakpoint halt the next time it is
reached, specify a count of zero.
Continue executing the program. If count
is specified, ignore count of the breakpoint
that halted execution to count minus one. The
program does not halt at the breakpoint again
until the breakpoint is encountered count times.
8
Program Execution Control
Except when halted at a breakpoint, the
argument to continue is ignored.
The synonym fg is provided for convenience,
and has exactly the same behavior as continue.
NOTE. If a breakpoint has a positive ignore count and a condition, the
condition is evaluated each time the breakpoint is hit, but execution does
not stop until the ignore count reaches zero.
Commands Executed on Breaking
You can give any breakpoint a series of commands to execute after
execution halts at a breakpoint. For example, you might want to display
the values of certain expressions, or enable other breakpoints. The
following command allows creation of a list of commands that can be
associated with breakpoints:
commands bnum
Specify a list of commands for breakpoint
number bnum. Enter the commands one per line
on separate lines following commands. Type a
separate line containing the end command to
terminate the commands.
To remove all commands from a breakpoint,
follow commands immediately by end.
NOTE. With no arguments, commands refers to the last breakpoint set,
not to the breakpoint most recently encountered.
8-11
8
gdb960 User's Manual
Breakpoint commands can re-start execution. The cont or step
commands begin execution again. However, any further commands in the
same command list are ignored. When execution halts again, gdb960
executes any command list associated with the breakpoint that causes the
halt.
If silent is the first command specified in a command list, the usual
message about halting at a breakpoint is not displayed. This may be
desirable for breakpoints that are to display a specific message and then
continue. If the remaining commands also display nothing, you see no
sign that the breakpoint was reached at all. The silent command is
meaningful only at the beginning of the command list for a breakpoint.
The following example displays the value of x at entry to foo when x is
positive; then continues execution:
break foo if x>0
commands
silent
print x
cont
end
# Don't print normal bp stuff.
# What is x's value?
# Resume program.
NOTE. The commands echo and output allow more precise display
control of output and are often useful in silent breakpoints.
The following example of a command list shows correction of one bug so
another can be pursued without reinvoking the program. The example
places a breakpoint just after an error in the code, gives the breakpoint a
condition to detect the error case, and adds a command list that assigns
8-12
8
Program Execution Control
correct values to variables that need them. The command list starts with
the silent command so no output is produced and ends with the cont
command so the program does not halt:
break 403
commands
silent
set x = y + 4
cont
end
Continuing
The continue command allows you to re-start a halted program.
continue cont
Continue running the program where
it halted.
If the program halted at a breakpoint, execution resumes at the address of
the breakpoint, but the breakpoint is not taken.
Stepping
Stepping means executing a line of code, or set of lines, according to
restrictions set by the step command. Control returns automatically to the
debugger after one line of code. Breakpoints are active during stepping,
and execution halts if a breakpoint is encountered on a machine
instruction. The step command may be given when control is within a
function that has no debugging information. Execution proceeds until
control reaches another function, or is about to return from this function.
The following is a list of stepping commands and their descriptions:
finish
Continue execution until after the selected stack
frame returns (or until there is some other reason
to halt, such as a fatal signal or a breakpoint).
Display the value returned by the selected stack
frame.
8-13
8
gdb960 User's Manual
next
Similar to step, but function calls in a line are
executed without halting or taking special actions
inside them. Execution halts when control
reaches a new line of code at the stack level that
was executing when the next command was
given or if another breakpoint is hit. next is
abbreviated as n. A count argument is a repeat
count, as in step.
nexti
nexti count
Execute one machine instruction, but if it is a
subroutine call, proceed until the subroutine
returns. A count argument is a repeat count, as
in step.
step
Execute one line of code then halt execution and
return control to the debugger. This command is
abbreviated as s.
step count
Execute count lines. If a breakpoint or a signal
not related to stepping is encountered before
count steps, execution halts.
stepi
stepi count
Execute one machine instruction, then halt and
return control to the debugger.
It is often useful to do display/i $ip when
stepping by machine instructions. This causes
the next instruction executed to display
automatically at each halt. For more information
on examining data, refer to Chapter 11. A count
argument is a repeat count, as in step.
until
The until command allows execution of all
iterations of a loop as a single step. The until
command with no arguments causes execution to
continue until the program reaches a source line
greater than the current source line.
The until command always halts the program if
it attempts to exit the current stack frame.
8-14
8
Program Execution Control
With no argument, until works like single
instruction stepping, and hence is slower than
until with an argument. The until command
accepts all the same arguments as the break
command.
until location
Continue running the program until either the
specified location is reached, or the current
(innermost) stack frame returns. location can
be any argument form acceptable to break. This
form of the until command uses breakpoints,
and hence is quicker than until without an
argument because it need not break on every
machine instruction.
A typical technique for using stepping is to put a breakpoint (see the
Breakpoints section) at the beginning of the function or program section
where a problem is believed to be, execute to the breakpoint, then step
through the suspect area, examining the interesting variables until the
problem occurs.
The cont command can be used after stepping to resume execution until
the next breakpoint or signal.
Continuing at a Different Address
Ordinarily, when you continue the program, you do so from the place it
stopped, with the cont command. You can instead continue from any
address you choose using the following commands:
jump linenum
Resume execution at line number linenum.
Execution may stop immediately if there is a
breakpoint there.
The jump command does not change the current
stack frame, the stack pointer, the contents of
any memory location, or any register other than
the instruction pointer. If line linenum is in a
8-15
8
gdb960 User's Manual
different function from the one currently
executing, the results may be unpredictable if the
two functions expect different patterns of
arguments or of local variables. For this reason,
the jump command requests confirmation if the
specified line is not in the function currently
executing. However, results are predictable
based on careful study of the machine-language
code of the program.
jump *address
Resume execution at the instruction at address
address. The asterisk allows the command line
parser to identify address as an address rather
than a number.
You can get much the same effect as the jump
command by storing a new value into the register
$ip. The difference is that the program does not
start running; only the address where it will run
when it is continued changes. For example:
set $ip = 0x485
causes the next cont command or stepping
command to execute at address 0x485, rather
than at the address where the program stopped.
The most common use of the jump command is
to back up, perhaps with more breakpoints set,
over a portion of a program that has already
executed.
8-16
8
Program Execution Control
gmu Commands
The gmu commands allow interactive control over the Guarded Memory
Unit (GMU). They apply to the Hx processor only.
gmu protect and gmu detect specify the type of GMU register to
control, either protection (protect) or detection (detect). Protection
GMU registers are identified by number, ranging from 0 to
NUMPREGS - 1. NUMPREGS is currently 2 on the Hx processors. Detection
GMU registers are identified by number, ranging from 0 to NUMDREGS - 1.
NUMDREGS is currently 6 on the Hx processors.
gdb960 records the gmu define commands in an internal data structure
called the command cache. If you later invoke the file command,
gdb960 reprograms the GMU using the commands in the command cache.
This allows the same GMU definitions to be used repeatedly while only
the file name changes. Since the gmu define commands accept
expressions, as well as addresses, you can protect a section of memory
without knowing its exact size. If the section’s size changes due to
recompilation, the GMU settings still work, regardless of the change.
gmu detect
gmu protect
Following is the gmu detect and gmu protect command syntax, a
description of the effects of the possible options, and examples of use.
Refer to Chapter 12 for further discussion of gmu syntax and arguments.
gmu detect |
Allows control over the Hx processor Guarded
protect
Memory Unit, and specifies the type of GMU
subcommand
register to control, either protection (protect)
or detection (detect). subcommand specifies the
action to perform on the register. Following are
the subcommand options for the gmu protect
and gmu detect commands.
define
Initialize and enable the specified register.
8-17
8
gdb960 User's Manual
disable
Disable the previously-defined register.
enable
Enable the previously-defined register.
You may also use the info gmu command to print a table of all current
GMU registers. Refer to Chapter 12 for more information on the info
command.
Syntax
gmu detect
define regnum access startaddress endaddress
Initializes and enables the specified GMU detection register.
regnum
Specifies a detection register number.
access
Specifies which types of memory access can
cause a GMU fault. The string has the form
modetype[,modetype]
where mode is either u or s, for user mode access
or supervisor mode access. type is a string of
one or more letters from Table 8-1.
An optional second modetype may be given to
program both user and supervisor modes in the
same command.
An example of a valid access argument is
urw,sx, which means fault on a user mode read
or user mode write or a supervisor mode
execute.
8-18
startaddress
Evaluates to the starting address of the desired
detection range.
endaddress
Evaluates to one byte beyond the ending address
of the desired detection range.
8
Program Execution Control
gmu detect disable [regnum]
Disables the specified GMU detection register. Clears the memory
detection enable bit for this register in the GMU control register. If
regnum is omitted, disable all GMU detection registers.
gmu detect enable [regnum]
Enables the specified GMU detection register. Sets the memory detection
enable bit for this register in the GMU control register. If regnum is
omitted, enable all GMU detection registers.
gmu protect define regnum access address mask
Initializes and enables the specified protection GMU register.
regnum
Specifies a protection register number.
access
Specifies which types of memory access can
cause a GMU fault. The string has the form
modetype[,modetype]
where mode is either u or s, for user mode access
or supervisor mode access. type is a string of
one or more letters from Table 8-1.
An optional second modetype may be given to
program both user and supervisor modes in the
same command.
An example of a valid access argument is
urw,sx, which means fault on a user mode read
or user mode write or a supervisor mode
execute.
address
Evaluates to the starting address of the desired
protection range.
mask
Evaluates to a number describing the addressing
constraints for this range. For more information,
refer to the i960 Hx Microprocessor User’s
Manual.
8-19
8
gdb960 User's Manual
Table 8-1
Access Types
Access Type
Access Type Symbolic Name
Read
r
Write
w
Execute
x
Data Cache Write
c
None (clears previous settings)
n
gmu protect disable [regnum]
Disables the specified GMU protection register. Specifies a GMU
protection register number. Clears the memory protection enable bit for
this register in the GMU control register. If regnum is omitted, disable all
GMU protection registers.
gmu protect enable [regnum]
Enables the specified GMU protection register. Set the memory protection
enable bit for this register in the GMU control register. If regnum is
omitted, enable all GMU protection registers.
Examples
(gdb960) gmu protect define 0 urwxc 0 0xfffc0000
This example establishes 256 KB of illegal access protection beginning at
address 0. Any user-mode access to this memory range triggers a fault.
All supervisor-mode access is allowed without generating a fault.
Protection register 0 is used.
(gdb960) gmu detect define 4 sw,uw 0xa0010000 0xa0020000
This example initializes detection register 4 as follows: 64 KB of illegal
access detection beginning at address 0xa0010000. Either a user-mode
write or a supervisor-mode write to this memory range triggers a fault.
8-20
Examining the Program Stack
9
The gdb960 debugger provides commands for examining the stack. It
allows you to see information about where the call was made and the local
variables of the called function. Each function call causes information to
be saved in a block of data called a stack frame. The stack frame also
contains the call’s arguments. All stack frames are allocated from a region
of memory called the call stack.
The gdb960 debugger selects one of the stack frames, and many gdb960
commands act on the selected frame. In particular, when you ask gdb960
for a variable's value, the value is sought in the selected frame.
Commands are provided in gdb960 to allow selection of any stack frame.
When execution halts, gdb960 automatically selects the currently
executing frame and describes it briefly. This chapter provides
information about manipulating stack frames, selecting frames, creating
traces, and extracting information from selected frames.
Stack Frames
The call stack is divided into contiguous pieces called stack frames, or
frames. Each frame contains the data associated with a call to a function.
A frame contains the function’s arguments, its local variables, and its
execution address.
When your program starts, the call stack contains a frame for all-purpose
execution. You might call this the start frame, which is how gdb960
prints it for backtrace. The function main is actually in the second-tothe-outermost frame. The starting frame is called the initial frame or the
outermost frame. Each time a function is called, a new frame is created.
Each time a function returns, its frame is eliminated from the call stack. If
9-1
9
gdb960 User's Manual
a function is recursive, there can be many frames for the same function.
The frame for the function where execution is actually occurring is called
the innermost frame. This is the most recently created of all the stack
frames that still exist.
Stack frames are identified by addresses. A stack frame consists of many
bytes, each of which has its own address; different hosts have different
conventions for choosing a byte whose address serves as the frame
address. On i960 processors, the address of the currently executing frame
is kept in the frame pointer register.
The gdb960 debugger assigns numbers to all existing stack frames,
starting with zero for the innermost frame, one for the frame that called it,
and so on. These numbers are record keeping devices for gdb960. They
do not really exist in your program; they provide a way of describing stack
frames in gdb960 commands.
When program execution halts, gdb960 automatically selects the
innermost stack frame. Many gdb960 commands refer implicitly to the
selected stack frame. You can select any frame using gdb960 command
frame. Once selected, gdb960 commands operate on the newly-selected
frame.
Backtraces
A backtrace is a summary list of stack frames in the order in which they
were called. The backtrace presents one line per frame, starting with the
currently executing frame (frame zero), followed by its caller (frame one),
and so on up the stack. The following is a list of commands for creating a
backtrace; accompanying each command is a description of its use:
backtrace
9-2
Display a backtrace of the entire stack: one line
per frame for all frames in the stack. You can
stop the backtrace at any time by typing the
system interrupt character, normally CTRL + C.
Examining the Program Stack
backtrace n
Display only the innermost n frames.
backtrace -n
Display only the outermost n frames.
9
The commands where and info stack are synonyms for backtrace.
Every line in the backtrace shows a frame number and function name. An
instruction pointer value is also shown – unless you use set print
address off.
If a function is in a source file whose symbol table data has been fully
read, the backtrace shows the source file name and line number, as well as
the function’s arguments. When the line number is shown, the instruction
pointer value for that line number is omitted if it is at the beginning of the
code.
Here is an example of a backtrace. It was made with the command bt 3,
so it shows the innermost three frames:
#0 rtx_equal_p (x=(rtx) 0x8e58c, y=(rtx) 0x1086c4) \
(/gp/rms/cc/rtlanal.c line 337)
#1 0x246b0 in expand_call (...) (...)
#2 0x21cfc in expand_expr (...) (...)
(More stack frames follow...)
The functions expand_call and expand_expr are in a file whose symbol
details have not been fully read. Full detail is available for the function
rtx_equal_p, which is in the file rtlanal.c. Its arguments, named x
and y, are shown with their typed values.
9-3
9
gdb960 User's Manual
Selecting a Frame
Most commands for examining the stack, and other data in a program,
work on the currently selected stack frame. The following commands
select a stack frame. Each finishes by displaying a brief description of the
stack frame just selected:
frame n
Select frame number n, where frame zero is the
innermost (currently executing) frame, frame one
is the frame that called the innermost one, and so
on. The highest-numbered frame is the start
frame. The second highest is the frame for main.
frame frame_addr
Select the frame at address frame_addr. If the
chaining of stack frames has been damaged by a
bug, it is impossible for gdb960 to properly
assign numbers to all frames. If the numbers are
unavailable, addresses are still available for
selecting frames.
up [ n ]
Select the frame n frames up from the previously
selected frame. For positive numbers n, this
advances toward the outermost frame, to higher
frame numbers. Default is one.
down [ n ]
Select the frame n frames down from the
previously selected frame. For positive numbers
n, this advances toward the innermost frame, to
lower frame numbers. Default is one.
Each of the above commands ends by displaying information about the
selected frame: the frame number, the function name and its arguments,
the source file and line number of execution in that frame, and the text of
that source line. For example:
#3
67
9-4
main (argc=3, argv=??, env=??) at main.c:67
read_input_file (argv[i]);
Examining the Program Stack
9
After one of the above listed commands produces a printout, entering the
list command without arguments displays ten source lines centered on
the point of execution in the selected frame.
up-silently n
down-silently n
These two commands are variants of up and
down, respectively. They differ in that they do
their work silently, without causing display of the
new frame. They are intended primarily for use
in gdb960 command scripts, where output might
be unnecessary and distracting.
Frame Information
The following commands display information about the selected stack
frame.
frame
With no argument, does not change which frame
is selected, but does display information about
the currently selected stack frame. The frame
command can be abbreviated to f. The frame
command can also be used as an argument to
info.
info frame
Display a verbose description of the selected
stack frame, including the frame’s address, the
address of the frame called by the selected
frame, the frame that called the selected frame,
the address of the selected frame’s arguments,
the instruction pointer saved in the selected
frame (the address of execution in the caller
frame), and which registers were saved in the
frame. The description is useful when some
problem has corrupted the stack format.
info frame frame_addr
Display a verbose description of the frame at
address frame_addr, without selecting that
frame. The selected frame remains unchanged.
9-5
9
9-6
gdb960 User's Manual
info args
Display the selected frame’s arguments, each on
a separate line.
info locals
Display the selected frame’s local variables, each
on a separate line. These are all variables
declared static or automatic within all program
blocks that are executed within this frame.
Examining Source Files
10
The gdb960 debugger knows from which source files your program was
compiled and can display parts of the source files’ text. When execution
halts, gdb960 displays the source line at which execution halted. When
you select a stack frame, gdb960 displays the source line on which
execution in that frame has halted.
This chapter describes commands and techniques that allow you to display
specified pieces of source files. The chapter contains information on
displaying specified source lines, identifying the directory in which source
files are found, and searching source files for particular lines.
Displaying Source Lines
To display lines from a source file, use the list command (abbreviated
as l). There are several ways to specify which part of the file you want to
display.
The following is a list of the most common uses of the list command.
Each command is followed by a description of its effect:
list linenum
Display listsize lines centered on linenum
from the current source file. The command set
listsize n changes the default of ten lines to n
lines.
list function
Display listsize lines centered around the
beginning of function.
10-1
10
gdb960 User's Manual
list
Display listsize more lines. If the last lines
displayed were displayed with a list command,
display listsize lines following the last lines
displayed; however, if the last line displayed was
a solitary line displayed as part of displaying a
stack frame, display listsize lines centered
around that line.
list -
Display the listsize lines preceding the last
lines displayed.
Repeating a list command with RET discards the argument, so it is
equivalent to entering list. However, the '-' argument is preserved in
repetition so that each repetition displays preceding lines in the file.
The list command expects a user supplied zero, one, or two linespecs.
The linespec arguments specify source lines; there are several ways of
writing the linespec argument but the effect is always to specify some
source line. The following is a list of list commands with possible
arguments and descriptions of their effects.
10-2
list linespec
Display listsize number of lines centered
around the line specified by linespec.
list first,last
Display lines from first to last. Both
arguments are linespecs.
list ,last
Display listsize lines, ending with last.
list first,
Display listsize lines, starting with first.
list +
Display the listsize lines following the last
lines displayed.
list -
Display the listsize lines preceding the lines
last displayed.
10
Examining Source Files
list
Display listsize lines. If the last lines
displayed were displayed with a list command,
the new lines follow them. If the last line
displayed was part of a stack frame display, the
new lines precede and follow it.
linespec Definition
The display command argument linespec can be composed of a single
argument or a combination of arguments. The following is a list of
possible linespec command arguments that modify the display of source
lines:
linenum
Specifies line linenum of the current source file.
The linenum argument is a linespec. When a
list command has two linespec arguments,
both refer to the same source file as the first
linespec.
+offset
Specifies the line offset lines after the last line
displayed. When used as the second linespec
in a list command, +offset specifies the line
offset lines after the first linespec.
-offset
Specifies the line offset lines before the last
line displayed.
filename:linenum
Specifies line linenum in the source file
filename.
function
Specifies the line of the first executable
statement that begins the body of the function
function.
10-3
10
gdb960 User's Manual
filename:function
Specifies the line of the first executable
statement in the function in filename. The
file name is needed with a function name only if
you have identically named functions in different
source files. Otherwise, the function argument
searches all specified source files for the first
match.
*address
Specifies the line containing the program’s
address, where address may be any expression.
The asterisk is necessary to allow the command
line parser to identify address as an address
rather than a number.
The info command maps source lines to program addresses. The
following is an example command line for the info command:
info line linenum
Displays the starting and ending addresses of the
compiled code for source line linenum.
The default examine address for the x command
is changed to the starting address of the line, so
that x/i is sufficient to begin examining the
machine code. Also, this address is saved as the
value of the convenience variable $_. For more
information on the x command and convenience
variables, refer to Chapter 11.
Searching Source Files
Two commands let you search the current source file for a regular
expression. The following list shows the forward and reverse
commands and describes their uses:
10-4
10
Examining Source Files
forward-search regexp
Checks each line, starting with the one
following the last line listed, for a match
for regexp. It lists the line that is found.
The command abbreviation for forward
is fo. The synonym search regexp is
also supported.
reverse-search regexp
Checks each line, starting with the one
before the last line listed and going
backward, for a match for regexp. It
lists the line that is found. The
command abbreviation for reverse is
rev.
Specifying Source Directories
Executable programs sometimes do not record the directories of the source
files from which they were compiled, just the source file names.
Additionally, directories can be moved between compilation and
debugging. The gdb960 debugger remembers a list of directories to search
for source files. That directory list is called the source path. Each time
gdb960 wants a source file, it tries all directories in the list, in the order
they appear, until it finds a file with the desired name. The source path is
not the same as the executable search path unless you have specified them
identically.
If gdb960 can't find a source file in the source path, and the object
program records the directory the program was compiled in, gdb960 tries
the recorded directory too. If the source path is empty, and there is no
record of the compilation directory, gdb960 looks in the current directory.
Whenever you reset or rearrange the source path, gdb960 clears out any
information it has cached about where source files are found, where each
line is in the file, and so forth.
10-5
10
gdb960 User's Manual
When you start gdb960, its source path is empty. The source path contains
only the special directories "$cdir" (stands for the compilation directory,
if available from the object file) and "$cwd" (stands for the current
working directory). To add other directories, use the directory
command.
directory dirname
Add directory dirname (abbreviated, dir) to the
front of the source path. Multiple directory
names may be given to this command, separated
by white space or a colon (:), or a semi colon (;)
on DOS.
directory
Reset the source path to empty. You are
prompted for confirmation.
show directories
Display the source path; show which directories
it contains.
Because the directory command, when used with arguments, adds to the
front of the source path, it can affect files that gdb960 has already found.
If the source path contains directories that you do not want, and those
directories contain misleading files with names matching your source files,
you can correct the situation using one of the following two methods:
1. using directory with no argument to reset the source path to empty.
2. using directory with suitable arguments to add any other directories
you want in the source path. You can add all the directories in one
command.
10-6
Displaying Program
Data and Symbols
11
This chapter contains information on examining data through expressions,
variables, and artificial arrays. This chapter also presents information
about accessing the value history, using convenience variables, and
accessing registers.
To help in presentation of data, gdb960 allows use of format options and
output format specifications. Use of the options and format specifications
is also presented and demonstrated in this chapter.
The usual way to examine data in your program is with the print
command (abbreviated p), or its synonym inspect. The print command
evaluates and displays the value of any valid C expression, exp. The
value of exp is displayed in a format appropriate to its data type. The
following example shows the syntax of the print command:
print exp
A lower-level way of examining data is with the x command. It examines
data in memory at a specified address and displays it in a specified format.
Expressions
Many different gdb960 commands accept an expression and evaluate its
value. Any valid C operator, constant, or variable is legal in a gdb960
expression, including conditional expressions, and casts. Symbols defined
by preprocessor #define commands do not evaluate.
11-1
11
gdb960 User's Manual
In addition to C language operators, the gdb960 debugger supports the
following three operators:
@
a binary operator for treating parts of memory as
arrays. For more information on treating
memory as arrays, refer to the Artificial Arrays
section in this chapter.
::
allows specification of a variable in terms of the
file or function in which the variable is defined.
{type} addr
Refers to an object of type type stored at
memory address addr, where addr may be any
expression whose value is an integer or pointer
(but parentheses are required around non-unary
operators, just as in a cast). The type construct
is allowed regardless of what kind of data resides
at addr.
Program Variables
The most common kind of expression used to examine data is a variable
name. A reference to a variable by an expression assumes the reference is
to an instance of the variable that is located in the selected stack frame; the
variable must either be global (static) or be visible according to C's scope
rules from the point of execution in that frame. For more information on
the selected stack frame, refer to Chapter 9.
11-2
Displaying Program Data and Symbols
11
In the following example function, the variable a is usable whenever the
program is executing within the function foo, but the variable b is visible
only while the program is executing inside the block where b is declared:
foo (a)
int a;
{
bar (a);
{
int b = test ();
bar (b);
}
}
As a special exception, you can refer to a variable or function whose scope
is a single source file even if the current execution point is not in the
currently selected file. If there are two or more static file-scope variables
with the same name in two or more different files, you can specify which
one you want in the following manner:
block::variable
In this example, block is the name of the source file in which the variable
you want resides.
Assignment to Variables
To alter a variable's value, evaluate an assignment expression. In the
following example, print stores the value 4 into the variable x, and then
displays the value of the assignment expression (which is 4):
print x=4
All C assignment operators are supported, including the increment
operators ++ and --, and combined assignments such as += and <<=.
If you are not interested in seeing the assignment's value, use the set
command instead of the print command. set does not display the
expression's value and does not put it in the value history. The expression
is evaluated only for side effects. For more information on the value
history and examining data, refer to Chapter 11.
11-3
11
gdb960 User's Manual
NOTE. If the beginning of a set command's argument string appears
identical to a set subcommand, you may need to use the set variable
command. This command is identical to set except for its lack of
subcommands.
Artificial Arrays
It is often useful to display several successive objects of the same type in
memory (e.g., a section of an array, or an array of dynamically determined
size for which only a pointer exists in the program).
To display successive objects, construct an artificial array by using the
binary operator @. The left operand of @ is the first element of the desired
array, as an individual object. The right operand is the number of objects
in the array. The result is an array value whose elements are all of the
type of the left argument. The first element is actually the left argument;
the second element comes from bytes of memory immediately following
those that hold the first element, and so on.
Given the following example source line, you might want to display the
contents of array:
int *array = (int *) malloc (len * sizeof (int));
To display the contents of array, enter the following line:
p *array@len
The left operand of @ must reside in memory. Array values made with @
in this way behave just like other arrays in terms of subscripting, and are
coerced to pointers when used in expressions.
11-4
Displaying Program Data and Symbols
11
Format Options
The gdb960 software debugger provides the following ways to control
array, structure, and symbol printing. Each of the set commands shown
has a corresponding show command that displays the current setting. For
commands where the on or off arguments are used as toggles, the default
is on when the argument is omitted.
set print address on
Display memory addresses showing the
location of stack traces, structure values,
pointer values, breakpoints, and so forth,
even when it also displays the contents
of those addresses.
set print address off
Do not display addresses when
displaying their contents. The following
is a backtrace command example:
(gdb960) set print address on
(gdb960) bt
#0 hithere (foo=0x55) at hi.c:11
#1 0xe00081b4 in main (argc=0x1, argv=0xe000e960)
at hello.c:43
#2 0xe00080d4 in start ()
(gdb960) set print addr off
(gdb960) set print address off
(gdb960) bt
#0 hiya (foo=0x55) at hi.c:11
#1 main (argc=0x1, argv=) at hello.c:43
#2 start ()
The set print address off command eliminates most machine
dependent displays from the gdb960 interface. For example, with print
address off, you should get the same text for backtraces on all
machines, whether or not they involve pointer arguments. This is
especially useful if you wish to compare the results of running the same
program on different hosts, using gdb960 in batch mode as an execution
vehicle.
11-5
11
gdb960 User's Manual
When gdb960 displays a symbolic address, it normally displays the closest
earlier symbol plus an offset. If that symbol does not uniquely identify the
address (for example, it is a name whose scope is a single source file), you
may need to disambiguate by entering the info line command, for
example info line *0x4537. As an alternative, you can set gdb960 to
display the source file and line number when it displays a symbolic
address. The following list provides examples of the set print command
and descriptions of the effect of each example:
11-6
set print
symbol-filename on
Display the source file name and line
number of a symbol in the symbolic
form of an address.
set print
symbol-filename off
Do not display the source file name and
line number of a symbol. Omission of
the on or off argument assumes off.
set print
symbolic-disassembly
(can be abbreviated set print
symbolic) When on, addresses in the
disassembly show the machine address
followed by <symbol+1234> where
symbol is the closest preceding function
name. Turning this off creates less
clutter in the display. The on setting is
the default.
set print max-symbolicoffset MAX-OFFSET
Display only the symbolic form of an
address if the offset between the closest
earlier symbol and the address is less
than MAX-OFFSET. The default is zero,
to always display the symbolic form of
an address, if any symbol precedes it.
set print autoderef
When on, always dereference char *
pointers (i.e., print the string that the
char * points to). When turned off,
char * is printed like a void * (i.e., just
print the hex address that the char *
points to). The on setting is the default.
Displaying Program Data and Symbols
set print array on
Pretty-print arrays. This format is more
convenient to read, but uses more space.
off is the default.
set print array off
Return to compressed format for arrays.
set print elements
number-of-elements
When displaying a large array, stop
displaying after printing the number of
elements set by the set print
elements command. The limit also
applies to display of strings. Setting the
number of elements to zero allows
unlimited displaying.
set print pretty on
Display structures in an indented format
with one member per line. The
following is an example of a pretty
printed structure:
11
$1 = {
next = 0x0,
flags = {
sweet = 1,
sour = 1
},
meat = 0x54 "Pork"
}
set print pretty off
off is the default format. Display
structures in a compact format, as in the
following example:
$1 = {next = 0x0, flags =
{sweet = 1, sour = 1}, meat =
0x54 "Pork"}
11-7
11
gdb960 User's Manual
set print repeats repeats
Set threshold for printing repeated
elements (e.g., printing an array that
contains repeats or more zeroes prints
a message ‘\000’ <repeats NN
times>, where NN is the number of
elements). The default for repeats
is 10.
set print sevenbit-strings Display using only seven-bit characters;
on
if this option is set, gdb960 displays any
eight-bit characters, in strings or
character values, using the notation
\NNN. For example, M-a is displayed as
octal \341.
set print sevenbit-strings Display using either seven-bit or eightoff
bit characters, as required. off is the
default.
set print union on
Display unions that are contained in
structures. on is the default.
set print union off
Do not display unions contained in
structures.
The following example demonstrates displaying structures containing
unions. The structures are declared, initialized, and displayed with union
both on and off:
typedef enum {Tree, Bug} Species;
typedef enum {Big_tree, Acorn, Seedling} Tree_forms;
typedef enum {Caterpillar, Cocoon, Butterfly} Bug_forms;
struct thing {
Species it;
union {
Tree_forms tree;
Bug_forms bug;
} form;
};
11-8
Displaying Program Data and Symbols
11
struct thing foo = {Tree, {Acorn}};
(gdb960)
(gdb960)
$2 = {it
(gdb960)
$2 = {it
set print union on
print foo
= Tree, form = {tree = Acorn, bug = Cocoon}}
set print union off
= Tree, form = {...}}
Output Formats
The gdb960 software debugger normally displays all values according to
their data types. Output formats allow you to view data as other types.
Possible types are:
• integer in hexidecimal
• integer in signed decimal
• integer in unsigned decimal
• integer in octal
• integer in binary
• integer as character constant
• address as hexadecimal
• floating point
To display a value already computed, start the arguments of the print
command with a slash and a format letter. The following is a list of the
supported format letters:
x
Regard the bits of the value as an integer, and display the integer
in hexadecimal.
d
Display as integer in signed decimal.
u
Display as integer in unsigned decimal.
o
Display as integer in octal.
t
Display as integer in binary. The letter t stands for "two".
11-9
11
gdb960 User's Manual
a
Display as an address, both absolute in hex and as an offset of
the nearest preceding symbol. This format can be used to
discover in which function an unknown address is located:
(gdb) p/a 0x54320
$3 = 0x54320 <_initialize_vx+396>
c
Regard as an integer and display as a character constant.
f
Regard the bits of the value as a floating point number and
display using floating point syntax.
The following example displays the instruction pointer in hexadecimal:
p/x $ip
No space is required before the slash because gdb960 command names
cannot contain a slash.
To redisplay the last value in the value history with a different format, you
can use the print command with a format and no expression. For
example, p/x redisplays the last printed value in hex.
Examining Memory
This section contains information about manipulating and examining
memory contents. The commands listed below provide access to the
memory. Each command is followed by a description of its use:
set caching
[ on | off ]
11-10
The gdb960 debugger normally caches
target memory reads and writes to
reduce serial-line traffic. In some cases,
this feature masks volatile memory
changes. To prevent gdb960 from
caching target memory, use set
caching off, which flushes the
memory cache prior to every target read
or write. By default, caching is enabled,
set caching on.
Displaying Program Data and Symbols
disassemble { function |
address } [ address ]
Provides a dump of a range of memory
as machine instructions. The range is
the inclusive area bounded by the two
machine addresses provided in the
address arguments. If only one
address argument is provided, gdb960
finds the first C function that starts at an
address less than or equal to the given
address; then it disassembles the entire
function. If only a function argument
is provided, then the function named in
function is disassembled in its entirety.
If the string in function is not a
function name, then its address is
calculated and acted on as though it
were an address argument.
x [ /NFU ] [ address ]
You can use the command x to examine
memory in any of several formats,
independent of your program's data
types.
11
N, F, and U are all optional parameters
that specify how much memory to
display and how to format it; address is
an expression giving the address where
you want to start displaying memory. If
you use defaults for NFU, you need not
type the slash (/). Several commands
set convenient defaults for address.
N is the repeat count. The repeat count
is a decimal integer; the default is 1. It
specifies how much memory (counting
by units U) to display.
11-11
11
gdb960 User's Manual
F is the display format. It is one of the
formats used by print, or s (nullterminated string) or i (machine
instruction). The default is x
(hexadecimal) initially, or the format
specified the last time you used either
the x command or print.
U is the unit size. The unit size is any of
the size specifiers described in the lists
on the following pages.
Each time you specify a unit size with x,
that size becomes the default unit the
next time you use x. For the s and i
formats, the unit size is ignored and is
normally not written.
Output format specifies how large a unit of memory to examine and how
to display the contents of that unit. Format specification consists of one or
two of the following letters:
The following letters specify the size of unit to examine:
b
Examine individual bytes.
h
Examine half words (two bytes each).
w
Examine words (four bytes each).
g
Examine giant words (eight bytes).
The following letters specify the display format:
11-12
x
Display as integers in unsigned hexadecimal.
d
Display as integers in signed decimal.
u
Display as integers in unsigned decimal.
t
Display as integers in binary. The letter t stands for "two".
o
Display as integers in unsigned octal.
Displaying Program Data and Symbols
a
11
Display as an address, both absolute in hex and then relative to a
symbol defined as an address below it. Note that p/a and x/a
are similar, but not exactly the same. The following example
shows p/a displaying the result of an expression as if it were an
address:
(gdb960) p/a main + 8
$9 = 0xe00080e8 <main+8>
The following example of the x/a command shows it displaying
the contents of the result of the expression as if it were an
address. There is an additional level of indirection here:
gdb960) x/a &main
0xe000880e0 <main>:
0x59084810
(gdb960) x/a 0xe000880e8
0xe000880e8 <main+8>:
0xe00080f0 <main+16>
c
Display as character constants.
f
Display as floating point. This works only with sizes w and g.
s
Display a null-terminated string of characters. The specified unit
size is ignored; instead, the unit is however many bytes it takes to
reach a null character, including the null character.
i
Display a machine instruction in assembler syntax. The
specified unit size is ignored; the number of bytes in an
instruction varies depending on the type of machine, the op code,
and the addressing modes used. The command disassemble is
an alternative for inspecting machine instructions.
If either the manner of displaying or the size of unit is unspecified, the
default is to use the last used specification. If you do not use any letters
after the slash, you can omit the slash as well.
If you omit the address to examine, the address following the last unit
examined is used. String and instruction formats actually compute a unitsize based on the data. It ensures that the next string or instruction
examined starts in the right place.
11-13
11
gdb960 User's Manual
When the print command shows a value that resides in memory, print
also sets the address for the x command. Similarly, the info line
command also sets the address for x to the start of the machine code for
the specified line, and info breakpoints sets the address for x to the
address of the last breakpoint listed.
When you use RET to repeat an x command, any previously specified
address is ignored, so the repeated command examines the successive
locations in memory rather than the same ones.
You can use one command to examine several consecutive memory units
by writing a repeat-count after the slash and before the format letters. The
repeat count must be a decimal integer. It has the same effect as repeating
the x command that many times, except that the output may be more
compact, with several units per line. The following example displays x
instructions, starting with the one to be executed next in the selected
frame:
x/10i $ip
After displaying a set of instructions, you could display the seven
following instructions by entering the following example, in which the
format and address are allowed to default to the last address accessed by
the previous x command:
x/7
The addresses and contents displayed by the x command are not put in the
value history because there are often so many of them that they get in the
way.
After an x command, the last address examined is available for use in
expressions in the convenience variable $_. The contents of that address,
as examined, are available in the convenience variable $__.
If the x command has a repeat count, the address and contents saved are
from the last memory unit displayed, which is not the same as the last
address displayed, if several units were displayed on the last line of output.
11-14
Displaying Program Data and Symbols
11
Storing to Memory
The gdb960 software debugger allows more implicit conversions in
assignments than C does; you can freely store an integer value into a
pointer variable or vice versa, and any structure can be converted to any
other structure that is the same length or shorter.
To store values into arbitrary places in memory, use the {...} construct
to generate a value of specified type at a specified address. For more
information on the {...} construct, refer to Chapter 11.
In the following example {int}0x83040 refers to memory location
0x83040 as an integer (which implies a certain size and representation in
memory), and set stores the value 4 into that memory location:
set {int}0x83040 = 4
Automatic Display
To frequently display the value of an expression to see how it changes,
add it to the automatic display list so that gdb960 displays its value each
time the program stops. Each expression added to the list is given an
identifying number. To remove an expression from the list, specify that
number in a disable display or delete display command. The
automatic display shows item numbers, expressions and their current
values:
2: foo = 38
3: bar[5] = (struct hack *) 0x3804
If the expression refers to local variables, then it does not make sense
outside the lexical context in which it was set up. Such an expression is
disabled when execution enters a context where one of its variables is not
defined.
For example, if you give the command display name while inside a
function containing a variable name, then this argument displays while the
program continues to stop inside that function. When it stops elsewhere -where there is no variable name -- display is disabled. The next time your
11-15
11
gdb960 User's Manual
program stops where name is meaningful, you can enable the display
expression once again by entering the enable display command. The
following is a list of display commands and their descriptions:
11-16
display exp
Add the expression exp to the list of
expressions to display each time the
program stops. For more detailed
information on expressions, refer to the
Expressions section in this chapter.
display/fmt exp
Add the expression exp to the autodisplay list and display it each time in
the specified format fmt. fmt specifies
only a display format and not a size or
count.
display/fmt addr
For fmt i or s, or when including a unitsize or a number of units, add the
expression, a memory address, to be
examined each time the program stops,
addr. Examining means, in effect,
entering x/fmt addr.
undisplay dnums
delete display dnums
Remove item numbers dnums from the
list of expressions to display.
disable display dnums
Disable the display of item numbers
dnums. A disabled display item is not
displayed automatically, but is not
forgotten. It may be enabled again later.
enable display dnums
Enable the display of item numbers
dnums. The items in dnums appear once
again in auto display until you specify
otherwise.
display
Display the current values of the
expressions on the list, just as occurs
when the program stops.
Displaying Program Data and Symbols
11
Display the list of expressions set up to
display automatically, each one with its
item number. Do not display the values
of the expressions. Include disabled
expressions and mark them as such in
the printout. Also include expressions
that refer to automatic variables.
info display
Examining the Symbol Table
The commands described in this section allow you to inquire about the
symbols (names of variables, functions and types) defined in your
program. This information is found by gdb960 in the symbol table loaded
by the symbol-file command. The information is inherent in the text of
your program and does not change as the program executes.
NOTE. print &symbol does not work at all for a register variable, and,
for a stack local variable, displays the exact address of the current
instantiation of the variable.
whatis exp
Display the data type of expression exp. The
argument exp is not actually evaluated, and any
side-effecting operations (such as assignments or
function calls) inside it do not take place.
whatis
Display the data type of $, the last value in the
value history.
ptype typename
Display a description of data type typename.
typename may be the name of a type, or for C
code, it may have the form struct struct-tag,
union union-tag or enum enum-tag.
11-17
11
gdb960 User's Manual
ptype exp
Display a description of the type of expression
exp. This is like whatis except it displays a
detailed description instead of just the name of
the type. The following example shows the
results of entering whatis and ptype if the type
of a variable is struct complex {double
real; double imag;}:
(gdb960) whatis foo
struct complex
(gdb960) ptype foo
struct complex {double real; double
imag;}
info address symbol Describe where the data for symbol is stored.
For a register variable, this says which register it
is kept in. For a non-register local variable, this
displays the stack-frame offset at which the
variable is always stored.
11-18
info functions
Display the names and data types of all defined
functions.
info functions
regexp
Display the names and data types of all defined
functions whose names match the regular
expression regexp. Thus, info fun step finds
all functions whose names include step;
info fun ^step finds those whose names start
with step.
info locals
Display the names and data types of local
variables from the current stack frame.
info sources
Display the names of all source files along with
debugging information.
info types
Print a brief description of all types in the
program. This includes typedefs, enums, structs
and unions explicitly declared or included.
Displaying Program Data and Symbols
info types regexp
Print a brief description of all types whose name
matches regular expression regexp.
info variables
Display the names and data types of all variables
declared outside of functions (i.e., all variables
except for local variables).
info variables
regexp
Display the names and data types of all variables
(except for local variables) whose names match
the regular expression regexp.
printsyms
filename
Write a complete dump of the debugger's symbol
data into the file filename.
11
Value History
Values displayed by print are saved in gdb960's value history so you can
refer to them in other expressions. Values are kept until the symbol table
is re-read or discarded. When the symbol table changes, the value history
is discarded because values may contain pointers back to the types defined
in the symbol table.
The values displayed are given history numbers for reference. The
reference numbers are successive integers starting with 1. The print
command displays the history number assigned to a value by displaying
$num= before the value, where num is the history number.
To refer to a value previously displayed, use $ and the value's history
number. The output displayed by print reminds you of that. The $
character, alone, refers to the most recent value in the history, and $$
refers to the value before that. $$n refers to the nth value from the end;
$$2 is the value just before $$, $$1 is equivalent to $$, and $$0 is
equivalent to $.
The following example displays the contents of a structure pointed to by a
pointer that was just displayed:
p *$
11-19
11
gdb960 User's Manual
If you have a chain of structures where the component next points to the
next one, you can display the contents of the next one with the following
example:
p *$.next
Repeat commands with RET.
The history records values, not expressions. In the following example, if
the value of x is 4, then the value recorded in the value history by the
print command remains 4 even though the value of x has changed:
print x
set x=5
The following is a list of show commands and descriptions of their effects:
show values
Display the last X values in the value history,
with their item numbers. This is like p$$9
repeated X number of times, except that show
values does not change the history.
show values n
Display X history values centered on history item
number n.
show values +
Display X history values just after the values last
printed.
Convenience Variables
You can use convenience variables within gdb960 to hold a value and
refer to it later. These variables exist entirely within gdb960 and are not
part of your program. Setting a convenience variable does not affect
further execution of your program, so you may use them freely.
Convenience variables have names starting with $. Any name starting
with $ can be used for a convenience variable, unless it is one of the
pre-defined register names. For more information on registers and register
names, refer to the Registers section in this chapter.
11-20
Displaying Program Data and Symbols
11
You can save a value in a convenience variable with an assignment
expression, just as you would set a variable in your program. The
following example saves the value contained in the object pointed to by
object_ptr in the $foo convenience variable:
set $foo = *object_ptr
Using a convenience variable the first time creates it; but its value is void
until you assign a new value. You can alter the value with another
assignment at any time because convenience variables have no fixed
types. You can assign a convenience variable any type of value, including
structures and arrays, even if that variable already has a value of a
different type. The convenience variable as an expression has its current
value's type. Use the show command to display a list of convenience
variables used:
show convenience
Display a list of convenience variables used so
far, and their values. show con is the
abbreviation.
One way to use a convenience variable is as a counter to be incremented
or as a pointer to be advanced. In the following example, $i is set at 0 and
used in the print command to control incrementing the bar[] array:
set $i = 0
print bar[$i++]->contents
...repeat that command by typing RET.
The following is a list of the convenience variables gdb960 automatically
creates:
$_
Automatically set by the x command to the last
address examined. Other commands that provide
a default address for x to examine also set $_ to
that address. The commands include info line
and info breakpoint.
$__
The variable $__ is automatically set by the x
command to the value found in the last address
examined.
11-21
11
gdb960 User's Manual
Registers
Machine register contents can be referred to in expressions as variables
with names starting with $. The info registers command lists the
names of all the registers.
The names $ip and $sp represent the instruction pointer register and the
stack pointer, respectively. The name $fp represents a register that
contains a pointer to the current stack frame.
The gdb960 debugger always views the contents of a register as an integer
when the register is examined in this way. Some machines have special
registers that can hold nothing but floating point values. There is no way
to refer to the contents of an ordinary register as a floating point value.
However, you can display the value in an ordinary register as a floating
point value by entering the print/f $regname command.
Some registers have distinct raw and virtual data formats. Register
contents are saved by the operating system in a different data format from
the one your program normally sees. For example, the registers of the
i960 KB floating point coprocessor are always saved in extended (raw)
format, but most C programs expect to work with double (virtual) format.
The gdb960 debugger normally works with the virtual format only (the
format that makes sense for your program), but the info registers
command displays the data in both formats.
Except for g0 through g15, register values are relative to the selected stack
frame. For more information on the stack frame, refer to Chapter 9.
The result is the value the register would contain if all stack frames nearer
to 0 were exited and their saved registers restored. To see the real
contents of all registers, you must select the innermost frame by entering
the command, frame 0.
The global registers g0 through g15 are never saved. For these registers,
relativization makes no difference.
11-22
Displaying Program Data and Symbols
11
The following is a list of commands that display register information:
regs
Display non-floating registers as two
columns of hexidecimal numbers.
Output is suitable for a 24x80 display.
info registers
Display the names and relativized values
of all non-floating-point registers.
info all-registers
Display the names and relativized values
of all registers, including floating-point
registers. For MON960, this is a
synonym for info registers when
the i960 processor architecture does not
contain floating-point registers (e.g., the
i960 CA processor family).
info registers regname
Display the relativized value of register
regname. The regname argument may
be any register name that is valid on the
machine you are using, with or without
the initial $.
Examples
The following example displays the instruction pointer in hexadecimal:
p/x $ip
The following example displays the instruction to be executed next:
x/i $ip
The following example adds four to the stack pointer:
set $sp -= 4
The set $sp -= 4 command also removes one word from the stack on
machines where stacks grow upward in memory. This assumes that the
innermost stack frame is selected. Setting $sp is not allowed when other
stack frames are selected. To pop entire frames off the stack, regardless of
machine architecture, enter the finish command.
11-23
11
gdb960 User's Manual
Profile Data File Manipulation
The profile command supports the two-pass compilation systems of the
i960 compiler. (See your compiler user’s guide for complete information
on two-pass compilation.) The gdb960 software debugger provides the
profile command to store and retrieve profiling counts, even if your
target does not support file I/O.
As you run an instrumented application, the instrumented code generates
information about the application and accumulates it in the application's
memory space. It is then necessary to save the information into a file on
the host system to make it available for the second compilation pass. This
file is known as a profile file. You can save this information yourself at
any time during the debugging session and then retrieve it at a later time.
If your target system does not have a file system, the debugger is the only
way to save this information in a file.
11-24
profile clear
Reset profile data area in target memory
to all zeroes.
profile get [ filename ]
Get profile data from filename and put
it into the profile data area in target
memory (default file name is
./default.pf).
profile put [ filename ]
Store profile data from the profile data
area in target memory into filename
(default file name is ./default.pf).
gdb960 Command and Option
Reference
12
This chapter contains two sections. The first is a list of possible command
line arguments that you can use when invoking gdb960. The second
section is a list of gdb960 commands and their options.
gdb960 Invocation Arguments
-b bps
Set the baud rate (bps), of the serial interface to
the i960 processor target system.
-batch
Run in batch mode.
-brk
Send a break (of about 1/4 second in duration)
through MON960 to the target system, after
opening the connection, but before trying to talk.
This allows you to connect to some running
systems.
-cd directory
Set gdb960's working directory to directory.
-command cmdfile
Run gdb960 commands from cmdfile.
-d directory
Add directory to the path to search for source
files.
-e file
Use file as the file to download and/or execute.
-G
Inform gdb960 that the target has big-endian
memory.
-nx
Suppress execution of commands in the
.gdbinit initialization file. For more
information on command files, refer to
Chapter 13.
12-1
12
12-2
gdb960 User's Manual
-par device
Use parallel download instead of serial
download. The parallel device (typically LPT1
or LPT2 in Windows) is used only for
downloading. Other host/target communications
use the serial port specified with -r.
-pc picoffset
Debug position-independent code. Download
code sections to link-time-address + picoffset
instead of the usual link-time-address.
-pci
Specify PCI communication. Refer to Chapter 2
for more information.
-pd pidoffset
Debug position-independent data. Download
data and bss sections to link-time-address +
pidoffset, instead of to link-time-address.
-px offset
Enter the same offset for both -pc and -pd.
-q
"Quiet." Do not display the introductory and
copyright messages.
-r port
Specify the serial port name of a serial interface
to be used to connect to the target system.
-readnow
Read each symbol file’s entire symbol table
immediately, rather than the default, which is to
read it incrementally as needed.
-s file
Read symbol table from file.
-se file
Read the symbol table from file and use it as
the executable.
-t target
Use target as the target monitor type.
MON960 is currently the only supported target
type.
gdb960 Command and Option Reference
-x file
12
Execute gdb960 commands from file. For
more information on setting up a batch mode
execution file, see Chapter 13. The -command
option is a synonym for -x.
gdb960 Commands
This section contains an alphabetic listing of the gdb960 commands. Each
command appears as a section header followed by a syntax description, a
description of the command's purpose, and the arguments you can use with
the command.
add-symbol-file
add-symbol-file filename [ address ]
Reads symbol table information.
filename
Read additional symbol table information from
filename.
address
The memory address at which the files’ .text
section has been loaded.
aplink enable
aplink enable bit value
Changes bits in the ApLink mode register.
aplink reset
aplink reset
Executes the ApLink reset command.
12-3
12
gdb960 User's Manual
aplink switch
aplink switch region mode
Changes ApLink modes. region is a hex constant; mode is a decimal
constant.
aplink wait
aplink wait
Executes the ApLink wait command.
awatch
awatch expr
Sets a memory access hardware watchpoint. Memory access watchpoints
halt program execution when any read or write is attempted at the address
of expr.
backtrace
backtrace [ n | -n ]
Displays a backtrace of the entire stack, one line per frame for all frames
in the stack. You can stop the backtrace at any time by typing the system
interrupt character, normally CTRL + C.
12-4
n
Display only the innermost n frames.
-n
Display only the outermost n frames.
gdb960 Command and Option Reference
12
break
break [ argument ] [ options ]
Sets a breakpoint.
*address
Set a breakpoint at address.
break filename:function
Set a breakpoint at entry to function in
filename.
filename:linenum
Set a breakpoint at line linenum in
source file filename.
function
Set a breakpoint at entry to function.
... if cond
Set a breakpoint with condition cond;
evaluate the expression cond each time
the breakpoint is reached, and halt only
if the value is non zero.
An ellipsis, "...", stands for one of the
possible arguments described above (or
no argument) specifying where to break.
linenum
Set a breakpoint at linenum in the
current source file (the source file
corresponding to the currently selected
frame).
[ + | - ]offset
Set a breakpoint offset number of lines
forward (+) or back (-) from the
execution point in the currently selected
frame.
12-5
12
gdb960 User's Manual
call
call function (args)
Calls a function in the program. The function function is called with
argument args, and the return value is printed and saved in the value
history, if it is not void.
cd
cd directory
Sets gdb960's working directory to directory.
clear
clear [ argument ]
Deletes any breakpoints at the next instruction to be executed in the
selected stack frame. When the innermost frame is selected, clear
deletes the breakpoint at which the program halted.
[ breakpoints ] bnums
Delete the breakpoints of the numbers
specified in bnums.
function filename:function
Delete any breakpoints set at the entry to
the function function.
linenum
Delete any breakpoints set at or within
the code
filename:linenum
of the specified line.
commands
commands bnum
Specifies a list of commands for breakpoint number bnum. The commands
appear one per line on separate lines following commands. Type a
separate line containing the end command to terminate the commands.
12-6
gdb960 Command and Option Reference
12
To remove all commands from a breakpoint, follow commands
immediately by end.
condition
condition bnum [ expression ]
Adds a condition to a breakpoint.
bnums
The breakpoint numbers of breakpoints to alter.
expression
The break condition for breakpoint number
bnum. The breakpoint(s) halts the program only
if the value of expression is true (non zero, in
C). If not specified, remove the condition from
breakpoint number bnums to make it an
unconditional breakpoint. For more information
on examining data, refer to Chapter 11.
continue
continue [ count ]
Continues executing the program, setting the ignore count of the
breakpoint that halted execution to count minus one. The program does
not halt at the breakpoint again until the breakpoint is encountered count
times.
If the program halts for any reason other than a breakpoint, the argument
to continue is ignored.
The synonym fg is provided for convenience, and has exactly the same
behavior as other forms of the command.
12-7
12
gdb960 User's Manual
define
define commandname
Defines a command.
commandname
Define a command named commandname. The
end of these commands is marked by a line
containing end.
delete
delete [ bnums ]
If no argument is specified, deletes all breakpoints. Otherwise, deletes the
breakpoints whose numbers appear in bnums.
delete display
delete display [ dnums ]
Removes item numbers dnums from the list of expressions to display. If
dnums is omitted, removes all items from the list of expressions to display.
directory
directory [ dirname ]
With no argument, resets the source path to empty. You are then
prompted for confirmation.
dirname
12-8
Add directory dirname to the front of the source
path.
gdb960 Command and Option Reference
12
disable
disable [ display ] | [ breakpoints ] [ bnums ]
Disables the breakpoints listed in bnums. Any number of breakpoints may
be listed by number. Separates each number from the next by a space.
The breakpoints keyword is not necessary unless differentiating
between disabling the display of breakpoints, display, and disabling
breakpoints. If no list of breakpoints is specified, all breakpoints are
disabled.
disassemble
disassemble { function | address } [ address ]
Provides a dump of a range of memory as machine instructions.
address
The range is the inclusive area bounded by the
two machine addresses provided in the address
arguments. If only one address argument is
provided, gdb960 finds the first C function that
starts at an address less than or equal to the given
address, then disassembles the entire function.
function
If only a function argument is provided, then
the function named in function is disassembled
in its entirety. If the string in function is not a
function name, then its address is calculated and
acted on as though it were an address
argument.
12-9
12
gdb960 User's Manual
display
display [ /format ]
[ exp | addr ]
Prints a list of expressions each time the program stops. Without
arguments, displays the current values of the expressions on the list, just as
when the program stops.
addr
For fmt i or s, or when including a unit-size or a
number of units, add addr to the auto-display
list.
exp
Add the expression exp to the auto-display list
and display it each time in the specified format.
/formatspec
The format in which memory contents are to
display.
document
document commandname
Documents a user-defined command.
commandname
Document the user-defined command
commandname. The document command reads
lines of documentation, ending with end. After
the document command is finished, help on
command commandname displays the
documentation you specify.
down
down [n]
Selects the frame n frames down from the previously selected frame. For
positive numbers n, this advances toward the innermost frame, to lower
frame numbers. Default is one.
12-10
gdb960 Command and Option Reference
12
down-silently
down-silently n
Same as down, except produces no output. This is useful in command
scripts.
echo
echo text
Displays text. C escape sequences may be used in text.
text
Display text. Non printing characters can be
included in text using C escape sequences, such
as \n to print a newline.
enable
enable [ display ] | [ once | delete | breakpoints ] [ bnums ]
Enables breakpoints.
bnums
Enable breakpoints specified in bnums. If bnums
is not specified, enable all defined breakpoints.
breakpoints
The breakpoints keyword is not necessary
unless differentiating between enabling the
display of breakpoints, display, and enabling
breakpoints. If no list of breakpoints is specified,
all breakpoints are enabled.
delete bnums
Enable the specified breakpoints temporarily.
Each is deleted the next time it halts your
program.
display
Enable display of breakpoint information.
once bnums
Enable the specified breakpoints temporarily.
Each is disabled the next time it halts your
program.
12-11
12
gdb960 User's Manual
exec-file
exec-file [ filename ]
Specifies the program to run. Omitting the argument specifies no
executable.
filename
Specify that the program to be run (but not the
symbol table) is found in filename. The
gdb960 debugger searches the environment
variable PATH, if necessary, to locate the
program.
file
file [ filename ][ -p{c|d|x} offset ]
Specifies the program to debug.
no arguments
Leaves both the executable file and symbol table
unspecified.
filename
The program to be debugged. It is read for its
symbols and pure memory contents, and it is
executed when you give the run command.
pc, pd, or px
Symbols are relocated by adding offset to their
values. These arguments act the same as their
command-line counterparts.
finish
finish
Continues execution until after the selected stack frame returns (or until
there is some other reason to halt, such as a fatal signal or a breakpoint).
Displays the value returned by the selected stack frame.
12-12
gdb960 Command and Option Reference
12
forward-search
forward-search regexp
Searches for a text match in each line.
regexp
Searches by line, starting with the one following
the last line listed, for a match for the regular
expression regexp.
frame
frame [ n | addr ]
When used with any of the arguments described with the break
command, selects a stack frame; with no argument, it does not change
which frame is selected, but still displays information about the currently
selected stack frame. The frame command can be used as an argument to
info.
n
Select frame number n, where frame zero is the
innermost (currently executing) frame.
frame_addr
Select the frame at address addr.
12-13
12
gdb960 User's Manual
gmu detect define
gmu detect
define regnum access startaddress endaddress
Controls the Guarded Memory Unit (GMU) detection registers. Detection
GMU registers are identified by number, ranging from 0 to
NUMDREGS - 1. NUMDREGS is currently 6 on the Hx processors.
regnum
Specifies the protection register number.
access
Specifies which types of memory access cause a
GMU fault. The string has the form
ModeType[,ModeType]
where Mode is either u (user mode access) or s
(supervisor mode access); Type is a string of one
or more letters from Table 12-1.
An optional second modetype may be given to
program both user mode and supervisor mode in
the same command.
An example of a valid access argument is
urw,sx, which means fault on a user mode read
or user mode write or a supervisor mode
execute.
startaddress
Evaluates to the starting address of the detection
range.
endaddress
Evaluates to one byte beyond the ending address
of the desired detection range.
gmu detect disable
gmu detect disable [regnum]
Disables the specified GMU detection register. Clears the memory
detection enable bit in the GMU control register. If regnum is omitted,
disables all GMU detection registers.
12-14
gdb960 Command and Option Reference
12
gmu detect enable
gmu detect enable [regnum]
Enables the specified GMU detection register. Sets the memory detection
enable bit for this register in the GMU control register. If regnum is
omitted, enables all GMU detection registers.
gmu protect define
gmu protect define regnum access address mask
Controls the Guarded Memory Unit (GMU) protection registers.
Protection GMU registers are identified by number, ranging from 0 to
NUMPREGS - 1. NUMPREGS is currently 2 on the Hx processors.
regnum
Specifies the protection register number.
access
Specifies which types of memory access cause a
GMU fault. The string has the form
ModeType[,ModeType] where Mode is either u
(user mode access) or s (supervisor mode
access); Type is a string of one or more letters
from Table 12-1.
An optional second modetype may be given to
program both user mode and supervisor mode in
the same command.
An example of a valid access argument is
urw,sx, which means fault on a user mode read
or user mode write or a supervisor mode
execute.
address
Evaluates to the starting address of the protection
range.
mask
Evaluates to a number describing the addressing
constraints for this range. For more information,
refer to the i960 Hx Microprocessor User’s
Manual.
12-15
12
Table 12-1
gdb960 User's Manual
Access Types
Access Type
Access Type Symbolic Name
Read
r
Write
w
Execute
x
Data Cache Write
c
None (clears previous settings)
n
gmu protect disable
gmu protect disable [regnum]
Disables the specified GMU protection register. Specifies a GMU
protection register number. Clears the memory protection enable bit for
this register in the GMU control register. If regnum is omitted, disables
all GMU protection registers.
gmu protect enable
gmu protect enable [regnum]
Enables the specified GMU protection register. Sets the memory
protection enable bit for this register in the GMU control register. If
regnum is omitted, enables all GMU protection registers.
12-16
gdb960 Command and Option Reference
12
hbreak
hbreak args
Sets a hardware breakpoint on a specified line or function. The arguments
list allows the same arguments as are listed in the break command, and
the breakpoint is set in the same way. Hardware breakpoints allow
breakpoints in non-writeable code; e.g., code that resides in ROM or
FLASH. Breakpoints set with the break command are silently ignored
when set in code that resides in non-writeable memory. You can set any
number of hardware breakpoints, but i960 processor architecture allows
only two to be enabled at any one time.
help
help [ option ]
Displays information about gdb960 commands.
option
With no arguments, help displays a short list of
command categories.
ignore
ignore bnum count
Sets the count of breakpoint number bnum to count. The next count
times the breakpoint is reached, your program’s execution does not halt;
other than to decrement the ignore count, gdb960 takes no action.
To make the breakpoint halt the next time it is reached, specify a count of
zero.
12-17
12
gdb960 User's Manual
info
info option [ option_modifier ]
Displays requested information.
address symbol
Describes where the data for symbol is
stored.
all-registers
Display the names and relativized values
of all registers, including floating-point
registers.
args
Display the selected frame’s arguments,
each on a separate line.
break [ bnum ]
The command info break displays a
list of all breakpoints set and not deleted,
showing their numbers, where in the
program they are, and any special
features related to them. bnum identifies
breakpoints about which information
should be displayed.
display
Display the list of expressions set up to
display automatically, each one with its
item number.
files
Display the current target, including the
names of the executable files currently
in use, and the files from which symbols
were loaded.
frame [ addr ]
Without the addr argument, display a
verbose description of the selected stack
frame.
With the addr argument, display a
verbose description of the frame at
address addr.
12-18
gdb960 Command and Option Reference
functions [ regexp ]
12
Without the regexp argument, display
the names and data types of all defined
functions.
With the regexp argument, display the
names and data types of all defined
functions whose names match the
regular expression regexp.
gmu
Display the current values of all
Guarded Memory Unit (GMU) registers
(Hx only).
line linenum
Display the starting and ending
addresses of the compiled code for
source line linenum.
program
Display the execution status of the
program.
locals
Display the selected frame’s local
variables, each on a separate line.
registers [ regname ]
Without the regname argument, display
the names and relativized values of all
non-floating-point registers.
With the regname argument, display the
relativized value of register regname.
set
Display all gdb960 settings.
sources
Display the names of all source files
with debugging information.
stack
Display a backtrace.
target
Display the execution status of the
program.
types [ regexp ]
Display either all types, or all those
matching the regular expression regexp.
12-19
12
gdb960 User's Manual
variables [ regexp ]
Without the regexp argument, display
the names and data types of all variables
declared outside of functions.
With the regexp argument, display the
names and data types of all variables
(except for local variables) whose names
match regular expression regexp.
This is a synonym for info break.
watch
jump
jump { linenum | *address }
Resumes execution at a new location.
linenum
Resume execution at line number linenum.
*address
Resume execution at the instruction at address
address. The asterisk is required so the
command line parser can identify address as a
location rather than a value. For more
information on halting the program, refer to
Chapter 8.
list
list [ listsize ] [n]
Without an argument, displays listsize more lines. If the last lines
displayed were displayed with a list command, displays listsize lines
following the last lines displayed; however, if the last line displayed was a
solitary line displayed as part of displaying a stack frame, displays
listsize lines centered around that line. The command set listsize n
changes the default of ten lines to n lines.
linenum
12-20
Display listsize lines centered on linenum
from the current source file.
gdb960 Command and Option Reference
-
Display the listsize lines preceding the last
lines displayed.
function
Display listsize lines centered around the
beginning of function.
first,last
Display lines from first to last. Both
arguments are linespecs.
,last
Display listsize lines, ending with last.
first,
Display listsize lines, starting with first.
+
Display the listsize lines following the last
lines displayed.
-
Display the listsize lines preceding the lines
last displayed.
12
lmadr
lmadr regno value
Sets the contents of the specified logical memory address register to the
designated value. Range of regno is 0-1.
This command is valid only for Jx/Hx/RP processors. Both command
arguments are assumed to be hex constants.
lmmr
lmmr regno value
Sets the contents of the specified logical memory mask register to the
designated value. Range of regno is 0-1.
This command is valid only for Jx/Hx/RP processors. Both command
arguments are assumed to be hex constants.
12-21
12
gdb960 User's Manual
load
load
[ filename ]
Downloads file.
filename
Download filename to the current target. If
you have already specified an exec-file with the
file or exec-file command, then leaving out
filename causes the current exec-file to be
downloaded.
make
make [ make-options ]
Runs a make tool in the shell, using the options in make-options as
arguments to the make command.
mcon
mcon region value
Sets the Memory Configuration register for region to the specified value.
Range of region is 0-0xf. This command is valid only for i960
Cx/Jx/Hx/RP processors. For the i960 Jx and RP processors, region is
automatically divided by two to map to the supported range of that
processor. Both command arguments are assumed to be hex constants.
next
next [count]
Similar to step, but steps over function calls. Execution halts when
control reaches a new line of code at the stack level that was executing
when the next command was given. next is abbreviated as n. A count
argument is a repeat count, as in step.
12-22
gdb960 Command and Option Reference
12
nexti
nexti [ count ]
Executes one machine instruction, but if it is a subroutine call, proceeds
until the subroutine returns.
count
A count argument is a repeat count, as in next.
output
output [ /fmt ] expression
expression
Display the value of expression and nothing
but that value: no newlines, no $nn =. The value
is not entered in the value history. For more
information on expressions, refer to Chapter 11.
/fmt expression
Display the value of expression in format fmt.
For more information on format specifications
(fmt), refer to Chapter 11.
path
path [ directory ]
Adds directory to the front of the current search path. If no directory
argument is specified, displays the current search path.
print
print /fmt expression
Displays the evaluated value of exp and add exp to the value history,
where exp is an expression.
/fmt expression
Display the value of expression in format fmt.
For more information on format specifications
(fmt), refer to Chapter 11.
12-23
12
gdb960 User's Manual
printf
printf string, expression...
Prints formatted data.
string, expression
Display the value of expression in the
format specified in string. Format
specifications are the same as for C
printf(). For more information on
expressions, refer to Chapter 11.
printsyms
printsyms filename
Writes a complete dump of the debugger's symbol data into the file
filename.
profile
profile { put | get | clear } [ filename ]
Manages profile data.
12-24
clear
Reset profile data area in target memory to all
zeroes.
get [ filename ]
Get profile data from filename and put it into
the profile data area in target memory (default
file name is ./default.pf).
put [ filename ]
Store profile data from the profile data area in
target memory into filename (default file name
is ./default.pf).
gdb960 Command and Option Reference
12
ptype
ptype [ typename | exp ]
Displays a description of a type.
typename
Display a description of data type typename.
typename can be the name of a type, or for C
code it can have the form struct struct-tag,
union union-tag or enum enum-tag.
exp
Display a description of the type of expression
exp. This is like whatis, except it displays a
detailed description instead of just the name of
the type.
pwd
pwd
Displays gdb960's working directory.
quit
quit [ -n ]
The optional -n option tells quit not to reset the target system.
rbreak
rbreak regexp
Sets a breakpoint on all functions matching regexp. This command sets
an unconditional breakpoint on all matches, displaying a list of all
breakpoints set. Once the breakpoints are set, they are treated just like the
breakpoints set with break. They can be deleted, disabled, made
conditional, and so forth, in the standard ways.
The gdb960 debugger converts the expression to an address.
12-25
12
gdb960 User's Manual
regs
regs
Displays non-floating registers as two columns of hexadecimal numbers.
Output is suitable for a 24x80 display. This command is an Intel
modification to GNU gdb.
reset
reset
Sends a break to the remote target board with MON960 attached through a
serial line; useful only if the target board has a circuit to perform a hard
reset, or some other action, when a break is detected.
reverse-search
reverse-search regexp
Searches backward for a text match on each line.
regexp
Check each line, starting with the one preceding
the last line listed, for a match for regexp. Lists
the line that is found. The command
abbreviation for reverse is rev.
run
run [arguments]
Before executing the run command, you must use the file command,
exec-file command, or an argument to gdb960 to specify the program.
The run command initiates execution at the location it has recorded as the
start of the program. Program arguments are specified in arguments.
12-26
gdb960 Command and Option Reference
12
search
search regexp
Searches forward for a text match on each line.
regexp
Check each line, starting with the one following
the last line listed, for a match for regexp. Lists
the line that is found.
select-frame
select-frame [ n | addr ]
When used with any of the arguments described with the break
command, selects a stack frame; with no argument, does not change which
frame is selected. The select-frame command does not display
information. The select-frame command can be used as an argument to
info.
n
Select frame number n, where frame zero is the
innermost (currently executing) frame.
addr
Select the frame at address addr.
set
set item [ setting ] [ filename ]
Changes the setting of a debugger attribute.
args
Specify the arguments to be used the
next time the program is run. If set
args has no arguments, it means use no
arguments the next time the program is
run.
autoreset [ on | off ]
When on, the default, quit resets the
target.
12-27
12
12-28
gdb960 User's Manual
caching [ on | off ]
Prevent gdb960 from caching target
memory if off is set. By default,
caching is enabled, set caching on.
complaints limit
Permit gdb960 to output limit
complaints about each type of unusual
symbol before becoming silent about the
problem. The default is zero, off. Set
limit to a large number -- five is
reasonable -- so complaints are not
suppressed.
confirm [ off | on ]
Disables or enables (the default)
cautious questions.
editing [ on | off ]
Enable or disable command line editing.
on is the default.
env var value
Set the environment variable var to
expression value.
height lpp
Set the number of horizontal output lines
on the screen.
history [ option ]
The set history options to control
history expansion are:
expansion on
Enable history expansion.
expansion off
Disable history expansion (default).
filename
Set the command history file to
filename.
gdb960 Command and Option Reference
history save [ on | off ]
Record the gdb960 command history in
a file. By default, filename is
./.gdb_history on UNIX, and
./hist.gdb on DOS. However, when
the GDBHISTFILE environment variable
is set, its value is used. You can also
specify a filename using the set
history filename command. By
default, set history save is off.
history size [size]
Set the number of commands that
gdb960 keeps in its history list. The
default is the value of the HISTSIZE
environment variable, or 256 if
HISTSIZE is not set.
input-radix base
Set the default base for numeric user
input. Supported choices for base are
decimal 8, 10, 16. base must be
specified either unambiguously or using
the current default radix.
listsize n
Set the number of lines to list to n.
output-radix base
Set the default base for numeric output.
Supported choices for base are decimal
8, 10, 16. base must be specified either
unambiguously or using the current
default radix.
print address [ on | off ]
Enable or disable display of memory
addresses showing the location of stack
traces, structure values, pointer values,
breakpoints, and so forth, even when it
also displays the contents of those
addresses. on is the default.
12
12-29
12
gdb960 User's Manual
print array [ on | off ]
Display pretty-print arrays. This format
is more convenient to read, but uses
more space. off is the default.
print autoderef [ on | off ] Print char * variables as strings. on is
the default.
print elements
NUMBER-OF-ELEMENTS
When displaying a large array, stop
displaying after printing the number of
elements set by the set print
elements command. The limit also
applies to display of strings. Setting the
number of elements to zero allows
unlimited displaying.
print hit-counts
[ on | off ]
Display the number of times a
breakpoint or watchpoint was
encountered in info break output. off
is the default.
print max-symbolic-offset Display only the symbolic form of an
max-offset
address if the offset between the closest
earlier symbol and the address is less
than max-offset. The default is zero,
to always display the symbolic form of
an address, if any symbol precedes it.
print null-stop
[ on | off ]
Stop printing of char arrays on the first
null character when on. The default is
off.
print pretty
Display structures in an indented format
with one member per line. off is the
default format.
[ on | off ]
12-30
gdb960 Command and Option Reference
print sevenbit-strings
[ on | off ]
12
Display using only seven-bit characters;
if this option is set, gdb960 displays any
eight-bit characters, in strings or
character values, using the notation
\NNN. For example, M-a is displayed as
octal \341. off is the default.
print symbolic-disassembly
Can be abbreviated set print
symbolic. When on, addresses in the
disassembly show the machine address
followed by <symbol+1234> where
symbol is the closest preceding function
name. Turning this off reduces clutter in
the display. The on setting is the
default.
print symbol-filename
[ on | off ]
Disable or enable displaying the source
file name and line number of a symbol
in the symbolic form of an address. off
is the default.
print union [ on | off ]
Display unions contained in structures.
on is the default.
prompt newprompt
Direct gdb960 to use newprompt as its
prompt string.
radix base
Set the default base for numeric input
and display. Supported choices for base
are decimal 8, 10, 16. base must be
specified either unambiguously or using
the current default radix.
variable var = expr
Set the variable var to expression expr.
The keyword variable is required
when var conflicts with a set print
keyword.
12-31
12
gdb960 User's Manual
verbose [ on | off ]
Enable gdb960's output of certain
informational messages. off is the
default.
width cpl
Contain the number of lines on the
screen, and cpl contains the number of
columns on the screen.
shell
shell [ command ]
Directs gdb960 to invoke an inferior shell and give you a shell prompt.
command
Directs gdb960 to invoke an inferior shell to
execute command. The environment variable
SHELL is used if it exists, otherwise gdb960 uses
/bin/sh on UNIX and command.com on DOS.
show
show [ settings ]
Displays the setting of a debugger attribute. Arguments for show are the
same as the arguments for set or set print. With no arguments, display
all current settings.
source
source file
Reads gdb960 commands from file.
12-32
gdb960 Command and Option Reference
12
step
step [ count ]
Executes one line of code, then halts execution and returns control to the
debugger. Steps into function calls. This command is abbreviated s.
count
Execute count lines. If a breakpoint or a signal
not related to stepping is encountered before
count steps, execution halts.
stepi
stepi [ count ]
Executes one machine instruction, then halts and returns control to the
debugger.
count
A count argument is a repeat count, as in step.
symbol-file
symbol-file [ filename ]
Reads symbol table information. The symbol-file command with no
argument clears out gdb960's information on your program’s symbol table.
The symbol-file command causes the gdb960 debugger to forget the
contents of its convenience variables, the value history, and all breakpoints
and auto-display expressions. This is because they may contain pointers to
the internal data recording symbols and data types, which are part of the
old symbol table data being discarded.
filename
Read symbol table information from file
filename. PATH is searched when necessary.
Use the file command to run both the symbol
table and the program from the same file.
12-33
12
gdb960 User's Manual
target
target type devicename [ hdil_arguments ]
[type] devicename
Connect to an i960 processor board
controlled by a type MON960. The
devicename is the name of the serial
device to use for the connection, (e.g.,
/dev/ttya). On Windows hosts, this is
the name of your serial port (e.g., COM1).
hdil_arguments
See the MON960 Debug Monitor User’s
Guide, for valid arguments to pass as
hdil_arguments.
tbreak
tbreak args
Sets a breakpoint enabled to cause only one halt. The arguments list, args
is the same as in the break command, and the breakpoint is set the same
way, but the breakpoint is automatically disabled the first time it is
encountered. For more information on disabling breakpoints, see the
disable command in this chapter.
thbreak
thbreak args
Sets a hardware-assisted breakpoint enabled to cause only one halt. The
arguments list args is the same as in the hbreak command, and the
breakpoint is set the same way. However, the breakpoint is automatically
disabled the first time it is encountered.
undisplay
undisplay dnums
Removes item numbers dnums from the list of expressions to display.
12-34
gdb960 Command and Option Reference
12
unset
unset env [ var ]
Unsets environment variable var. With no arguments, unsets all
environment variables.
until
until [ location ]
Allows executing all iterations of a loop as a single step; without
arguments, causes execution to continue until the program reaches a
source line greater than the current source line.
The until command always halts the program if it attempts to exit from
the current stack frame.
With no argument, until works like single instruction stepping, and
hence is slower than until with an argument. The until command
accepts the same arguments as the break command.
location
Continue running the program until either the
specified location is reached, or the current
(innermost) stack frame returns. location can
be any argument form acceptable to break (see
the set command in this chapter). This form of
the until command uses breakpoints, and hence
is quicker than until without an argument
because it need not break on every machine
instruction.
up
up n
Selects the frame n frames up from the previously selected frame. For
positive numbers n, this advances toward the outermost frame, to higher
frame numbers. Default is one.
12-35
12
gdb960 User's Manual
up-silently
up-silently n
Same as up, except produces no output. This is useful in command scripts.
watch
watch expr
Sets a watchpoint on expr. Execution stops whenever the value of expr
changes. If hardware-assisted watchpoints are available in the target
hardware, they are assigned to the watchpoint; otherwise a software
watchpoint is generated. Use awatch or wwatch for hardware-only
watchpoints.
whatis
whatis [ exp ]
Without an argument, displays the data type of $, the last value in the
value history.
exp
Briefly display the data type of expression exp
like ptype, but do not expand type descriptions.
The argument exp is not actually evaluated, and
any side-effecting operations (such as
assignments) inside it do not take place. For
more information on examining data, refer to
Chapter 11.
where
where
Synonym for backtrace.
12-36
gdb960 Command and Option Reference
12
wwatch
wwatch expr
Sets a memory write hardware watchpoint. Memory write watchpoints
halt program execution when a write is attempted at the address of expr.
x
x /formatspec address
Examines memory without reference to the program's data types. The
format must be explicitly specified.
address
The beginning location in memory where
examination is to begin.
/formatspec
The format in which memory contents are to be
displayed. For more information on formatting
output, refer to Chapter 11.
12-37
Storing Commands
13
The gdb960 debugger provides two ways to store sequences of commands
for execution: user-defined commands and command files. This chapter
lists commands for defining custom commands, a description of how to
create command files that can execute sequences of commands
automatically, and a list of commands for controlling output.
User-defined Commands
A user-defined command is a sequence of gdb960 commands that you
assign a name which can then be used to invoke the sequence. The
define command assigns the execution name to the sequence of
commands.
As with breakpoint command lists, a user-defined command is a list of
commands entered after the initial command is entered. Terminate the list
with the end command.
The following is an example of creating a user-defined command list
which, when invoked by entering the foo command, displays a name, a
number, and sets the $tmp convenience variable to the next structure. In
13-1
13
gdb960 User's Manual
this example, the convenience variable $tmp must be set to the first
structure before the foo command is invoked. Once defined, this
command allows examining each member of a list by repeatedly pressing
RETURN:
(gdb960) define foo
print $tmp->sptr->name.str
print $tmp->sptr->number
set $tmp = $tmp->next
end
(gdb960)
The following is a list of commands used to create and manipulate userdefined commands. Each command is followed by a description of its use:
define
commandname
Define a command named commandname. If
there is already a command by that name, you
must confirm that you want to redefine it.
The command definition is made up of other
gdb960 command lines that follow the define
command. The end of these commands is
marked by a line containing end.
document
commandname
Document the user-defined command
commandname. The command commandname
must already be defined. The document
command reads lines of documentation just as
define reads lines of the command definition,
ending with end. After the document command
is finished, help on command commandname
displays the documentation you have specified.
You must use the document command to change
a command's documentation. Redefining the
command with define does not change its
documentation.
13-2
Storing Commands
13
User-defined commands do not take arguments. When they are executed,
the commands of the definition do not display. An error in any command
stops execution of the user-defined command and displays an error.
Commands that ask for confirmation if used interactively proceed without
confirmation when part of a user-defined command. Many gdb960
commands that normally display messages omit the messages when used
in user-defined commands.
User-defined Command Hooks
You may define hooks, which are a special kind of user-defined
command. Whenever you run the command foo, if the user-defined
command hook-foo exists, it is executed before that command. Like
other user-defined commands, hooks cannot take arguments.
In addition, a pseudo-command, stop, exists. Defining hook-stop
makes the associated commands execute every time execution stops in
your program, before breakpoint commands are run, displays are printed,
or the stack frame is printed.
For example, suppose you want to execute a troublesome loop over and
over, but you do not wish to single-step through it. The following resets
the loop counter before continue, and examines the registers each time
execution stops:
(gdb960) define hook-continue
set var i = 12
end
(gdb960) define hook-stop
regs
end
(gdb960) continue
13-3
13
gdb960 User's Manual
You can define a hook for any single-word command in gdb960, but not
for command aliases; you should define a hook for the basic command
name (e.g., backtrace rather than bt). If an error occurs during the
execution of your hook, execution of gdb960 commands stops, and
gdb960 issues a prompt (before the command that you actually typed had
a chance to run).
To undefine a hook, redefine it with the word end only.
Command Files
A command file contains gdb960 command lines. Comments and lines
starting with # can also be included. An empty line in a command file
does nothing; it does not repeat the last command.
On invocation, gdb960 first executes commands from its init files.
These are files named .gdbinit on UNIX hosts and init.gdb on DOS
hosts. The gdb960 debugger reads any init file in your home directory,
then any init file in the current working directory. The init files
are not executed if the -nx invocation option is given.
You can also request the execution of a command file with the source
command, as shown in the following line:
(gdb960) source filename
Execute the command file filename.
Lines in a command file are executed sequentially. They do not display as
they are executed. An error in any command terminates execution of the
command file. Commands that normally ask for confirmation proceed
without confirmation when used in a command file. Many gdb960
commands that normally display messages omit the messages when used
in command files.
13-4
13
Storing Commands
Commands for Controlled Output
During execution of a command file or user-defined command, only
output explicitly displayed by the included commands appears. This
section describes three commands for generating output from a command
file or a user-defined command. The following is a list of commands and
their effects when included in a command list:
echo text
Display text. Non-printing characters can be
included in text using C escape sequences, such
as \n to print a newline. No newline will be
printed unless you specify one. In addition to the
standard C escape sequences, a backslash
followed by a space stands for a space. Unless
escaped, leading and trailing spaces are trimmed
from all arguments. Thus, to display
" and foo = ", use the command:
echo \ and foo = \ .
A backslash at the end of text continues the
command onto subsequent lines. For example:
echo This is some text\n\
which is continued\n\
onto several lines.\n
produces the same output as:
echo This is some text\n
echo which is continued\n
echo onto several lines.\n
13-5
13
gdb960 User's Manual
output expression
Display the value of expression and nothing
but that value: no newlines, and no $nn =. The
value is not entered in the value history. For
more information on expressions, refer to
Chapter 11. The following example compares
the printout of the print command to the
printout of the output command:
(gdb960) print/d foo
$15=42
(gdb960) output/d foo
42
(gdb960)
output/fmt
expression
Display the value of expression in format fmt.
For more information on expressions, refer to
Chapter 11.
printf string,
Display the values of the expressions under
the
control of string. The expressions are
separated by commas and may be either numbers
or pointers. Their values are displayed as
specified by string, exactly as if the program
were to execute the following C output function:
expressions
printf (string,expressions...);
For example, you can display two values in
hex by entering the following command:
printf "foo, bar-foo = 0x%x, 0x%x\n", foo, bar-foo
The only backslash-escape sequences allowed in
the format string are backslash-letter
combinations.
13-6
Using gdb960
Under GNU Emacs
A
Setting Up gdb960 in Emacs
If you have GNU Emacs version 19 or greater
1. Copy the file gud960.el from the source code tree
(BaseOfTree/src/gdb960/common/gud960.el) into your home
directory, or, if you already have a collection of .el files, into that
directory. Your system administrator can tell you where BaseOfTree
is.
2. Edit ~/.emacs and add the line:
(autoload ‘gdb960 “~/gud960.el” nil t)
Substitute the destination directory you used in step 1, if it is different
from your home directory.
3. Make sure gdb960 can be found on your PATH.
4. The next time you start Emacs, run the command gdb960. It asks for
a command line, in the same way that the Emacs command gdb does.
5. Enter the name of the i960 processor program you want to debug,
followed by any other arguments you wish to pass to gdb960.
If you have an earlier version of GNU Emacs
1. Copy the file gdb960.el from the GNU/960 source code tree
(BaseOfTree/src/gdb960/common/gdb960.el) into your home
directory, or, if you already have a collection of .el files, into that
directory. Your system administrator can tell you where BaseOfTree
is.
A-1
A
gdb960 User's Manual
2. Edit ~/.emacs and add the line:
(autoload ‘gdb960 “~/gdb960.el” nil t)
3.
4.
5.
6.
Substitute the destination directory you used in step 1, if it is different
from your home directory.
Make sure gdb960 can be found on your PATH.
The next time you start Emacs, run the command gdb960. It asks for
a symbol-file, in the same way that the Emacs command gdb does.
Enter the name of the i960 processor program you want to debug.
After you see the gdb960 prompt, use the gdb960 target command
to connect to your target.
Either version
When the target stops running for the first time, due to a breakpoint or
single-stepping, Emacs splits the current window vertically, showing you
the text of the current source file in the second window. This new buffer
is continually updated as you step through your source code.
A special interface allows you to use GNU Emacs to view and edit the
source files for the program you are debugging with gdb960. Using
gdb960 under Emacs is just like using gdb960 normally except in two
aspects:
1. All terminal input and output goes through the Emacs buffer. This
applies both to gdb960 commands and their output, and to the input
and output produced by the program you are debugging. This is
useful because it means you can copy the text of previous commands
and input them again; you can even use parts of the output that way.
All the facilities of Emacs' shell mode are available for interacting
with your program. In particular, you can send signals the usual
Emacs way: for example, C-c C-c for an interrupt, and C-c C-z for
a stop.
A-2
Using gdb960 Under GNU Emacs
A
2. gdb960 displays source code through Emacs.
Each time gdb960 displays a stack frame, Emacs automatically finds
the source file for that frame and puts an arrow (=>) at the left margin
of the current line. Emacs uses a separate buffer for source display
and splits the screen to show both your gdb960 session and the source.
Explicit gdb960 list or search commands still produce output as usual.
CAUTION. If the directory where your program resides is not your
current directory, it can be easy to confuse Emacs about the location of
the source files, in which case the auxiliary display buffer does not appear
to show your source. gdb960 can find programs by searching your
environment's PATH, so the gdb960 input and output session proceed
normally; but Emacs does not get enough information back from gdb960
to locate the source files in this situation. To avoid this problem, either
start gdb960 mode from the directory where your program resides, or
specify a full path name when prompted for the M-x gdb960 argument.
Confusion can also result if you use the gdb960 file command to switch
to debugging a program in some other location, from an existing gdb960
buffer in Emacs.
Using Emacs Commands with gdb960
By default, M-x gdb960 calls the program called gdb960. If you need to
call gdb960 by a different name (for example, if you keep several
configurations around, with different names) you can set the Emacs
variable gdb960-command-name. In the following example, the setq
command (preceded by ESC ESC, or typed in the *scratch* buffer, or in
your .emacs file) makes Emacs call the program named mygdb instead:
setq gdb960-command-name "mygdb"
A-3
A
gdb960 User's Manual
In the gdb960 I/O buffer, you can use these special Emacs (version 18 or
earlier) commands in addition to the standard Shell mode commands:
A-4
C-h m
Describe the features of Emacs' gdb960 Mode.
M-s
Execute to another source line, like the gdb960
step command; also update the display window
to show the current file and location.
M-n
Execute to next source line in this function,
skipping all function calls, like the gdb960 next
command. Then update the display window to
show the current file and location.
M-i
Execute one instruction, like the gdb960 stepi
command; update display window accordingly.
M-x gdb960-nexti
Execute to the next instruction, using the gdb960
nexti command; update display window
accordingly.
C-c C-f
Execute until you exit from the selected stack
frame, like the gdb960 finish command.
M-c
Continue executing your program, like the
gdb960 continue command.
M-u
Go up the number of frames indicated by the
numeric argument.
M-d
Go down the number of frames indicated by the
numeric argument, like the gdb960 down
command.
Using gdb960 Under GNU Emacs
C-x &
A
Read the number where the cursor is positioned,
and insert it at the end of the gdb960 I/O buffer.
For example, if you wish to disassemble code
around an address that was displayed earlier,
type disassemble; then move the cursor to the
address display and pick up the argument for
disassemble by typing C-x &.
You can customize this further by defining
elements of the gdb960 list print command;
once it is defined, you can format or otherwise
process numbers picked up by C-x & before
they are inserted. A numeric argument to C-x &
indicates both that you want special formatting,
and acts as an index to pick an element of the
list. If the list element is a string, the number to
be inserted is formatted using the Emacs function
format; otherwise, the number is passed as an
argument to the corresponding list element.
In any source file, the Emacs command C-x SPC (gdb960 break) tells
gdb960 to set a breakpoint on the source line point is on. If you
accidentally delete the source-display buffer, an easy way to get it back is
to type the command f in the gdb960 buffer, to request a frame display;
when you run under Emacs, this recreates the source buffer, if necessary,
to show you the context of the current frame.
The source files displayed in Emacs are in ordinary Emacs buffers that are
visiting the source files in the usual way. You can edit the files with these
buffers if you wish.
CAUTION. In Emacs v19 or later, most of the special commands shown
above have been replaced by commands preceded with the C-c
command prefix. Use C-h m to list the commands available in gdb960
mode.
A-5
Command Line Editing
B
Command line editing allows fast modification of command lines. You
can repeat often typed text, delete and replace text, record text to be
inserted later, splice commands together, and repair mis-typed commands.
This appendix describes the command line editing interface and provides
some examples of its use.
Introduction to Line Editing
In this appendix, the following notation is used to describe keystrokes.
The text CTRL + k is read as ‘Control k’ and describes the character
produced when the Control key is depressed and held while the k key is
pressed.
The text META + k is read as ‘Meta k’ and describes the character produced
when the META key (if you have one) is depressed, and the k key is
pressed. If you do not have a META key, identical effects can result from
holding down the ESC key while typing k. Either process is known as
metafying the k key.
The text META + CTRL + k is read as 'Meta Control k' and describes the
character produced by metafying CTRL + k.
B-1
B
gdb960 User's Manual
In addition, several keys have their own names. Specifically, DEL, ESC,
LFD, SPC, RET, and TAB all stand for themselves when seen in this text, or
in an init file. For more information on init files, refer to the Readline Init
File section of this appendix.
Readline Interaction
The Readline library provides a set of commands for manipulating the text
on the command line, allowing you to fix typos without retyping the line.
These editing commands allow positioning the cursor and deleting or
inserting text. When you are satisfied with a line, press RETURN. The
cursor does not have to be at the end of the line to press RETURN and have
the modifications accepted.
Readline Bare Essentials
To enter characters into the line, position the cursor and type. Characters
appear at the cursor position, and the cursor moves to the right. If you
mis-type a character, you can use DEL to back up, and delete the mis-typed
character.
Typing CTRL + b moves the cursor to the left, and CTRL + f moves the
cursor to the right.
When adding text in the middle of a line, notice that characters to the right
of the cursor move right to make room for the text you are inserting.
When deleting text to the left of the cursor, characters to the right of the
cursor move left to fill in the blank space created. The following is a list
of input line editing commands and descriptions of their effects:
B-2
CTRL + b
Move back one character.
CTRL + f
Move forward one character.
DEL
Delete the character to the left of the cursor.
CTRL + d
Delete the character underneath the cursor.
B
Command Line Editing
CTRL + _
Undo the last input line change made. You can
repeat the undo command until only an empty
line remains.
Readline Movement Commands
Commands in addition to CTRL + b, CTRL + f, CTRL + d, and DEL allow
rapid movement within a line. Here are some commands for moving more
rapidly about the line:
CTRL + a
Move to the start of the line.
CTRL + e
Move to the end of the line.
META + f
Move forward a word.
META + b
Move backward a word.
CTRL + l
Clear the screen, redisplaying the current line at
the top.
Notice how CTRL + f moves forward a character, while META + f moves
forward an entire word. It is a loose convention that control keystrokes
operate on characters while meta keystrokes operate on words.
Readline Killing Commands
Killing text means to delete the text from the line, but to save it away for
later use. If the description for a command says that it 'kills' text, then you
can retrieve the text later.
The following is a list of commands for killing text:
CTRL + k
Kill the text from the current cursor position to
the end of the line.
META + d
Kill from the cursor to the end of the current
word, or if between words, to the end of the next
word.
B-3
B
gdb960 User's Manual
META + DEL
Kill from the cursor to the start of the previous
word, or if between words, to the start of the
previous word.
CTRL + w
Kill from the cursor to the previous white space.
This is different than META + DEL because
CTRL + w kills to first white space, rather than to
first white space before a complete word.
Yanking text means retrieving the text from the kill buffer. If the
description for a command says that it yanks text, then the command
places previously-killed text at the cursor position.
The following commands yank the text back into the line:
CTRL + y
Yank the most recently killed text back into the
command line at the cursor location.
META + y
Rotate the kill-ring (the list of previously killed
text), and yank the new top. You can do this
only if the prior command is CTRL + y or
META + y.
When you use a kill command, the text is saved in a buffer called a killring. Any number of consecutive kills save all the killed text together in
one element of the kill-ring. When yanking, all text in one element of the
kill-ring is retrieved. Elements in the kill-ring separate from one another
only if kills are separated by other commands. The kill-ring is not
changed by creation of a new command line. Text killed on a previously
typed line is available to be yanked when you are typing another line.
B-4
Command Line Editing
B
Readline Arguments
You can pass numeric arguments to Readline commands. Sometimes,
numeric arguments determine the number of times a command is to repeat.
Sometimes the sign of the argument determines the action and the numeric
provides an offset. If you pass a negative argument to a command that
normally acts in a forward direction, that command acts in a backward
direction. For example, to kill text back to the start of the line, you might
type META + - CTRL + k.
Generally, pass numeric arguments to a command by typing META digits
before the command. If the first digit you type is a minus sign (-), then
the sign of the argument is negative. Once you have typed one meta digit
to get the argument started, type the remaining digits, and then the
command. For example, to give the CTRL + d command an argument of
10, type META + 1 0 CTRL + d.
Readline Init File
Although the Readline library comes with a set of Emacs-like key
bindings, it is possible to set up your own key bindings and change the
state of a few variables. You can customize programs that use Readline
by putting commands in an init file in your home directory. The name of
this file is .inputrc on UNIX hosts, and inputrc on Windows hosts.
gdb960 looks for this file at startup in the directory specified by the $HOME
environment variable. There is no default for $HOME. If $HOME is not set,
then no init file is used.
When a program that uses the Readline library starts up, the ~/.inputrc
file is read, and the key bindings are set.
B-5
B
gdb960 User's Manual
Readline Variables
There are four internal Readline variables. You can use them to change
the initial state of Readline editing. A list of the Readline init variables
and their descriptions follows:
editing-mode
Controls which editing mode you are
using. By default, GNU Readline starts
up in Emacs editing mode. Possible
settings are: emacs and vi.
horizontal-scroll-mode
Controls whether the text of the lines
you edit scroll horizontally on a single
screen line when they are larger than the
width of the screen, instead of wrapping
onto a new screen line. There are two
possible settings: on and off. off is the
default.
mark-modified-lines
Controls whether an asterisk appears at
the beginning of history lines that have
been modified. There are two possible
settings: on and off. off, no asterisk, is
the default.
prefer-visible-bell
[ on | off ]
If set to on, use the visible bell if one is
available rather than using the terminal
bell. There are two possible settings: on
and off. off is the default.
Although the Readline library comes with a set of Emacs-like key
bindings, it is possible to set up your own key bindings. You can
customize programs that use Readline by putting commands in an init file
in your home directory. The name of this file is ~/.inputrc.
The following two examples set editing-mode to vi and
horizontal-scroll mode to on, respectively:
set editing-mode vi
set horizontal-scroll-mode on
B-6
B
Command Line Editing
Readline Key Bindings
The syntax for controlling key bindings in the ~/.inputrc or
C:\inputrc requires that you know the name of the command you want
to change. The following pages provide tables containing command
names, their default key bindings, and a short description of what each
command does.
Once you know the name of the command, place the name of the key you
wish to bind the command to, a colon, and then the name of the command
on a line in the init file.
In the following example, CTRL + u is bound to the function
universal-argument, and CTRL + o is bound to the macro "&>output",
which inserts the string &>output into the line:
# This is a comment line.
Control-o:
">&output"
Control-u:
universal-argument
You need not spell out the key sequences. You can specify key sequences
in shorthand by enclosing the sequence in double quotes and using
Emacs-style escapes. In the following example, CTRL + u is bound to the
function universal-argument, CTRL + o is bound to the macro
">&output", which inserts the string &>output into the line, and CTRL + x
CTRL + r is bound to the function re-read-init-file:
# This
"\CTRL
"\CTRL
"\CTRL
is a comment line.
+ o":
">&output"
+ u":
universal-argument
+ x\CTRL + r":
re-read-init-file
Commands For Moving
The following is a list of the command names, their original bindings, and
short descriptions for cursor movement commands:
beginning-of-line
(CTRL + a)
Move to the start of the current line.
B-7
B
gdb960 User's Manual
end-of-line (CTRL + e)
Move to the end of the line.
forward-char (CTRL + f)
Move forward a character.
backward-char (CTRL + b)
Move back a character.
forward-word (META + f)
Move forward to the end of the next
word.
backward-word (META + b)
Move back to the first white space that
precedes the cursor position.
clear-screen (CTRL + l)
Clear the screen, leaving the current line
at the top of the screen.
Commands For Manipulating History
The following is a list of history manipulation command names, their
original bindings, and short descriptions:
accept-line
(Newline, Return)
Accept the line regardless of cursor
position. If this line is non-empty, add it
to the history list. If this line was a
history line, restore the history line to its
original state.
previous-history (CTRL + p) Move up through the history list.
B-8
next-history (CTRL + n)
Move down through the history list.
beginning-of-history
(META + <)
Move to the first line in the history.
end-of-history (META + >)
Move to the end of the input history
(i.e., the line you are entering).
reverse-search-history
(CTRL + r)
Search backward, starting at the current
line, and moving up through the history
as necessary. This is a character-bycharacter, incremental search.
B
Command Line Editing
forward-search-history
(CTRL + s)
Search forward, starting at the current
line, and moving down through the
history.
Commands For Changing Text
The following is a list of the command names, their original bindings, and
short descriptions for changing text on the command line:
delete-char (CTRL + d)
Delete the character under the cursor. If
the cursor is at the beginning of the line,
and there are no characters in the line,
and the last character typed was not
CTRL + d, then return EOF.
backward-delete-char
(Rubout)
Delete the character behind the cursor.
A numeric argument says to kill the
characters instead of deleting them.
quoted-insert (CTRL + q,
CTRL + v)
Add the next character that you type to
the line verbatim. Use this command to
insert characters like CTRL + q.
tab-insert (META + TAB)
Insert a tab character.
self-insert
(a,b,A,1,!,...)
Insert the character of the key that is
pressed.
transpose-chars (CTRL + t)
Drag the character before the cursor
forward. The cursor insertion point
moves forward as well. If the cursor is
at the end of the line, then transpose the
two characters preceding the cursor.
Negative arguments do not work.
transpose-words (META + t)
Drag the word behind the cursor past the
word in front of the cursor, moving the
cursor over that word as well.
B-9
B
gdb960 User's Manual
upcase-word (META + u)
Convert to uppercase the current (or
following) word. With a negative
argument, convert the previous word,
but do not move the cursor.
downcase-word (META + l)
Convert to lowercase the current (or
following) word. With a negative
argument, convert the previous word,
but do not move the cursor.
capitalize-word (META + c)
Convert to uppercase the current (or
following) word. With a negative
argument, convert the previous word,
but do not move the cursor.
Killing And Yanking
The following is a list of the command names, their original bindings, and
short descriptions for killing and yanking text on the command line:
B-10
kill-line (CTRL + k)
Kill the text from the current cursor
position to the end of the line.
backward-kill-line ()
Kill backward to the beginning of the
line. This is normally not bound to a key
sequence.
kill-word (META + d)
Kill from the cursor to the end of the
current word, or if between words, to the
end of the next word.
backward-kill-word
(META + DEL)
Kill the word behind the cursor.
unix-line-discard
(CTRL + u)
Remove the line input
(backward-kill-line). Save the
killed text on the kill-ring.
B
Command Line Editing
unix-word-rubout (CTRL + w) Remove a word from line input. Save
the text on the kill-ring. This is the same
as backward-kill-word.
yank (CTRL + y)
Yank the top of the kill-ring into the
buffer at the cursor.
yank-pop (META + y)
Rotate the kill-ring, and yank the new
top. You can only do this if the prior
command is yank or yank-pop.
Specifying Numeric Arguments
The following is a list of the command names, their original bindings, and
short descriptions for specifying numeric arguments on the command line:
digit-argument (META + 0,
Add this digit to the argument already
META + 1, ...META + -)
accumulating, or start a new argument.
META + - starts a negative argument.
universal-argument ()
Do what CTRL + u does in Emacs. By
default, this function is not bound to a
key sequence.
Letting Readline Type For You
The following is a list of the command names, their original bindings, and
short descriptions for automatic completions on the command line:
complete (TAB)
Attempt to do completion on the text
before the cursor. This is
implementation-defined. Generally, if
you are typing a filename argument, you
can do filename completion; if you are
typing a command, you can do
command completion; if you are typing
in a symbol to gdb960, you can do
B-11
B
gdb960 User's Manual
symbol name completion; if you are
typing in a variable to Bash, you can do
variable name completion.
possible-completions
(TAB TAB) (or META + ?)
List the possible completions of the text
before the cursor.
Some Miscellaneous Commands
The following is a list of the command names, their original bindings, and
short descriptions for miscellaneous actions on the command line:
abort (CTRL + g)
Stops execution and sounds the terminal
bell.
do-uppercase-version
(META + a, META + b)
Run the command that is bound to the
uppercase character.
prefix-meta (ESC)
Make the next character typed metafied.
This is for people without a meta key.
ESC-f is equivalent to META + f.
undo (CTRL + _)
Character by character, incremental
undo, separately remembered for each
line.
revert-line (META + r)
Undo all changes made to this line. This
is like typing the undo command enough
times to get back to blank line.
Readline vi Mode
While the Readline library does not have a full set of vi editing functions,
it does contain enough to allow simple editing of the command line.
To switch interactively between Emacs and vi editing modes, use the
command META + CTRL + j (toggle-editing-mode).
B-12
Command Line Editing
B
When you enter a line in vi mode, you are already in insertion mode, as if
you had typed an i after invoking vi. Pressing ESC switches to edit mode,
and allows you to edit text with the standard vi movement keys: For
example, you may move to previous history lines with k, follow lines with
j, and so forth.
B-13
GNU History Library
C
This appendix describes the history library, a programming tool that
provides a consistent user interface for recalling lines of previously typed
input.
Many programs read input from the user one line at a time. The GNU
history library keeps track of those lines, associates arbitrary data with
each line, and uses information from previous lines to make up new ones.
The programmer using the History library has functions available for
completing the following tasks:
• remembering lines on a history stack
• associating arbitrary data with a line
• removing lines from the stack
• searching through the stack for a line containing an arbitrary text
string
• referencing any line on the stack directly.
In addition, a history expansion function is available that provides a
consistent user interface across many different programs.
The end-user using programs written with the History library has the
benefit of a consistent user interface, with a set of well-known commands
for manipulating the text of previous lines and using that text in new
commands. The basic history manipulation commands are similar to the
history substitution used by csh.
C-1
C
gdb960 User's Manual
History Interaction
The History library provides a history expansion feature similar to the
history expansion in csh. The following text describes the available
syntax features.
History expansion takes place in two parts. First, determine which line
from the previous history should be used during substitution. Second,
select portions of that line for inclusion in the current line. The line
selected from the previous history is called the event, and the portions of
that line that are acted upon are called words. The line is broken into
words in Bash shell fashion. Words are delimited by white space, with the
exception of quoted strings. So, several words surrounded by quotes are
considered one word.
Event Designators
An event designator is a character or character sequence that refers to a
command line entry in the history list. The following is a list of event
designators and descriptions of their effects:
C-2
!
Start a history substitution, except when followed
by a space, tab, =, (, or end-of-line.
!!
Refer to the previous command. This is a
synonym for !-1.
!n
Refer to command line n.
!-n
Refer to the command line n lines back.
!string
Refer to the most recent command starting with
string.
!?string[?]
Refer to the most recent command containing
string.
C
GNU History Library
Word Designators
A colon (:) separates event specifications from the word designators. The
colon can be omitted if the word designator begins with ^, $, * or %.
Words are numbered from the beginning of the line, with the first word
being denoted by a 0 (zero).
0 (zero)
The zero'th word. This is usually the command
word.
n
The n'th word.
^
The first argument. That is, word 1.
$
The last argument.
%
The word matched by the most recent ?string?
search.
x-y
A range of words; -y is the abbreviation for 0-y.
*
All of the words, excepting the zero'th. This is a
synonym for 1-$. It is not an error to use * if
there is just one word in the event. The empty
string is returned in that case.
Modifiers
Modifiers allow modification of designator-created commands. After the
optional word designator, you can add a sequence of one or more of the
following modifiers, each preceded by a colon (:):
#
The entire current command line typed so far.
h
Remove a trailing pathname component, leaving
only the head.
r
Remove a trailing suffix of the form '.'suffix,
leaving the basename.
C-3
C
C-4
gdb960 User's Manual
e
Remove all but the suffix.
t
Remove all leading pathname components,
leaving the tail.
p
Display the new command but do not execute it.
This takes effect immediately, so it should be the
last specifier on the line.
Using gdb960 with ApLink
D
gdb960 supports ApLink, a software and hardware debug probe for the
i960 processors. Because ApLink includes the MON960 debug monitor
on board, it makes i960 processor software development as simple as selfhosted development on a PC or workstation. By using ApLink, you avoid
having to port software or design specialized hardware into the target
system to use the monitor.
ApLink Commands
These commands are useful primarily for ApLink, but can be used by all
Cx-, Jx- and Hx-based targets.
mcon region value
Set the Memory Configuration register
for region to the specified value.
Range of region is 0-0xf. This
command is valid only for Cx/Jx/Hx
processors. For the Jx processor,
region is automatically divided by two
to map to the supported range of that
processor. Both command arguments
are assumed to be hex constants.
lmadr regno value
Set the contents of the specified logical
memory address register to the
designated value. Range of regno is
0-1.
D-1
D
gdb960 User's Manual
This command is valid only for i960
Jx/Hx/RP processors. The debugger
assumes that both command arguments
are hex constants.
lmmr regno value
Set the contents of the specified logical
memory mask register to the designated
value. Range of regno is 0-1.
This command is valid only for i960
Jx/Hx/RP processors. The debugger
assumes that both command arguments
are hex constants.
NOTE. Improper use of the mcon, lmadr, or lmmr commands causes
MON960 to crash. See the next section for examples of using these
commands.
Using gdb960 With ApLink
The Cx, Jx, and Hx ApLink-compatible versions of MON960 are not
configured to enable the active memory regions on the target connected to
ApLink. Consequently, debugger access to target memory and/or
peripherals is, by default, impossible.
However, ApLink-aware debuggers, such as gdb960 R5.0 and later,
support several new commands to dynamically enable processor memory
regions following monitor boot.
D-2
Using gdb960 with ApLink
D
Cx Configuration
To configure memory regions for a Cx-based target, you need only to
modify the processor's memory region configuration registers. For more
information on those registers, refer to the description of the processor's
bus controller in Chapter 10 of the i960 Cx Microprocessor User's
Manual. The following example shows gdb960 syntax that enables
DRAM in memory regions C and D of an EP80960CX target connected to
ApLink.
c:\> gdb960 -r com1 -b 57600
(gdb960) mcon c 0x900003
/* d-cache on, 32-bit, little-endian, !ready set, burst set */
(gdb960) mcon d 0x900003
/* d-cache on, 32-bit, little-endian, !ready set, burst set */
Jx Configuration
Configuring memory regions for a Jx-based target is discussed in
Chapter 12 of the i960 Jx Microprocessor User's Manual.
When the Jx's DLMCON.dcen bit is not set, a region containing
noncacheable, memory-mapped peripheral(s) may be enabled by simply
using the previously described mcon commands to write an appropriate
bus width setting into the applicable PMCON register. When enabling
cacheable memory (i.e., DRAM), the processor's PMCON, LMADR, and
LMMR registers must all be configured.
The effective address range for a logical data template is defined using the
A31:12 field in the LMADRx register and the MA31:12 field in the LMMRx
register. For each data access, the upper 20 bits of the effective address
are compared against A31:12 of the LMADRx.
Only address bits for which the corresponding mask bit is set (in the
LMMRx register) are compared. Effective address bits with corresponding
mask bits cleared are automatically considered a match. Logically, the
operation is as follows:
(EFA[31:12] xnor LMADRx[A31:12]) or (not LMMRx[MA31:12])
where EFA[31:12] is the effective bus address. Only when all compared
address bits match are the LMADRx be used for the current bus access.
D-3
D
gdb960 User's Manual
The following example gdb960 commands enable 32-bit DRAM in
memory region A of an EP80960JX target connected to ApLink.
c:\> gdb960 -r com1
(gdb960) mcon a 0x800000
/* 32-bit bus width */
(gdb960) lmadr 0 0xa0000002
/* data caching configured for region A */
(gdb960) lmmr 0 0xf0000001
/* set mask register to appropriate value & enable
template */
gdb960 Scripts
gdb960 supports command scripts that automate enabling a target's
DRAM and/or peripheral memory regions prior to downloading and
debugging a program. The following example script and actual command
line syntax demonstrate how to use this facility. The script downloads and
executes a fictitious program called "hello". In this example, assume that
an EP80960CX target is physically connected to a CA ApLink and that the
EP80960CX has DRAM in region C.
Example Script
c:\> type gdb960.cmd
mcon c 0x900003
file hello
load hello
run
c:\> gdb960 -b 57600 -r com1 -parallel lpt1 command=gdb960.cmd
D-4
Index
- character, 1-7
example, 6-3
// character, 1-7
hardware, 8-3
hardware-assisted to halt, 12-34
register, 8-4
A
set count of number, 12-17
ApLink
set hardware, 12-17
commands, 12-3
set to cause halt, 12-34
Jx processor configuration, D-3
setting, 12-5, 12-25
arguments to your program, 7-2
GUI, UNIX, 4-13
arrays, artificial, 11-4
GUI, Windows, 3-16
assignment operators, 11-3
specify commands for, 12-6
automatic display, expression value, 11-15
B
states, 8-7
C
backslash-letter combinations, 13-6
backtrace, 9-2, 12-36
of a stack, 12-4
baud rate, specifying, 2-6
binary operator @, 11-4
break, 2-7
conditions, 8-9
send to target, 12-26
breakpoints, 8-1
add a condition to, 12-7
deleting, 8-6, 12-6, 12-8
disabling, 8-7, 12-9
enabling, 12-11
C boolean expressions, 8-9
C operators, 11-1
call stack, 9-1
character, 1-7
code, listing
GUI, UNIX, 4-9, 4-13
GUI, Windows, 3-10
command files, 13-4
command hooks, user-defined, 13-3
command line
completion, readline, B-11
editing, 5-8
invocation, 2-5
Index-1
gdb960 User's Manual
command line (continued)
startup options, 2-6
for moving on command line, B-7
text, changing, B-9
forward-search, search, 10-5
UNIX, B-1
frame, 9-4, 9-5
command window
GUI, Windows, 3-37
commands
Index-2
for GMU, 12-14
gdb960 command list, 12-3
gmu, display, 8-17
hbreak, breakpoint, 8-3
ApLink, 12-3
help, display, 5-6
awatch, watchpoint, 8-6
ignore count, breakpoint, 8-10
backtrace, display, 9-2
info address, display, 11-17
break, breakpoint, 8-2
info args, display, 9-6
cd, configuration, 7-2
info break, display, 8-4
clear, breakpoint, 8-7
info breakpoints, display, 11-14
command, breakpoint, 8-11
info line, display, 10-4, 11-14
condition, breakpoint, 8-9
info locals, display, 9-6
cont, execution, 8-12, 8-15
info registers, display, 11-22, 11-23
continue, execution, 8-10, 8-13
info stack, display, 9-3
#define, 11-1
info, display, 5-7, 11-18
define, 13-1
inspect, display, 11-1
defining, 12-8
jump, execution, 8-15
delete, breakpoint, 8-7
list, display, 9-5, 10-1
directory, configuration, 10-6
make, 5-11
disable, breakpoint, 8-8
miscellaneous, B-12
disassemble, display, 11-10
next, execution, 8-14
display name, display, 11-15
nexti, execution, 8-14
document, 13-2
output, display, 8-12, 13-6
down, selection, 9-4
path, configuration, 7-3
echo, display, 8-12, 13-5
print, display, 11-1, 11-9, 11-14
Emacs with gdb960, A-3
printf, display, 13-6
enable, breakpoint, 8-8
printsyms, display, 11-19
executed on breaking, 8-11
profile, 11-24
file-specifying, 5-5
ptype, display, 11-17
finish, execution, 8-13
pwd, display, 7-2
for controlled output, 13-5
quit, 5-14
Index
commands (continued)
show width, display, 5-12
rbreak, breakpoint, 8-4
show, display, 5-7, 12-8, 12-9
readline movement, B-3
silent, display, 8-12
readline, killing, B-3
step, execution, 8-12, 8-13, 8-14
regs, display, 11-23
stepi, execution, 8-14
reverse-search, search, 10-5
store for later retrieval, 5-9
run, execution, 7-1
target, example, 2-6
set args, configuration, 7-2
tbreak, breakpoint, 8-5
set caching, mode, 11-10
unset environment, configuration, 7-3
set complaints, configuration, 5-13
until, execution, 8-14
set confirm, configuration, 5-14
up, selection, 9-4
set editing, mode, 5-8
user-defined, 12-10, 13-1
set environment, configuration, 7-3
watch, watchpoint, 8-6
set height, configuration, 5-12
whatis, display, 11-17
set history, configuration, 5-9
where, display, 9-3
mode, 5-10
wwatch, watchpoint, 8-6
set listsize, configuration, 10-1
x, display, 11-1, 11-11, 11-14
set print, mode, 11-5
comment lines, 5-2
set prompt, display, 5-8
comments, 13-4
set radix, configuration, 5-12
compiler, g option, 2-3
set verbose, configuration, 5-13
complaints, 5-13
set width, configuration, 5-12
convenience variables, 11-20
shell, 5-11
conventions, notational, 1-6
show args, display, 7-2
conversions, type, 11-15
show complaints, display, 5-13
customer service, 1-8
show confirm, display, 5-14
show editing, display, 5-8
D
show environment, display, 7-3
show height, display, 5-12
show history, display, 5-10, 11-20
show radix, display, 5-12
show values, display, 11-20
show verbose, display, 5-13
data, examining, 11-1
data type, display, 11-17, 12-36
debugger
display attribute setting, 12-32
features of, 1-1
set attribute, 12-27
Index-3
gdb960 User's Manual
debugger (continued)
listing code, 3-10
symbol, 11-19
memory, viewing, 3-26
UNIX GUI, 4-1
opening a file, 3-9
back tracing, 4-17
overview, 3-4
connecting to target, 4-5
program navigation, 3-17
creating a new file, 4-18
register values, 3-25
customizing, 4-18
running a program, 3-17
debugging, 4-12
search path, 3-7
editing source code, 4-18
setting breakpoints, 3-16
exiting, 4-18
source code, viewing, 3-29
listing code, 4-9, 4-13
stack, viewing, 3-21
online help, 4-2
starting, 3-3
opening a file, 4-8
stepping through a program, 3-17
overview, 4-3
symbol values, 3-22
printing, 4-17
text editor, 3-32
program navigation, 4-14
variable values, 3-24
register values, 4-16
running, 4-2
Windows online help, 3-2
debugging
running a program, 4-14
GUI, UNIX, 4-12
search path, 4-11
GUI, Windows, 3-11
setting breakpoints, 4-13
optimized code, 2-3
stack, viewing, 4-16
directories
stepping through a program, 4-14
working directory, 4-4
Windows GUI, 3-1
changing, 12-6
DOS command line, 1-7
downloading
back tracing, 3-25
GUI, Windows, 3-15
command window, 3-37
connecting to target, 3-6
E
debugging, 3-11
downloading, 3-15
expression values, 3-22
files, editing, 3-32
editor, text
GUI, Windows, 3-32
Emacs
commands with gdb960, A-3
setting up gdb960, A-1
Index-4
Index
environment variables, 2-9
frame
unset, 12-35
information, 9-5
escape sequences, 13-6
initial, 9-1
event designators, C-2
innermost, 9-1
exclamation point(!)
outermost, 9-1
assign special meaning to, 5-10
pointer register, 9-2
execution, continuing, 8-13
select, 12-13
example, 6-3
exiting, debugger
GUI, UNIX, 4-18
selecting, 9-4, 12-10, 12-35
function calls, stepping over, 12-22
functions, calling, 12-6
expression, data type, 11-17
expression values, viewing
G
GUI, Windows, 3-22
expressions, 11-1
display, 13-6
display when program stops, 12-10
remove from display, 12-34
gdb960
command help, 12-17
command list, 12-3
compiling for, 2-1
configuring from the command line, 2-1
example session, 6-1
F
exiting, 5-14
files
expressions, 11-1
creating GUI, UNIX, 4-18
features, 1-1
downloading, 12-22
internal state, 5-7
editing, GUI, Windows, 3-31
invocation arguments, 12-1
.gdbinit, 13-4
invocation example, 6-2
init.gdb, 13-4
invoking, 2-9
opening
gdb960 (continued)
GUI, UNIX, 4-8
manipulating history, B-8
GUI, Windows, 3-8
quitting, 5-14, 12-25
font settings
GUI, Windows, 3-36
format, letters, 11-9
options, 11-5
read commands, 12-32
setting up in Emacs, A-1
working directory, 12-25
GNU history library, C-1
output, 11-9, 11-12
Index-5
gdb960 User's Manual
graphical user interface
using, 4-1
Guarded Memory Unit (GMU), 8-17
GUI, Windows, 3-1
back tracing, 3-25
command window, 3-37
commands, 12-14
connecting to a target, 3-6
syntax and arguments, 12-17
debugging, 3-11
GUI, UNIX, 4-1
downloading, 3-15
back tracing, 4-17
expression values, 3-22
connecting to a target, 4-5
files, editing, 3-32
creating a new file, 4-18
listing code, 3-10
customizing, 4-18
memory, viewing, 3-26
debugging, 4-12
opening a file, 3-9
editing source code, 4-18
overview, 3-4
exiting, 4-18
program navigation, 3-17
listing code, 4-9, 4-13
register values, 3-25
online help, 4-2
running a program, 3-17
opening a file, 4-8
search path, 3-7
overview, 4-3
setting breakpoints, 3-16
printing, 4-17
source code, viewing, 3-29
program navigation, 4-14
stack, viewing, 3-21
register values, 4-16
starting, 3-3
running, 4-2
stepping through a program, 3-17
running a program, 4-14
symbol values, 3-22
search path, 4-11
text editor, 3-32
setting breakpoints, 4-13
attributes, 3-36
stack, viewing, 4-16
customizing, 3-36
stepping through a program, 4-14
font settings, 3-37
working directory, 4-4
syntax coloring, 3-37
tab settings, 3-36
variable values, 3-24
GUI, Windows help, 3-2
Index-6
Index
H
M
HDIL arguments, 2-8
machine instruction, executing, 12-23
history
make tool, 12-22
command line substitution, 5-8
manuals, related, 1-7
event designators, C-2
memory
expansion, 5-10
controlling, 5-10
dump as machine instructions, 12-9
examining, 11-10, 12-37
library, GNU, C-1
examining consecutive units, 11-14
manipulating, B-8
modifying, 11-15
modifiers, C-3
viewing, GUI, Windows, 3-26
numbers, 11-19
messages, 5-13
word designators, C-3
modifying memory, 11-15
MON960
awatch command, 8-6
I-K
connecting to, 2-6
ignore count, 8-11
increment operators, 11-3
instruction pointer, 11-23
register, 11-22
killing and yanking, B-10
L
line wrapping, 5-12
lines, display, 12-20
linespec definition, 10-3
logical not operator, 5-10
loops, execute all iterations, 12-35
setting up, 2-2
specifying target type, 2-6
watch command, 8-6
wwatch command, 8-6
monitor software, 2-2
N-O
notational differences, UNIX vs. DOS, 1-7
numeric arguments, specifying, B-11
online help
accessing, 1-7
GUI, UNIX, 4-2
Index-7
gdb960 User's Manual
operators, 11-2
running, 12-26
assignment, 11-3
specify for debugging, 12-12
increment, 11-3
status information, 5-7
optimized code, debugging, 2-3
stop execution, 12-33
options
variables, 11-2
command line example, 2-5
file-specifying, 2-9, 5-5
working directory, 7-2
program navigation
format, 11-5
GUI, UNIX, 4-14
invocation, nx, 13-4
modes, 2-9, 2-11
GUI, Windows, 3-17
programs, running
startup, 2-6
GUI, UNIX, 4-14
output
GUI, Windows, 3-17
display, 12-23
prompt string, change, 5-8
format, 11-9
publications, related, 1-7
P
R
parallel port, specifying, 2-7
raw data formats, 11-22
path notation, 1-7
readline
printing, GUI, UNIX, 4-17
arguments, B-5
processor status, 11-22
automatic typing, B-11
profile data
command line completion, B-11
manage, 12-24
history facilities, 5-10
profiling, 11-24
init file, B-5
program
init syntax, B-6
arguments, 7-2
interaction, B-2
continue execution, 12-7, 12-12
interface, 5-8
continuing at a different address, 8-15
key bindings, B-7
execute at new location, 12-20
killing commands, B-3
execution, halting and continuing, 8-1
movement commands, B-3
loading example, 6-3
resuming execution, 8-15
register values, viewing
GUI, UNIX, 4-16
GUI, Windows, 3-25
Index-8
Index
registers, 11-22
source code
$fp, 11-22
example, 6-2
$ip, 11-22
editing, GUI, UNIX, 4-18
$ps, 11-22
$sp, 11-22
display non-floating, 12-26
viewing, GUI, Windows, 3-29
stack
frame, 8-13, 9-1, 10-1
information display, 11-22
instruction pointer, 11-22
selecting, 12-27
pointer, 11-22
viewing, GUI, UNIX, 4-16
GUI, Windows, 3-21
S
Starting gdb960, 2-4
screen size
setting, 5-11
search
command line interface, 2-5
UNIX GUI, 2-4
Windows GUI, 2-4
backward, 12-26
for text match, 12-27
search path
add directory to, 12-23
executable search, 10-5
GUI, UNIX, 4-11
GUI, Windows, 3-7
source, 10-5
serial port, specifying, 2-6
shell, invoke inferior, 12-32
source
displaying, example, 6-3
files, searching, 10-4
lines
displaying, 10-1
mapping to program addresses, 10-4
path, 10-5
reset, 12-8
startup options. See also options.
Stepping execution, 8-13
stepping through a program
GUI, UNIX, 4-14
GUI, Windows, 3-17
stty rows and stty cols settings, 5-11
support, customer, 1-8
symbol
file messages, 5-5
data, dump, 12-24
read, 12-33
table, 5-3, 11-19
examining, 11-17
information display, 12-3
symbol values, viewing
GUI, Windows, 3-22
symbols, defined by the preprocessor, 11-1
syntax coloring, GUI, Windows, 3-37
system interrupt character, 9-2
Index-9
gdb960 User's Manual
T
V
tab settings, GUI, Windows, 3-36
value history, 11-17
target
variable values, viewing
connect to, 12-34
connection
GUI, Windows, 3-24
variables
GUI, UNIX, 4-5
assignment to, 11-3
GUI, Windows, 3-6
convenience, 11-20
termcap database, 5-11
test, display, 12-11
environment, 2-9
program, 11-2
text, search for a match, 12-13
vi command line mode, B-12
text editor
virtual data formats, 11-22
GUI, Windows, 3-32
attributes, GUI, Windows, 3-36
W-Y
customizing, GUI, Windows, 3-36
tracing
GUI, UNIX, 4-17
GUI, Windows, 3-25
type
conversions, 11-15
display description, 12-25
watchpoints, 8-5
deleting, 8-6
hardware-assisted, 8-5
memory access, 12-4
memory write hardware, 12-37
setting, 12-36
Windows, gdb960 GUI, 2-4
working directory, GUI, UNIX, 4-4
U
yanking and killing, B-10
unit, size to examine, 11-12
UNIX
command line editing, B-1
gdb960 GUI, 2-4
command line, 1-7
Index-10