1
User Manual
NOTOCORD-hem Evolution® 4.2.0.297
© NOTOCORD Systems SAS
My NOTOCORD - User Manual - Printed on 28-Oct-11
NOTOCORD Systems
Table Of Contents
Table Of C ontents ...................................................................................................................................................... 1
User Manual .............................................................................................................................................................. 3
Overview & Key C oncepts .......................................................................................................................................... 3
NO TO CO RD-hem detailed features .......................................................................................................................................................................... 3
A cquisition .............................................................................................................................................................................................................. 3
Data analysis & review ........................................................................................................................................................................................... 3
Display .................................................................................................................................................................................................................... 3
Report ...................................................................................................................................................................................................................... 3
NO TO CO RD-hem structure & O perating mode ........................................................................................................................................................ 3
Components ............................................................................................................................................................................................................ 3
Environment ............................................................................................................................................................................................................ 4
Using NO TO CO RD-hem ............................................................................................................................................................................................ 4
Main steps for configuration and data analysis with NO TO CO RD-hem ............................................................................................................. 4
Setup ....................................................................................................................................................................... 6
System requirements .................................................................................................................................................................................................. 6
Disclaimer ............................................................................................................................................................................................................... 6
General considerations .......................................................................................................................................................................................... 6
PC configurations ................................................................................................................................................................................................... 6
Data A cquisition Hardware Supported .................................................................................................................................................................. 7
A ppendix ................................................................................................................................................................................................................. 7
Software Installation ................................................................................................................................................................................................... 9
Requirements .......................................................................................................................................................................................................... 9
Start the installation .............................................................................................................................................................................................. 9
Select your type of installation ........................................................................................................................................................................... 10
License Installation .................................................................................................................................................................................................. 16
General principles ................................................................................................................................................................................................ 16
Electronic license ................................................................................................................................................................................................ 16
Diskette license .................................................................................................................................................................................................. 19
Support Q uestions ............................................................................................................................................................................................... 21
Get Started ............................................................................................................................................................. 22
Configuring acquisition ............................................................................................................................................................................................. 22
Display and configuration windows ..................................................................................................................................................................... 22
Module configuration ............................................................................................................................................................................................ 22
Displaying signals .................................................................................................................................................................................................... 24
Starting the acquisition process ......................................................................................................................................................................... 24
Zoom and scaling options .................................................................................................................................................................................... 24
A dditional display options ................................................................................................................................................................................... 26
Using event markers ................................................................................................................................................................................................ 30
Basic principle ...................................................................................................................................................................................................... 30
Configuration ........................................................................................................................................................................................................ 30
Display .................................................................................................................................................................................................................. 30
Managing files ........................................................................................................................................................................................................... 32
Saving the current configuration ......................................................................................................................................................................... 32
Saving the data file under another name ............................................................................................................................................................ 32
Loading a configuration other than the current one ........................................................................................................................................... 32
O pening a data file ............................................................................................................................................................................................... 32
Creating a new data file ....................................................................................................................................................................................... 32
Saving the current configuration as a Memo ...................................................................................................................................................... 33
A nalyzing with Microsoft Excel® ............................................................................................................................................................................. 34
Extracting file data ............................................................................................................................................................................................... 34
Placing data in the spreadsheet .......................................................................................................................................................................... 35
A utomatically building graphs ............................................................................................................................................................................. 35
Displaying the analysis zone ............................................................................................................................................................................... 36
Advanced Tutorials .................................................................................................................................................. 37
Calibration ................................................................................................................................................................................................................. 37
ECG51a / Q RS10a tutorial ...................................................................................................................................................................................... 37
Introduction .......................................................................................................................................................................................................... 38
Modules configuration in NO TO CO RD-hem ...................................................................................................................................................... 39
Q RS trigger generation with Q RS10a module .................................................................................................................................................... 39
ECG51a module configuration ............................................................................................................................................................................ 40
ECG51a analysis ................................................................................................................................................................................................. 40
Improve your analysis ......................................................................................................................................................................................... 43
Excel®: Time-matched extraction wizard ............................................................................................................................................................... 47
O verview ............................................................................................................................................................................................................... 47
Exact matching mode .......................................................................................................................................................................................... 47
Time-matching window mode .............................................................................................................................................................................. 47
PV Loop ..................................................................................................................................................................................................................... 48
Introduction .......................................................................................................................................................................................................... 49
Volume signals connection to PV L10l module ................................................................................................................................................... 49
Baan’s equation application ................................................................................................................................................................................. 49
References ............................................................................................................................................................................................................ 51
Appendix ................................................................................................................................................................ 52
Error index ................................................................................................................................................................................................................. 52
BUX10a ................................................................................................................................................................................................................ 52
ECG31p ................................................................................................................................................................................................................ 52
ECG51a ................................................................................................................................................................................................................ 52
EEG10a ................................................................................................................................................................................................................ 53
License Management ........................................................................................................................................................................................... 53
MPI10a ................................................................................................................................................................................................................. 53
Table O f Contents>
Published on O ctober 27, 2011
1/60
My NOTOCORD - User Manual - Printed on 28-Oct-11
NOTOCORD Systems
PV L10l .................................................................................................................................................................................................................. 53
PV L10s ................................................................................................................................................................................................................. 54
Q RS10a ................................................................................................................................................................................................................ 54
TMS31a ................................................................................................................................................................................................................ 54
V IV 10a ................................................................................................................................................................................................................. 54
V ME10v ................................................................................................................................................................................................................ 55
V SH10a/b ............................................................................................................................................................................................................. 55
XYD30a ................................................................................................................................................................................................................ 55
Shortcuts in NO TO CO RD-hem ............................................................................................................................................................................... 56
Main window .......................................................................................................................................................................................................... 56
Configuration Setup window ................................................................................................................................................................................. 56
CTD60a/v ............................................................................................................................................................................................................. 56
ECG51a ................................................................................................................................................................................................................ 56
KBD30a ................................................................................................................................................................................................................ 57
V ME10e/v ............................................................................................................................................................................................................ 57
Old user manuals .................................................................................................................................................... 58
3.5 (2003) version ................................................................................................................................................................................................... 58
4.2 (2007) version ................................................................................................................................................................................................... 59
Table O f Contents>
Published on O ctober 27, 2011
2/60
My NOTOCORD - User Manual - Printed on 28-Oct-11
NOTOCORD Systems
Published on My NOTOCORD (http://my.notocord.com) on October 27, 2011
Home > User Manual
User Manual
Get started on NOTOCORD-hem main functionalities and modules with our user guides and tutorials.
Overview & Key Concepts
Table of Contents
1. NOTOCORD-hem detailed features
2. NOTOCORD-hem structure & Operating mode
3. Using NOTOCORD-hem
NOTOCORD-hem is recognized as the most advanced software able to acquire, analyze & visualize life sciences signals, and report quickly and efficiently into
Microsoft Excel®. Our validated solutions are fit for all Safety Pharmacology, Toxicology, R&D, Universities and Clinical research with proven analysis capabilities
for cardiovascular, pulmonary, electrophysiology (in vivo & in vitro) signals. NOTOCORD-hem offers a powerful software platform hosting over 120 modules and
applications ranging from acquisition to signal processing, analysis, and display.
Main Key Features
Acquisition and analysis with modular data flows
Over 1000 measurement channels
Simultaneous acquisition from different sources and systems
Interactive review while acquiring
Online analysis, display and data review
Interactive and advanced display capabilities
Data storage in one single file up to terrabytes
Unique streamlined reporting process into Microsoft Excel®
Designed to meet GLP & 21 CFR Part 11 rules
NOTOCORD-hem detailed features
Acquisition
Compatibility with main hardware on the market: Buxco, Corscience, Data Translation® PCI and USB A/D cards, DSI™, Hugo Sachs Electronics, Millar ®
Instruments, TMS International, WPI, devices
Fast set up for data capture and analysis
Flexible parameters adjustment
Easy insertion of comments and markers while recording
Generation of a single file including all data
Highly compressed data (e.g. 400 Mo for a typical 24h telemetry study with 6 dogs)
High capacity storage (100GB / file) with fast access to any period of the signal
Possibility to schedule acquisition time periods
Advanced time synchronization between different data acquisition systems (eg. DSI implants & video cameras without specific hardware links)
Data analysis & review
Online and offline analysis
Possible data review during acquisition without inducing interruptions
Post-acquisition file reviewable instantly
No time consuming replay needed for recorded signals review
Opening of large data files in a few seconds
Extensive library of analysis modules and signal processors
Possible implementation of external modules onto NOTOCORD-hem software platform
Processing and analysis of NOCOTORD-hem and Matlab ® data streams in both environments using unique library of functions
Display
Online display
Raw data and calculated trends easily accessible for display
Graphical superposition for data curves and tendencies comparison
Advanced display capabilities with continuous waveforms, trends and numbers
Channels overlay within same display for flexible visualization of waveforms
No limitations in the number of displays and up to 20 individual graphs on each display
Report
Exclusive reporting system based on Microsoft Excel®
Direct data transfer from file to final report
Excel template creation for time-saving reporting
Traceability of extracted data
NOTOCORD-hem structure & Operating mode
Components
The kernel (KRN) is the heart of the system. It contains all the functions used to control data acquisition, processing, analysis and display. It comes with 4
default modules:
NSR10a is an acquisition module that allows the simulation of a previously performed acquisition.
CTD60a is a continuous display module used to visualize signals.
CYC10a is a processing module provided to determine the cycle of a repetitive signal and calculate its characteristic points.
KBD30a is used to insert markers on key moments during a test.
The acquisition servers ensure compatibility between NOTOCORD-hem and acquisition hardware.
With more than 120 modules to choose from for acquisition, signal processing, analysis, display and other signal treatment, you can build your
User Manual>NO TO CO RD-hem detailed features
Published on O ctober 27, 2011
3/60
My NOTOCORD - User Manual - Printed on 28-Oct-11
NOTOCORD Systems
personalized analysis.
The Excel Wizard provides fast and efficient data extraction into Microsoft Excel®.
The highly secure and compliant applications Access Manager / Lab Manager (audit trail, user access management, etc.) allow you to be compliant with
Good Laboratory Practice requirements and 21 CFR Part 11.
Data storage/access system is managed by an independent system named FOG. Data files are identified by the .nss file extension.
Environment
NOTOCORD-hem is compatible with various acquisition devices. It interacts with hardware and acquisition cards to retrieve the information to analyze. Each
generated file contains data and the configuration. NOTOCORD-hem operates in the Microsoft environment, including Windows XP and Active Directory.
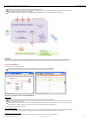
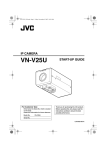
Using NOTOCORD-hem
The application consists of two main windows:
The configuration window showing the links between selected modules and the various parameters specified.
The main display window showing various data display and analysis tasks performed by display modules.
Main steps for configuration and data analysis with NOTOCORD-hem
Configuration
Acquisition server: Selecting channels of interest and assigning an acquisition frequency to each one of them.
Processing / analysis modules: Selecting processing / analysis module of interest, setting up parameters for each module and linking complementary
modules to create a coherent system.
Display windows: selecting information to be visualized, arranging displayed data (separate curves, overlapping curves, or numerical values), selecting
display mode (lines, crosses, histograms) and color for all curves, setting size and position of each display window.
The configuration may be set up after acquisition.
Acquiring experimental data
Acquisition can last from a few seconds to a few days. Asession may include several acquisition periods. Accessing data from a previous zone is possible at any
time without interrupting data acquisition and processing. Storage of acquired and calculated data is performed during the acquisition process.
Analyzing graphical and/or digital data
Data can be visualized with various display modules or specific analysis modules: Continuous, digital, 2-D and 3-D displays.
User Manual>Using NO TO CO RD-hem
Published on O ctober 27, 2011
4/60
My NOTOCORD - User Manual - Printed on 28-Oct-11
NOTOCORD Systems
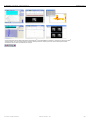
Our Excel wizard allows fast and efficient data extraction into Microsoft Excel®. During NOTOCORD-hem installation, a specific toolbar is added to your Excel®
application interface. This unique reporting system is designed to drastically reduce time needed to generate your report. Its flexibility and traceability
characteristics make it an efficient, powerful and time-saving tool.
User Manual>Using NO TO CO RD-hem
Published on O ctober 27, 2011
5/60
My NOTOCORD - User Manual - Printed on 28-Oct-11
NOTOCORD Systems
Setup
System requirements
Recommended PC configuration for using NOTOCORD-hem Evolution (version 4.x)
Table of Contents
1.
2.
3.
4.
5.
Disclaimer
General considerations
PC configurations
Data Acquisition Hardware Supported
Appendix
This document aims to provide a NOTOCORD-hem user with a list of characteristics and recommendations for the configuration of the computer on which the
software will be used. The user’s requirements will then guide the choice for a standard or an advanced configuration.
Video data acquisition requires a dedicated computer configuration, including more advanced hard disk and graphic card features. Recommendations will be
given in a dedicated paragraph.
Disclaimer
Due to constant technological progress, the information in this document cannot be considered as part of any agreement between NOTOCORD and users.
Information hereafter may be modified by NOTOCORD without notice.
As software errors may exist in drivers/firmware, as hardware manufacturers may change without notice some specifications of their products, it is almost
impossible for NOTOCORD to predict the final absolute performance for a complete system integrating a computer hardware and our software.
General considerations
The choice of a particular configuration is highly dependent on a user’s specific requirements. The following factors should thus be considered carefully in order
to choose the appropriate computer configuration:
Data types (video or physiological signals)
Signals properties (shape, amplitude ...) which can affect the calculation time of some modules, e.g. those requiring form identification such as ECG
analyzers
Total sampling rate of all outputs from modules present in the software configuration window
Number of display modules, graphs, displayed curves, ...
Number and complexity of analysis modules calculations and output connection status
Number of signal processing modules connected to active outputs
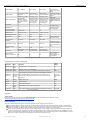
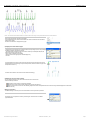
Afirst step for choosing a configuration would be to add up sampling rates for each acquisition or calculated channel. Some examples are given in Table 1 below.
Description
PC configuration
Acquisition of 8 x 1 kHz channel + 8 digital filters = 8k + 8k = 16kHz
Entry
Acquisition of 2 x 50 kHz channels + 1 low pass filter on 1 channel = 100k + 50k = 150kHz
Standard
Acquisition of 8 x 1000Hz ECG channels + 8 ECG-related analysis modules
Standard
Acquisition of 32 x 1000 Hz channels
Standard
Acquisition of 8 video channels
Advanced
Reviewing of video data with any other signals
Standard
Table 1: Examples of experimental setups and corresponding recommended PC configurations
PC configurations
We recommend that the user carries out performance test under conditions similar to those of the experiments.
Characteristics
Entry
Standard
Advanced
Computer grade
Entry level workstation
Entry-level
workstation or
Workstation
Entry-level
workstation or
Workstation
% CPU usage during
acquisition
≤ 50%
≤ 50%
≤ 50%
Values when running the
software extracted from
“Task Manager” program
% Memory usage
≤ 50% max available
≤ 50% max available
≤ 50% max available
Values when running the
software extracted from
“Task Manager” program
Number of processors
1
1
1
RAM
≥ 1024 Mb
≥ 2048 Mb
= 4096 Mb
When using external
modules (EXT
technology) 2GB is
recommended
PCI/PCI-Express/USB
Yes
Yes
Yes
See Data Acquisition
Hardware Supported
below
Hard Disk controller
≥ SATA-II with RAID matrix ≥ SATA-II with RAID
0
matrix 0
Disk capacity
≥ 200 GB, ≥ 7200 rpm
≥ 200 GB, ≥ 10000
Secondary local storage
≥ 300 GB, ≥ 7200 rpm rpm with a secondary recommended for large
storage with ≥ 400 GB files handling
Floppy disk
See comment
See comment
Setup>System requirements
Comments
≥ SATA-II with RAID
matrix 0 or SAS
See comment
Only for legacy
install/uninstall using
floppy disk protection
(before July 2008)
Published on O ctober 27, 2011
6/60
My NOTOCORD - User Manual - Printed on 28-Oct-11
NOTOCORD Systems
Yes, ≥ 1Gbits/s
For GLP/21 CFR part 11
environment and ≥
1Gbits/s for high volume
transfer
External to CPU Chipset. External to CPU
PCI Express
Chipset. PCI Express
External to CPU
Chipset. PCI Express
Multi monitors function is
useful for great number of
channels
Graphic dedicated RAM
PCI Express, ≥ 256 MB
dedicated RAM, ≥
1280x1024 resolution
per screen, 32 bits color
coding, 96 dpi font size
display
PCI Express, ≥ 256
MB dedicated RAM, ≥
1280x1024 resolution
per screen, 32 bits
color coding, 96 dpi
font size display
PCI Express, ≥ 256
MB dedicated RAM, ≥
1280x1024 resolution
per screen, 32 bits
color coding, 96 dpi
font size display
DO NOT USE
INTEGRATED GRAPHIC
CONTROLER WITH CPU
CHIPSET (see Appendix
note)
Multi monitors
≥1
≥2
≥2
CD-ROM reader
1
1
1
Uninterruptible power
supply/Surge protection
Recommended
Yes
Yes
Operating system
XP Professional SP3
XP Professional SP3
XP Professional SP3
Microsoft .NET Framework
≥ v2.0
≥ v2.0
≥ v2.0
Disk file system
NTFS
NTFS
NTFS
User privileges for
installation
Administrator
Administrator
Administrator
User privilege for running
Simple user
Simple user
Simple user
Free space for temp
storage
≥ 2 GB
≥ 2 GB
≥ 2 GB
Spreadsheet
Microsoft EXCEL™ 2003, Microsoft EXCEL™
XP and 2007
2003, XP and 2007
Microsoft EXCEL™
2003, XP and 2007
Antivirus and other
background applications
No
No
Network interface
Yes, ≥ 100Mbits/s
Graphic interface
Yes, ≥ 1Gbits/s
No
For software release
installation, Networked
drive is compatible
For access rights, file
permissions, security
In a GLP environment,
usage can be restricted to
only an authorized user or
group
Can trouble access to
files during data
processing (acquisition
or recalculation)
Table 2: Recommended PC configuration
Data Acquisition Hardware Supported
Description
Type of
interface
DataTranslation DT301
DT302
16 analog channels 12 bits 150 kHz max
PCI
DataTranslation DT3010
32 analog channels 12 bits 1.25 MHz max.
PCI
DataTranslation DT980x
16 channels, 12 to 16 bits, 100 kHz, 500V isolation between PC and device
USB 1.1
Manufacturer
Model
Digital Interface from DSI’s telemetry hardware to NOTOCORD-hem software.
DataSciences
International
Dataquest
Note : PCI-Express interface card designed since summer 2008 is highly
OpenARTtm recommended by DSI. Legacy PCI card may have some trouble with recent
2.3 or 3.11 motherboard.
See DSI for
recommended
card
OHAUS
AR5120
OHAUS balance server
RS232
VSH10a/b
DS-40xx
4/8 video channels
PCI
Instrunet
I200
Instrunet acquisition server
PCI
TMS
PORTI 7
REFA8
Up to 40 channels, 22 bits, 2000 Hz sampling rate
USB
CorSciences
BT3/6
Up to 3 leads, 500 Hz per channel, 18 bits, 500 Hz sampling rate, DC coupling
Bluetooth®
Table 3: Supported hardware
Appendix
Graphic controller
Graphic Controllers integrated in the CPU Chipset MUST NOT BE USED (as 815E, 845GL, 865G, 915G, 915GV, 910GL, 945G, etc.
http://download.intel.com/products/graphics/intel_graphics_guide.pdf).
Estimated data file size
Files size is mainly determined by the number of continuous signal channels (red outputs) and their sampling rate.
Sum of sampling rate for each data flow. For example: 8 x 1000 Hz channels, 8 filter modules will produce about 8x1000 + 8x1000 = 16000 Samples/s.
An approximate coefficient of 1.6 bytes can be applied. To know the number of bytes per second, the former value must be multiplied by 1.6. For example:
16.000 * 1.6 = 25.6 KB/s i.e.92 MB/hour. Value 1.6 depends on signals form (compression algorithm). 1.6 is an average value.
With video recording enabled, file size is a function of number of video channels, number of images/s, image format, real-time compression quality, color
or black and white images, sound simultaneously recorded and activity of subjects during recording. As a ruff estimate, size can be 33Mb/hour for 1 video
channel, no sound, 25 frames/s, 320x200 frame size (CIF), low quality compression. Medium quality and High quality are respectively 80 Mb/hour and 180
Mb/hour. For more details, please refer to the specification document for video data acquisition server.
Setup>System requirements
Published on O ctober 27, 2011
7/60
My NOTOCORD - User Manual - Printed on 28-Oct-11
NOTOCORD Systems
Local disk capacity
We advise you to have a local disk capacity that allows keeping all online experimentations included in the study. For maintenance reasons, the capacity must be
multiplied by 2.
Data backup
Different strategies may be used depending on the volume of experimental data, GLP/21CFRPart 11 compliancy.
Media from magnetic-optic disk, writable DVD or recent online archiving system (SAN) may be used.
Contact NOTOCORD customer support for more information.
Power supply
Power supply failure during recording session could crash the PC and provoke loss of data. Uninterruptible power supply devices are strongly recommended.
Setup>System requirements
Published on O ctober 27, 2011
8/60
My NOTOCORD - User Manual - Printed on 28-Oct-11
NOTOCORD Systems
Software Installation
Table of Contents
1. Requirements
2. Start the installation
1. Exit installation
2. Carry on with installation
3. Choose the destination directory
3. Select your type of installation
1. Standard installation
2. GLP Environment installation
3. Custom installation
Requirements
The requirements for installing NOTOCORD-hem Evolution are:
A computer corresponding to the recommended material requirements for the intended type of experimentation and use. Refer to the document "System
Requirements".
For an acquisition station, cards and drivers must be installed and functioning before NOTOCORD-hem installation, in accordance with the manufacturer's
recommendations.
The NOTOCORD-hem CD-ROM.
The license used for the station: either electronic license supplied as a .lic file, or diskette license supplied as two yellow floppy disks.
The user installing NOTOCORD-hem must have all the administrative rights for the machine.
Microsoft .NET Framework 2.0 software should be installed on the computer. If it is not, the installation program will automatically offer you to do so.
Microsoft Office Excel® 2003 or 2007 should be installed on the computer.
For an update: any previous NOTOCORD-hem version installed on this computer must be uninstalled from: Control panel > Add or Remove Programs
menu. If your license was previously installed, you don’t need to uninstall it to perform NOTOCORD-hem software installation.
For an installation in a GLP environment, in order to limit access to files produced by NOTOCORD-hem:
Aspecific Windows user account has to be assigned to secure NOTOCORD-hem data access. The associated password should be known by the person
undertaking the installation.
Specific NTFS rights have to be applied to the workfile directory to allow NOTOCORD-hem to work with this directory.
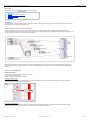
Start the installation
Open a Windows session using an account with all the administrative rights for the computer.
Insert the NOTOCORD-hem CD-ROM into the CD drive.
If the installation program does not start automatically, start the “Setup.exe” program from the root directory on the NOTOCORD-hem CD-ROM.
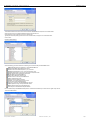
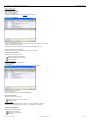
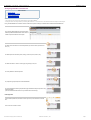
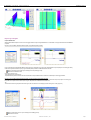
The installation wizard starts with the screen below:
Check that the displayed version number 4.x.x.xxx is the right version and click on "Next".
Exit installation
The cancellation button, found on each installation program screen, allows you to interrupt the installation process at any time during installation without any
modification being made on your system. Click on “Cancel” calls up the confirmation request box shown on Figure below.
Click on “Exit Setup” to interrupt the installation process, or click on “Resume” to continue the installation.
Carry on with installation
Setup>Software Installation
Published on O ctober 27, 2011
9/60
My NOTOCORD - User Manual - Printed on 28-Oct-11
NOTOCORD Systems
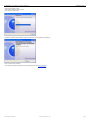
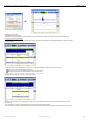
Accept the general terms and conditions and click on “Next”.
If you choose the “Remind me later ” option, this window will appear again after 48 hours when opening NOTOCORD-hem. The user is required to agree to the
General Terms and Conditions to be able to use the software.
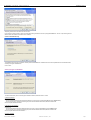
Choose the destination directory
The Installation wizard suggests an installation directory where all NOTOCORD-hem installation files will be stored. By default the recommended destination
directory is C:\Program Files\Notocord\.
Click on “Next”.
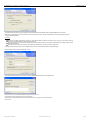
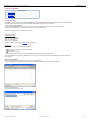
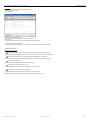
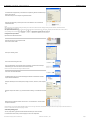
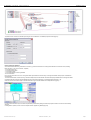
Select your type of installation
The above screen allows you to choose the type of installation: Standard, GLP Environment or Custom.
a) Standard installation
Context of use :
- You are not working following the Good Laboratory Practices rules and you don’t have the AccessManager license (AMG50a token).
- You are using only one or several of the following acquisition devices: DataTranslation board, DSI board or Video board.
Go to the chapter “Standard installation”.
b) GLP Environment installation
Context of use:
- You are working following the Good Laboratory Practices rules and you have the AccessManager license (AMG50a token).
- You are using only one or several of the following acquisition devices: DataTranslation board, DSI board or Video board.
Go to the chapter “GLP Environment installation ”.
c) Custom installation
Setup>Software Installation
Published on O ctober 27, 2011
10/60
My NOTOCORD - User Manual - Printed on 28-Oct-11
NOTOCORD Systems
Context of use: other cases than the ones listed in a) and b)
Go to the chapter “Custom installation”.
Choose your type of installation, click on “Next” and go to the corresponding chapter.
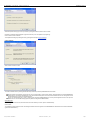
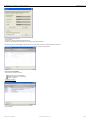
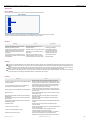
Standard installation
The standard installation starts with selection of the default directory where the data file produced by NOTOCORD-hem will be written.
Choose one shared directory for all users to allow the files produced by NOTOCORD-hem to be easily shared regardless of which user opens the
Windows session. The workfile directory proposed by default is C:\Program Files\Notocord\Data.
Choose individual user directories so that each user can save his/her data in his/her personal directory. The default directory used by NOTOCORD-hem
corresponds to a sub-directory called "Notocord" in the "My documents" directory of the user who opens the Windows session. You can type the name of
the sub-directory of your choice in the "Sub-directory" box.
Once the workfile directory has been selected, click on "Next".
Select the acquisition server(s) you have in your license, by ticking the relevant box, and then click on “Install”.
Installation is automatically undertaken and a progress bar informs you on how operations are progressing.
Click on “Finish” to close the window.
To complete the final stage by installing the license, go straight to the next part "License installation".
GLP Environment installation
In order to limit access to files produced by NOTOCORD-hem held in the workfile directory, the two following steps must be taken:
A specific Windows user account will be assigned to secure NOTOCORD-hem data access. You will be asked to enter this account when filling up the
“Data Manager Account” window (Figure 10).
Specific NTFS rights will be applied to the workfile directory to allow the NOTOCORD-hem to work with this directory. The installation program will do it
automatically.
Setup>Software Installation
Published on O ctober 27, 2011
11/60
My NOTOCORD - User Manual - Printed on 28-Oct-11
NOTOCORD Systems
The GLP Environment installation starts by selecting the default workfile directory where data files produced by NOTOCORD-hem will be written.
When working in a GLP environment, we recommend to choose the “Shared by all users ” option for workfile directory. The directory proposed by default is
C:\Program Files\Notocord\Data.
Comments:
By selecting the default workfile directory shared by all users ("Notocord\Data" sub-directory of "Program Files"), simple users are limited to read-only
access, as it is the default Windows configuration for this directory.
The installation process is longer when the workfile directory already contains many files. The process is extended by the time needed to assign specific
NTFS rights to these files.
If you select another directory, you should then apply NTFS access restrictions (i.e. set read-only mode) for simple users.
If you select custom directory for each user, the installation program will not be able to automatically set the specific NTFS rights.
Once the workfile directory has been selected, click on “Next”.
To select the Windows account which will be used to administer NOTOCORD-hem data, click on the “Browse” button.
Select just one account in the standard Windows dialogue box to select the user.
Once selected, this account appears in grey in the “Account” field.
Type the password corresponding to this account in the “Password” field, and re-type it in the “Confirmation” field.
Click on “Next”.
Setup>Software Installation
Published on O ctober 27, 2011
12/60
My NOTOCORD - User Manual - Printed on 28-Oct-11
NOTOCORD Systems
Select the acquisition server(s) you have in your license, by ticking the relevant box, and then click on “Install”.
Installation is undertaken automatically and a progress bar informs you on how operations are progressing.
Click on “Finish” to close the window.
To complete the final stage by installing the license, go straight to the next part "License installation”.
Custom installation
Select “Custom” and click on “Next”.
The Custom installation starts by selecting the default directory where files produced by NOTOCORD-hem will be written.
Choose individual user directories so that each user can save his/her data in his/her personal directory. The default directory used by NOTOCORD-hem
corresponds to a sub-directory called "Notocord" in the "My documents" directory of the user who opens the Windows session. You can type the name of
the sub-directory of your choice in the "Sub-directory" box.
Choose one shared directory for all users to allow the files produced by NOTOCORD-hem to be easily shared regardless of which user opens the
Windows session. The workfile directory proposed by default is C:\Program Files\Notocord\Data.
Set the GLP mode
When working in a GLP environment, we recommend to choose the “Shared by all users ” option for workfile directory.
Click on "Next".
The installation program displays the screen for selecting the Windows account assigned to secure NOTOCORD-hem data access and to set the relevant NTFS
rights for the workfile directory.
Setup>Software Installation
Published on O ctober 27, 2011
13/60
My NOTOCORD - User Manual - Printed on 28-Oct-11
NOTOCORD Systems
To select the Windows account which will be used to administer NOTOCORD-hem data, click on the “Browse” button.
Select just one account in the standard Windows dialogue box to select the user.
Once selected, this account appears in grey in the “Account” field.
Type the password corresponding to this account in the “Password” field, and re-type it in the “Confirmation” field.
Click on “Next”.
Install the software features
Select the feature(s) you want to install from the following list in accordance with your NOTOCORD license:
AMG50a: Activates GLP and 21 CFR Part 11 mode of NOTOCORD-hem.
BUX10a: Buxco MAX II / MAX 1500 Acquisition server.
CSW10a/b: Corscience BT3/6 acquisition up to 7, 14 devices
DSI60a/b/c/d: DSI OpenART 4, 8, 12, 16 sources acquisition server
DTS60a/b: DataTranslation card 16, 32 analog channels acquisition server
INS30a: GW Instruments Instrunet acquisition server
MPI10a: Matlab Link for NOTOCORD-hem
OHA10a: Ohaus Adventurer balance server
PRT30a: Continuous thermal printer AR200 driver
TMS31a: TMS acquisition server
VIV10a: Vivometrics LifeShirt acquisition
VSH10a/b : 4, 8 channels video acquisition server
Custom Tools: Customized Notocord tools
Legacy Tools: Tools from older NOTOCORD-hem versions
LMG10a: System ensuring security of video data streams
MON10a: Remote monitoring of video data streams
Third Party Tools: Non-Notocord developed softwares
Do not hesitate to ask your NOTOCORD contact person for confirmation of the features you need to install in regards of your license.
To select a software feature:
Setup>Software Installation
Published on O ctober 27, 2011
14/60
My NOTOCORD - User Manual - Printed on 28-Oct-11
NOTOCORD Systems
Right click on the feature to install.
Click on “Will be installed on local hard drive ”
Then, click on the “Install” button.
Installation is undertaken automatically and a progress bar informs you on how operations are progressing.
Click on “Finish” to close the window.
To complete the final stage by installing the license, go straight to the next part "License installation".
Setup>Software Installation
Published on O ctober 27, 2011
15/60
My NOTOCORD - User Manual - Printed on 28-Oct-11
NOTOCORD Systems
License Installation
Table of Contents
1.
2.
3.
4.
General principles
Electronic license
Diskette license
Support Questions
General principles
NOTOCORD licenses installation is done through the TokenManager application (TOM) supplied with the software installation CD-Rom. TokenManager allows
the software Rights of Use management for licenses installation / uninstallation from a floppy disk or an electronic file.
There are 2 types of NOTOCORD licenses:
- Electronic license: NOTOCORD license supplied to the customer as a .lic file, and requiring an activation key to be installed on a workstation.
- Diskette license: NOTOCORD license supplied to the customer as a protected yellow floppy disk.
Please, refer directly to the chapter concerned by your license type.
Electronic license
What do you want to do?
Case n°1: License Installation
Case n°2: License Uninstallation
Case n°3: License Transfer
Case n°4: License Modification
For further information, please refer to the Licensing reference document.
Prerequisites:
1) You must have access to the e-mailbox to which will be sent:
the .lic license file containing your rights and the modules,
the activation key,
the confirmation messages.
This e-mail address is the one given by the customer to the NOTOCORD Sales Representative in the license order.
2) You must beforehand have uninstalled any diskette license present on this workstation. Indeed, electronic and diskette licenses cannot be installed on the
same computer.
Case n°1: License Installation
Save the .lic license file you received by e-mail, in a folder on the end-user workstation.
Launch the TokenManager program accessible via the menu: Start > All Programs > NOTOCORD-hem Evolution > TokenManager.
Click on Install license from file.
Then, click on Browse and select the .lic file.
Setup>License Installation
Published on O ctober 27, 2011
16/60
My NOTOCORD - User Manual - Printed on 28-Oct-11
NOTOCORD Systems
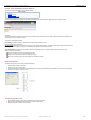
The TokenManager window contains 2 parts:
The upper grid shows the license to be installed and its contents.
The lower grid shows the list of licenses and their contents installed on your computer.
Tick the box corresponding to the license you wish to install on this computer. Alicense must be installed entirely. The installation of a single module of the
license is forbidden.
Click on Install.
The following dialog window shows the necessary information for generating an activation key:
There are 2 cases:
The end-user computer is connected to the Internet:
Click on Get key via Internet .
An information, or error, message appears with the action outcome.
If the action succeeds, you receive your activation key directly by email .
The end-user computer is not connected to the Internet:
Click on Copy to Clipboard , in order to automatically copy the activation information contained in the dialogue window. You must send NOTOCORD these 4 IDs by
e-mail, fax or telephone. For that purpose, contact your Sales Representative or your Customer Support Engineer. You will receive the activation key at the email
address given in the license order.
Copy and paste the activation key into the Activation Key field.
Setup>License Installation
Published on O ctober 27, 2011
17/60
My NOTOCORD - User Manual - Printed on 28-Oct-11
NOTOCORD Systems
The button Activate becomes active.
Click on Activate.
If the action is successful, a confirmation message appears.
The license is then activated on this workstation. It is now impossible to install it elsewhere.
If the action fails, an error message appears. Please, refer to the Licensing reference document to understand the cause of the error.
You can check that your license is installed in the lower grid of TokenManager, as shown in the figure below:
Case n°2: License Uninstallation
When should you uninstall your license?
License transfer on another workstation,
Software uninstallation on this workstation,
License modification.
Uninstallation procedure:
Launch TokenManager.
Click on Uninstall license and select the license to be uninstalled.
Click on Uninstall.
Setup>License Installation
Published on O ctober 27, 2011
18/60
My NOTOCORD - User Manual - Printed on 28-Oct-11
NOTOCORD Systems
Uninstallation has been done. An uninstall ID is generated. This code must be sent to NOTOCORD in order to:
- confirm that the uninstallation took place,
- update your license,
- allow you to reinstall it later.
Send the Uninstall ID:
via the « Send via Internet » button if your computer is connected to the Internet,
by email, fax, or telephone to your Sales Representative or NOTOCORD Customer Support, after having copied the 2 IDs by clicking on « Copy to clipboard
».
Aconfirmation or error message appears to inform you about the outcome.
Case n°3: License Transfer
When should you transfer your license?
Installation of the license on another computer,
Changing computer.
Transfer procedure:
Uninstall your license following the chapter « Case n°2: License Uninstallation » instructions.
Reinstall your license following the chapter « Case n°1: License Installation » instructions.
Case n°4: License Modification
When should you modify your license?
Purchase of a new module,
Purchase of a new functionality,
Move to GLP.
Procedure:
Following the purchase of new module(s) or functionalities(s), you receive at the email address supplied to NOTOCORD in the license order, a new .lic file
containing the electronic license and your new rights (cf. prerequisites).
Uninstall your license following the chapter « Case n°2: License Uninstallation » instructions.
Reinstall your new license following the chapter « Case n°1: License Installation » instructions.
Diskette license
Take the yellow floppy disk containing your license.
If you are installing NOTOCORD-hem software and the floppy disk is already inserted in the floppy drive, then the TokenManager application will open
automatically.
Otherwise, insert your yellow floppy disk into the floppy drive.
Then, launch TokenManager program accessible via the menu: Start > All Programs > NOTOCORD-hem Evolution > TokenManager.
The window of TokenManager consists of 2 parts:
The upper grid shows the list of licenses to be installed and their contents.
The lower grid shows the list of licenses and their contents already installed on your computer.
Click on the « Refresh » button to post your floppy disk licenses in the upper grid.
Setup>License Installation
Published on O ctober 27, 2011
19/60
My NOTOCORD - User Manual - Printed on 28-Oct-11
NOTOCORD Systems
What do you want to do?
Case n°1: License Installation
Case n°2: License Uninstallation
Case n°3: License Transfer
Case n°4: License Modification
For further information, please refer to the Licensing reference document.
Case n°1: License Installation
Click on Install license from floppy disk .
Tick the box corresponding to the license you want to install on this computer, and then click on Install.
The license is installed on this computer.
To check that your license is installed, it should appear in the TokenManager lower grid.
Remove the floppy disk from the floppy drive.
Keep the floppy disk for further uninstalllation of the license on this computer.
Case n°2: License Uninstallation
When should you uninstall your license?
License transfer on another workstation,
Software uninstallation on this workstation,
License modification.
Uninstallation Procedure:
Insert your yellow floppy disk in the floppy drive.
Launch TokenManager.
Click on Refresh.
The TokenManager lower grid shows all modules currently installed on this computer.
Select the license to be uninstalled.
Click on Uninstall license.
Now, these modules appear in the upper grid of TokenManager.
Case n°3: License Transfer
When should you transfer your license?
Installation of the license on another computer,
Changing computer.
Transfer procedure:
Uninstall your license following the chapter « Case n°2: License Uninstallation » instructions.
Reinstall your license following the chapter « Case n°1: License Installation » instructions.
Case n°4: License Modification
When should you modify your license?
Purchase of a new module,
Purchase of a new functionality,
Move to GLP.
Setup>License Installation
Published on O ctober 27, 2011
20/60
My NOTOCORD - User Manual - Printed on 28-Oct-11
NOTOCORD Systems
Procedure:
Insert the floppy disk with your new module into the floppy drive.
Launch TokenManager program.
Click on Refresh.
Click on Install license from floppy disk .
Select in the TokenManager upper grid, the tokens you want to install.
Click on Install.
The new installed modules are now visible in the TokenManager lower grid window.
Close the window, the update is effective.
Remove the floppy disk from the floppy drive. Keep it for further uninstallation of the license on this computer.
Support Questions
What can you do in case of:
Computer crash (mother board, hard disk, system) with an electronic license was installed on it?
Contact NOTOCORD Customer Support, to desactivate your license. Then you can reinstall it on another computer.
Computer crash (mother board, hard disk, system) with a diskette license was installed on it?
Use your Backup floppy disk. Then contact NOTOCORD Customer Support to have a new Backup floppy disk.
Loss of your .lic license file?
Contact NOTOCORD Customer Support: your .lic file will be sent again.
No reception of the e-mail containing the .lic file?
Contact NOTOCORD Customer Support to check the validity of your e-mail address.
No reception of the e-mail containing the activation key?
Contact NOTOCORD Customer Support to check the validity of your e-mail address.
Regarding the origin of error messages, please refer to the Licensing reference document.
Setup>License Installation
Published on O ctober 27, 2011
21/60
My NOTOCORD - User Manual - Printed on 28-Oct-11
NOTOCORD Systems
Get Started
Configuring acquisition
Focus on NOTOCORD-hem configuration
Table of Contents
1. Display and configuration windows
2. Module configuration
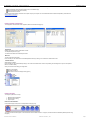
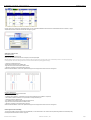
Display and configuration windows
NOTOCORD-hem starts with the Main window displayed full screen.
NOTOCORD-hem display two windows:
- The Main window displays your signals, raw signals, and calculated data during the experiment.
- The Configuration window is used to set up your protocol.
You can switch from one to the other by clicking the corresponding top left icon (or by pressing simultaneously Ctrl key and space bar).
Note: You can resize and arrange the two windows so as to view them together and easily switch from one to the other.
Module configuration
Introduction: Default modules
NOTOCORD-hem comes with four default modules:
NSR10a: Acquisition module employing data previously saved as a NSS file (Note that NOTOCORD-hem generated data files are identified by the .nss file
extension). It allows you to simulate a previously performed acquisition. In order to help you learn to use the software, the NSR10a acquisition module has
been preconfigured to read a simulation file loaded at startup containing ECG and ABP signals.
CTD60a: Display module used to view signals in a continuous manner. The Continuous display window can contain one or more graphs. Each graph can
show one or more signals.
Get Started>Configuring acquisition
Published on O ctober 27, 2011
22/60
My NOTOCORD - User Manual - Printed on 28-Oct-11
NOTOCORD Systems
CYC10a: Processing module used to determine the cycle of a generally repetitive signal and calculate its characteristic points (maximum, minimum,
highest slope).
KBD30a: Tools module used to set markers indicating key moments during a test (for example, the injection of a given product at a given time).
Note: The various modules available in the Configuration window are normally sorted by
tabs. You can also display the modules without sorting them. To do this, right-click the
modules toolbar and deselect "Arrange modules in tabs".
Setting up a module
Aconfiguration is created by setting up the various modules required and connecting them together in the Configuration window (for some modules, certain
parameters must also be specified).
To set up a module, proceed as follows:
Click the corresponding module type (NSR10a acquisition module in this example).
Point and click where you wish to set up the module.
Notes:
- To position a module in the Configuration window, click the module and drag it to the required location.
- To delete a module, click it and press the Delete key.
- Important: You cannot set up a module during acquisition (except for display modules, which can be set up any time).
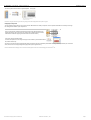
Linking two modules
Set up a second module (CTD60a module in this example) to the right of the first module.
Click the + sign on the display module once to obtain two display graphs (each successive click
adds a graph).
Note: As soon as the display module is set up, the corresponding display window shows up in
the Main window. Depending on the number of graphs selected, the display window will be
divided into an equivalent number of sections.
Click and drag the output of the NSR10a module towards the corresponding input of the CTD60a
module. When you see that the target input is covered by a yellow grid, you can release the
mouse.
Module name modification
Amodule's default name consists of its function followed by an order number (CYC10a1,
CTD60a2…).
Get Started>Configuring acquisition
Published on O ctober 27, 2011
23/60
My NOTOCORD - User Manual - Printed on 28-Oct-11
NOTOCORD Systems
Displaying signals
Table of Contents
1. Starting the acquisition process
2. Zoom and scaling options
3. Additional display options
Once you have configured your test, you can display the acquired signals, as well as the results of the various processing tasks applied to them.
Note: The following example corresponds to the continuous display of two ECG and ABP default signals provided by the NSR10a module. We recommand that
you set up the same configuration.
Starting the acquisition process
There are several ways to start the acquisition process. The typical way is to click the START button in the Main window.
Note: Important - In the main window's toolbar, the NOTOCORD logo in the upper right hand corner shows a sine wave when acquisition is in progress.
In addition, the various module outputs will flash at regular intervals and the traffic light icon on each module will light up (normally green) to indicate that
acquisition is in progress.
You can also start the acquisition process in one of the following manners:
From the Acquisition menu, select Start
Ctrl+Ashortcut
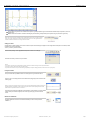
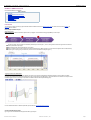
Zoom and scaling options
Once the acquisition has started, the signals displayed are not always immediately readable, as shown in the example below (curves overly compressed or
exceeding the default y-axis scale).
Important: During acquisition, mouse manipulations on time scale (i.e. dragging, expansion or compression) will stop signal scrolling. To resume scrolling, click
the Scroll button or use the corresponding keyboard shortcut Ctrl + S.
NOTOCORD-hem provides several zoom and scaling options:
Horizontal zoom
Shortcut
Action
Get Started>Displaying signals
Illustration
Published on O ctober 27, 2011
24/60
My NOTOCORD - User Manual - Printed on 28-Oct-11
NOTOCORD Systems
Hold down the Ctrl key, click one of the graphs and drag the mouse sideways (the
3 numbers displayed indicate the width of the zoom region selected, its starting
Ctrl key +
point on the x-axis and its end point on the x-axis).
drag and
When you release the mouse, all the graphs in the display window will be
drop a graph zoomed accordingly.
Ctrl key +
drag and
drop the xaxis
Hold down the Ctrl key, click the x-axis (the cursor turns into a closed hand) and
drag the cursor towards the right (time scale expansion) or towards the left (time
scale compression).
Notes:
1) The left limit of the time scale remains fixed.
2) You can also use the following keyboard shortcuts: Ctrl + → (expansion) or Ctrl + ← (compression). In this case potential signal scrolling is not interrupted.
Y-axis scaling
Button / Shortcut
Actions
Illustration
Y-axis scaling button / Ctrl + Y
Click the graph to be scaled (two thick borders will appear), then click the Y-axis
scaling button.
Note:
- Important: When a graph does not show up in the display window, y-axis scaling may be required (the graph may simply be out of scale).
- To scale all the graphs in the display window, click the Y-axis scaling button twice (not a double-click).
Vertical zoom
Shortcut
Actions
Illustration
Shift key + drag and
drop the graph
Hold down the Shift key, click a point on the graph, drag the cursor
upwards or downwards and then release the mouse.
Only the graph selected will be zoomed.
Ctrl key + drag and
drop the y-axis
Hold down the Ctrl key, click the y-axis and drag the cursor upwards
(expansion) or downwards (compression).
Notes:
1) The lower limit of the y-axis remains fixed as far as possible.
2) You can also use the following keyboard shortcuts: Ctrl + ↑ (expansion) or Ctrl + ↓ (compression).
Zoom region selection
Shortcut
Actions
Illustration
Ctrl + Shift Hold down the Ctrl and Shift keys and use the mouse to select the region of the
keys +
graph to be enlarged, then release the mouse (the numbers displayed indicate the
rectangle dimensions of the region selected and the coordinates of its top left corner).
Note: The width of the region selected is applied to all the graphs in the display window.
Zoom command button
Button
Action
Illustration
Right-click this button to select the type of zoom command to be applied.
Type of Zoom
Get Started>Displaying signals
Illustration
Published on O ctober 27, 2011
25/60
My NOTOCORD - User Manual - Printed on 28-Oct-11
NOTOCORD Systems
Horizontal zoom (applied to all graphs)
Vertical zoom (applied to selected graph)
Rectangular zoom (horizontal zoom applied to all graphs, vertical zoom applied to selected graph)
2x zoom (200% zoom applied to both X-axis and y-axis of selected graph)
Select the type of zoom command to be applied (your selection will be stored in memory), then click the Zoom command button and select the region of the graph
to be enlarged. Release the mouse to apply the zoom command (if you chose the 2x zoom command, just click the graph to be enlarged).
Horizontal and vertical displacement
To move the display portion along the x-axis, click the x-axis and drag the mouse sideways. Release the mouse to display a new portion of the graph.
You can also use the → and ← keys to displace the graph in regular increments.
The vertical displacement procedure is exactly the same: Click the y-axis and drag the cursor, or use the ↑ and ↓ keys.
Additional display options
Coordinates of a point or portion of a curve
Click any point on a graph to display its coordinates. If coordinates are not displayed immediately,
slightly drag mouse while pressing the left button.
To display the coordinates for a region, select the region using the mouse
Displaying an entire test
Button / Shortcut
Actions
Illustration
X-axis scaling button /
Click the X-axis scaling button to display all signals throughout the
duration of the test (including periods during which acquisition was
stopped).
Ctrl + X
Note: You can use this command at the start of the acquisition process to immediately obtain an enlarged view.
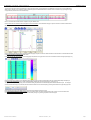
Scrolling mode selection
During acquisition, NOTOCORD-hem allows you to view signals in three scrolling modes: Window scrolling, Replacement scrolling, and Continuous scrolling.
Button
Actions
Illustration
To select the scrolling mode, right-click the Scroll button.
Scroll button
Select the scrolling mode required and click the Scroll button (the mode selected is stored in memory).
Scrolling
mode
Description
Window
scrolling
When the curves displayed reach the end of the display window, a new signal image is displayed.
Illustration
Replacement Instead of being displayed in a new window, the new signal image replaces the previous one. The
scrolling
current point is indicated by a vertical line moving from left to right.
Continuous
scrolling
The signal image scrolls continuously (new values are displayed at the right end of the window).
Displaying a graph full screen
Get Started>Displaying signals
Published on O ctober 27, 2011
26/60
My NOTOCORD - User Manual - Printed on 28-Oct-11
Button / Shortcut
Actions
NOTOCORD Systems
Illustration
Full screen graph button
Select a graph and click the
"Full screen graph" button to
display the graph full screen.
Click this button again to
redisplay all of the graphs.
or Ctrl + F
Hiding a graph
The graphs shown in a display window are identified by numbered boxes under the toolbar in the right-hand section of the window. To hide a graph, click the box
with the corresponding number (the box will then look "closed"). The display window will then only contain the remaining graphs.
Modifying the height of a graph
To modify the height of a graph, click one of the horizontal lines delimiting the graph selected and drag the mouse upwards or downwards. The y-axis scales for
the graph selected and for adjacent graphs concerned by the modification will be automatically expanded or compressed accordingly.
Reassigning an equal height to all graphs displayed (i.e. not hidden): Click on the tile button.
Changing the name of a graph
Double click on title and type new title in the displayed properties dialog box.
Note: You can also click the name box and drag it to any location in the display window, or even delete the name.
Get Started>Displaying signals
Published on O ctober 27, 2011
27/60
My NOTOCORD - User Manual - Printed on 28-Oct-11
NOTOCORD Systems
Using multiple display windows
Instead of adding additional display graphs into the same window (thus making it harder to read the various signals displayed), it is sometimes more convenient
to open a new display window and arrange the various windows as you like.
You can use the Tile horizontally, Tile vertically, Adjust and Cascade buttons to arrange the various display module windows in the Main window .
Hiding a display window
Clicking the
icon in the top right-hand corner of a display window does not "close" the window but just hides it. To restore the window, select it from the
Window menu in the Main window.
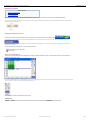
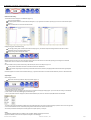
Display window configuration
You can specify the style (crosses, points, vertical lines, etc.), color and thickness for each curve in a display window.
Button
Action
Illustration
To configure a display window, click the top left button in its toolbar. The "Display
configuration" dialog box appears.
- The left part of this dialog box lists all available data.
- The right part lists the data connected to the display module inputs (the treestructure showing the names of graphs and display modules is initially closed).
To change the display of a data, select it in the right part of the dialog box (a small red ball appears) and choose the style, color and thickness required.
Get Started>Displaying signals
Published on O ctober 27, 2011
28/60
My NOTOCORD - User Manual - Printed on 28-Oct-11
NOTOCORD Systems
Note: The left part of the dialog box lists all data for the current configuration, including data corresponding to display modules which have been deleted.
We recommend that you experiment with different types of configurations so as to become familiar with the various possibilities.
Get Started>Displaying signals
Published on O ctober 27, 2011
29/60
My NOTOCORD - User Manual - Printed on 28-Oct-11
NOTOCORD Systems
Using event markers
Table of Contents
1. Basic principle
2. Configuration
3. Display
Basic principle
- Event markers are used to identify specific moments in the course of an experiment (such as the injection of a compound, at a given time ...).
- Event markers can be set by pressing either a function key (F1, F2, F3...F8), each key corresponding to an event marker channel. Or after an acquisition by 1st
navigating to desired area and then right click on the mouse and select Insert marker .
- Each event marker has a type and a label associated with it. Event marker types are used to distinguish between different types of events. For example, type 0
may correspond to events concerning the injection of a product and type 1 may correspond to events involving observations.
Note: The default event marker type is 0.
- Event marker labels are used to specifically identify marked events.
Configuration
Setting up the KBD30a module
In order to specify and make use of event markers, the KBD30a module must first be set up.
Set up the KBD30a module in the Configuration Setup window.
Note: Important - A Configuration Setup window cannot contain more than one KBD30a module.
Choosing the number of event marker channels
Double-click the KBD30a module to display the KBD30a properties window.
Enter the number of event marker channels required in the Number of channels field.
Note that only the first eight channels are connected with F1, F2, ...F8.
Several different combinations of event marker channels + types can be used, depending on the way you like to work and the nature of the tests to be carried out.
For example, you can assign one event marker channel per animal and specify the operations carried out using event marker types.
You can also assign an event marker channel for each type of operation and use event marker types as an additional means to distinguish between various
operations.
KBD30a module outputs
After you have clicked OK in the KBD30a properties window, the amount of KBD30a module inputs and outputs will correspond to the number of channels
assigned.
The inputs remain ”on standby”. They are used in association with event marker channels activated by either a pushbutton or a function key.
Outputs can be connected to display modules so as to view the corresponding event markers.
Note: An event marker can be viewed in any graph, independently of the signal it is assigned to (i.e., an event marker channel associated with a given signal can
be displayed in a graph corresponding to another signal).
Display
Set up the following configuration:
Event marker channel 1 is assigned to the ECG signal of the NSR10a module. Channel 2 is
assigned to the ABP signal.
- Switch to the Main window.
- Start the acquisition and then press the F1 and F2 keys several times (in any order).
- Stop the acquisition.
Event markers are represented by long vertical lines of various colors (each event marker has its own color). Above each event marker line, there is an order
number, a dot and a box containing the function key associated with the corresponding marker. For example, the number 3 above the F2 box stands for the third
event marker of channel 2.
Get Started>Using event markers
Published on O ctober 27, 2011
30/60
My NOTOCORD - User Manual - Printed on 28-Oct-11
NOTOCORD Systems
Note: - You can have two identical numbers one after the other when they correspond to different event marker channels.
Click on the signal with the right side mouse button.
In the context sentive menu, choose Insert marker and select one of the two channels with the
left side mouse button.
Amarker is inserted and is displayed on the graph.
Specifying event marker labels and types
- Double-click an event marker (you can double-click the corresponding line, dot or box) to display
the Marker properties window for this marker.
- The Number field indicates the order number for the marker you selected (for example, 2nd
event marker of event marker channel 1).
- Enter a Label to identify the event marker.
- Select the event marker Type (0 to 99 - the default type is 0).
- Click OK.
The event marker's label and its order number with respect to the type and channel will now be
displayed above the corresponding line (in the example shown, the event marker is of type 2 and
corresponds to channel 1).
The other event markers for this channel are renumbered accordingly.
Switching from one event marker to another
You can navigate directly from one event marker to another of the same channel.
There are three ways to do this:
Right-click an event marker and choose the destination
Double-click an event marker, select the target marker number and click Go to ...
Select an event marker and use one of the following keyboard shortcuts: Ctrl+M (next marker of the same channel), Shift+Ctrl+M (previous marker of the
same channel).
Moving an event marker
The default settings do not allow you to move event markers once they have been positioned.
If necessary, you can reposition a marker by unchecking the Unmovable box in its Marker
properties window.
Get Started>Using event markers
Published on O ctober 27, 2011
31/60
My NOTOCORD - User Manual - Printed on 28-Oct-11
NOTOCORD Systems
Managing files
Table of Contents
1.
2.
3.
4.
5.
6.
Saving the current configuration
Saving the data file under another name
Loading a configuration other than the current one
Opening a data file
Creating a new data file
Saving the current configuration as a Memo
Saving the current configuration
Once the configuration has been generated, it can be saved under a user specified explicit name so that it can be reused by other applications.
Note: A configuration mainly includes:
– The configuration diagram (module layout and parameter settings, links between modules),
– The display layout, size and parameter settings (type of signals, color, line thickness),
– The size and layout of the Main window and the Configuration Setup window.
To save the current configuration, click on the Save configuration button in the configuration screen or on the item with this name in the File menu and specify the
name of the configuration file and where to save it.
Saving the data file under another name
You can save your data files under a different name than the one assigned when they were opened or created.
To do this, use the File > Save as command from the main screen and specify the name of the
data file and where to save it.
Loading a configuration other than the current one
Click on Load a configuration in the Configuration Setup window or use the File > Load a
configuration command.
Opening a data file
You can open a data file by clicking on Open in the Main window or by using the File > Open
command.
File selection window opens. When a .nss file is selected in the list, its preview is displayed by clicking on the ad hoc menu's tab.
Preview corresponds to the display of the main screen as it was by closing the file.
Creating a new data file
Get Started>Managing files
Published on O ctober 27, 2011
32/60
My NOTOCORD - User Manual - Printed on 28-Oct-11
NOTOCORD Systems
To create a new file, you can click on New in the Main window or run the File > New command.
The opening window enables you to set the file's location and name, and required configuration.
The options available are:
Default: Loads the saved configuration as the default configuration (refer to the next paragraph).
Memo 1, Memo 2… Loads the configuration assigned to the Memo 1, Memo 2… button (see below for a description on how to assign a configuration to
one of these buttons).
Current: Retains the current configuration.
Empty: The configuration window is clear of all modules.
More: Loads the selected configuration.
Saving the current configuration as a Memo
You can save the current configuration as a base for working on other experiments.
The first method, described above, includes saving the configuration under an explicitly entered name and calling it back up during other experiments.
The second useful method is to record a configuration as a Memo, which remains available and specific for each user.
To assign the current configuration to a Memo button, hold left mouse button pressed on one of
the toolbar M buttons until the color becomes red.
After releasing the mouse button, the Memo button number turns from white to red. This indicates a configuration has been assigned to this particular Memo
button.
Once the current configuration has been stored in a Memo, it can be called back in any application by simply clicking on the corresponding button
Note: To assign a name to a M emo, click with the right mouse button on the corresponding
button and select the M emo editing box. The name entered will be displayed in the bubble
displayed for the M emo button.
Get Started>Managing files
Published on O ctober 27, 2011
33/60
My NOTOCORD - User Manual - Printed on 28-Oct-11
NOTOCORD Systems
Analyzing with Microsoft Excel®
Table of Contents
1.
2.
3.
4.
Extracting file data
Placing data in the spreadsheet
Automatically building graphs
Displaying the analysis zone
Notes:
- This section assumes that you are familiar with the use of Microsoft Excel®.
- It briefly describes the analysis features provided by Microsoft Excel®. These features are described in detail in the chapter on data analysis.
During the NOTOCORD-hem installation a function is added to the system createing a link between Microsoft Excel® and NOTOCORD-hem.
Upon opening Microsoft Excel® you will find five buttons
added to your Microsoft Excel® toolbar. These buttons or
"wizards" help for data extraction and analysis.
To extract various information from a data file (filename, acquisition duration, acquisition start
time, etc.)
To extract experiment information (values, average, number of points, maximum, etc.)
To extract information on markers: number, type, assigned keys, name, etc.
To visually redefine the data analysis field.
To quickly draw a graph that represents the extracted data.
To ensure extracted data match appropriate events (eg: extracted data really correspond to a fully
detected heartbeat).
(This Time-matched extraction wizard is only available with an activation key).
Extracting file data
From the Excel® spreadsheet, select the cell where you wish to place information on the data
files.
Click on the "File information" wizard.
Get Started>Analyzing with Microsoft Excel®
Published on O ctober 27, 2011
34/60
My NOTOCORD - User Manual - Printed on 28-Oct-11
NOTOCORD Systems
The window that is displayed lets you select the file to analyze along with the information that you
wish to place in the cell.
Select the file that you wish to analyze using the Browse button.
Select the information that you wish to place in the cell and validate it. The cell contains the
selected information.
Note:
When you select a cell containing data generated by one of the wizard, the formula bar displays exactly how the data was extracted into Excel.
As a general rule, each cell or group of cells that contains information generated by one of the three wizards (file information, data, markers) has a
corresponding formula such as
Placing data in the spreadsheet
Experiment data is extracted as follows:
Select the cell where you wish to place the data.
Click on the "Formula" wizard.
It calls up the following screen.
Click on the "Select working file" button.
Click in the field and then on the cell that contains the filename. The field is then framed by a
dotted blinking line. The field contains the cell's absolute address.
Note: You can also select the file using the Browse button.
Then click on the "Select data" button.
The Browse button calls up the window that displays the data for the selected file. Select the
required data and validate twice.
Specify the data that you wish to extract (values, average, minimum, maximum, number of points,
etc.).
Specify the analysis zone duration, e.g. a 20 second window starting 1 minute after the start of the
file
Validate the formula definition window. The active cell — or those that follow — will then contain
the required information.
Note: Important - The cell may display the #N/A or #Zone error message. Click on the edit wizard to see if you have incorrectly set up the formula wizard or if
there is no data in the section you are trying to extract.
Automatically building graphs
You can quickly obtain a graph that illustrates the data calculated by the "Formula" wizard.
First select the values zone that you wish to display, then click on the Graph button.
Get Started>Analyzing with Microsoft Excel®
Published on O ctober 27, 2011
35/60
My NOTOCORD - User Manual - Printed on 28-Oct-11
NOTOCORD Systems
You can then perform all of the actions supported by Excel ® on the graph.
Note: Once the graph has been generated, any change to the data configuration will impact the graph.
Displaying the analysis zone
You can display the analysis zone of a cell or column with the "Edit" wizard. This allows you to perform a visual inspection of the data. It also allows you to change
the starting point and duration of your analysis zone.
Click on a cell where the contents are calculated by a wizard. (In the example below the cell
displays the maximum value of the signal. The analysis zone, created by the formula wizard,
starts 60 seconds after the beginning of the file and has a 20 second duration.)
Then click on the "Formula editor" button.
The zone corresponds to the one configured using the Formula wizard (1 minute after the start of
file; duration: 20 seconds).
You can then move the zone and/or change its width. When you validate it, the cell is automatically recalculated according to the new parameters. (For consecutive
values, all of the cells are changed along with the graph that may be assigned to them.)
Note: The Evaluate button displays the result of the formula applied to the zone without changing the active Excel® cell.
Get Started>Analyzing with Microsoft Excel®
Published on O ctober 27, 2011
36/60
My NOTOCORD - User Manual - Printed on 28-Oct-11
NOTOCORD Systems
Advanced Tutorials
Calibration
Calibration tutorial
Advanced Tutorials>Calibration
Published on O ctober 27, 2011
37/60
My NOTOCORD - User Manual - Printed on 28-Oct-11
NOTOCORD Systems
ECG51a / QRS10a tutorial
How to start with ECG51a and QRS10a
Table of Contents
1.
2.
3.
4.
5.
6.
Introduction
Modules configuration in NOTOCORD-hem
QRS trigger generation with QRS10a module
ECG51a module configuration
ECG51a analysis
Improve your analysis
Introduction
This user guide is designed to help you get started with ECG51a and QRS10a modules. A ECG51a demo video and reference documents for ECG51a and
QRS10a are also available.
Basic principles of ECG51a analysis
Athree-step process
ECG51a module is an offline beat-to-beat analyzer based on propagation of user-defined marks (typically PQRST) in 3 main steps:
The reference beats are file-specific and automatically identified by the module (step 1). To do so, the algorithm browses through the file and retains the
most representative morphologies.
Each reference beat is manually marked by the user (step 2).
These user-defined marks are then applied over all the beats identified on the QRS input (step 3). The positions of the applied marks are determined by
comparing the morphology of a given beat to the previous and to the next reference beats (see Figure 1).
Triggering ECG51a with a QRS detector
ECG51a requires triggering by another module, QRS10a for instance, which performs beat detection. Detected beat triggers must be located on the QRS
complexes and connected to the QRS input of ECG51a. An analysis window around each QRS trigger is set to define the zone considered for the analysis of each
beat. QRS triggers are also used to align multiple beats in the different 3D views offered by ECG51a (Figure 2).
For more detailed information on ECG51a capabilities, please refer to the ECG51a reference document.
Overview of ECG51a display window
Figure 3 gives an overview of ECG51a display window after signal analysis
Advanced Tutorials>Calibration
Published on O ctober 27, 2011
38/60
My NOTOCORD - User Manual - Printed on 28-Oct-11
NOTOCORD Systems
Modules configuration in NOTOCORD-hem
The ECG51a module has 3 inputs (ECG–red, QRS-green and Markers-pink) and 10 outputs as standard (Figure 4). This number may vary as more outputs can
be added.
The QRS trigger can be provided by any module able to detect a cycle or an R-wave. Use of the QRS output of the QRS10a module, delivered with ECG51a, is
recommended since QRS10a has been specifically developed for this application.
Connect the ECG signal on the red input of both QRS10a and ECG51a modules.
Connect the QRS output to the green ECG51a input.
QRS trigger generation with QRS10a module
ECG51a analysis is triggered by QRS detections, which can be generated by QRS10a. There are 2 tabs in the QRS10a properties window (Figure 5).
The first tab, Algorithm, allows selection of a preset for species and experimental setup.
Set the algorithm parameters or select a preset,
Validate it by clicking on OK.
Recalculate the QRS10a module.
The second tab, Discrimination, contains optional user-defined discrimination parameters for refining QRS detection.
Advanced Tutorials>Calibration
Published on O ctober 27, 2011
39/60
My NOTOCORD - User Manual - Printed on 28-Oct-11
The second tab, Discrimination, contains optional user-defined discrimination parameters for refining QRS detection.
NOTOCORD Systems
Check Amplitude and Signal-to-Noise Ratio results on a CTD60a display.
Apply discrimination thresholds if necessary.
Then recalculate the module.
See examples of discrimination parameters use in chapter "Improve your analysis". For more detailed information on QRS10a capabilities, please refer to the
QRS10a reference document.
ECG51a module configuration
The configuration window contains 3 tabs: Algorithm, Marks and Calculated data (Figure 6).
Algorithm tab
Applies a preset for your species. Parameters are used:
- to adapt the analysis to the signal,
- to define the boundaries of the beat analysis window.
Marks tab
The main marks are already listed.
► You can add your own marks with the associated keyboard shortcuts, by clicking on the + button at the bottom of the screen.
Calculated data tab
Adefault listed is available.
► You can add your own calculated data by clicking on the + button at the bottom of the screen and by indicating the calculating formula. (Time1 corresponds to
Mark1 and Time2 to Mark2).
When you are finished with setting your configuration:
Click on OK to validate,
Right-click on ECG51a,
Select Show to switch to the display screen (Figure 7).
ECG51a analysis
The analysis is performed in 3 steps:
1. Reference beats identification
2. Reference beats marking
3. Signal analysis.
Reference beats identification
In the ECG51a display window, click on Identify reference beats (Figure 8).
The number of reference beats appears in the horizontal bar above the 2D/3D chart menu. In Figure 9, 18 reference beats are identified by ECG51a (with #1 being
displayed).
Advanced Tutorials>Calibration
Published on O ctober 27, 2011
40/60
My NOTOCORD - User Manual - Printed on 28-Oct-11
NOTOCORD Systems
Reference beats marking
The first reference beat is displayed in the 2D/3D chart (Figure 10).
Click on the chart to activate it.
Use either keyboard shortcuts to mark the reference beat (P, Q, R, S, T) or right-click on the chart to open the pop-up menu and use the Add mark option
(Figure 11).
Click on the Next button to move to the next reference beat.
► Apply marking option for facilitated marking
Use the Apply marking button to mark the active reference beat (Figure 12). This function compiles all existing reference beats marks in order to
automatically mark the current/active reference beat.
Add any missing mark and/or adjust the marks.
Marking mode: When you press ctrl + click on the Apply marking button, the button remains in an active state, providing a pre-marking for each visualized
reference beat. There is no need to click on the button for each beat.
Tips
► If you hesitate on how to position marks correctly, T: End for example, here are some ways to help you out:
You may check the QT: duration value of the current reference beat in the statistics table.
You may check the neighboring beats by clicking on the 2D/3D chart to activate it, and then by navigating between beats with the left and right keyboard
arrows.
► If a dash appears in front of the number of reference beats (e.g. -/18), then the active beat is not a reference beat. Move to the previous or next reference beat.
Signal analysis
When marking is finished:
Apply it to the rest of the signal with the Analyze signal button (Figure 13).
Once the signal analysis process is complete:
- Marks are visible in the upper display chart.
- The Global statistics panel (on the bottom right corner, Figure 3) indicates the coverage percentage (Figure 14). For each mark, the coverage is calculated as
(number of marks / number of input QRS triggers) over the whole signal.
- The non-synchronized continuous display chart, above the Global Statistics panel, shows an overview of PR, QT, QRS intervals and Heart Rate.
This chart is useful to observe potential drug effects and monitor data quality. Indeed, if you notice any interval instability in a particular area on this chart, right-click
on it to see the identification numbers of the corresponding reference beats and access them to check the marks.
See an example of interval instability at the end of this guide in the chapter “Improve your analysis”.
Views
The 2D/3D chart of ECG51a offers 4 visualization modes: 2D Editor, Waterfall, Topography and 3D View.
Except for the 2D Editor, each view shows multiple beats aligned on their QRS trigger.
Advanced Tutorials>Calibration
Published on O ctober 27, 2011
41/60
My NOTOCORD - User Manual - Printed on 28-Oct-11
NOTOCORD Systems
The blue zone in the upper continuous display (Figure 15) represents the portion of signal displayed in the 2D/3D chart. This blue zone is synchronized with the
2D/3D chart. For example, if you increase the number of beats displayed in the 2D/3D chart then the size of the blue zone increases. If you go through the signal
using the 3D view, the blue zone moves simultaneously.
Here is a non-exhaustive list of basic actions to perform using the different views:
► To visualize marks on individual beats and navigate from one beat to another, use the 2D Editor view (Figure 16) and move from one beat to another with the
left and right keyboard arrows.
► To visualize and/or edit reference beats, use the 2D Editor view (Figure 16) and move from one reference beat to another with Previous and Next reference beat
buttons or by using the up↑ and down↓ keyboard arrows.
► To measure PR or QT interval duration, use the Topography view, left-click on the graph and move the mouse to make the dimensions appear (See Figure 17).
► To get a whole signal overview, use the Topography view, right-click on the chart area and select Signal Overview. It automatically adapts the Display 1/n
parameter in order to spread the chosen number of displayed beats (# Beats) over the whole signal (Figure 17 and Figure 18).
The Signal overview option in Topography view is convenient for setting the parameters in the ECG51a properties window before the analysis. To exit signal
overview, decrease the Display 1/n parameter, and select a beat of interest on the Continuous Display by choosing Show beat # in the right click popup menu.
► To move the whole graph in the 2D/3D chart area, right click and simultaneously move the mouse.
► To select a particular beat on the graph, use Ctrl + click on the beat of interest. This beat is highlighted as shown on Figure 19. This active beat is also
designated in the Continuous Display by a purple arrow underneath (see Figure 3), showing its position in the whole signal.
Advanced Tutorials>Calibration
Published on O ctober 27, 2011
42/60
My NOTOCORD - User Manual - Printed on 28-Oct-11
NOTOCORD Systems
Improve your analysis
Improve QRS detection
QRS10a detects QRS complexes and can be used to trigger ECG51a analysis. Wrong QRS detections can be filtered out using the Discrimination tab of QRS10a
properties.
Remove noise and artifacts detected as QRS complexes using QRS amplitude parameter.
In Figure 20, ECG signal and detetected QRS complexes (green) are displayed on the upper graph. QRS Amplitude output is displayed on the lower graph. Noisy
beats can be rejected from QRS output by using the QRS amplitude parameters of QRS10a Discrimination tab.
Apply a Low threshold equal to 200 (in this example) for the amplitude (Figure 22).
Recalculate the QRS10a module.
Check the results (Figure 21):
- New QRS output is displayed (green).
- Rejected QRS complexes are stored in the Abnormal detections output of QRS10a and removed from the QRS output used to trigger ECG51a.
Remove noise and artifact detected as QRS complexes using Signal-to-Noise Ratio (SNR) parameters
On Figure 24, ECG signal and detected QRS complexes are displayed on the upper graph. QRS Signal-to-Noise Ratio output is displayed on the lower graph.
Noisy QRS can be rejected from the QRS output using the SNR parameters of QRS10a Discrimination tab.
Tip!
To check the threshold is appropriate for the whole signal, add a horizontal line on the display by double-clicking on the Y-axis (Figure 23).
Apply a Low threshold equal to 4 (in this example) for the SNR (Figure 25).
Recalculate the module.
Advanced Tutorials>Calibration
Published on O ctober 27, 2011
43/60
My NOTOCORD - User Manual - Printed on 28-Oct-11
NOTOCORD Systems
Check the results on Figure 26:
- New QRS output is displayed (green).
- Rejected QRS complexes are stored in the Abnormal detections output of QRS10a and removed from the QRS output used to trigger ECG51a analysis.
Limit analysis to a specific zone of interest
On Figure 27, ECG signal and detected QRS complexes are displayed on the upper graph. QRS Amplitude and QRS Signal-to-Noise Ratio outputs are displayed
on the lower graphs.
If your ECG51a analysis should be performed on a specific zone of interest, you can recalculate the QRS10a module on this zone alone.
Click on Insert a vertical zone and place the analysis zone.
Right-click on the zone. Select the Properties option and set the zone width and onset.
Select Recalculate parameters to recalculate QRS10a module on the zone alone.
Warning: calculations outside this zone will be lost (except for calculations of earlier zones).
New QRS output is displayed (green) and can be used to trigger ECG51a.
Tips!
Several zones can be calculated successively with an automated module such as QRS10a. See example on Figure 29. When recalculating a new zone, two
cases may arise:
- If the recalculation zone overlaps an existing calculation zone, then previous data are deleted and replaced.
- If calculation zones do not overlap, then the existing data located before the new zone are saved while the existing data located after the new zone are deleted.
Advanced Tutorials>Calibration
Published on O ctober 27, 2011
44/60
My NOTOCORD - User Manual - Printed on 28-Oct-11
NOTOCORD Systems
► If you need to run the analysis from the Baseline marker, you can recalculate the QRS10a module from the time of the Baseline marker. For instance, on Figure
30, QRS10a recalculation starts 2700 seconds after the beginning of file.
Add/remove a reference beat
Add a reference beat
⇒ When do you add a reference beat?
When you notice that a zone of interest was not analyzed, or not correctly analyzed.
Warning: Adding a reference beat may increase coverage locally, but may decrease coverage in other areas, in which the previous set of reference beats was
more appropriate. Therefore, adding a reference beat is not recommended for improving global coverage.
⇒ How do you add reference beats?
- Display the beat of interest in the 2D Editor view,
- Right-click on the chart and select Set as reference beat.
⇒ What is the consequence on reference beat numbering?
Reference beats identification numbers are updated according to the chronological order of their occurrence. See Figure 31.
Remove a reference beat
⇒ When do you need to remove a reference beat?
This option may be useful when
- a reference beat is identified on a beat where manual positioning of fiducial points is difficult or not possible,
- several reference beats are detected in a noisy zone that is not really of interest to you.
⇒ How do you remove a reference beat?
- In the 2D Editor view, display the reference beat you want to remove,
- Right-click on the chart and select Remove reference beat.
⇒ What is the consequence on reference beat numbering?
Reference beats identification numbers are updated according to the chronological order of their occurrence. See Figure 31.
Find the origin of an interval instability
The non-synchronized continuous display shows calculated data, such as interval durations. It is useful to observe potential drug effects and monitor data quality.
Instability on QRS: duration data is circled on Figure 32.
Advanced Tutorials>Calibration
Published on O ctober 27, 2011
45/60
My NOTOCORD - User Manual - Printed on 28-Oct-11
NOTOCORD Systems
Check if this instability comes from an incorrect reference beat marking:
Right-click on the area of interest.
Select Show left reference beat or Show right reference beat . Identification numbers of the left and right reference beats are indicated in brackets.
Check reference beats marking on the 2D Editor chart.
In the example above (Figure 33), QRS: duration interval instability is explained by QRS: End incorrect manual marking on reference beat #7.
Move the QRS: End mark to the correct position towards the right end side.
Run the signal analysis again. See the results on Figure 34.
Advanced Tutorials>Calibration
Published on O ctober 27, 2011
46/60
My NOTOCORD - User Manual - Printed on 28-Oct-11
NOTOCORD Systems
Excel®: Time-matched extraction wizard
How to use the Time-matched extraction wizard in Microsoft Excel®
Table of Contents
1. Overview
2. Exact matching mode
3. Time-matching window mode
The time-matched extraction wizard function has been added to NOTOCORD-hem in March 2009 and is available with version 4.2.0.230 onwards.
Overview
The time-matched extraction wizard allows the extraction of data related to a range of reference time points. Time is always the reference and the data can be of
the following types: values, durations and counts.
There are two possible extraction modes:
Exact matching: the software retrieves the data at the exact time defined by the reference time point.
Application example: Beat to beat analysis
Eg: The range of reference time points is defined by the R peaks and the selected data is QT duration. The extraction wizard retrieves the QT interval value related
to each R peak. If there is a detection issue (eg: no T-end detected), then cell data for the QT interval shows N/A.
Time matching window: the software retrieves the data in a time window specified by the user (in second, before and after the reference time point).
There are 4 options for result display:
First value: provides the first value in the specified time window.
Last value: provides the last value in the specified time window.
Closest value: provides the closest value to the reference time given.
Mean of value : provides the mean of all value available in the specified time window.
Exact matching mode
The wizard function uses the same principle as the standard extraction.
1.
2.
3.
4.
Extract your range of reference time points.
Select the file and data you want to extract.
To define the reference time points: select in the Excel® table the time range for which related data will be extracted (ensure the whole range is selected).
Choose the output type (value, duration or count).
Time-matching window mode
1. Unselect the Exact matching option, and fill in the Parameters of time-matching window.
2. Define the search window by giving the duration before and after the reference time.
3. Select the computation method (First value by default).
Advanced Tutorials>Excel®: Time-matched extraction wizard
Published on O ctober 27, 2011
47/60
My NOTOCORD - User Manual - Printed on 28-Oct-11
Advanced Tutorials>PV Loop
NOTOCORD Systems
Published on O ctober 27, 2011
48/60
My NOTOCORD - User Manual - Printed on 28-Oct-11
NOTOCORD Systems
PV Loop
Guidelines on volume signal management and Baan's equation application
Table of Contents
1.
2.
3.
4.
Introduction
Volume signals connection to PVL10l module
Baan’s equation application
References
Introduction
This tutorial provides guidelines on volume signals management and Baan’s equation application. As a general rule for any module, recalculation must be done
after each step in order to analyze the right volume signal.
Volume signals connection to PVL10l module
Connection of n volume signals to the PVL10l volume input is achieved using n-1 OPR10a modules (simple arithmetic operation between 2 signals). For
example, 4 OPR10a modules are needed to connect all volume signals from a 5-segments catheter (Figure 1). By default, OPR10a is suitable for summing up all
segment volumes without causing any change in the properties window.
Before using all segments to estimate the ventricular volume, we suggest verifying that: 1) all segments provide a real volume measurement, and 2) segment
volumes are synchronized. If these two requirements are not met, the catheter might have to be moved and / or the segment excluded from the ventricular volume
calculation.
Baan’s equation application
Parallel volume removal
Two methods exist to remove parallel volume from signal volume:
- One for one-segment catheters only,
- One for one-segment and multi-segment catheters.
One-segment volume catheter
After computation, the parallel volume is directly entered as an offset in the calibration window. Zone 1 and 2 standard measures are modified by subtracting
parallel volume from current standard measures (Figure 2).
One or multi-segments catheter
The parallel volume cannot be applied as an offset in the calibration window for multi-segments catheters. An additional OPR10a module has to be inserted
between the last OPR10a module (used to sum up all segment volumes) and the PVL10l module (Figure 3).
Advanced Tutorials>PV Loop
Published on O ctober 27, 2011
49/60
My NOTOCORD - User Manual - Printed on 28-Oct-11
NOTOCORD Systems
The parallel volume must then be subtracted by inserting its value as coefficient b in the OPR10a properties window (Figure 4).
Field correction factor application
As the electrical field for measuring conductance is not uniform [1], a field correction factor α must be applied to extract the true ventricular volume, following
Baan’s equation: V= 1/α x ρL² (G measured - G parallel)
- V is the ventricular volume
- α is the field correction factor
- ρ is the blood resistivity
- L is the length between the sensing electrodes
- G is the conductance
If α is commonly assumed around 1 for a one-segment catheter (and therefore for small animals), a multi-segments catheter actually requires to estimate this
correction factor.
The α field correction factor is assessed, during a ventricular steady-state, as the ratio between the Stroke Volume (SV) estimated with the multi-segment catheter
(and therefore PVL10l module) and the SV estimated with another measurement technique (i.e. blood flowmeter, thermodilution…) [2].
SV values in PVL10l module are displayed in the table at the bottom right corner after validation of the steady-state zone (Figure 5).
For other measurement techniques, SV is either computed directly or estimated by dividing the cardiac output by the heart rate on the same ventricular steadystate zone.
Following Baan’s equation, the ratio 1/α must be computed and then applied using OPR10a (Figure 6).
Advanced Tutorials>PV Loop
Published on O ctober 27, 2011
50/60
My NOTOCORD - User Manual - Printed on 28-Oct-11
NOTOCORD Systems
This ratio can be computed directly using the following equation: 1/α= SV other / SV PVL10l
- SV other is the stroke volume obtained using the other measurement technique
- SV PVL10l is the SV computed by PVL10l module
Then, 1/α must be inserted in the OPR10a module properties window as coefficient a (Figure 7).
References
[1] Baan J, Van der Velde ET, de Bruin HG, Smeenk GJ, Koops J, van Dijk AD, Temmerman D, Senden J and Buis B. Continuous measurement of left ventricular
volume in animals and humans by conductance catheter. Circulation 1984;70:812-823.
[2] Feldman MD, Erikson JM, Mao YI, Korcarz CE, Lang RM, and Freeman GL. Validation of a mouse conductance system to determine LV volume: comparison to
echocardiography and crystals. American Journal of Physiology & Heart Circulation Physiology 2000;279:H1698-H1707.
Advanced Tutorials>PV Loop
Published on O ctober 27, 2011
51/60
My NOTOCORD - User Manual - Printed on 28-Oct-11
NOTOCORD Systems
Appendix
Error index
Error messages encountered when using our modules and applications and related causes
Table of Contents
1.
2.
3.
4.
5.
6.
7.
8.
9.
10.
11.
12.
13.
14.
BUX10a
ECG31p
ECG51a
EEG10a
License Management
MPI10a
PVL10l
PVL10s
QRS10a
TMS31a
VIV10a
VME10v
VSH10a/b
XYD30a
Please find below error messages displayed when using NOTOCORD-hem and modules ("message / cause" table),
This list is not exhaustive and will be updated as new error messages or outputs are listed.
BUX10a
Message
Cause
Observations
No Buxco device detected. Please check your
hardware setup and your license.
Absence of any Buxco device or of an
appropriate license.
The Buxco device is already in acquisition with
different sampling frequencies. Click here to
apply the same sampling frequencies to this
configuration.
The Buxco device is already used by another The OK button applies the
sampling rates of the server
acquisition server with different sampling
already in acquisition to the
frequencies.
selected acquisition server.
This configuration requires a Buxco device not The serial number of the device in the
detected on this computer. Click here to change loaded configuration does not match the
the configuration.
number of the device currently connected.
All settings are disabled.
The OK button opens the
properties window.
ECG31p
In the presence of a QRS Detection Error marker, the RR interval duration between the two valid QRS complexes before and after the marker will not be
computed. In addition, no P: Start and T: End points will be positioned between the second R-peaks preceding and following the QRS Detection Error
marker.
In the presence of an Abnormal Beat marker, the RR interval duration between the current and the preceding R: Peak points will not be computed. In
addition, no P: Start and T: End points will be positioned the second R-peaks preceding and following the QRS Detection Error marker.
In the presence of a T/P Overlap marker on the current R: Peak, no P: Start and T: End points will be positioned between this R: Peak and the preceding
one. The QT interval of the preceding beat and PR interval of the current beat will not computed.
ECG51a
Message
Cause
Changes are being made. They will become effective after the Reference beats, marks, properties parameters, ECG input or
trigger input have changed since the last Signal analysis. Output
next signal analysis.
results may not be consistent with the current state of the module.
The number of beats to display is too low to overview the
whole signal. The display will be set to 1/1000.
The message appears when clicking on Signal overview if the N
Beats would imply the parameter Display 1/n to be higher than
1000. Then, the parameter n is set at 1000
ECG input frequency must be between 100 Hz and 5000 Hz.
Identify reference beats, Apply marking or Analyze signal were
run with an input ECG signal outside of the supported acquisition
frequency range.
No data on x input.
Both the ECG and the QRS inputs must be connected, since they
are mandatory inputs.
QT duration Min parameter must be lower than QT duration
Max parameter.
QT duration parameters in the Algorithm tab of the properties
window are invalid.
PR duration Min parameter must be lower than PR duration
Max parameter.
PR duration parameters in the Algorithm tab of the properties
window are invalid.
Typical R wave duration parameter must be lower than PR
duration Min parameter.
Typical R wave duration parameter or PR duration Min parameter
is invalid.
Duplicated shortcut.
Several marks have similar shortcut in the Marks tab of the
properties window.
The name of a mark is missing.
Aname must be defined for each mark, in the Calculated data tab
of the properties window.
The name of a calculated data is missing.
Aname must be defined for each calculated data, in the
Calculated data tab of the properties window.
Operation field of x output is empty.
The type of operation must be set for each data in the operation
field of the Calculated data tab in the properties window.
Each data is defined using two marks and both marks must be
Appendix>Error index
Published on O ctober 27, 2011
52/60
My NOTOCORD - User Manual - Printed on 28-Oct-11
Mark x field of y output is empty.
NOTOCORD Systems
indicated for each data in the Calculated data tab of the properties
window.
EEG10a
Message
Cause
Maximum frequency must be greater than minimum
frequency for Band Name band.
For one of the activated rhythms, the minimum frequency is above
the maximum frequency.
SubBand Name subband frequency must be defined within
the frequency range of Band Name band.
For one of the activated sub-rhythms, the minimum or the
maximum frequency is out of the defined domain of the
corresponding rhythm.
License Management
Message
Cause
License installation from floppy disk is not compatible with the Clicking on Install with floppy disk as a source but tokens from a
existing license on your computer.
.lic file (electronic license) are also activated on this computer.
License installation from file is not compatible with the existing Clicking on Install with .lic file as a source but floppy disk tokens
license on your computer.
are also activated on this computer.
Uninstallation failed. Please contact Notocord support.
Uninstalling key could not be achieved when clicking on Uninstall.
Invalid activation key. Please enter it again.
Clicking on Activate but the key is invalid.
An activation key could not be generated for this license.
Please contact Notocord support.
Clicking on Get key via Internet but a key cannot be generated by
NOTOCORD Web Service (license already activated or nonexistent license number).
An error has occurred during the connection to Notocord
server. Please try again later.
Clicking on Get key via Internet but the NOTOCORD Web Service
connection fails.
The uninstall information could not be sent to your Notocord
Sales Representative. Please contact Notocord support and
send the uninstall information.
Sending uninstall information but the uninstall key is not validated
by Notocord Web Service (non-existent license, wrong key
number).
The same license number is already installed on this
computer.
Clicking on Install but a license with the same number is already
installed on the computer.
The selected file is not compatible with license installation
from file.
Selecting a token file from a floppy disk during an electronic
license installation.
The selected license is invalid.
Selecting a token file with an invalid license (not expired).
The selected license has expired since %s.
Selecting a token file with an expired license.
MPI10a
Error management: messages are generated in Matlab in order to alert the user of unexpected conditions detected when running a function. The syntax of the
messages is compliant with standard Matlab error messages syntax for functions.
Message
Cause
MPI10a license not found.
MPI10a token is not present or activated.
GLP file modification not allowed.
Attempt to write in a GLP file.
"filename" file not found.
The specified NOTOCORD-hem filename does not exist.
Unable to open file "filename".
NsGetDataInfo, NsGetData: source filename does not exist .
NsSetData: destination filename is open and needs to be
close in order to write data in it.
No "Modulename.streamname" stream in "filename" file.
The name of the specified data stream is not correct.
Stream type not accepted.
The stream type specified in input is not supported.
NOTOCORD-hem stream overwriting not allowed.
It is not possible to add or overwrite data streams belonging to
NOTOCORD-hem native modules.
Stream type change not allowed.
Stream type cannot be modified.
Invalid number of input arguments.
Not enough or too many input arguments.
Invalid number of output arguments.
Not enough or too many output arguments.
Invalid input parameter: …
One of the input arguments does not have the correct type. A
message identifying the cause follows.
Internal error.
Not related to any of the above or to any Matlab errors. An entry
in the Notocord log file is generated.
PVL10l
Message
Cause
Please check that pressure and volume input signals are
properly connected.
One of the mandatory inputs is not connected.
Analysis zone X is not included in a single acquisition period.
Zone X is not entirely included in a single acquisition period.
Pressure and Volume input signals are not sampled at the
same rate in zone X.
Pressure and volume signals do not have the same sampling
rate on Zone X.
Appendix>Error index
Published on O ctober 27, 2011
53/60
My NOTOCORD - User Manual - Printed on 28-Oct-11
NOTOCORD Systems
Analysis zone X must include a full cycle. You may recalculate
the module and then check that the analysis zones are
properly defined.
Zone X does not have a minimum of two end-diastole data
points.
Overlapping of analysis zones is not allowed.
At least two analysis zones are overlapping.
Analysis zone X must not contain more than Y samples.
Analysis zone contains too many samples.
Sampling rate must be within 500 Hz to 10 kHz.
Inappropriate sampling rate.
The zone defined for parallel conductance volume computation
must include at least two complete cycles. You may recalculate Two complete cycles are mandatory for calculating parallel
the module and then check that the zone is properly defined
conductance volume.
and validated.
Error writing file X. Check your rights on this folder and
available disk space.
User does not have sufficient permission on the destination
folder or disk space available is not sufficient.
Error reading file X. Check your rights on this file.
User does not have sufficient permission on the source folder.
PVL10s
Message
Cause
Please check that pressure and volume input signals are
properly connected.
One of the mandatory inputs is not connected. Appears when
accepting zones definition.
Analysis zone X is not included in a single acquisition period.
Zone X is not entirely included in a single acquisition period.
Appears when accepting zones definition.
Pressure and Volume input signals are not sampled at the
same rate in zone X.
Pressure and volume signals do not have the same sampling
rate on the Zone X. Appears when accepting zones definition.
Analysis zone X must include a full cycle. You may recalculate
the module and then check that the analysis zones are
properly defined.
Cycle definition is based on end diastole detection. Zone X does
not have a minimum of two end diastole data points necessary to
proceed with the loop analysis. Appears when accepting zones
definition.
Overlapping of analysis zones is not allowed.
At least two analysis zones are overlapping. Appears when
accepting zones definition.
Analysis zone X must not contain more than Y samples.
Analysis zone contains too many samples. Appears when
accepting zones definition.
Sampling rate must be within 500 Hz to 10 kHz.
Inappropriate sampling rate. Appears when accepting zones
definition.
The zone defined for parallel conductance volume
computation must include at least two complete cycles. You
may recalculate the module and then check that the zone is
properly defined and validated.
Parallel conductance volume computation is uses the linear
regression fitting the Ved-Ves or Vmin-Vmax relationship. Two
complete cycles are therefore necessary to obtain the linear
regression.
Error writing file X. Check your rights on this folder and
available disk space.
User does not have sufficient permission on the destination
folder or there is not enough disk space available. Appears when
saving the current analysis zone as a control one (.pvl).
Error reading file X. Check your rights on this file.
User does not have sufficient permission on the source folder.
Appears when loading a control file (.pvl) in the .nss file.
QRS10a
Error codes for Abnormal detections output.
Error code #
Exclusion origin
0
Events excluded by algorithm.
1
QRS amplitude Low threshold has not been reached.
2
QRS amplitude High threshold has been crossed.
3
Signal-to-Noise Ratio Low threshold has not been reached.
4
Signal-to-Noise Ratio High threshold has been crossed.
TMS31a
Message
Cause
Cannot launch TMS server! Check acquisition hardware and
software setup.
When inserting the module in the configuration window with no
TMS device currently connected.
The offset must be within … - … (mV).
Offset exceeds limit values defined by the signal type and range.
VIV10a
Message
Cause
LifeShirt device defined in the configuration of the module is not
This configuration requires the <LifeShirt name> LifeShirt that available.
is not available.
Calibrate and OK buttons are grayed. This message disappears
when an available device is selected in the combo box.
No LifeShirt defined on this computer.
No LifeShirt device has been configured on this machine.
Unable to perform. Calibration of another LifeShirt is in
progress.
Another calibration is in progress and has to be completed before
the launch of the calibration process for another Lifeshirt.
For the selected LifeShirt, the configuration of the channel in the
Appendix>Error index
Published on O ctober 27, 2011
54/60
My NOTOCORD - User Manual - Printed on 28-Oct-11
NOTOCORD Systems
LifeShirt is in acquisition with a different calibration. Click here current NOTOCORD-hem session is different from the
to get the calibration from the acquisition.
configuration of the same channel currently in acquisition in
another NOTOCORD-hem session.
VME10v
Message
Cause
The reference marker was not found.
The number of the marker does not exist.
The Markers input not connected.
The Event Marker signal is not connected in input.
The beginning of the zone does not belong to an acquisition
period.
Reference time (or position of marker) and Offset are outside or
not in the same acquisition period. The zone must belong to the
same acquisition period.
The beginning and the end of the zone do not belong to the
same acquisition period.
Reference time (or position of marker), Offset and computed end
time are outside or not in the same acquisition period. The zone
must belong to the same acquisition period.
Not enough R peaks detected to define zone.
The number of R peaks between the boundaries of the zone is
not greater than the number of beats requested + 2.
Zone duration not defined.
The duration of the requested zone is 0 or the start time is equal
to end time.
No input signal detected (Input not connected or no
acquisition period).
No signal is connected to the first input of the module or no
acquisition has yet been made.
The zone is invalidated.
The position or duration of a validated zone has been modified.
VSH10a/b
Message
Cause
No VSH card detected. Check license and hardware setup.
No video card or appropriate license is detected.
All settings are disabled.
This channel is being recorded with different settings. Click
here to apply recording settings.
This channel is being recorded with different settings. Click here
to apply recording settings.
VSH08a card and VSH10b license are required for this
configuration.
The number of channels exceeds the license permission (only
for VSH10a). The OK button is disabled.
XYD30a
Message
Cause
Writing to file F failed. Check your rights and available disk
space on this folder.
User does not have sufficient permission on the destination folder
or there is not enough disk space available. Appears when saving
the current analysis zone as a control one (.xyd).
Reading file F failed. Check your rights on this file.
User does not have sufficient permission on the source folder.
Appears when loading a control file (.xyd) in the .nss file.
Next module
Appendix>Error index
Published on O ctober 27, 2011
55/60
My NOTOCORD - User Manual - Printed on 28-Oct-11
NOTOCORD Systems
Shortcuts in NOTOCORD-hem
List of shortcuts
Table of Contents
1.
2.
3.
4.
5.
6.
Main window
Configuration Setup window
CTD60a/v
ECG51a
KBD30a
VME10e/v
Main window
Shortcut
Action
Ctrl + Space bar
Switches from Main window to Configuration Setup window (and vice-versa)
Ctrl + A
Starts / Stops acquisition
Ctrl + R
Recalculates
Alt + F
Opens File menu
Alt + E
Opens Edit menu
Alt + A
Opens Acquisition menu
Alt + T
Opens Tools menu
Alt + W
Opens Windows menu
Alt + H
Opens Help menu
Ctrl + N
Creates new file
Ctrl + O
Opens file browser
Ctrl + P
Prints
Esc
Closes window (e.g. Properties window, Recalculate window, etc.)
Alt + F4
Closes NOTOCORD-hem
Configuration Setup window
Shortcut
Del
Action
Deletes selected module(s)
CTD60a/v
Shortcut
Action
Ctrl + S
Activates Scrolling function
Ctrl + F on graph
Displays the selected graph on full screen / Tiles graphs in the selected display
Ctrl + drag & drop on graph
Horizontal zoom-in
Shift + drag & drop on graph
Vertical zoom-in
Ctrl + Shift + drag & drop on graph
Zoom-in on a selected signal region
Ctrl + drag & drop on X-axis
Expands / Compress X-axis
Ctrl + Right arrow
Expands X-axis
Ctrl + Left arrow
Compresses X-axis
Ctrl + Up arrow
Expands Y-axis
Ctrl + Down arrow
Compresses Y-axis
Ctrl + X on graph
Changes X-axis scale to show whole signal
Ctrl + X on graph
Changes Y-axis scale to show whole signal
Right arrow
Navigates forward on X-axis
Left arrow
Navigates backwards on X-axis
Up arrow on graph / Y-axis
Navigates upward on Y-axis
Down arrow on graph / Y-axis
Navigates downward on Y-axis
Shift + Right arrow or Left arrow
Navigates on X-axis by as much as the scale range defined in the Graph
properties window
Shift + Up arrow or Down arrow on graph / Y- Navigates on Y-axis by as much as the scale range defined in the Graph
axis
properties window
Shift + F3
Adjusts graphs to window display size
Shift + F4
Tiles displays horizontally
Shift + F5
Tiles displays vertically
ECG51a
Appendix>Shortcuts in NO TO CO RD-hem
Published on O ctober 27, 2011
56/60
My NOTOCORD - User Manual - Printed on 28-Oct-11
NOTOCORD Systems
Shortcut
Action
Ctrl + click on beat
Selects beat of interest on graph
Ctrl + double-click on beat
Selects beat of interest and brings it to front
P
Inserts P: Start mark at cursor position
Q
Inserts QRS: Start mark at cursor position
R
Inserts R: Peak mark at cursor position
S
Inserts QRS: End mark at cursor position
T
Inserts T: End mark at cursor position
Ctrl + M
Applies marking to active reference beat (from all marked reference beats)
Ctrl + click on Apply
marking button
Activates Marking mode. Marks are applied to reference beats as they become active
Ctrl + Z
General undo for mark editing and X/Y zoom
Ctrl + Del
Deletes all marks on all reference beats
Right arrow
Goes N beats forward (N= number of beats displayed in 3D View of 2D/3D chart)
Left arrow
Goes N beats backwards (N= number of beats displayed in 3D View of 2D/3D chart)
Up arrow
Goes to previous reference beat
Down arrow
Goes to next reference beat
Page up
Goes n x N beats forward (n= value of "display 1/n" parameter and N= number of beats displayed in
3D View of 2D/3D chart)
Page down
Goes n x N beats backwards (n= value of "display 1/n" parameter and N= number of beats
displayed in 3D View of 2D/3D chart)
Begin
Goes to first QRS trigger of the signal
End
Goes to last QRS trigger of the signal
+
3D zoom-in centered on cursor position
-
3D zoom-out centered on cursor position
KBD30a
Shortcut
Action
F1 to F8
Inserts marker on related marker channel
F9
Inserts non-specific marker
Ctrl + M
Navigate from one marker to the next one belonging to the same marker channel
Ctrl + Shift + M
Navigate from one marker to the previous one belonging to the same marker channel
VME10e/v
Shortcut
Action
P
Inserts P: Start mark at cursor position
Q
Inserts QRS: Start mark at cursor position
R
Inserts R: Peak mark at cursor position
S
Inserts QRS: End mark at cursor position
T
Inserts T: End mark at cursor position
Appendix>Shortcuts in NO TO CO RD-hem
Published on O ctober 27, 2011
57/60
My NOTOCORD - User Manual - Printed on 28-Oct-11
NOTOCORD Systems
Old user manuals
User manuals related to older NOTOCORD-hem versions are available below:
- 3.5 (2003) version
- 4.2 (2007) version
3.5 (2003) version
User manual of the NOTOCORD-hem 3.5 version (2003)
O ld user manuals>3.5 (2003) version
Published on O ctober 27, 2011
58/60
My NOTOCORD - User Manual - Printed on 28-Oct-11
NOTOCORD Systems
4.2 (2007) version
4.2 (2007) version
O ld user manuals>4.2 (2007) version
Published on O ctober 27, 2011
59/60
My NOTOCORD - User Manual - Printed on 28-Oct-11
NOTOCORD Systems
Source URL (retrieved on October 28, 2011): http://my.notocord.com/node/2
O ld user manuals>4.2 (2007) version
Published on O ctober 27, 2011
60/60