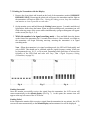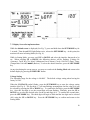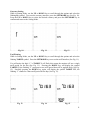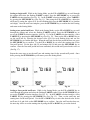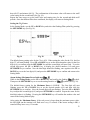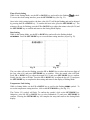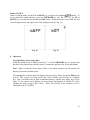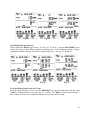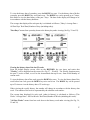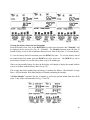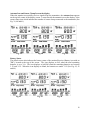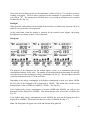
1
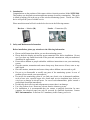
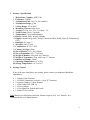
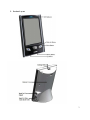
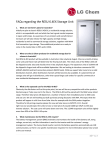
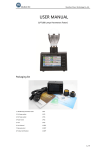
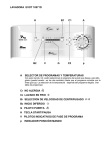
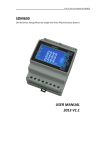
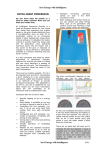
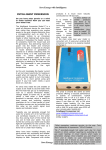
MTP INSTRUCTION MANUAL Wireless Electricity Monitor Model MTP-3100 MTP Instruments Inc. Table of Content 1. Introduction Page 1 2. Safety and Maintenance Information Page 1 3. Features / Specifications Page 2 4. Package Content Page 2 5. Product Layout Page 3 6. Display Screen Information and Clearing Data Page 4 7. 7.1 7.2 7.3 Installation / Set-up Installation of Sensor Clamp Linking the Transmitter with the Display Display Screen Set-up Instructions Page 5 Page 5 Page 9 Page 10 8 Operation Page 15 9 Frequently Asked Questions Page 21 1. Introduction Congratulations on the purchase of this smart wireless electricity monitor, Model MTP-3100. This product was designed to monitor and better manage electricity consumption. This guide is aimed at helping you in the set-up of the wireless monitoring system. Careful use of this device will provide years of reliable service Please note this manual will refer to the below devices in the following manner: Receiver = Monitor (M) Sender = Transmitter (T) 2. Safety and Maintenance Information Before installation, please pay attention to the following information: Please read all instructions before you use the monitoring system. Please shake the display unit and the power transmitter first, before installation. Do not use if you hear any sound from inside of the parts and communicate with your authorized distributor for replacement. Do not allow children or people unfamiliar with these instructions to use your monitoring system. Keep the monitor, transmitter and sensor clamp away from sources of heat, water or any other liquid. Place the monitor, transmitter and sensor clamp where children can not touch or pull. Do not try to disassemble or modify any parts of the monitoring system. In case of problem, please consult your representative. Do not use the monitoring system if you find your electric wire in abnormal condition, such as loose wire, exposed copper wire, burnt mark on wire insulation layer, holes on wire layer or damage on electric meter. In case of such abnormalities, please consult a professional electrician immediately. Periodically check all wires and components to ensure there is no damage. Use a dry cloth to clean. Do not use solvent, abrasive cleaners or water. For installation, it is recommended that you contact a qualified electrician. In some countries, the electrical panel can only be accessed by qualified electricians. Contact MTP Instruments Inc. to find out if it’s mandatory in the country you live in. 1 3. Features / Specifications 1. Model Name / Number: MTP-3100 2. Frequency: 433MHz 3. Transmission Time: 10s, 15s, 20s (settable) 4. Transmission Range: ≤70m 5. Voltage Range: 90V to 600V 6. Measuring Current: 100A (max) 7. Accuracy: 0.15A-1A ± 30% / 1A-100A ± 7% 8. Tariff Periods: Three (3) periods 9. Temperature: Celsius and Fahrenheit 10. History: Instant, Daily, Weekly, Monthly 11. Display: Instant Energy (kW), Energy Consumed (kWh), Dollar Value ($), Pollution (kg. CO2) Backlight: See page 17 Warranty: One (1) year 12. Certifications: IC, FCC, ETL 13. Country of Origin: China 14. Size of Monitor: 145 x 109 x 60mm 15. Size of Transmitter: 92 x 72 x 43mm 16. Weight of Monitor: 300g with "AA" batteries 17. Weight of Transmitter: 320g with 2 type "C" batteries 18. Diameter of Clamps: 18mm 19. Operating Temperature: 0°C to 50°C 20. Storage Temperature: -10°C to 50°C 4. Package Content If any of the parts listed below are missing, please contact your authorized distributor immediately. 1 x Display Unit (Monitor) 1 x Wireless Transmitter (includes x 2 type "C" batteries) 2 x Sensor Clamps w/ 18mm diameter 1 x Data Cable RJ45-USB 3m 1 x Power Adapter 1 x User Manual in English and French 1 x Mini CD for Software Note: Batteries for Monitor not included. Monitor requires (x03) “AA” batteries. It is recommended to use Lithium batteries. 2 5. Product Layout 3 6. Display Screen Information and Clearing Data Soon after successfully pairing the monitor and transmitter, the LCD screen will automatically return to the default display. Furthermore, when there is no button operation (for a period of time), the LCD screen will automatically return to the default screen. Below is an example of the default LCD screen. 4 Resetting and Data Clearance When the default screen is displayed, simultaneously press and hold down the SET/MODE and HISTORY keys. The full LCD screen will appear for 10 seconds (See Fig. 1). The red LED light will then flash. At this point, release SET/MODE and HISTORY keys. At this point, release the SET/MODE and HISTORY keys. The LED light will go on and the programming version will be displayed on the LCD screen for approximately 3 seconds (See Fig. 2). The LED light will then turn off and the LCD screen will return to the default display with no signal condition (See Fig. 3). At this point, the data contained in the memory should be cleared. Note: Resetting the memory will display the factory settings (Date: 01/01/2011 and Time: 00:00). Fig. 1 Fig. 2 Fig. 3 7. Installation / Set-up IMPORTANT: It is recommended to contact a qualified electrician for the installation of this product. 7.1 Installation of Sensor Clamp Clip the sensor clamp around the "Live Wire" of the electricity panel. The live wire is usually located behind a metal cover. (Please contact a qualified electrician). Regarding three phase supply, a third sensor clamp is needed (sold separately). Please contact MTP Instruments for additional sensors. Installing the sensor clamp to the live wire. First, push the release cap. Second, place it on the correct live wire. Third, close the sensor clamp. Finally, ensure that the sensor clamp(s) is/are plugged into the transmitter. 5 Note: It is normal when installing the (detachable) sensor clamp on a live wire, that the sensor emits a vibrating sound when it is not plugged into the transmitter. Once the sensor is connected to the live wire and plugged to the transmitter, the vibrating sound will cease. Note: Detachable sensor clamp can be plugged into any of the two inputs of the transmitter, when making connection. To ensure that the connection of the sensor clamp is successful, verify if the sensor clamp symbol is displayed on the top left corner of the monitor (eg. if two sensors are connected, the monitor should display two sensor clamp symbols). 6 IMPORTANT NOTICE: Please contact a qualified electrician to carry out the installation. We will not be held responsible for damage as a result of a wrong connection. Please note that monitor displays the Apparent Power (VA) and not the Active Power (watts). Installation on standard 200A panel Unscrew the four corners to remove the electrical panel protection cover. Fit the two enclosed 100A clip-on sensors (sensors are suitable for use with wire diameters up to 18mm) to the live feed cables of the electrical panel. Insert each jack on the end of the white wire into any of the input sockets of the transmitter. The clip-on sensor acts as a current sensor and relays the current being drawn into the home to the transmitter. From there, it is sent wirelessly to the monitor display unit. Link the transmitter to the monitor. Please refer to the instructions on page 9 of the instruction manual. (Ensure three AA batteries are inserted in the transmitter and the display unit). Transmitter Please refer to pages 10 to 15 for set-up of the monitor. IMPORTANT : Select 120V as reference voltage Information is displayed on the monitor. Please refer to pages 15 to 20 of this instruction manual. Please note that monitor displays the Apparent Power (VA) and not the Active Power (watts). 7 Installation on a 3 phase 3 wire system L1 Install the two enclosed sensors (100A), as indicated on diagram 1 (phase 1 and phase 3). Connect the two heavy duty sensors to the transmitter. Insert each jack on the end of the white wire into any of the input sockets of the transmitter. The clip-on sensor acts as a current sensor and relays the current being drawn into the home to the transmitter. L2 Link the transmitter to the monitor. Please refer to the instructions on page 9 of the instruction manual. (Ensure three AA batteries are inserted in the transmitter and the display unit). Please refer to pages 10 to 15 for monitor set-up. L3 Diagram 1 IMPORTANT: The reference voltage is equal to the voltage between phase 1 and phase 3, divided by 1.732 (Ex. If voltage between phase 1 and 3 is 600V, the reference voltage will therefore be 600 / 1.732 = 347V). Please refer to instructions of pages 15 to 20 for display of information on the monitor. Installation on a 3 phase 4 wire system L1 Install three sensors (100A), as indicated on diagram 2. Connect the three heavy duty sensors to the transmitter. Insert each jack on the end of the white wire into any of the input sockets of the transmitter. The clip-on sensor acts as a current sensor and relays the current being drawn into the home to the transmitter. Neutral Link the transmitter to the monitor. Please refer to the instructions on page 9 of the instruction manual. (Ensure three AA batteries are inserted in the transmitter and the display unit). Please refer to pages 10 to 15 for monitor set-up. L2 L3 IMPORTANT: The reference voltage is equal to the voltage of NEUTRAL-PHASE (ex: 600V NEUTRAL-PHASE system = 347V). Please refer to pages 15 to 20 for display of information on the monitor. Diagram 2 IMPORTANT NOTICE: Please contact a qualified electrician to carry out the installation. We will not be held responsible for damage as a result of a wrong connection. Please note that monitor displays the Apparent Power (VA) and not the Active Power (watts). 8 7.2 Linking the Transmitter with the Display 1. Remove the clear plastic tab located on the back of the transmitter (marked: REMOVE BEFORE USING). Removing the plastic tab will power the transmitter and the light on the transmitter will begin to flash. Note : During the linking process, keep the transmitter and monitor as close as possible to each other. 2. On the monitor, press and hold down the Linking button (approx. 5 seconds) until the red light flashes, then release the button. When in signal searching mode, an antenna icon will flash at the top corner of the screen while simultaneously a progress histogram will appear on the screen (See Fig. 4, 5, 6). 3. While the monitor is in signal searching mode… Press and hold down the button on the front of the transmitter for 15 seconds, then release it. Once released, a red light on the transmitter will begin flickering non-stop, meaning the transmitter is in signal searching mode. Note : When the transmitter is in signal searching mode, the LED will flash rapidly and only in RED. This should not be confused with the ‘signal frequency setting’ which can be programmed every 10, 15, or 20 seconds. Depending which preference is selected, the frequency of the LED flash and color will vary ( See : Signal Frequency Setting (Transmitter) on page 21). Fig. 4 Fig. 5 Fig. 6 Linking Successful Once the monitor successfully receives the signal from the transmitter, the LCD screen will return automatically to the default display (See Fig. 7). At this point, the antenna icon will appear at the top left corner of the LCD screen. Linking Failed In the situation the monitor fails to acquire a signal from the transmitter (in one minute), the LCD screen will return automatically to the default display and no antenna icon will be displayed. 9 Fig. 7 Fig. 8 Fig. 9 7.3 Display Screen Set-up Instructions While the default screen is displayed (See Fig. 7), press and hold down the SET/MODE key for 3 seconds. Then the red LED light flashes twice, release the SET/MODE key. At this point, the monitor will enter in Setting Mode (See Fig. 8). While in Setting Mode, you may scroll UP or DOWN and select the interface that needs to be set. When scrolling UP or DOWN, the following choices will be flashing: (Voltage, Kr (Currency), Tariff, Kg CO2, Max.P (Maximum Power Alarm), Clock, 01/01/2011 (Date), Temp. (Temperature Unit and "bOFF" (Buzzer). To select the desired interface, press the SET/MODE key. At any time during the set-up process, you may save and exit the Setting Mode and return to the default display by pressing the HISTORY button. Voltage Setting The adjustable range for the voltage is 90-600V. The default voltage setting when leaving the factory is 120V. When the VOLTAGE symbol flashes, press the SET/MODE key to enter the voltage setting interface (See Fig. 9). The first digit “1” will start flashing meaning that the first value (0-6) can be selected by pressing the UP or DOWN key. To confirm the first digit, press the SET/MODE key. Once the first digit is set, the second digit will start flashing. Similarly, press the UP or DOWN key to select the desired value for the second digit (0-9). To confirm the second value, press the SET/MODE key. The third digit will begin to flash and the last digit can be selected (0-9) using the UP or DOWN key. Press the SET/MODE key to confirm and return to the Setting Mode. 10 Currency Setting While in Setting Mode, use the UP or DOWN key to scroll through the options and select the flashing Kr symbol. To access the currency interface, press the SET/MODE key (See Fig. 10). Press the UP or DOWN key to select the desired currency and press the SET/MODE key to confirm and return to the Setting Mode. Fig. 10 Fig. 11 Fig. 12 Tariff Setting While in Setting Mode, use the UP or DOWN key to scroll through the options and select the flashing TARIFF symbol. Press the SET/MODE key to access the tariff interface (See Fig. 11). You will notice the digit “1” of TARIFF 1 will flash, this means the monitor will use a single tariff period for the day (See Fig. 11). Pressing the DOWN key will display the symbol TARIFF 12, the flashing “2” represents a two tariff period that will be applied daily (See Fig. 12). Similarly pressing the DOWN key again, will display the symbol TARIFF 123, the flashing “3” stands for a three tariff period for the day (See Fig. 13). Fig. 13 Fig. 14 Fig. 15 11 Setting a single tariff: While in the Setting Mode, use the UP or DOWN key to scroll through the options and select the flashing TARIFF symbol. Press the SET/MODE key to access the TARIFF selection interface (See Fig. 11). In the TARIFF selection interface, select TARIFF 1 by pressing the SET/MODE key (See Fig. 11). Then using the UP or DOWN key, adjust the tariff rate by setting the values (0-9) for each flashing digit (use the SET/MODE key to confirm each digit). Once the tariff rate complete, press the SET/MODE key to confirm the tariff setting and return to the Setting Mode. Setting a two period tariff rate: While in the Setting Mode, use the UP or DOWN key to scroll through the options and select the flashing TARIFF symbol. Press the SET/MODE key to access the TARIFF selection interface (See Fig. 11). In the TARIFF selection interface, select TARIFF 12 by pressing the SET/MODE key (See Fig. 12). Then use the UP or DOWN key to set the tariff rate by selecting the desired value (0-9) for each flashing digit and use the SET/MODE key to confirm the digits. When the tariff rate for the first period has been set, press the SET/MODE key to confirm. Use the UP or DOWN key to select the starting time of the first tariff period. Set the hour (00-23) and minute (00-59) and press the SET/MODE key to confirm. Once the first tariff period has been confirmed, the second tariff period needs to be set (See Fig. 17). Repeat the same steps to set the tariff rate and starting time for the second tariff period. Once done, pressing the SET/MODE key will return you to the Setting Mode. Fig. 16 Fig. 17 Fig. 18 Setting a three period tariff rate: While in the Setting Mode, use the UP or DOWN key to scroll through the options and select the flashing TARIFF symbol. Press the SET/MODE key to access the TARIFF selection interface (See Fig. 11). In the TARIFF selection interface, select TARIFF 123 by pressing the SET/MODE key (See Fig. 13). Then, set the tariff rate and starting time for the tariff period. Use the UP or DOWN key to select the desired value for the tariff rate (0-9) and click on the SET-MODE key to confirm. Once the tariff rate has been set, the next step will be to set the starting time by using the UP or DOWN key to set the desired 12 hour (00-23) and minute (00-59). The confirmation of the minute value will return to the tariff value setting for the second tariff (See Fig. 18). Repeat the same steps to set the tariff value and starting time for the second and third tariff periods. Once the third tariff has been confirmed, the display will return to Setting Mode. Setting the CO2 Factor In the Setting Mode, use the UP or DOWN key and select the flashing CO2 symbol by pressing the SET/MODE key (See Fig. 19). Fig. 19 Fig. 20 Fig. 21 The default factory setting value for the CO2 is 0.54. When setting the value for the CO2, the first digit "0" will start flashing. Press UP or DOWN key to set the desired number value for the first digit (0-9), to confirm press the SET/MODE key and the second digit will now flash. To set the second digit press the UP or DOWN key to display the desired number (0-9) and press SET/MODE key to confirm. Now the third digit should be flashing, once again use the UP or DOWN key to set the last digit (0-9) and press the SET/MODE key to confirm and return to the Setting Mode. Alarm Setting (Maximum Power Indicator) While in the Setting Mode, use the UP or DOWN key and scroll to the flashing symbol. Then press the SET/MODE key to access the setting interface of symbol (See Fig. 20). The default factory setting for the Maximum Power is 9999kW. The first digit will start flashing, press the UP or DOWN key to set the desired number (0-9) and then click the SET/MODE key to confirm. Next, the second digit will start flashing. Press the UP or DOWN key to adjust the second digit (0-9) and press SET/MODE to confirm. Repeat the same for the third digit when it is flashing. Pressing the SET/MODE key will confirm the number value and return to the Setting Mode display. After setting the Maximum Power, if the real power is larger than the maximum power value, the LED light (on the monitor) will flash once every 15 seconds. If the buzzer setting is ON, a sound will beep once every 15 seconds. 13 Time (Clock) Setting While in the Setting Mode, use the UP or DOWN key and scroll to the flashing To access the clock setting interface, press the SET/MODE key (See Fig. 21). symbol. Once in the clock setting interface, the hour value (00-23) will begin flashing and can be adjusted by pressing the UP or DOWN key. To confirm the hour value, press the SET/MODE key. The minutes will now be flashing, press the UP or DOWN key to adjust the minute value (00-59) and the SET/MODE key to confirm and return to the Setting Mode display. Date Setting While in the Setting Mode, use the UP or DOWN key and scroll to the flashing default 01/01/2011. Press the SET/MODE key to access the date setting interface (as per Fig. 22). Fig. 22 Fig. 23 The year value will now be flashing, press the UP or DOWN key to select the last two digits of the year value (0-9) and press SET/MODE key to confirm. Next, the month value will flash. Press UP or DOWN key to adjust the month (01-12) and press SET/MODE key to confirm. Finally, the day value will flash. Press the UP or DOWN key to adjust the day (01-31) and press the SET/MODE key to complete the date setting and return to the display of Setting Mode. Temperature Unit Setting While in Setting Mode, use the UP or DOWN key to scroll to the flashing TEMP. symbol. To access the temperature setting interface, click on the SET/MODE key (See Fig. 23). The Celsius (ºC) symbol will flash. To confirm the symbol, click on the SET/MODE key. Otherwise, press the UP or DOWN key to select Fahrenheit (ºF) and press SET/MODE to confirm. Pressing the SET/MODE key will complete the setup and return to the Setting Mode display. 14 Buzzer ON/OFF While in Setting Mode, use the UP or DOWN key to scroll to the flashing symbol. To access the buzzer setting interface, press the SET/MODE key (See Fig. 24). Use the UP or DOWN key to switch between the ON and OFF status. When the buzzer is set to ON, the bell icon will appear on the top right corner of the display screen (See Fig. 25). Fig. 24 Fig. 25 8. Operation Viewing History and Average Data When the default screen is displayed (See Fig. 7), click the HISTORY key to view the data that have been gathered up to present time for various time periods (Day, Week and Month). Note: When viewing the history data, if there is no button operation for 20 seconds, the display will return to default screen. The Average for each time period is displayed on the top line when viewing the History (up to now). The average for a time period (Day, Week, Month) is the forecast of a complete day, week or month based on data accumulated during a smaller time frame. Eg. As per figure 27, the current week displays an accumulated consumption of 80kWh in 6 days meaning the daily average kWh is 80/6. Hence the forecast of the complete week is calculated as 80/6*7=93kWh. 15 Fig. 26 Fig. 27 Fig. 28 Switching Data Type (History) When viewing the History (up to now) – See Fig. 26, 27 and 28 – press the SET/MODE key to change the type of data history displayed amongst any of the following options: Energy consumption (kWh) Currency ($) and CO2 emission (kg CO2). (See fig. 29, 30 and 31). Fig. 29 Fig. 30 Fig. 31 View the History Data for the last 7 days From the default display screen, click the HISTORY key one time and notice that the word "Daily" will appear on the screen (See Fig. 26 – Daily). The "Daily" function stores the past 7 days of data, as well as the accumulated data up to now, from 00:00 of today. 16 To view the history data of yesterday, press the DOWN key once. For the history data of before yesterday, press the DOWN key twice and so on. The DOWN key can be pressed up to 7 times, this allows to view the data history of the past 7 days. The date on the display will change to be in accordance with the history data date. The average data displayed for each past day is calculated as follows: (Today’s Average Data + All Past Days’ Real Data)/Number of days (including today). "Past Days" means from yesterday down to the history day under viewing (See Fig. 32 and 33). Fig. 32 Fig. 33 Viewing the history data of the last 52 weeks From the default display screen, click on the HISTORY key two times and notice that "Weekly" will be displayed on the screen (See Fig. 27 – Weekly). The Weekly function stores the past 52 weeks of data, as well as the accumulated data up to now, from 00:00 Monday of current week. To view the history data of last week, press the DOWN key once. To view the history data of the week before last week, press the DOWN key twice and so on. The DOWN key can be pressed up to 52 times to view the history data of 52 weeks ago. When viewing the weekly history, the number will change in accordance with the history data week. The number of the week is represented by the calendar week number. The average data displayed for each week (when in history) is calculated as follows: (This Weeks’ Average Data + All Past Weeks’ Real Data)/Number of Weeks (including this week). "All Past Weeks" means from last week down to the history week under viewing (See Fig. 34, 35 and 36). 17 Fig. 34 Fig. 35 Fig. 36 Viewing the history data of the last 24 months From the default screen, click on the HISTORY key three times and notice that "Monthly" will be displayed on the screen (See Fig. 28 – Monthly). The Monthly function stores the past 24 months of data, as well as the accumulated data up to now from 00:00 of the 1st of current month. To view the history data of last month, press the DOWN key once. To view the history data of the month before last month, press the DOWN key twice and so on. The DOWN key can be pressed up to 24 times to view the history data of up to 24 months ago. When viewing monthly history, the date on the display will change to display the month with the year in accordance with the history data (See fig. 38). The average data for the month (when in history) is calculated as follows: (This Month’s Average Data + All Past Months’ Real Data)/Number of Months (including this month). "All Past Months" represents the last 24 months as well as the present month from time 00:00 of the 1st day of the current month (See Fig. 37 and 38). Fig. 37 Fig. 38 18 Antenna Icon and Sensor Clamp Icon on the display When the monitor successfully receives signals from the transmitter, the antenna icon appears on the top left corner of the display screen. Located beside the antenna icon on the display, is the sensor clamp icon which indicates the number of sensor clamps connected to the transmitter (See Fig. 39, 40 and 41). Fig. 39 Fig. 40 Fig. 41 Battery Status The default screen also indicates the battery status of the monitor/Receiver (Battery icon with an "M"), located at the top of the screen. The icon displays as full, when the total remaining batteries is over 3.9v. The icon displays as half-full when the remaining batteries are between 3.1V and 3.9V. When the icon displays as blank, the batteries are under 3.1V (See Fig. 42, 43 and 44). Fig. 42 Fig. 43 Fig. 44 19 Only when the total battery power for the transmitter / Sender is below 2.3V will the low battery warning icon appear. The low battery indicator for the transmitter is represented by a battery icon with an "T". The warning icon will flash once every second to remind the user to replace the batteries (See Fig. 45). Backlight When powered with batteries, the backlight of the monitor is available only between 6:00 p.m. and 8:00 a.m. when there is key operation. On the other hand, when the monitor is powered by the external power adapter, the display backlight goes on whenever there is a key operation. Histogram 45 46 47 The purpose of the histogram (on the default display screen) is to demonstrate the energy consumption tendency for the week. The number of bars displayed on the histogram for each day can range between zero (meaning no energy consumption) to five (5). The bars appear once the value has reached more than 1/3 of the real value. Depending of the energy consumption, if the highest consumption is equal to or below 10kWh, the full scale of the histogram will be displayed as 10kWh. This means that each bar in the histogram has a value of 2kWh or (10kWh/5 = 2kWh) – (See Fig. 46). If the highest daily energy consumption is between 10kWh and 100kWh, the scale on the histogram will be displayed as 100kWh. This means that the value of each bar is 20kWh (See Fig. 45). If the highest daily energy consumption exceeds 100kWh, the scale on the histogram will be displayed as 1000kWh. This means each bar has a value of 200kWh (See Fig. 47). Note: The histogram will appear once sufficient data has been gathered. 20 Signal Frequency Setting (Transmitter) To adjust the signal frequency setting, push the button located on the transmitter. Push and hold the button for 3 seconds, the LED light will change color. To change the light color again, release the button and push again for 3 seconds. Once set, the LED will flash in the selected color. The light color codes represent the following signal frequencies. Red light = 10s Blue light = 15s Blue + Red light = 20s 9. Frequently Asked Questions (FAQ) Q: How can the data stored in the receiver be cleared? A: Please refer to the section 6, Display Screen Information, on page 4 of this manual Q: What is the maximum distance the device can transmit signals? A: ≤ 70 meters Q: The transmitter and receiver do not seem to communicate with one another, what should be done? A: If the transmitter and receiver do not seem to communicate, please contact MTP Instruments at [email protected] Q: The backlight on the monitor does not always work, is there a reason? A: When powered with power adapter, the backlight goes on whenever there is key operation. When powered with batteries, the backlight is only available between 18:00 and 24:00 with key operation. Limited Warranty and Limitations of Liability MTP Instruments warrants this instrument to be free of defects in parts and workmanship for one (1) year from date of shipment. This warranty does not apply to defects resulting from action of the user such as misuse, improper wiring, operation outside of specification, improper maintenance or repair, or unauthorized modification. MTP Instruments specifically disclaims any implied warranties or merchantability or fitness for a specific purpose and will not be held liable for any direct, indirect, incidental or consequential damages. MTP Instruments total liability is limited to repair or replacement of the product. 21 Les Instruments MTP Instruments Head Office 4409 Charleroi street Montreal-North, Quebec H1H 1T6 Telephone: (514) 326-7167 Fax: (514) 326-7835 Toll Free Number: 1-888-326-7167 Web Site : www.mtpinc.com E-mail : [email protected] Distributed by :