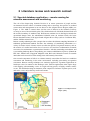
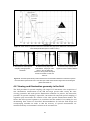
1
supervising scientist report 195 Standards for reflectance spectral measurement of temporal vegetation plots K Pfitzner, R Bartolo, G Carr, A Esparon & A Bollhöfer It is Supervising Scientist Division policy for reports in the SSR series to be reviewed as part of the publications process. This Supervising Scientist Report has been formally refereed by two external independent experts. Authors Dr Kirrilly Pfitzner – Spatial Sciences and Data Integration Group, Environmental Research Institute of the Supervising Scientist, GPO Box 461, Darwin NT 0801, Australia Dr Renée Bartolo – Spatial Sciences and Data Integration Group, Environmental Research Institute of the Supervising Scientist, GPO Box 461, Darwin NT 0801, Australia Geoff Carr – Northern Land Council, GPO Box 1222, Darwin NT, 0801, Australia (Environmental Research Institute of the Supervising Scientist at time of writing) Andrew Esparon – Spatial Sciences and Data Integration Group, Environmental Research Institute of the Supervising Scientist, GPO Box 461, Darwin NT 0801, Australia Dr Andreas Bollhöfer – Environmental Radioactivity Group, Environmental Research Institute of the Supervising Scientist, GPO Box 461, Darwin NT 0801, Australia This report should be cited as follows: Pfitzner K, Bartolo R, Carr G, Esparon A & Bollhöfer A 2011. Standards for reflectance spectral measurement of temporal vegetation plots. Supervising Scientist Report 195, Supervising Scientist, Darwin NT. The Supervising Scientist is part of the Australian Government Department of Sustainability, Environment, Water, Population and Communities © Commonwealth of Australia 2011 Supervising Scientist Department of Sustainability, Environment, Water, Population and Communities GPO Box 461, Darwin NT 0801 Australia ISSN 1325-1554 ISBN 978-1-921069-16-1 This work is copyright. Apart from any use as permitted under the Copyright Act 1968, no part may be reproduced by any process without prior written permission from the Supervising Scientist. Requests and enquiries concerning reproduction and rights should be addressed to Publications Inquiries, Supervising Scientist, GPO Box 461, Darwin NT 0801. e-mail: [email protected] Internet: www.environment.gov.au/ssd (www.environment.gov.au/ssd/publications) The views and opinions expressed in this report do not necessarily reflect those of the Commonwealth of Australia. While reasonable efforts have been made to ensure that the contents of this report are factually correct, some essential data rely on references cited and/or the data and/or information of other parties, and the Supervising Scientist and the Commonwealth of Australia do not accept responsibility for the accuracy, currency or completeness of the contents of this report, and shall not be liable for any loss or damage that may be occasioned directly or indirectly through the use of, or reliance on, the report. Readers should exercise their own skill and judgment with respect to their use of the material contained in this report. Printed and bound in Darwin by Uniprint NT Contents Executive summary vi 1 Introduction 1 1.1 Project definition 1 1.2 Hypothesis and research objectives 1 1.3 Background concepts 3 2 Literature review and research context 4 2.1 Spectral database application – remote sensing for minesite assessment and monitoring 4 2.2 Reflectance spectrometry – basic terminology 7 2.3 Spectral remote sensing 8 2.4 The generalised spectral response of vegetation 9 2.5 Remotely sensed data for vegetation assessment and monitoring with particular application to the mine environment 11 2.6 The need for the collection of in situ spectra 14 3 Plant species and sites 18 3.1 Target species 18 3.2 Fortnightly measurements of ground cover 26 3.3 Sites 26 3.4 Project limitations 31 4 Factors affecting spectral reflectance measurements 32 4.1 Introduction 32 4.2 SSD’s spectrometer 34 4.3 Considerations with single Field-of-View (FOV) instruments 36 4.4 Spectrometer FOV and ground-field-of-view (GFOV) 38 4.5 Spectral stability of the equipment 40 4.6 Viewing and illumination geometry in the field 47 5 Reflectance spectra and metadata: A database approach 5.1 Data storage and processing 60 61 6 Conclusion 65 6.1 Further work and reporting 65 7 References 66 Appendix A SSD’s standards for collecting field reflectance spectra 78 iii Tables Table 1 Plant species found on transects in the late wet season, May 2004 22 Table 2a Summary of target weedy grass species important for Ranger, Nabarlek and weeds (declared/of concern) 23 Table 2b Summary of target weedy herb and vine species important for Ranger, Nabarlek and weeds (declared/of concern) 24 Table 2c Summary of target native grass species important for Ranger and Nabarlek 25 Table 3 Species sampled for the database during 2006–07 27 Table 4 FieldSpecPro-FR – product specifications 35 Table 5 Calculations at 90°nadir of diameter for varying FOV lenses, and the difference between a circle and ellipse for an 8° FOV example 40 Table 6 Example sun azimuth and altitude measurements for Darwin for the 1st of the month over a one year period 52 Table 7 Cover metadata collected in the data sheet and linked to the spectra in SSD’s Spectral Database 58 Table 8 Site metadata collected in the data sheet and linked to the spectra in SSD’s Spectral Database 59 Table A1 Required field equipment 78 Table A2 Record sheet of laboratory naming conventions 95 Table A3 Cloud cover 101 Figures Figure 1 The Alligator Rivers Region (ARR) 4 Figure 2 Multitemporal hyperspectral data covering the Nabarlek minesite 6 Figure 3 Subset of the Nabarlek minesite covering the rehabilitated plant run-off pond area 7 Figure 4 Illustration of green, senescing and drying spectra of Digitaria milanjiana (Jarra digit grass) taken in the months of April, May and October, respectively, in the Top End of Australia 9 Figure 5 Proximity map of Darwin area sites 26 Figure 6 Location of CSIRO Sites 28 Figure 7 Location of Crocodylus Park Sites 28 Figure 8 Location of Berrimah Farm sites (April 2007) 29 Figure 9 Examples of vegetation plots used to record the spectral reflectance of selected species over time 29 Figure 10 Selected photographic and spectral examples for one plot of Digitaria swynnertonii (Arnhem Grass) over a period of time 30 iv Figure 11 Conceptual diagram of the factors affecting spectral measurement 33 Figure 12 Attenuation versus length of permanent FR fibre 35 Figure 13 Typical 8° Hemispherical % reflectance of a 99% calibrated Spectralon® reflectance panel 38 Figure 14 Obtaining the GFOV 39 Figure 15 Spectrometer and laboratory white panel setup 42 Figure 16 Mercury-Argon Emission Spectrum 43 Figure 17 Mylar transmission Spectrum 43 Figure 18 Solar radiance spectrum measured in the field 47 Figure 19 Standard Spectralon® panel measurements are essential metadata for reflectance spectra 47 Figure 22 Direction, position and FOV 48 Figure 23a & b Weighted plumb line ensures sampling is obtained from central position of white panel 49 Figure 24 Absorption minima and maxima at the atmospheric water absorption regions, combined with metadata on meteorological conditions 55 Figure 25 Mean number of cloudy days – Darwin Airport 55 Figure 26 Effects of wind on mobile targets 56 Figure 27 Fortnightly temporal ground cover spectra, accompanied by selected metadata, for Stylosanthes humilis over ~ 4 months 60 Figure 28 SSD’s Spectral Database – metadata records 62 Figure 29 An example metadata page with associated photographs 63 Figure 30 The spectral data associated with photographs in Figure 29 64 Figure A.1 The spectrometer ‘buggy’ setup 97 Figure A.2 Scaled set-up (standard photograph) 99 Figure A.3 Typical examples of the 10 Main Cloud Types 102 Figure A.5 Photograph_s1 104 Figure A.6 Photograph_s2 105 Figure A.7 Photograph_obn1 105 Figure A.8 Photograph_obs1 106 Figure A.9 Photograph_n1 106 Figure A.10 Photograph_n2 107 Figure A.11 Photograph_es1 107 Figure A.12 Photograph_es2 108 Figure A.13 Photograph_ws1 108 Figure A.14 Photograph_ws2 109 Figure A.15 Photograph_z1 109 Figure A.16 An example of the number and types of photographs collected for one site 110 v Executive summary The collection of ground-based radiance, irradiance and reflectance spectra is a critical and common exercise for many environmental applications. The resulting measurements need to be accurate and precise representations of the target condition. There are many factors that can affect the spectral response obtained. Some of these factors are dependent on the experimental design. The environmental conditions, as well as the response of the spectrometer and reference panel used, may also influence the spectral measurements. However, there are no national or international standards for the collection of in situ spectral data. While many field spectral campaigns may be undertaken, the effort expended in groundbased spectral collection is often only applicable to a single point and time. This is because few samples are acquired, accurate metadata are not recorded, the data are not stored in a manner that is easily retrievable, the method of data collection is not described and the data represent targets whose spectral response varies spatially and temporally. In order to gain quality reference spectra of objects of interest, it is vital that careful consideration be given to the way in which spectral data are obtained. The sample size and times series of spectra must be appropriate. Importantly, metadata describing what was measured, how the measurement was taken and what the conditions were like during spectral measurement must accompany the spectral data. Factors that affect spectral measurements, including environmental factors, must be documented so that any external spectral influences can be accounted for. Photographic records can be a useful record of the type and condition of the target measured, the way in which the target was measured and the environmental conditions at the time of measurement. Whilst spectral data can be acquired quickly in the field, the acquisition and recording of spectral metadata does increase the time required for the field campaign. However, the increase in usefulness of fully described spectral data far outweighs the small additional investment in time required for metadata descriptions of associated spectra. This report focuses on the standards for reflectance spectral measurement developed by the Supervising Scientist Division (SSD). The standards described here relate specifically to the Spectral Database Project and, in particular, standards for measuring terrestrial vegetative ground covers. The Spectral Database Project aims to provide a database of ‘reference’ spectral signatures over the 400–2500 nm range, pertinent to the study of cover and condition of minesites and surrounding country. Vegetative ground covers, shrubs and trees, soils and minerals, mine related features and built-up features will be incorporated into the database. The ground cover component aims to investigate the use of remotely sensed data to discriminate ground cover plant species using spectral data acquired by in situ spectrometry. To do this, dense and homogenous plots of key ground cover species pertinent to the success of minesite rehabilitation, including native and weedy grasses, herbs, vines and sedges, were established. The spectra of these species were measured over time at fortnightly intervals. The spectral data were accompanied by metadata descriptions and photographic records, using the methods described in this report. This work was undertaken because management of both operating and rehabilitated minesites requires comprehensive information on species distribution and composition. Traditional ground-based surveys for floristic mapping involve time-consuming fieldwork that is often very stressful for workers in the tropical environment. Remote sensing has the potential to greatly reduce the requirement of ground-based surveys for floristic mapping. Broad band remote sensing sensors that have historically been used extensively for mapping of plant communities vi are, however, not sufficiently sensitive to allow discrimination of individual plant species. Relatively recent advances, particularly with respect to hyperspectral and very high spatial resolution sensors, offer the potential for application to the mine environment. The data obtained with the spectral database project will show whether or not there is potential for finespectral resolution remote sensing products to map vegetation cover and condition based on spectral signatures at scales appropriate to the mine environment. An evaluation of the most suitable wavelengths for spectral separation of cover species may identify specific spectral features that provide the best separation. These data can be resampled to indicate whether or not current multispectral systems can resolve important features for vegetation land cover mapping and condition monitoring in the mine environment. The standards described here were developed to provide a consistent and repeatable method for recording spectra that minimises the influence of extraneous factors in spectral reflectance, radiance and irradiance measurements. The standards should be used to routinely obtain accurate and precise spectral measurements. A literature review of the factors affecting in situ spectral measurements was undertaken to define what equipment needed to be calibrated, what features needed to be characterised, how the equipment should be calibrated, how the features should be characterised and how the required measurement accuracy could be obtained. The report identifies the key parameters that determine the accuracy and uncertainty of spectral measurements systems and the resultant measured data from them. The method considers the factors affecting spectral data (outlined in Pfitzner et al 2005) and provides standards to collect time series spectra of vegetation that maximise the spectral response of the end member itself (Pfitzner & Carr 2006, Pfitzner et al 2006). A detailed description of the measurement process developed to collect reference spectra and ancillary metadata is then given. This report details the scientific and operational requirements needed for the SSD Spectral Database Project. The SSD Spectral Measurement Database has been developed to take into account: spectrometer metadata and performance data of the standard Spectralon® panels (including temporal laboratory Hg/Ar, Mylar panel and Spectralon® spectra and associated metadata); images of the target at nadir, scaled set-up, horizon photographs and hemispherical photographs; subject information (classification, condition, appearance, physical state); subject background (scene background information similar to subject data); measurement information (instrument mode, date, local time, data collector(s), fore optics, number of integrations, reference material, height of measurement from target and ground, viewing and illumination geometry); environmental conditions (general site description, specific site location, geophysical location, sun azimuth and altitude, ambient temperature, relative humidity, wind speed and direction, weather instrument used and sky conditions); and, of course, reflectance spectrum and averaged reflectance data. This information is stored and available for data retrieval through the SSD Spectral Database. The standards are transferable to other researchers and applications. The only difference required may be that of the fore optic height and target field-of-view. It is envisaged that this report provides not only a reference manual for spectral measurements but will also play a key role in enabling data comparisons by ensuring the quality, consistency and portability of spectral signature measurements. Apart from improved measurement quality (compared with most ad hoc spectral campaigns), the design and implementation of these spectral standards will also limit lost time due to poor measurements, enable the measurements and associated uncertainties to be independent of the technician undertaking the measurements, provide confidence that the operating equipment is performing as expected, and accelerate the training of new staff members. vii Importantly, the standards facilitate measurement comparisons and improved measurement accuracy through identification and reduction of primary sources of uncertainty. It is only once this level of rigor is applied to spectral measurements that ground-based spectral feasibility studies will advance the use of spectral remote sensing beyond the short-term project specific research realm and into practical cost effective tools for long-term operational management. The data compiled from this project form a knowledge base of spectral information suitable for data sharing, particularly with respect to remote sensing feasibility studies. The data collected to date will result in a knowledge base far greater than that ever obtained for vegetation spectra with respect to the range of species sampled, the frequency of sampling, duration of sampling, and method and metadata documentation. Further protocols on the analysis of these data will follow this report and will document any change in spectral pattern for a given species, the regions of the spectrum that provide the richest information for species discrimination, the possibility to discriminate species at a particular point in time and over time in the hyperspectral feature space, any optimum phenological stage to enhance the spectral separability of species and provide the most appropriate processing techniques. Also, further reports will detail other aspects of the project such as soil spectral measurements made in the laboratory. Note Some of this work draws upon previously published materials: Pfitzner K 2005a. Ground-based spectroscopy – do we need it? In Applications in Tropical Spatial Science, Proceedings of the North Australian Remote Sensing and GIS Conference, 4–7 July 2005, Darwin NT, CD. Pfitzner K 2005b. Remote sensing for minesite assessment – examples from eriss. In Applications in Tropical Spatial Science, Proceedings of the North Australian Remote Sensing and GIS Conference, 4–7 July 2005, Darwin NT, CD. Pfitzner K, Bartolo RE, Ryan B & Bollhöfer A 2005. Issues to consider when designing a spectral library database. In Spatial Sciences Institute Conference Proceedings 2005, Melbourne, Spatial Sciences Institute, ISBN 0-9581366-2-9. Pfitzner K & Bollhöfer A 2008. Status of the vegetation plots for the spectral library project. Internal Report 546, Supervising Scientist, Darwin. Unpublished paper. Pfitzner K, Bollhöfer A & Carr G 2006. A standard design for collecting vegetation reference spectra: Implementation and implications for data sharing. Journal of Spatial Sciences 52 (2), 79–92. Pfitzner K & Carr G 2006. Design and implementation of vegetation reference spectra: Implications for data sharing. In Proceedings Workshop on hyperspectral remote sensing and field spectroscopy of agricultural crops and forest vegetation, 10th February 2006, University of Southern Queensland, Toowoomba, Queensland, 21–22 Pfitzner K, Esparon A & Bollhöfer A 2008. SSD’s Spectral Library Database. Proceedings of the 14th Australasian Remote Sensing and Photogrammetry Conference, Darwin 29th September – 3rd October, 2008. Pfitzner K, Bollhöfer A, Esparon A, Bartolo R & Staben G 2010. Standardised spectra (400– 2500 nm) and associated metadata: an example from northern tropical Australia. In Proceedings 2010 IEEE International Symposium on Geoscience and Remote Sensing, July 25–30 2010, Honolulu, Hawaii, USA. 2311–2314. viii 1 Introduction 1.1 Project definition This report presents the development and implementation of a robust method for collecting reflectance spectra of ground covers, particularly with respect to vegetative ground covers. Development and implementation of such a method ensures the measured spectral response is representative of the target (given the immediate phenological condition). To exclude or at least minimise the effects of extraneous factors, they must be known and then documented. A method to link spectra and metadata must then be established. The Supervising Scientist Division (SSD) of the Department of Sustainability, Environment, Water, Populations and Communities (SEWPaC) aims to build knowledge on the spectral response of vegetation species and background targets important for land condition assessment and monitoring. Temporal measurements were made of both weedy and native species from homogenous plots as well as measurements along environmental gradients. This information was organised in the SSD Spectral Database. This study was initiated to forward remote sensing technologies for the mine environment from the research realm into operational status by addressing the uncertainty in the spectral separability of land cover components over time. 1.1.1 Purpose of the report The main purpose of this report is to develop and document the SSD standards for collecting field reflectance spectra. This report summarises, conceptualises and links existing references on aspects of spectral collection in the field and laboratory environments. A specific protocol to acquire spectra potentially useful for revegetation assessment and monitoring is described. The need and issues for acquiring robust in situ spectral data, the factors affecting field spectral measurements and the importance of the SSD Spectral Database concept are detailed. This document provides a detailed description of the scientific and operational requirements needed to successfully conduct the SSD Spectral Database Project, with the focus on field standards (and laboratory calibrations). The standards are transferable to other researchers and applications. The only difference required may be that of the fore optic height and target field-of-view. The timing of this research is appropriate given the decommissioning timeline for the Ranger uranium mine and the associated requirement for a robust rehabilitation monitoring method, combined with expectations of advances in technology, such as hyperspectral and newer generation VHR satellite platforms. The project is applicable to any application requiring information on the spectral separability of ground cover species. 1.2 Hypothesis and research objectives The hypothesis is that: with a well-designed approach to collecting field spectral measurements and metadata, extraneous factors can be accounted for, accurate post-processing of spectra can be performed and the first database of northern Australian spectra relevant to the mine environment can be developed. These data can be assessed to gain knowledge on the usefulness of remotely sensed data for vegetation applications. Spectra can be assessed for similarity and separability within and between species and analysed over time. Spectra can also be resampled to band numbers and 1 widths of existing and future remote sensing platforms and reanalysed for similarity and separability. The following research questions and associated objectives address the project aim presented in Section 1.1 (to build knowledge on the spectral response of vegetation species and background targets important for land condition assessment and monitoring). 1.2.1 What are the temporal changes of spectral responses of ground cover species? Develop, document and implement minimum spectral and metadata requirements for temporal spectral studies; Measure and detect the fortnightly spectral response of ground cover vegetative species representing a particular phenological condition at a given point in time; Analyse the spectral response of vegetation species over time and relate these responses to environmental conditions. 1.2.2 Can ground cover species be distinguished using ground-based reflectance spectra and, if so, what spectral resolution (spectral selectivity or full-width-half-maximum [FWHM] and spectral sampling interval) is required? Develop, document and implement minimum spectral and metadata requirements for temporal spectral studies; Measure and detect the fortnightly spectral response of ground cover vegetative species representing a particular phenological condition at a given point in time; Determine the range of spectral resolution at which a vegetation species is separable over time. 1.2.3 At what phenological stage is maximum spectral separability and is there a phenological stage when spectra of different species cannot be distinguished? Measure and detect the fortnightly spectral response of ground cover vegetative species representing a particular phenological condition at a given point in time; Analyse data to determine the phenological stage(s) that maximum spectral separability is found between species and if there is a stage (or stages) where species are spectrally confounding. 1.2.4 What are the implications for use of remote sensing imaging throughout the year? Develop a database of land cover end members that can be used to make recommendations on the most appropriate monitoring strategy for minesite rehabilitation assessment; Analyse data to determine the change in spectral response of vegetation species over time, between species and at different sensor wavelengths to make recommendations on timing of data capture for vegetation assessment. 2 To answer these research questions, the research design needs to ensure that the spectral response is not confounded by extraneous factors such as localised changes in atmospheric conditions. 1.3 Background concepts A spectral database of land cover end members pertinent to remote sensing for minesite rehabilitation assessment is being developed. End members include vegetative species (introduced weedy and native vegetation), geological materials including minerals and soils, aquatic components and infrastructure (mine-related features including infrastructure). Measurements are made with a portable FieldSpecPro-FR spectrometer (Analytical Spectral Devices Inc) across 350–2500 nm at full-width-half-maximum (FWHM) resolution of 3 nm for the region 350 to 1000 nm and 10 nm for the region 1000 to 2500 nm. The principal objective is to create a database of temporal spectral responses that can be assessed to make recommendations on the most appropriate remotely sensed monitoring method for land cover and condition assessment with particular application to minesite rehabilitation. Remote sensing technologies offer advantages over traditional field-based monitoring methods. However, compared with the use of remotely sensed data for applications in the natural landscape, there are additional challenges for the disturbed mine environment. These include the need to identify and discriminate subtle variation in land cover over short distances and variable frequencies. Suitable remotely sensed data currently available for rehabilitation assessment include airborne hyperspectral and very high spatial resolution (VHR) satellite data. A costbenefit analysis of these approaches compared with ground measurements is difficult because results are dependent on both the sensor specifications and the localised environmental conditions, such as seasonality or occurrence of disturbances like bushfires. The accuracy of radiance, irradiance, reflectance and transmittance spectra is affected by a variety of technical and environmental factors. However, there are no national or international standards for the collection of in situ spectra. The quality of spectra is dependent on the technique(s) used to collect spectra, but these methods are rarely reported. Environmental conditions in the field influence the spectral response, but these factors are often not given appropriate consideration nor does appropriate metadata routinely accompany the recorded spectra. This project relies on a review of the factors that affect the quality of spectral measurements and the development of an appropriate methodology to reduce extraneous variation in spectral response. Data collection is coupled with the development of a spectral database that links appropriate metadata with spectra. Research effort has focused on describing the factors that may contribute to a spectral response and in designing a sampling method and metadata record to both reduce and account for extraneous factors in spectral sampling. Because many ground covers provide the initial stabilising component of a newly revegetated surface and considering that introduced ground covers (particularly weedy grasses) are threats to the rehabilitated minesite, the initial focus has been on acquiring high quality time series spectra for ground cover. The developed standards for spectral acquisition have provided the basis for acquiring these spectra. 3 2 Literature review and research context 2.1 Spectral database application – remote sensing for minesite assessment and monitoring The role of the Supervising Scientist Division is to ensure protection of people and the environment from the effects of uranium mining and to encourage best practice in wetland conservation and management in an area known as the Alligator Rivers Region (ARR) (see Figure 1). The ARR is centred about 220 km east of Darwin in the Northern Territory covering an area of about 28 000 sq km. The ARR includes all of Kakadu National Park and the western boundary of Arnhem Land. Well known uranium sites in the Region include the operational Ranger mine, the rehabilitated Nabarlek mine (in Arnhem Land), the lesser known abandoned mines of the upper South Alligator River valley (such as Coronation Hill), and the Jabiluka mineral lease. Remote sensing technologies offer synoptic data to reduce the inherent sampling limitations of traditional ground-based methods and have the advantage of contributing information to a variety of closure criteria. Closure criteria are often site specific, but general measures, such as the creation of a stable land surface free of excessive soil erosion or sedimentation, botanical succession, low-maintenance vegetation that ‘blends in’ with the surrounding environment, and a post-mining landscape that is non polluting, are common rehabilitation objectives (Hannan & Bell 1993, Mifsud 1996, Waggitt & McQuade 1994, Bell 1996, Minerals Council of Australia 2002) that can be assessed over the mining lease with remotely sensed data. One research component of SSD is to evaluate remotely sensed data for land cover condition assessment and monitoring in the mine environment, including post-mining revegetation assessment. Remote sensing techniques are routinely applied for vegetation applications at landscape scales. In contrast to the landscape scale, minesite applications often require large scale mapping (discriminating covers at a high resolving power) of highly variable surface covers. The disturbed mining environment, often composed of mixtures of plant species, soils and rocks, covers only relatively small areal extents. Figure 1 The Alligator Rivers Region (ARR) 4 The identification and discrimination of vegetation cover at minesites are critical considering the role vegetation plays in preventing soil erosion and sedimentation by stabilising landforms. The spatial arrangement of vegetation type and condition is an important component of studies of bio-geochemical cycles and land use change (Dungan 1998) and defining an ecosystem in terms of diversity and abundance may aid in revegetation management plans. The health of vegetation provides an indication of other processes that may be hidden under vegetation cover. Geological and chemical conditions may induce discrete patterns in revegetated areas, such as senescence because certain plant species respond to geochemistry conditions of surface and near surface environments (Milton & Mouat 1989). Some geobotanical associations are related to regional lithologic variations, whereas others are specifically related to anomalous concentrations of metals where changes in plant biomass, towards less dense, stunted vegetation or even barren ground may occur (Brooks 1972 in Goetz & Rowan 1981). For information derived from remotely sensed data to be beneficial, targets of interest must be discriminated with accuracy and precision, the data must be cost-effective when compared with traditional methods and the information extractable and deliverable in a timeframe that is suitable for decision making (McGowen et al 2001, Ticehurst et al 2003). Appropriate data for current revegetation applications at minesites are typically limited to hyperspectral airborne platforms due to the ground resolution of satellite hyperspectral sensors. Collaborative airborne missions in the Top End of the Northern Territory are few, and decommissioning costs prohibit customised data acquisition due to uncertainty of results in a changing ecological environment. SSD has acquired opportunistic airborne hyperspectral data, such as CASI, HyMap and Airborne Multispectral Scanner (AMS) data (Figure 2), but the different acquisition dates and variable sensor characteristics make a quantitative comparison and cost-benefit analysis impossible. Results are sensor specific (spatially and temporally dependent) (Figure 3) and complicated by atmospheric and phenological changes over time. It has therefore been difficult to make recommendations on the most suitable data for revegetation assessment, or rehabilitation assessment more generally. The vegetative spectral response is controlled by the chemical make-up of the target (which is compositionally similar for many species but not identical), the physiology of the plant, the architecture of the plant and external factors such as localised climatic conditions and soil type or growth medium. If the external factors can be controlled to be similar, a measurement of a plant’s spectral response will be indicative of that plant for a point in time at a particular location. If measurements are carried out in an identical way for a period of time then it is possible to build up a spectral library of a plant’s signature over time. If this method is repeated for a number of species, a database of spectral signatures over time for a number of species can be collated. At that point the data can be integrated and similarity and dissimilarity measures can be undertaken both for between species and within species separability. With such information, it would then be possible to resample signatures to wavelengths of existing and future sensors and make recommendations on the suitability and limitations of using such data for the vegetation application. It is only once such data are collected, collated and analysed that we can pursue vegetation remote sensing at the minesite scale from the research realm into operational management. 5 0 AMS 5 km HyMap CASI Figure 2 Multitemporal hyperspectral data covering the Nabarlek minesite. From left to right, Airborne Multispectral Scanner (June 2004, 4.5 m pixels, 96 bands), HyMap (September 2002, 5 m pixels, 126 bands) and CASI (July 2002, 1 m pixels, 16 bands) False colour images (IR, R, G). 6 Quickbird data, May 2004, 60 cm, 4 bands CASI data, July 2002, 1 m, 16 bands AMS (then DeBeers), June 2004, 4 m, 96 bands Figure 3 Subset of the Nabarlek minesite covering the rehabilitated plant run-off pond area. Results are sensor specific and spatially and temporally dependent. 2.2 Reflectance spectrometry – basic terminology Field, ground, in situ or handheld spectrometry, spectroscopy and reflectance spectrometry are interchangeable terms used to describe measurements of spectral properties, usually made under solar illumination in the natural environment. Spectral measurements in the laboratory use an artificial light source, such as halogen lamps. Here, reflective optical radiation is defined as propagating electromagnetic energy with characteristic wavelengths between 400 nm and 2500 nm, including the visible portion of the spectrum and the infrared (or IR). When optical radiation interacts with a surface, a portion of that radiation is either absorbed in the material below the surface or is transmitted through the bulk of the material through another surface into another medium. The reminder of the radiation is said to be reflectance from the surface and in general terms, the ratio of the reflected radiation to the total radiation falling upon the surface is defined as reflectance (Baumgardner et al 1985). Modern field spectrometers, such as the FieldSpecPro-FR (manufactured by Analytical Spectral Devices (ASD) Inc), were developed in the late 1980s to mid 1990s and are capable of measuring spectra with high precision and accuracy and are portable and easy to use. Terms such as photometers and spectroradiometers refer to instruments that collect data over only a range of wavelengths and multiband radiometers collect data in a few broad wavebands only (Milton et al 1995). Spectral signatures represent the relationships between electromagnetic radiation (EMR) and the physical and chemical properties of the object of interest. The signature is a result of 7 radiance, irradiance, reflectance or transmission of light from a remote target by translating light energy into electrical current (Fyfe 2004). The interactions of photons with the surface of a target occur on a molecular scale. Photons may be transmitted, reflected, emitted or absorbed. Molecules have discrete energy levels and can only absorb specific amounts of energy and the diagnostic regions of the reflectance spectrum are usually defined by absorption features at specific wavelengths. Terms such as the wavelength position, depth and width of an absorption feature may be diagnostic descriptions, as can be reflectance magnitude and slope. Traditional spectral research related spectral observations with geological materials (for example, see Hunt & Salisbury 1971, Hunt et al 1971a-b, Rowan et al 1977, Hunt & Ashley 1979, Hunt 1977, 1979, Clark et al 1990) and biophysical measurements (Collins 1978, Horler et al 1983, Boochs et al 1990, Elvidge 1990). Spectrometry has been extended to novel applications such as the urban environment (eg Herold et al 2004) and coral reefs (eg Joyce & Phinn 2003). 2.3 Spectral remote sensing Coupled with recent advances in remote sensing systems and expectations of future developments in satellite technology have been the increasing need to measure in situ reflectance spectra. Spectral signatures are fundamental means of data representation and analysis in all forms of passive (reflected sunlight) remote sensing. Differences in the spectral response from remotely sensed data are a function of the target and environmental background, the illumination and viewing geometries and the spectral, spatial and radiometric response of the remote sensor. The relationships between spectral signatures and the biological, chemical, physical and atomic structure of gases, water, vegetation and soils has been explored using remote sensing techniques in areas of atmospheric chemistry, plant physiology, geological sciences, soil sciences, and limnology and oceanography since the 1960s. Awareness of spectroscopy principles has moved beyond the specialist applications and into the general remote sensing community because airborne hyperspectral applications are increasing and higher spectral dimensions from satellite data are now available, eg data from Hyperion travelling on EO1 (Earth Observation 1) and CHRIS (Compact High Resolution Imaging Spectrometer). With the advent of sensors capable of collecting high-spectral resolution radiance data has come the expectation that, if measurements are made with sufficient spatial resolution to avoid spectral mixing, most types of rock, soil and vegetation should be remotely identifiable (Cochrane 2000). Satellite platforms are currently inferior to airborne platforms with respect to spectral range and resolution and radiometric stability. The major operational limitation with airborne platforms is a lack of affordable data at required frequencies. For smaller scale applications, the required number of flight runs due to small swath widths may be another limitation of airborne platforms. Due to the dynamic nature of the mine environment, it is not feasible to perform a cost-benefit analysis of remotely sensed data due to a lack of data with suitable frequency and specifications. At best, a conceptual matrix of factors and suitable sensors can be developed similar to the Coastal Remote Sensing Toolkit (University of Queensland 2006). To make recommendations on the most suitable remotely sensed data for a given application, an understanding of target separability at a given spatial and spectral resolution is required. Targets are rarely spectrally static over time and acquiring knowledge on target differentiation therefore requires investment in the collection of temporal spectra. Feasibility studies on the 8 spectral differentiation of vegetation species over time and at different resolutions can only be achieved cost-effectively by the collection of in situ spectral data due to the frequency of samples required. The advantage of this approach is that results are transferrable to a variety of applications where information on land cover separability at different scales is required. 2.4 The generalised spectral response of vegetation A review of the spectral characteristics of vegetation can be used to suggest possible causes of changes in vegetation spectral responses over time. This section describes typical spectra of healthy green vegetation and the changes that occur for stressed and dried vegetation. The descriptions can be visualised with Figure 4. a. Green spectrum Digitaria milanjiana (Jarra digit grass) 2007-04-11 b. Senescing spectrum Digitaria milanjiana 2007-05-22 c. Drying spectrum with soil interspaces Digitaria milanjiana 2007-10-04 Figure 4 Illustration of a) green, b) senescing and c) drying spectra of Digitaria milanjiana (Jarra digit grass) taken in the months of April, May and October, respectively, in the Top End of Australia 2.4.1 Healthy green vegetation The reflectance of light from a vegetated ground surface is determined by several factors, such as leaf and canopy geometry, morphology, plant physiology, plant chemistry, soil type, solar angle and climatic conditions (Barret & Curtis 1992). Vegetation reflectance is primarily influenced by the optical properties of plant materials (including proteins, lignin, cellulose, sugar, starch) which are composed largely of hydrogen, carbon, oxygen and nitrogen. The absorption bands observed in vegetation arise from vibrations of C-O, O-H, C-H and N-H bonds as well as overtones and combinations of these vibrations. It is well known that the visible spectrum (400 to 700 nm) represents the photosynthetically active region of the electromagnetic spectrum. In the visible wavelength regions, leaf pigments control reflectance (Campbell 1996), particularly chlorophyll a and b, carotenoids and xanthophylls (Tucker & Garrett 1977). Consequently, healthy green vegetation is characterised by low reflectance of blue and red light (absorbed by chlorophyll for photosynthesis), and higher reflectance at green wavelength regions. Absorption in the red region at 680 nm and a rapid increase in reflectance from 680 to 780 nm are known as the ‘red edge’ (Milton & Mouat 1989, Slaton et al 2001) which often forms an extreme slope. 9 Cell structure controls reflectance in the near-infrared (NIR) (Campbell 1996), primarily from the internal structure of plant leaves, as a function of the number and configuration of the air spaces that form the internal leaf structure (Danson 1995, Slaton et al 2001). The nearinfrared spectra of leaves result from a complex combination of scattering processes and overlapping absorptions arising from water and biochemical components (Kokaly 2001). The reflectance of healthy green vegetation increases dramatically in the NIR, where from about 700–1300 nm, a plant leaf typically reflects 40–50% of the energy incident upon it (Lillesand & Kiefer 1994). Water content controls reflectance in the mid infrared (Campbell 1996, Hunt et al 1987, Hunt & Rock 1989). Healthy vegetation beyond 1300 nm typically absorbs or reflects incident energy, with reflectance peaks at about 1600 and 2200 nm. Absorptions occur as a result of water absorption around 1400 and 1900 nm, with the exact position of water absorption bands varying. For example, Murphy and Wadge (1994) found that short blade grass showed strong leaf water absorption bands at 1450 and 1930 nm. Using spectroscopy, Kokaly and Clark (1999) found the absorptions from different plant materials are similar and overlapping, so a single absorption band could not be isolated and directly related to chemical abundance of one plant constituent, while Wessman et al (1988) found each constituent (eg cellulose, protein) of a complex organic mixture has unique absorption properties in the near infrared region (700–2500 nm) of the spectrum. Although the general shape of the spectral curve may be similar for all green vegetation, changes in reflectance occur through variations in amplitudes of the curve. For example, Gates et al (1965) report that visible absorptance substantially increases from lighter to darker coloured leaves and for thick leaves reflectance drastically increases in the near infrared. Differences in chlorophyll and water absorption positions and reflectance magnitude differences across regions of the spectrum may occur both between and within species. Vegetation stress, senescing and desiccation all produce changes in the spectrum. 2.4.2 Chlorophyll and red edge changes Changes in the chlorophyll content of plants can be used as an assessment of nutritional and environmental stresses. The chlorophyll a absorption band is centred at 680 nm (Elvidge 1990, Datt 1999a & 2000a, Clark et al 1995). However, as the absorption is intense, the chlorophyll absorption band minima will not change much with increased or decreased absorption, but the wings of the absorption will change (Clark et al 1995). Datt (1999a) found that reflectance near 710 nm showed maximum sensitivity to chlorophyll content, and that the reflectance near 550 nm was a less sensitive indicator in Eucalyptus sp leaves. The reflectance near 550 and 700 nm shows maximum sensitivity to a wide range of chlorophyll contents (Buschmann & Nagel 1993). There are two primary red-edge optical parameters – red edge position (REP) and red well position (RWP) (Pu et al 2003). The combined effects of strong chlorophyll absorption and internal leaf scattering cause this abrupt change (Dawson & Curran 1998, Horler et al 1983). Estimates of the spectral range of this red-edge region differ slightly from author to author, including 680–730 nm (Clark et al 1995), 690–740 nm (Lamb et al 2002) and 680–750 nm (Horler et al 1983, Miller et al 1991, Munden et al 1994, Filella & Penuelas 1994, Belanger et al 1995, Datt 1999a, Pu et al 2003). The red edge has been used to indicate changes in the chemical and morphological status or vitality of plants (Clark et al 1995, Collins 1978, Boochs et al 1990, Dawson & Curran 1998, Datt 2000a, Barret & Curtis 1992, Elvidge 1990, Pu et al 2003). Belanger et al (1995) found that seasonal chlorophyll values for trees, expressed on an area basis, tend either to increase to a short-lived maximum and then to decline, or to rise to 10 relatively ‘steady state’ value during much of the season, depending on the species. When chlorophyll absorption decreases, so does the overall width of the absorption feature. This change results in the edge shifting to shorter wavelengths (Clark et al 1995, Horler et al 1983, Pu et al 2003). Collins (1978) reported that as crop vegetation approaches maturity, the position of the chlorophyll absorption edge shifts towards longer wavelengths and that the red shift is a means of assessing the maturity of vegetation, particularly if narrow bands around 750 and 780 nm are available. 2.4.3 Senescing and stressed vegetation The spectral difference between green and dying (or chloritic) leaves occurs primarily in the region of 400 to 800 nm (Elvidge 1990) as absorption of incident light by chlorophyll decreases. As chlorophyll content begins to decrease with the occurrence of stress, leaf reflectance increases initially at the chlorophyll absorption band 610 nm, and then at 690 nm and 710 nm, and additional chlorophyll must be lost before reflectance will increase significantly at wavelengths where chlorophyll or other pigments are strongly absorbed, such as 420 or 670 nm (Carter 1994). Stressed vegetation can result in water loss and a breakdown of pigments which may also lead to yellowing of leaves and a subsequent rise in blue and red reflectance wavelengths (as an overall loss of chlorophyll absorption). Yellowing leaf spectra show intense pigment absorptions being retained in the blue and an increase in green and red reflectance. Chloritic leaves show a shift of the red edge to shorter wavelengths (Horler et al 1983, Elvidge 1990) and the reflectance peak normally centred at 550 nm broadens towards the red (Adams et al 1999). In stressed vegetation, both the absorption efficiency of chlorophyll and the infrared reflectance decreases due to changes in the cell structure of the plant (Adams et al 1999). Dawson and Curran (1998) and Datt (2000b) found the red edge correlated strongly with foliar chlorophyll content and so provided a sensitive indicator of vegetation stress. Nutrients and toxic metals may cause chloritic leaves, as these elements tend to move toward the actively growing cells of green foliage, observed as a variation in the shape and position of the chlorophyll absorption bands (Collins et al 1983). Several authors have found that the red edge shifts towards shorter wavelengths for trees growing over copper mineralisation (Howard et al 1971, Collins et al 1983 in Horler et al 1983). This shift is also found in geochemical anomalies of high Ag, Cu, Pb, Zn and Au in the upper soil (Collins et al 1983) and various other metallic elements (Milton & Mouat 1989). 2.4.4 Dry vegetation Dry vegetation lacks chlorophyll and intense water absorptions, although absorption wings may be present between the 400–900 nm regions (Elvidge 1990). Dry vegetation leaves such as Eucalyptus species lack a 680 nm absorption and have a diagnostic absorption feature near 1730 nm (Datt 2000a). Over most of the 1300–2500 nm region, all dry plant materials exhibit similar absorption features caused by lignin and cellulose (Datt 2000a). Murphy and Wadge (1994) describe a field spectrum of dead grass with no absorption in the blue or red, and two prominent absorption features between 2050 and 2140 nm due to lignin absorption and absorptions at 2260 nm and 2330 nm due to both lignin and cellulose absorption. 2.5 Remotely sensed data for vegetation assessment and monitoring with particular application to the mine environment The ability to map vegetation cover and discriminate species remotely offers significant advantages over traditional ground-based field measurements (Underwood et al 2003, McGowen et al 2001). However, monitoring vegetation using remote sensing is challenging 11 because of the variations of vegetation reflectance with sun zenith angle, view zenith angle, terrain slope (Dymond et al 2001), contribution from atmospheric noise, humidity, shadow and soil (Price 1994), orientation of leaves, age differences of plants and variation in leaf area index (Joshi et al 2004). Isolated examples of the application of aerial photographs, videography and broadband satellite data for mining applications exist (Game et al 1982 Phinn et al 1991, Evans & Williams 1995, Hill & Phinn 1993, Hick et al 1994, Rathmore & Wright 1993, McCall et al 1995, Hick 1999, Warren & Hick 1996, Mueller et al 1997, Schmidt & Glaesser 1998). Data specifications, particularly spatial scale, spectral resolution and geometric instability have restricted the use of such data for routine monitoring and minesite applications. For vegetation applications, aerial photography has not been widely used because of the absence of quantitative data, high cost, variable interpretation, and the requirement for manual scanning or digitising (Arnold et al 1985 in Lass et al 2005), although is no longer the case with digital photography. Broadband satellite data include Landsat Thematic Mapper (TM) which records data over seven visible-near infrared (VNIR) to shortwave infrared (SWIR) bands at 30m pixel sizes and the Advanced Very High resolution Radiometer (AVHRR), which records data over six visiblethermal infrared (TIR) bands at ~1 km pixel sizes. The Moderate Resolution Imaging Spectroradiometer (MODIS) instrument that provides high radiometric sensitivity (12 bit) in 36 spectral bands ranging from the VNIR to TIR (with two bands imaged at a nominal resolution of 250 m at nadir, five bands at 500 m, and the remaining 29 bands at 1 km). The Advanced Spaceborne Thermal Emission and Reflectance Radiometer (ASTER) is characterised by pixel sizes between 15–90 m, with 14 spectral bands covering the VNIR to TIR regions. Broadband satellite data can be used to detect vegetation patterns including weed infestations only after they become dense and widespread (Carlson et al 1995 in Underwood et al 2003) but cannot be used to detect small weed infestations or weeds mixed with other vegetation (Lass et al 2005). Light and scattered weed infestations represent the highest priority for control, but these forms are most difficult to detect from remotely sensed data (Moody & Mack 1988 in McGowen et al 2001). Quantitative information about vegetation often requires high spectral resolution data because vegetation types are chemically similar and most healthy plants show absorption bands that are almost identical with broadband remotely sensed data (Clark et al 1995, Fitzpatrick et al 1990, Price 1994). Recent spatial, spectral and radiometric advancements of remote sensors provide applicable test data for minesite applications, including revegetation assessment and monitoring. The challenge in monitoring minesite environments using remotely sensed data is to differentiate cover types with wide spectral variation across an inherently variable land surface, and over different capture times. Differentiation of introduced weeds, native ground and tree canopy cover, exposed soil and some mineral assemblages is required over both the minesite and surrounding country as these index local environmental conditions in addition to contributing to an overall rehabilitation assessment. Frequent landscape-scale cover data are required to adequately assess the pervasive effects of ecological disturbances such as those caused by fire, weeds and high winds. Remotely sensed data that combine small pixel size, preferably combined with high spectral resolution, and the capability to capture new images soon after disturbances occur, now provide such continuous coverage and, in contrast to intensive ground-based methods over much smaller sample areas, are cost-effective. Experience at SSD has shown that very high resolution (VHR) satellite data and airborne hyperspectral systems are suitable data choices for the mine environment. 12 2.5.1 Very high resolution (VHR) remotely sensed data for revegetation applications VHR data, such as that captured by DigitalGlobe™ and SpaceImaging™, presently measure up to 8 bands in the visible-near infrared region at the VHR of ~2.5 m pixel sizes. Pansharpening algorithms provide multispectral data down to 50 cm ground resolution elements. However, reducing the spatial resolution does not always ensure that vegetation covers will be detectable (Lass et al 2005) because a vegetative species may have similar spectral reflectance to other vegetation or may be mixed with other vegetation (Shafii et al 2004 in Lass et al 2005). SSD utilises VHR DigitalGlobe™ Quickbird products at 60 cm resolution to map vegetation cover including weedy distributions and to monitor the effects of disturbances such as fire at the Nabarlek minesite, Northern Territory. The Nabarlek minesite was rehabilitated in 1995 and has not yet met original closure criteria with the threats to revegetation success including invasion of weedy grass species and fire (Bayliss et al 2004a & b). Remotely sensed data have shown promise at Nabarlek in both assessing revegetation covers and mapping and monitoring the area of disturbance and recovery of threats such as fire (Pfitzner 2005b). Experience has shown that compositionally different vegetative species show spectrally similar responses at the Quickbird resolution and the Nabarlek example showed that vegetative species are spectrally confounded within the Quickbird 4 dimensional spectral space (Pfitzner 2005b, Pfitzner et al 2006). Despite poor spectral resolving power, very high spatial resolution of the pan-sharpened product aids in the differentiation and identification of different vegetative species. However, an extensive knowledge base of the distribution of species cover, combined with an object-orientated (rather than pixel-based) mapping approach is required (Pfitzner & Bayliss 2006) to map the complex vegetation cover. WorldView-2 satellite data have now been acquired over the Ranger uranium mine and surrounding country. With suitable spatial resolutions from satellite image data now available, the advantages of using satellite over airborne data are that costs are known, image captures can be planned in advance, and new data captures can be tasked when disturbances, such as fire, are realised. The disadvantage of the VHR approach is the extensive fieldwork component that is initially required to gain an understanding of both the species present and their distribution across the minesite as a result of poor spectral discrimination in a small spectral space. 2.5.2 Hyperspectral remotely sensed data for revegetation applications Hyperspectral platforms typically record data over the VNIR-SWIR in up to hundreds of narrow channels. Examples include Airborne Visible/Infrared Imaging Spectrometer (AVIRIS), Compact Airborne Spectrographic Imager (CASI), Airborne Multispectral Scanner (AMS) and Hyperspectral Mapper (HyMap). The pixel size of airborne data is subject to the capability of both the sensor and flying height of the platform. Hyperion is a research-based sensor onboard the Earth Observation (EO-1) satellite (that co-orbits and has the same pixel size as that for Landsat TM) with 220 bands across the VNIR-SWIR. The CHRIS sensor operates in two modes. Mode 1 works with 62 spectral bands at a spatial resolution of 34 m, while Mode 2, used for studies of waterbodies, presents 18 bands at 17 m (Guanter et al 2005). Many examples of mapping and monitoring vegetation using hyperspectral remotely sensed data exist (eg Chewings et al 2000, Lewis 2000, Goel et al 2003). McDougal et al (1999) used AVIRIS data to group vegetation into three general groups (high and moderate chlorophyll content, dry and green vegetation and dry vegetation). There are isolated examples of 13 discriminating weedy and native vegetation using hyperspectral data. For example, Underwood et al (2003) measured 80 individual ground-based reflectance spectra in conjunction with AVIRIS (224 bands, 4 m pixels) data to detect invasive species of iceplant, with a presence absence accuracy of 97%. Lass et al (2005) classified 57% of known spotted knapweed (Centaurea maculosa) and 97% of known babysbreath (Gypsophila paniculate) using hyperspectral data (48 bands, 2 m pixels). DiPietro (2002) mapped giant reed (Arundo donax) using AVIRIS data with 71–95% accuracy with results dependant on the mapping method used. Hunt et al (2004) and Parker-Williams and Hunt (2004) mapped leafy spurge using AVIRIS data with an accuracy of 95%. Hunt et al (2004) found the distribution and abundance of leafy spurge can be determined with hyperspectral AVIRIS data, but not with multispectral data. Ustin et al (2002) reported invasive species mapping using AVIRIS data. Goel et al (2003) used CASI (72 bands, 2 m pixels) to evaluate detection of weed infestations with 91% accuracy for detected weeds against weed free crops. Ticehurst et al (2003) collected in situ spectra of the weed Pond apple (Annona glabbra) and other vegetation to assess the potential of different remote sensing technologies to discriminate the weed and found that Landsat TM, Hyperion and HyMap data identified pond apple stands, but also erroneously included non-pond apple vegetation. Emery et al (1998) measured field reflectance data of heathland canopies over a range of ages over the course of a growing season and used spectral changes resulting from seasonal variability to identify wavelengths most suitable for quantification of temporal changes using CASI data. Research has also assessed the potential for detailed remote sensing measurements of vegetation chemistry (eg Dury et al 2000, Datt 2000a), and reflectance spectrometry has been used to correlate remotely sensed responses with biophysical changes, including leaf area and leaf area Index (LAI) (Birch et al 1998, Pu et al 2003), canopy species (Cochrane 2000, Datt 2000a), water content (Datt 1999b, Hunt & Rock 1989, Hunt et al 1987), leaf biochemistry (Dawson 2000, Kokaly & Clark 1999, Kokaly 2001, Lamb et al 2002, Buschmann et al 1994, Curran & Milton 1983, Belanger et al 1995), characterisation of leaves and flower bracts (Hunt et al 2004) and stress (Clark et al 1995). Narrow spectral bands, such as those from hyperspectral sensors, are required to resolve features such as the red edge, chlorophyll and water absorption in vegetation spectra that may be indicative of the vegetation composition and vigour (including dieback, stress or morbidity) and the success of results depend on many factors including the localised conditions, the timing of data capture, the characteristics of the sensor and the methodology of mapping used. 2.6 The need for the collection of in situ spectra In situ reflectance data are collected for the calibration and validation of hyperspectral data (atmospheric conditions measured with a cosine receptor or calibration targets), development of spectral attributes (surface water, vegetation, soil, minerals and rocks), goniometric measurements, to develop and test models describing the relationships between the directional spectral reflectance of surfaces and their biophysical attributes, and, for feasibility and costbenefit analyses prior to remotely sensed data acquisition. The types of questions that may be addressed in a minesite vegetation/rehabilitation feasibility study include: Is a land cover type separable? What spectral and spatial scale is required for separation? 14 What is the best time of year for maximum separability of a land cover type? (Curtiss & Goetz 2001). Detailed examples of ground-based reflectance spectrometry for remote sensing feasibility studies, converting data from radiance to reflectance, the development of spectral libraries and the role of spectral libraries in multispectral data analysis can be found in Pfitzner (2005a). Many remote sensing applications will remain in the research realm without a knowledge base to define expectations of species separability likeliness over time. The spectral separability of vegetation provides special difficulties because the spectral behaviour is described by a small number of independent variables (Price 1992) correlated due to their chemical composition (Portigal et al 1997). Uncertainties in the physiological interpretation of remotely sensed data of vegetation indicate the need for reliable ground measurements of the physiological state of plants (Buschmann et al 1994, McGowen et al 2001). Many weedy species are indistinguishable from other native plants, particularly during vegetative growth (Fitzpatrick et al 1990, Price 1994, McGowen et al 2001) and several species may have quantitatively similar spectra due to the spectral signature variation present within a species (Price 1994). An important factor for distinguishing a particular species is obtaining data at the appropriate phenological stage, usually during flowering (Hunt et al 2003, Ticehurst et al 2003). Unique spectral differences may be apparent if the plant has an early green-up or senescence phase, a late senescence phase or a unique architecture or growth form. Few feasibility studies exist using ground-based reflectance spectra scaling up to remotely sensed data. McGowen et al (2001) undertook field spectral studies on a range of pasture and weedy plants across a growing season to investigate the potential of Landsat TM for mapping serrated tussock (Nassella trichotoma) and Scotch thistle (Onopordum acanthium). Both species change colour distinctly from other species and make them appropriate for remotely sensed analysis. In this example, scotch thistle and serrated tussock were mapped with 80% and 72% of infestations being identified at a reliability of 97% and 87%, respectively. Further findings by McGowen et al (2001) were that phenological changes in spectral response were found for serrated tussock during flowering, and in mid spring, the reflectance was similar to that of many native pasture species. Cochrane (2000) found potential for separation of eleven forest species based on foliar reflectance spectra. Miller et al (1991) measured leaves from ten tree species at weekly samples over a period of 150 days and found short-term variations in spectral response attributed to rainfall and temperature events. Implementing a ground-based reflectance feasibility study prior to initiating a remote sensingbased mapping project may provide a knowledge base on the likelihood of adequate detection of target species. This aspect of spectral research includes the identification of key stages of growth (flowers, green-up, senescence, plant pubescence, architecture shadowing, growth forms) to determine if and when species can best be discriminated from other vegetation over time. With such a spectral knowledge base, it may become cost-effective to commission airborne overpasses at times of greatest likeliness of species separability. 2.6.1 Spectral libraries and in situ spectral measurements Spectral libraries, particularly for geological materials, are available in the public domain, for example, Grove et al (1992), Clark et al (1993) and Satterwhite and Henley (1990) and there are proposals for a Web-based Spectral Library Information System (WSLIS) (Gomez 2001) and Specchio (Hueni & Kneubühler 2007). Reference spectra from public domain spectral libraries are often not appropriate for image matching techniques in remote sensing applications primarily because the spectra represent the reflectance response of a single specimen with a unique chemical and physical make-up recorded at a particular point in time and under given 15 experimental conditions. Further, wavelength errors may be common with uncalibrated spectrometers. Although geological materials are generally more spectrally stable than biological materials, their optical properties are affected directly or indirectly by many factors such as chemical constituents, scale, moisture content, organic matter content, associated induced interferences of some minerals such as Mn and Fe and roughness and texture of the material. The concept of a spectral standard becomes prohibitive given the numerous spectral measurements required to capture these spectral variations, given the potential change in reflectance magnitude, absorption feature position, width and/or depth. The basis of geological remote sensing has formed from knowledge of electronic processes and their associated cause (eg charge transfer, crystal field affect or vibrational transitions) and the resultant location of absorption features at specific wavelengths. The accessibility of laboratory spectra through public domain spectral libraries has provided a basis for absorption feature matching in geological applications and probably initiated much interest for further in situ spectral studies. Unlike minerals, all vegetation is composed of a limited set of spectrally active compounds (chlorophyll, accessory pigments, liquid water, starches, proteins, sugars and lignin). The causes of absorption features in vegetation are the electron transitions of molecules and the bending and stretching of chemical bonds, particularly O-H, C-H and N-H. The spectral response of vegetation is influenced by the plant structure or architectural arrangement of the plant components and this response is scale dependent (eg scales of leaf, branch, crown or canopy). Micro and macro-scaled changes are continually occurring within plants and the spectral responses of plants also vary over time. These changes include short-range diurnal variations (eg water balance responses, chlorophyll concentration), short-term seasonal changes (phenological states and associated chemical changes) and biophysical differences (plant architecture, density and homogeneity, chemical compounds present in the vegetation at a particular phenological stage). Early spectral research (eg Tucker 1977) identified that asymptotic spectral reflectance, or unchanging spectral reflectance, occurs as vegetation density increases to the point where additional increases in leaf area index or biomass do not causes a change in the spectral reflectance. Within species variability, dependence on growing season with environmental conditions and scale dependence (including background reflectance) also affect the spectral response of plant material. Particularly for ecological applications, the relationships between EMR, biophysical features, illumination geometry and viewing geometry are increasingly complex when compared to static inorganic materials. Given both the number of spectral samples and metadata required, it is therefore not surprising that there are few standardised vegetation spectral references in the public domain. It is unfortunate that much field-based research effort is not transferable due to poor research methods and a lack of considered metadata. There are therefore several causes of inherent variability in replicated measurements of the reflectance of vegetation in the field. These include (1) geometric differences of both object structure and illumination/viewing configurations (2) variations in performance of the actual field-sampling protocol; and (3) true temporal variations in the individual samples collected for analysis, or natural variability. It is necessary to determine whether the observed reflectance differences between plant species are not only statistically significant, but consistent (eg over different seasons or in different habitats) before they can be generally applied with success in remote sensing species mapping (Fyfe 2003). 16 2.6.2 A methodical approach for collecting field-based spectra – a requirement Complicating the transfer of ground-based spectra from one researcher to another are both the variance in techniques used to collect spectral information and the localised environmental conditions. The many different techniques used in obtaining field spectra have resulted in problems of data comparability between studies which compromise the long-term value of such data (Milton 1987). Further, the lack of appropriate ancillary data sets often makes previously collected data unusable for new applications (Curtiss & Goetz 2001, ASD 2001). Limited access to spectrometers and a narrow time frame for spectral data collection (ie the need to coincide spectral measurements with a remotely sensed overpass), may be reasons why a considered and consistent method of spectral data and metadata collection have not been adopted by spectral scientists. Further, there has not generally been a practice of data sharing and one of the reasons for this is the missing standardisation of the sampling process (Hueni & Kneubühler 2007). While many types of spectral measurements will prove useful for a given application, there is a need for data which may be compared from site to site, independent of atmospheric conditions (Robinson & Biehl 1979). The field campaign must be calibrated (with introduced uncertainty) and validated (reproducible), for both the measurement equipment used and the ground target to compensate for spatial and temporal variability and environmental changes (from microscopic to community scales). Issues such as timing and frequency of data collection, spatial scale of the field measurement, target viewing and illumination geometry, and the collection and documentation of metadata must be considered. Although there have been significant advances in the technical performance of field spectrometers, the same cannot be said of the methodologies of field spectroscopy (Milton et al 1995) and it is both technological and research limitations that have prevented these applications from becoming fully commercialised (Phinn, University of Queensland, 2006, pers comm). Standards are a must if spectral libraries are to be populated with useful data (Gomez 2001). To advance the spectral knowledge base of the broader remote sensing community, it is essential that a considered and documented method is undertaken and that appropriate metadata accompany spectral data. SSD has developed and implemented a standardised method of data collection. This ground-based spectral information will provide a knowledge base for feasibility studies and be used to determine the most appropriate scaling up method to airborne or satellite platforms. 17 3 Plant species and sites 3.1 Target species Priority species for sampling were determined with stakeholders. These species were identified as important species for minesite revegetation success and included native framework species, weeds of the wet/dry tropics and species that increase the risk of fire due to fuel load. Species of concern at the Ranger Project Area (RPA) and/or the rehabilitated Nabarlek minesite were also targeted for sampling and these included species that may potentially threaten the ecosystems of the country surrounding minesites. 3.1.1 Weeds Declared Weeds of the Northern Territory, which must be managed according to NT legislation, were identified as important target species and include the following: Herbs: Hyptis suaveolens (Hyptis) Grasses: Pennisetum polystachion (Mission grass) Themeda quadrivalvis (Grader grass) Shrubs: Lantana camara (Common lantana) Senna alata (Candle bush) Senna obtusifolia (Sicklepod) Senna occidentalis (Coffee senna) Sida acuta (Spinyhead sida) Sida cordifolia (Flannel weed) Stachytarpheta spp (Snake weeds) While focus was not on aquatic forms of weeds, it is envisaged that the project will expand to include aquatic plants in the future. Declared aquatic species of weeds affecting the NT include Hymenachne amplexicaulis (Olive hymenachne) and Salvinia molesta (Salvinia) which are species particularly relevant to the rehabilitation of Ranger uranium mine that may contain water features post rehabilitation. Further weeds of concern Further weeds of the Wet/Dry tropics that are found in the Alligator Rivers Region and have the potential to impact minesites in the region include those outlined by Smith (1995 & 2002): Vines: Calopognium mucunoides (Calopo vine) Centrosema molle (Centro vine) Ipomoea spp (Morning glory vine) Macroptilium atropurpureum (Siratro vine) and M. lathyroides (Phasey bean vine) 18 Merremia aegyptia (Hairy merremia vine) and M. dissecta (White convolvulus creeper) Passiflora foetida (Wild passionfruit vine) Herbs: Acanthospermum hispidum (Goat’s head, Starburr) Crotalaria goreensis (Gambia pea or Rattlepod) Hibiscus sabdariffa (Rosella) Hyptis sauveolens (Hyptis, Horehound) Stylosanthes hamata (Carribean stylo) Stylosanthes humilis (Townsville stylo) Stylosanthes scabra (Shrubby stylo) Grasses: Andropogon gayanus (Gamba grass) Cenchrus cilaris (Buffel grass) Cenchrus echinatus (Mossman River grass) Chloris inflata (Purple top chloris) Chloris virgata (Feathertop rhodes grass) Cynodon dactylon (Couch grass) Hymenachne amplexicaulis (Olive hymenachne) Melinis repens (Red Natal grass) Pennisetum polystachion (perennial Mission grass) Pennisetum pedillatum (annual Mission grass) Themeda quadrivalvis (Grader grass) Urochloa humidicola (Brachiara humidicola) (Tully grass) Urochloa mutica (NT/WA) (Para grass) Urochloa maxima (NT/WA) (Guinea grass) Shrubs: Aeschynomene americana 3.1.2 Species of the Ranger Project Area The Primary Environmental Objectives for rehabilitation of the RPA are to revegetate the disturbed sites of the RPA using local native species similar in density and abundance to those existing in adjacent areas of Kakadu National Park to form an ecosystem of long-term viability which would not require a maintenance regime significantly different from that appropriate to adjacent areas of the Park.1 Further to the RPA requirements, the Environmental Requirements of the Commonwealth of Australia for the Operation of Ranger 1 Northern Territory of Australia Mining Management Act 2006, authorisation number 0108-04 variation of authorisation number 0108-03. 19 Uranium Mine (1999) state that operations should not result in change to biodiversity, or impairment of ecosystem health, outside of the RPA, and that the operations at Ranger will not result in any adverse impact on Kakadu National Park through the introduction of exotic fauna or flora. Hollingsworth and Meek (2003) describe six vegetation communities, comprising Eucalypt savanna woodlands and a Melaleuca sedge/grassland as analogue descriptions for the ecosystem reconstruction for the RPA. They recommend a list of 60 candidate species (including overstorey, midstorey and understorey species) for restoration of the landform based on their commonness, dominance and similarity to community structure in similar adjacent areas in Kakadu National Park. The ground covers, or understory described included 40 species, and these species are ranked with importance values across habitats. In order of importance for ground covers, they list the following grasses: Sorghum intrans, Aristida holathera, Heteropogon triticeus, Sehima nervosum, Dicanthium fecundum, Alloteropsis semialata, Thaumastochloa major and Ectrosia agrostoides. Brennan (2005) undertook a quantitative description of native plant communities for potential use in revegetation at Ranger uranium mine. His research was undertaken on natural plant communities on hills (both schists and sandstones) in the region and those on the Koolpinyah surface on the Ranger lease. He measured herbaceous plants quantitatively at 13 sites. For the herbaceous component, he found that there were natural plant communities on hills in the region that were very similar floristically to the vegetation in eucalypt woodlands on the Ranger lease. A summary of the herbaceous flora findings by Brennan (2005) include: Ranger sites and all sandstone hills were dominated by Sorghum brachypodum. Sorghum accounted for almost 60% of the total seasonal production of herbaceous biomass at the Ranger sites. The species was absent on schist hills. A further 20% of the total annual productivity (at the Ranger sites) was added by other grasses (22 species). Of these Heteropogon triticeus and Alloteropsis semialata were ‘high biomass’ species, but the short grasses, Schizachyrium fragile, Eriachne agrostidea, Eriachne ciliata, Thaumastochloa major, Digitaria gibbosa, Aristida holathera, Brachiaria holosericea, Mnesithea formosa, Sporobolus pulchellus Pseudopogonatherum irritans and Yakirra nulla each had high site frequencies. There were several herbaceous species with high frequency amongst the Ranger sites and the schist sites eg Heteropogon triticeus, Schizachrium fragile, Mnesithea formosa, Alloteropsis semialata and Ipomoea graminea. However, only Heteropogon triticeus was noted as having high biomass on both site types. The differences in species identified by Hollingsworth and Meek (2003) with Brennan (2005) can be attributed to the sites surveyed, and more importantly, the method of data reporting. For example, Hollingsworth and Meek (2003) identified many of the same grass species as Brennan (2005), but many of these grass species do not feature as a candidate species because of the criteria used to determine a candidate (ie those that occur in more than one replicate plot). Species important for the rehabilitation of the RPA can be derived from the Ranger revegetation strategy of the trial landform, which include the following understory species (Daws et al 2008): Aristida hygrometrica Aristida holathera Eragrostis sp 20 Eriachne shultziana Psuedopogonantherum irritans Schizachyrium fragile Spermacoce sp Daws et al (2008) probably deliberately exclude high biomass covers like Sorghum spp and Heteropogon spp in an attempt to reduce fire on the landform. Species may also have been selected for ease of germination and seed collection. In addition, Energy Resources of Australia (ERA) held a workshop on the Weeds at Ranger and defined those weeds of most concern to the Ranger Site, important weed species to the Ranger site and weed species not present, but important if found (EWL Sciences 2005): Weeds of most concern to the Ranger site: Andropogon gayanus (Gamba grass) Calopognium mucunoides (Calopo vine) Pennisetum polystachion (perennial Mission grass) Pennisetum pedillatum (annual Mission grass) Themeda quadrivalvis (Grader grass) Other important species at RUM are: Crotalaria goreensis (Gambia pea or Rattlepod) Stachytarpheta spp (Snake weeds) Sida acuta (Spinyhead sida) Hyptis suaveolens (Hyptis) Ipomoea spp (Morning glory vine) Macroptilium atropurpureum (Siratro vine) and M. lathyroides (Phasey bean vine) Senna alata (Candle bush) Senna obtusifolia (Sicklepod) Senna occidentalis (Coffee senna) Passiflora foetida (Wild passionfruit vine) Stylosanthes hamata (Carribean stylo) Stylosanthes humilis (Townsville stylo) Stylosanthes scabra (Shrubby stylo) Cenchrus cilaris (Buffel grass) Important species if found at RUM are: Cenchrus echinatus (Mossman River grass) Urochloa mutica (NT/WA) (Para grass) Urochloa maxima (NT/WA) (Guinea grass) 21 3.1.3 Species of the Nabarlek area A project was commenced by eriss in mid-2003 at the Nabarlek minesite to quantitatively assess revegetation performance since 1995, and to develop survey methodologies applicable to the future rehabilitation of the RPA. Canopy cover and ground cover vegetation were characterised on sample transects located on rehabilitated areas of the minesite and on adjacent natural reference sites, and compared. The results of the surveys conducted during a dry and wet season (Bayliss et al 2004b) are summarised in Table 1 and below. Table 1 Plant species found on transects in the late wet season, May 2004 (Source Bayliss et al 2004b) GRASSES HERBS Genus species Native/Weed Genus species Genus species N N N N Aristida holathera Aristida ingrata Bothriochloa bladhii Chrysopogon fallax N N N N Allium cernum Alysicarpus schomburgkii Alternanthera augustifolia Bergia pusilla N N N N Ipomea abrupta Ipomea diversifolia Ipomea eriocarpa Ipomea sp1 Arthrostylis aphylla Cyperus iria Fimbristylis composita Fimbristylis dichotoma N N N N N N N N N N N N N N N N N W W W W W W W W W W W W W W Digitaria bicornis Digitaria gibbosa Dimeria ornithopoda Eragrostis potamophila Eragrostis spartinoides N N N N N N N N N N N N N N N N N N N N N N N N N N N N N N N N N N N N N N N N N N N N N N N N N W W W W W W W W W W W W Blumea axillaris (probably) Blumea sp1 Blumea tenella Bonamia pannosa Buchnera asperata Buchnera sp Cartonema parviflorum Cartonema spicatum Cartonema trigonospermum Cyanthillium cinereum Euphorbia muelleri Euphorbia schizolepis Euphorbia schultzii Fabacea sp Galactia tenuiflora Gomphrena flaccida Goodenia armstrongiana Goodenia pilosa Goodenia porphyrea Haemodorum sp Hybanthus enneaspermus Hydrolea zeylanica Jacquemontia browniana Ludwigia octovalvis Ludwigia perenis Malachra fasciata Marsdenia viridiflora Minuria macrorhiza Mitrasacme connata Mollugo pentaphylla Murdannia graminea Pachynema junceum Pachynema sphenandrum Phyllanthus eutaxioides Physalis minima Polycarpaea holtzei Polygala longifolia Polygala triflora Ptilotus corymbosus Pycnospora lutescens Sauropus ditissoides Scoparia dulcis Sebastiana chamaelea Sowerbaea alliacea Spermacoce stenophylla Stylidium semipartitim Stylidium turbinatum Thysanotis banksii Utricularia chrysantha Aeschynomene americana Alysicarpus vaginalis Euphorbia heterophylla Euphorbia hirta Hyptis suaveolens Macroptilium atropurpureum Macroptilium lathyroides Sida acuta Sida rhombifolia N N N W Merremia quinata Tephrosia remotiflora Xenostegia tridentata Passiflora foetida Fimbristylis furva Fimbristylis pauciflora Fimbristylis phaeoleuca Fimbristylis squarrulosa Leptocarpus spathaceus Rhynchospora longisetis Tricostularia undulata Xyris cheumatophila Scleria brownii Scleria novae-hollandiae Yakirra nulla Andropogon gayanus Chloris inflata Chloris gayana Chloris virgata Cynodon dactylon Echinochloa colona Melinis repens Paspalum plicatulum Pennisetum pedicellatum Pennisetum polystachion Setaria sp Sporobolus sp Urochloa maxima Urochloa mutica Stylosanthes hamata Stylosanthes viscosa Tridax procumbens 22 Native/Weed SEDGES Native/Weed Eriachne burkittii Eriachne major Heteropogon contortus Heteropogon triticeus Imperata cylindrica Pseudopogonatherum contortum Pseudopogonatherum irritans Pseudoraphis spinescens Rottbeollia cochinchinensis Schizachyrium fragile Sorghum plumosum Genus species VINES A total of 121 ground cover species were recorded during the wet season survey. Of these 34 (28%) were grasses, 73 herbs (60%) and 14 (12%) sedges. There were 11 (32%) weed grasses and 17 (23%) weed herbs. Weeds comprised 48% of all species on the minesite. Twice as many native grass species were found on reference sites than minesites Overall, five times more weed herb species were found on minesites compared with reference sites. However, there were three times more (native) sedge species on reference sites compared with minesites in both seasons. Reference sites remain largely free of grass weeds that typify the minesite. The cover of native grasses on reference sites was about five times that of minesites and the cover of native grasses approximately doubled in both locations. Similar dominance ratios for biomass were found as for percentage ground cover (ie grasses>>herbs>>sedges). There was 5.5 times more native grass biomass on reference sites compared with minesites and, in contrast, 318 times more weed grass biomass on minesites compared with reference sites. 3.1.4 Priority target species A summary of declared weeds, weeds of concern and ground covers of importance to RUM and Nabarlek are outlined in Table 2a–c. The list focuses on weeds and native grasses only, and further information on native herbs and sedges can be found in Hollingsworth and Meek (2003), Brennan (2005) and Bayliss et al (2004a & b). Table 2a Summary of target weedy grass species important for Ranger, Nabarlek and weeds (declared/of concern) Weedy grasses Genus Species Ranger** Nabarlek* Weeds (declared/of concern) Andropogon gayanus Cenchrus cilaris Cenchrus echinatus Chloris inflata Chloris gayana Chloris virgata Cynodon dactylon Echinochloa colona Melinis repens Paspalum plicatulum Pennisetum pedicellatum Pennisetum polystachion Setaria sp Sporobulus sp Themeda quadrivalvis Urochloa humidicola Urochloa maxima Urochloa mutica ** identified by Brennan (2005), Hollingsworth and Meek (2003), EWLS (2005) and Daws et al (2008) * identified by Bayliss (2004a & b) 23 Table 2b Summary of target weedy herb and vine species important for Ranger, Nabarlek and weeds (declared/of concern) Weedy herbs and vines Genus Species Ranger** Nabarlek* Acanthospermum hispidum Aeschynomene americana Alysicarpus vaginalis Calopognium mucunoides (vine) Centrosema molle (vine) Crotalaria goreensis Euphorbia heterophylla Euphorbia hirta Hibiscus sabdariffa Hyptis suaveolens Ipomoea graminea Ipomoea spp (vine) Macroptilium Weeds (declared/of concern) atropurpureum Macroptilium lathyroides Passiflora foetida (vine) Senna alata Senna obtusifolia Senna occidentalis Senna alata Sida acuta Sida cordifolia Sida rhombifolia Stachytarpheta spp Stylosanthes hamata Stylosanthes humilis Stylosanthes scabra Stylosanthes viscose Tridax procumbens ** identified by Brennan (2005), Hollingsworth and Meek (2003), EWLS (2005) and Daws et al (2008) * identified by Bayliss (2004a & b) Weedy ground covers, with an emphasis on grasses, were identified by stakeholders as the priority species for spectral measurement. The spectral identification and discrimination of these species is important to minesite applications because declared weeds in any location must be managed, weedy covers do not feature in the surrounding ecosystem of the RPA and the expanse of weedy covers at Nabarlek has hampered revegetation attempts and increased the threat of fire affecting framework species. The spectral identification and discrimination of weedy covers maybe relevant to other landscape applications. Native species that were colocated with dense and homogenous patches were targeted opportunistically. Native species will be more thoroughly addressed during the Ranger Trial Landform research. 24 Table 2c Summary of target native grass species important for Ranger and Nabarlek Native grasses Genus Species Ranger** Nabarlek* Alloteropsis semialata Aristida holathera Aristida hygrometrica Aristida ingrate Bothriochloa bladhii Brachiaria holosericea Chrysopogon fallax Dicanthium fecundum Digitaria bicornis Digitaria gibbosa Dimeria ornithopoda Ectrosia agrostoides Eragrostis potamophila Eragrostis spartinoides Eragrostis sp Eriachne agrostidea Eriachne burkittii Eriachne ciliata Eriachne major Eriachne shultziana Heteropogon contortus Heteropogon triticeus Imperata cylindrical Mnesithea formosa Pseudopogonatherum contortum Pseudopogonatherum irritans Pseudoraphis spinescnes Rottbeollia cochinchinensis Schizachyrium fragile Sehima nervosum Sorghum brachypodum Sorghum intrans Sorghum plumosum Sorghum stipodeum Spermacoce sp Sporobolus pulchellus Thaumastochloa major Yakirra nulla ** identified by Brennan (2005), Hollingsworth and Meek (2003), EWLS (2005) and Daws et al (2008) * identified by Bayliss (2004a & b) 25 Four pastoral grasses, with potential to become weeds, were identified at the Darwin Berrimah Research Farm. These grasses were represented as dense and homogenous patches and were located within a short walking distance making spectra of these species easily obtainable in a few hours of sampling. The opportunity to obtain temporal readings of these following four pastoral species was taken: Brachiaria humidicola (Tully grass), Digitaria eriantha (Pangola grass), Digitaria milanjiana (Jarra grass) and Digitaria swynnertonii (Arnhem grass). 3.2 Fortnightly measurements of ground cover The reflectance signatures of weedy and native ground covers are to be sampled from plots. The plots aim to represent dense and homogenous covers of the plant species of interest. A fortnightly sampling period is both logistically feasible and designed to capture distinct phenological change (excluding the micro and macroscopic chemical and physical changes continually occurring within plants). The Top End is suitable for high frequency spectral readings, apart from the ‘wet season’. Variations in atmospheric conditions (eg sun angle, humidity and haze from bushfires) do have to be accurately measured and recorded with the spectral response. The fortnightly measurements are then correlated with meteorological data, measurement metadata and cover descriptions. 3.3 Sites A challenge in the project design phase was to locate sites with homogenous dense cover that were unlikely to be disturbed from threats such as fire, development or mowing. In addition, the sites needed to be in close proximity to each other and the eriss laboratory to reduce travel times. Replicate plots have been established around the greater Darwin region with support from Commonwealth and Territory Government Departments and private industry via access to land from CSIRO, Berrimah Farm and Crocodylus Park, respectively (Figure 5). Figure 5 Proximity map of Darwin area sites Table 3 summarises the species sampled for the spectral database during 2006–07. Figures 6–8 show the location of the species sampled in 2006. Observations over the late wet season of 2007 have shown that not all plots remain compositionally pure, and in some cases, the dominant cover present in 2006 has been outcompeted by another cover type or grazed. In addition, new species have become readily 26 identifiable after the wet season flush. All species have been identified by the Northern Territory Herbarium. Where a plot became overgrown with another species of pure composition, the site was given a new identifying code for the following sampling season. Table 3 Species sampled for the database during 2006–07 Genus Species CP* CSIRO Aeschynomene americana CP26 Weed shrub Andropogon gayanus CP21 Weed grass Brachiaria humidicola Calopognium mucunoides Centrosema molle Chloris inflata Chloris virgata Crotalaria goreensis CP16,36 Weed shrub Crotalaria pallida CP34 Weed shrub Cynodon dactylon CP13 Weed grass Digitaria bicornis CP25 Native grass Digitaria eriantha BF05 Pasture grass, potential weed Digitaria milanjiana BF01 Pasture grass, potential weed Digitaria swynnertonii BF04 Pasture grass, potential weed Heteropogon contortus CP14 Native grass Hibiscus sabdariffa CP35 Weed shrub Hyptis suaveolens CP01,03 Declared weed NT Ipomoea spp CP23 Weed vine Melinis repens Panicum mindanease Passiflora foetida (vine) Pennisetum pedicellatum Pennisetum polystachion Schizachrium spp CP15 Endemic native grass Senna spp CP18 Declared weed NT Sida cordifolia CP08,33 Declared weed NT Sorghum stipodeum Stachytarpheta australis CP09,32 Declared weed NT Stachytarpheta cayennensis 07,20,31 Declared weed NT Stylosanthes hamata CP17 Weed herb Stylosanthes humilis CP02 Urochloa maxima Urochloa mutica CS10 BF* BF02,03 CP05 Status Pasture grass, potential weed Weed vine Weed vine CP12 Weed grass Weed grass CS12 CP10,11 CP04 Weed grass Native grass CS06 Weed vine CS07 Weed grass CS05 Declared weed NT 02,04,11 Native grass CS01,03 Weed herb CS09 Weed grass CP06 Weed grass CP = Crocodylus Park BF = Berrimah Farm 27 Figure 6 Location of CSIRO Sites (April 2007) Figure 7 Location of Crocodylus Park Sites (Western Paddock, April 2007) 28 Figure 8 Location of Berrimah Farm sites (April 2007) Examples of established plots are illustrated in Figure 9. Digitaria milanjiana (Jarra Grass) 2008-01-23 Brachiaria humidicola (Tully Grass) 2008-01-23 Stylosanthes humilis (Townsville stylo) 2008-03_19 Digitaria swynnertonii (Arnhem Grass) 2008-01-23 Hyptis suaveolens 2008-03-04 Sorghum stipodeum 2008-03-19 Melinis repens (red natal grass) 200803-19 Aeschynomene Americana 2008-0304 Pennisetum pedicellatum 2008-03-04 Figure 9 Examples of vegetation plots used to record the spectral reflectance of selected species over time 29 Selected photographic and spectral examples for one plot of Digitaria swynnertonii (Arnhem Grass) is displayed in Figure 10. 2007_04_11 2007_04_23 2007_05_10 2007_06_12 2007_07_18 2007_09_21 2007_10_17 2007_11_25 2008_01_24 Figure 10 Selected photographic and spectral examples for one plot of Digitaria swynnertonii (Arnhem Grass) over a period of time 30 3.4 Project limitations There are limitations in the project design with respect to the range of species sampled, the number of replicate plots of a given species sampled and differences in soil conditions and localised atmospheric conditions. These limitations have been acknowledged and thought given to minimise the influence on spectral results. 3.4.1 Species range and replication The fortnightly plots were established to enable all spectra to be gathered efficiently. For the required frequency of spectral measurements, high travel times were not feasible and site selection was therefore restricted to the greater Darwin region and limited to a few locations. The species available for sampling were dependent on these criteria, although species of potential spectral sampling are continually being sourced, particularly during flowering (the post-wet season). Priority species are those weeds occurring in the wet/dry tropics (Smith 1995 & 2002) that are of concern to the revegetation success at minesites by increased threat of disturbance, such as fire, or those species that potentially threaten rehabilitation success, particularly with respect to species diversity. Weeds of National Significance, including wetland examples (eg Salvinia and Hymenachne) are currently not a high threat to minesite rehabilitation in the ARR due to the small areal extent of post-mining wetland features. Priority has been given in establishing plots of a range of species rather than establishing plots of species replication. It is acknowledged that a limiting factor of the method is that there may be species that potentially confound the spectral response of the species range, but for which no knowledge will be acquired. Nevertheless, the project scope will provide a knowledge base far greater than that ever obtained for vegetation spectra with respect to species numbers, frequency of sampling, duration of sampling and method and metadata documentation. Where possible, replicates of species are sampled at different locations. For some species, such as Heteropogon contortus, which is very variable morphologically (Sharp & Simon 2002), replication is considered vital. 3.4.2 Growth medium and environmental conditions A vegetative species’ spectral response is a function of a variety of factors ranging from soil type and soil condition to local meteorological conditions. The spectral response also varies over scales ranging in time (diurnal to seasonal) and space. It is acknowledged that the spectral response measured is a function only of a point in time for a particular vegetation sample. Ideally, a number of replicates under different conditions would be spectrally sampled. To minimise and account for external variation, species are sampled from maintained plots that maximise a homogenous response (ie non-target species are continually removed from the plot). The soil inter-space is spectrally measured wherever a <100% cover is obtained and detailed metadata is used to define any change in localised conditions both within the target plant and external condition. 31 4 Factors affecting spectral reflectance measurements 4.1 Introduction Spectral measurements need to be accurate and precise representations of the target material but there are a variety of factors that affect the quality of spectral measurements. Careful consideration must be given to the methods adopted to undertake spectral measurements, and to the variety of factors including the optical propagation and those environmental and experimental issues that can affect the quality of resultant spectral data. Critical issues for making in situ spectral measurements have been reported (eg Nicodemus et al 1977, Duggin & Philipson 1982, Milton 1987, Curtiss & Goetz 2001, Milton et al 1995, Jupp 1997, Salisbury 1998, Schaepman 1998, Milton 2001) and these include the properties of the atmosphere, timing of measurement, height of measurement, orientation of measurement, FOV, spectral averaging and calibration of the spectral data (Milton 1987, Deering 1989, Rollin et al 2000). Milton et al (1995) define errors in field spectroscopy, specifically referring to diffuse irradiation, non-simultaneous sampling of target and reference panel and time delay between successive samples. Curtiss and Goetz (2001) and ASD (1999 and 2001) outline the importance of appropriate ancillary data with respect to sources of natural illumination, atmospheric transmission, presence of clouds and wind, timing of data acquisition, sampling strategy and viewing geometry. These issues must be considered because they have a potential effect on the accuracy of spectral measurements. Ultimately, field spectral measurements are both accurate and precise with uncertainty estimates for a constant integration. Accuracy refers to confidence in the correlation between measurements in one location and another or between a measurement and a recognised standard, whereas precision implies careful measurement under controlled conditions that can be repeated with similar results and measured with confidence (Deering 1989). Error is defined as the difference between the measured value and ‘true’ value of the entity, and can result from random or systematic sources (Milton et al 1995). Reflectance spectra measured under field conditions are subject to several sources of error, but welldesigned field spectrometers and careful experiment design can minimise some of these (Milton & Goetz 1997). The sources of information pertinent to the issues affecting spectral measurements are fragmented. Further, there are no such documents or manuals that synthesise all the factors influencing spectral measurements and the methods used to minimise and account for extraneous factors in spectral measurement. Issues to be considered when designing a spectral library database have been summarised (Pfitzner et al 2005) and are conceptualised in Figure 11. The factors that affect standardised measurements can be summarised to include: environmental (eg wind speed and direction, cloud cover and type, temperature, humidity, aerosols), viewing geometry (fore optic degree and the field of view or FOV and instantaneous-field-of-view or IFOV, fore optic height above target and ground), illumination geometry (date, time, position and sun altitude, azimuth and orientation, smoke and haze), properties of the target (physical and textural, chemical and structural make-up and BRDF properties), integration and measurement timing, calibration of the instrument and reference standard and general experimental design. 32 Figure 11 Conceptual diagram of the factors affecting spectral measurement The field analyst and experimental design can be used to control, to an extent, the viewing manner of the reference and target to reduce erroneous results due to poor illumination geometry and transition conditions, the timing of data collection (including integration and 33 spectrum averaging), spatial scale of measurement and the calibration procedures to minimise variability in the spectral response, such as white reference monitoring. Consideration and documentation of each of these components are essential in obtaining meaningful spectra in the field, but rarely are these reported. Lack of consistent field methodologies, appropriate metadata collection associated with spectral data, consideration of spatial and temporal variation in spectral response of the sensor and target and accurate calibration of both the sensor and data, are factors that have prevented the transfer of knowledge from one application to another and also limited the commercialisation of field and imaging spectroscopy applications. The conceptual diagram in Figure 11 highlights not only the factors that need to be considered within the experimental design to maximise the accuracy of spectra, but also highlights the need to document these components as spectral metadata, including the capture of photographs of the sky conditions and target. It is only once consideration is given to the experimental design of spectral collection and that accurate metadata including photographs are captured that we can begin to populate spectral libraries representing ‘reference spectra’ and use these spectra for separability and similarity assessment studies across applications. For the full capability of spectral sensing technology to be exploitable, it is essential that a well-populated spectral library exists and is accessible in a user-friendly way by the user of this technology (Gomez 2001). This necessitates a consistent and repeatable spectral collection method with standards adhered to and the inclusion of metadata. The advantages of collecting spectra with the future view of data transfer are: that data quality improves; systematic bias is reduced; variability associated with data collection is minimised; extraneous factors can be accounted for; and, measurements of accuracy and precision are provided. The remainder of this report provides a review of the factors affecting spectral measurements, highlights those issues to which consideration can be given, makes recommendations on measurement methods to minimise the influence of these factors and documents standardised procedures to maximise a true spectral response. Section 5 focuses on spectra collected with a single beam instrument like that of the FieldSpecPro-FR (ASD Inc). 4.2 SSD’s spectrometer Revegetation applications require data of high spectral resolution measured at narrow sampling intervals contiguously across the visible to shortwave infrared. The spectral instrument needs to be portable, easily operatable in the field environment, have a low Noise-equivalent-Radiance (NEdL) and have demonstrated accurate repeatability. Here we refer specifically to the FieldSpecPro-FR. FieldSpecPro-FR instrument characteristics are provided in Table 4 (see ASD 1999 & 2002 for details). The instrument utilises three integrated spectrometers. In the VNIR (350-1050 nm), the spectral sampling interval of each channel is 1.4 nm but the spectral resolution (FWHM) is approximately 3 nm at around 700 (ASD 1999). The sampling interval for the SWIR regions (900–1850 and 1700–2500) is 2 nm, with spectral resolution varying between 10–12 nm. The spectral information from the three spectrometers is subsequently corrected within software for baseline electrical signal (dark current), and then interpolated to a 1 nm sampling interval over the wavelength range (Fyfe 2004). The FieldSpecPro-FR collects light passively by means of a fibre optic cable. The standard fibre optic cable length of the FieldSpecPro-FR is 1 m. Longer cables result in signal attenuation, particularly beyond 2000 nm (D. Hatchell, ASD Inc. pers comm 2004). Figure 12 illustrates the loss in signal short of 500 nm and particularly at wavelengths greater than 2200. 34 Figure 12 Attenuation versus length of permanent FR fibre. Source: http://support.asdi.com/Document/Viewer.aspx?id=56 A trade-off between the (future) need for ease of measurement of shrubs and trees against a drop in the NEdL in the far infrared region was made so that the SSD FieldSpecPro-FR is characterised by a 5 m fibre optic cable (Table 4). The fibre optic conical view subtends to a full angle of 25 and fore optics may be attached to the cable to limit the lens angle (1 and 8). Table 4 FieldSpecPro-FR – product specifications Spectral range 350–2500 nm Spectral resolution 3 nm @ 700 nm, 10 nm @ 1400/2100 nm Sampling interval 1.4 nm @ 350–1050 nm, 2 nm @ 1000–2500 nm Scanning time 100 milliseconds Detectors One 512 element Si photodiode array 350–1000 nm (VNIR). Two separate, TE cooled, graded index InGaAs photodiodes 1000–2500 nm (SWIR 1 and SWIR 2). Transition splice position ~1000 nm between VNIR and SWIR 1, 1800 nm for SWIR 1 and SWIR 2 Input Optional fore optics available Noise Equivalent Radiance UV/VNIR 1.4 x 10⁻⁹ W/cm 2 /nm/sr @ 700 nm (NEdL) NIR 2.4 x 10⁻⁹ W/cm 2 /nm/sr @ 1400 nm NIR 8.8 x 10⁻⁹ W/cm 2 /nm/sr @ 2100 nm Weight 15.8 lbs or 7.2 kg Calibration Wavelength, reflectance, radiance*, irradiance*. All calibrations are NIST traceable (*radiometric calibrations are optional). Fibre-optic cable Standard ASD fibre optic cable is 1 m in length. SSD’s ASD has a 5 m fibre optic cable. 35 4.3 Considerations with single Field-of-View (FOV) instruments It is beyond the scope of this report to review the physics of propagation of EMR in free space or the interaction of EMR with matter. Extended summaries of the relationship with laws of radiation, absorption and emissivity, the physics of measuring extended sources in the field and the relationship of bidirectional reflectance distribution function or BRDF with reflectance measurements can be found in numerous references such as Nicodemus et al (1977), Horn and Sjoberg (1978), Silva (1978), Robinson and Biehl (1979), Duggin and Philipson (1982), Baumgardner et al (1985), Milton (1987), Deering (1989), Pinter et al (1990), Hapke (1993), Milton et al (1995), Jupp (1997), Schaepman (1998), Hatchell (1999), Rees (2001) and Schaepman-Strub et al (2005). Note that ASD (1999) and Salisbury (1998) provide a glossary of terms for NIR terminology. Simply, the amount of the reflected power gathered by the sensor is proportional to the square of the FOV, the sensor aperture area, the irradiance, the irradiance angles, the sensor view angles, the bidirectional reflectance distribution of the target, optical transmission, quantum efficiency and wavelength dependency. 4.3.1 The reflectance factor (RF) The fundamental property governing reflectance behaviour is its Bidirectional Reflectance Distribution Function (BRDF) (Nicodemus 1982 in Deering 1989) which cannot be measured directly (Nicodemus et al 1977) but approximated if multidirectional field radiance measurements are made (Deering 1989). The term bidirectional reflectance factor (BRF) relates the reflectance from a target surface to the reflectance that would be observed from a Lambertian surface located at the target. BRF is considered the standard reflectance term as defined fully by Nicodemus et al (1977) to describe the field reflectance measurement: one direction being associated with the viewing angle (usually 0 from normal) and the other direction being the solar zenith and azimuth angles (Robinson & Biehl 1979, Silva 1978): R of standard panel (i, i: r, r), where (i, i) and (r, r) are the zenith and azimuth angles of the incident beam and reflected beam, respectively. In reality, the BRF can only be estimated using dual-field-of-view goniometers. A critical assumption in spectral measurements using single FOV instruments is that the BRF can be accounted for. The essential field calibration procedure consists of the measurement of the response, Vs, of the instrument viewing the subject and measurement of the response, Vr, of the instrument viewing a level reference surface to produce an approximation to the BRF of the subject (Robinson & Biehl 1979, Duggin & Philipson 1982, Deering 1989, Milton 1987). Rs (i, i; r, r) = Vs x Rr (i, i; r, r) x Kr. Vr where Rr (i, i; r, r) is the bidirectional reflectance factor of the reference surface, Rr is required to correct for its non-ideal reflectance properties (including non-ideal reflectivity and non-Lambertial behaviour), and Kr = measured reflectance of standard reflectance in band pass rS. The amount of reflected EMR from the surface is expressed as a proportion of that which fell on the surface, thereby compensating for the intensity and spectral distribution of the light source (Milton 2001). Assumptions are that the incident radiation is dominated by its 36 directional component (clear sky), the instrument responds linearly to entrant flux, the reference surface is viewed in the same manner as the subject and the conditions of illumination are the same, the entrance aperture is sufficiently distant from the subject and the angular FOV is small with respect to the hemisphere of reflected beams (limit of 20° angular FOV), and the reflectance properties of the reference surface are known (Deering 1989, Robinson & Biehl 1979, Milton 1987). Of these assumptions, the one that is always violated in the field situation is the absence of sky light, which results in measurements of BRF being made under an irradiance distribution that may be significantly different from the slender elongated cone referred to. In general terms, radiance is a directional quantity and reflectance is defined as the ratio of the reflected radiation to the total radiation falling upon the surface. However, field spectral measurements are integrated over time, finite wavebands and solid angles. Terms such as hemisphericalconical reflectance factor (Deering 1987, Milton 1987, Schaepman-Strub et al 2005), hemispherical-directional reflectance factor (Abdou et al 2002) and directional/anisotropic– hemispherical reflectance factor (Milton et al 1995) have been used to emphasise that the reflected radiance is measured over an angle that is not strictly directional and these terms are more appropriate for field measurements. Because a single beam instrument violates the assumptions of BRF (ie the conditions of illumination will not be exactly the same), the numerous variables that factor into ‘reference’ spectra must be carefully considered. The objective is to obtain the measurements that are nearly independent of the incident irradiation and atmospheric conditions at the time of measurement (Robinson & Biehl 1979) by measuring radiation reflected from a surface accompanied by a near-simultaneous measurement of radiation reflected from a reference panel in order to calculate a BRF for the surface (Jackson et al 1987). Intelligent use of the BRF technique is an accurate and practical means to obtain the spectral optical properties of targets needed for advances in remote sensing (Robinson & Biehl 1979). Further, there are mechanisms to check the BRF of the sequential measurements. In most field measurements, it is the reflectance factor (RF) that is estimated (Robinson & Biehl 1979). Reflectance factor is defined as the ratio of the radiant flux actually reflected by a sample surface to that which would be reflected into the same reflectance-beam geometry by an ideal perfectly diffuse (Lambertian) standard surface irradiated in exactly the same way as the sample (Nicodemus et al 1977 in Deering 1989, Robinson & Biehl 1979, Rollin et al 2000). 4.3.2 Standard panels Field reference panels are used to standardise measurements of target radiant flux in order to derive the RF on the assumption that the flux reflected from the panel can be used as a surrogate of the incident global irradiance (Kimes & Kirshner 1982 in Rollin et al 1995, 1997, 1998, 2000). This assumes that the viewing and illumination geometries are exactly the same for the target and the reference panel. The requirements of the standard reference are that the panel is close to a Lambertian assumption and therefore insensitive to BRDF (over the full wavelength range), insensitive to contamination, weathering and ageing, and 100% reflectivity over all wavelengths. Obtaining reflectance spectra of a standard provides a good approximation to the true BRF of the subject because the irradiance is dominated by its directional component, the reference is nearly Lambertian and the BRF of the subject is not radically different from Lambertian (Robinson & Biehl 1979). For a true Lambertian reference the panel reflectance factor is assumed to be 1.0 and must be closely monitored and assessed for the panel to maintain its Lambertian behaviour (Jupp 1997) and assure a valid reflectance-factor data (Jackson et al 37 1987). However, in the field, the panel is illuminated by a combination of direct and diffuse flux distributed non-uniformly (Milton et al 1995). When well maintained, Labsphere Spectralon® panels are relatively flat over the 250–2500 nm region providing near perfect reflectance (98–99%) and thermal stability (Schaepman 1998). Spectralon® is a sintered polytetrafluoroethylene-based material that has emerged as the preferred reflectance material for field reference panels (Rollin et al 1997, 1998). The Spectralon® Calibration Certificate states the uncertainty of each panel and is often less than 0.005% for the spectral range 300–2200 nm, however, it should be realised that laboratory calibration conditions are very different from the field environment. Note that the panel reflectance is not uniformly high at all wavelengths (as shown in Figure 13) and that there is a 6% absorption band near 2150 nm and a falloff in reflectance to longer wavelengths (Salisbury 1998). Spectralon® is an optical standard and although the material is very durable, care should be taken to prevent contaminants such as finger oils from contacting the material’s surface. The surface of the panel should never be touched. Every effort must be made to keep the panels clean and scratch free as the calibration precision and accuracy depends on a calibrated clean panel and the slightest cover can alter the reflectance properties. Spectralon® panels should be housed in their respective case and only opened for the time when an actual measurement is required. Once the measurement is complete, the case housing the panel should be closed to prevent contamination from particles including those that may be too small to be visualised such as ash and dust. Figure 13 Typical 8° Hemispherical % reflectance of a 99% calibrated Spectralon® reflectance panel (Source: Labsphere) 4.4 Spectrometer FOV and ground-field-of-view (GFOV) Field of view (FOV) is used to define the solid angle through which light incident on the input or fore optics will enter the detector system. It is a vague parameter and gives no indication as to the responsivity of the system to light from different angles within the FOV. Most data are collected with the sensor mounted vertically over the surface (nadir view) (Robinson & Biehl 1979, Silva 1978, Rollin et al 2000, Baumgardner et al 1985, Milton et al 1995), but some spectral libraries contain data measured in other configurations, such as along the solar principal plane (maximum anisotropy) or at the anti-solar peak or ‘hotspot’ (Milton et al 2009, Rollin et al 1997). Here we refer specifically to data collected at nadir. 38 The area of ground from which spectra are recorded, or ground-field-of-view (GFOV), is controlled by the angular FOV () of the lens attached to the fibre optics and the height (H) that the instrument is held above the target. The FOV must be appropriate to integrate and represent the geometric features of the target. The FOV is an ellipse that is approximately circular at nadir. The geometry can be considered as a cone intersecting a plane that is perpendicular to the cone. To estimate the area (or GFOV) covered from a certain height: r = tan (/2) x H where, r = radius of the circular FOV with area A H = height the spectrometer is held above the target surface = angular FOV for spectrometer A=r 2 where, A = area sampled For example, to establish the area (A) sampled with = 8° and H = 100cm Figure 14 Obtaining the GFOV r = (tan (8/2) x 100 = 7.02 cm A=r = 2 (7.02) 2 = 154.8cm 2 The area (A) sampled from a height of 1m is 0.0155m² Note that the sensitivity across the FOV is not uniform and therefore, the size of the area that is to be measured should be large relative to the GFOV of the sensor. MacArthur et al (2006) demonstrated that areas outside the theoretical FOV influence the reflectance recorded and therefore the homogenous portion of the target should be larger than the anticipated GFOV. The FieldSpec® pistol grip is available with both a sighting scope and levelling device. SSD also use two remote controlled laser pointers that are attached on either side of the pistol grip and these accessories allow the user to view the spot where the fore optic is pointed while oriented in nadir-viewing geometry. Because of the need to orient the FOV geometry in a stable way, measurements are performed using the fore optics mounted on a tripod. The small size of the fore optics greatly reduces error associated with instrument selfshadowing, but the instrument as well as other objects (including the operator) should be placed as far as possible from the surface under observation as even when the area viewed by the fore optic is outside the direct shadow of the instrument, the instrument still blocks some of the illumination (either diffuse skylight or light scattered off surrounding objects) that would normally be striking the surface under observation (ASD 1999). In addition to the bare fibre optic (25°), SSD also have an 8° and 1° degree lens. 39 Table 5 provides a summary of the diameter of the FOV given for selected heights using a 1°, 8° and 25° lens. The field and laboratory measurements made at SSD are undertaken with an 8° foreoptic so that the angle of acceptance is less than 20 full angle (Baumgardner et al 1985, Deering 1989, Milton 1987). For practical purposes, the FOV can be considered circular in shape. The FOV will be elliptical if the viewing angle is off nadir or the target is not a flat plane (eg the target is not flat and/or textured). Table 5 shows the difference in area for a circular and elliptical FOV using an 8° lense. The area of an ellipse is slightly greater than the area of a circle and because a target will not usually be planar, then it is best to exaggerate the required GFOV to ensure that it is only the homogenous target that is being measured in the FOV. Table 5 Calculations at 90°nadir of diameter for varying FOV lenses, and the difference between a circle and ellipse for an 8° FOV example Height (cm) d 1° (cm) d 8° (cm) d 25° (cm) A 8° of circle (cm)² ~ A 8° of ellipse (cm)² ~ difference b/n circle and ellipse of 8° (cm)² 5 0.1 0.7 2.3 0.4 0.4 0.0 10 0.2 1.4 4.7 1.6 1.7 0.1 15 0.3 2.1 7.0 3.5 3.7 0.2 20 0.4 2.8 9.3 6.2 6.6 0.4 25 0.4 3.5 11.7 9.7 10.3 0.6 30 0.5 4.2 14.0 14.0 14.9 0.9 35 0.6 4.9 16.3 19.0 20.3 1.3 40 0.7 5.6 18.6 24.8 26.4 1.6 50 0.9 7.0 23.3 38.8 41.3 2.5 75 1.31 10.5 34.9 87.2 93.0 5.8 100 1.8 14.1 46.6 155.0 165.3 10.3 110 1.9 15.5 51.3 188.6 201.1 12.5 150 2.6 21.1 70.0 349.0 372.0 23.0 200 3.5 28.1 96.3 620.6 661.6 41.0 250 4.4 35.1 116.5 969.8 1033.8 64.0 300 5.2 42.2 139.9 1396.0 1488.2 92.2 350 6.1 49.2 163.2 1900.3 2025.8 125.5 400 6.9 56.2 186.5 2482.4 2646.3 163.9 500 8.7 70.3 233.2 3878.2 4134.2 256.0 4.5 Spectral stability of the equipment Key sources of error are the standards to calibrate spectrometer devices as well as the laboratory equipment used for calibration (Schaepman 1998). Routine quality assurance tests can be performed to ensure that any change in the performance or accuracy of the spectrometer or standard panels can be identified quickly. Such changes may be a result of damage to the spectrometer or panels or as a result of long-term drift in the instrument or standard panel stability. Kindel et al (2001) found that the ASD-FR instrument shows excellent radiometric stability (over a nine month period of measurement), better than 1% for virtually the entire wavelength regions and better than 0.5% for wavelengths beyond 1000 nm. Schaepman (1998) provides 40 an extensive discussion on the calibration and characterisation of spectrometers and identifies all possible sources of uncertainty during characterisation and calibration of spectrometers. Even if all sources of errors are identified and an uncertainty associated with each, it is still doubtful how the absolute measurement represents the value of the quantity being measured, and uncertainty must be evaluated based on any valid statistical method for treating data and based on scientific judgement using all relevant data available, including previous measurement data, experience, general knowledge, specifications, data provided in calibration reports, and uncertainties assigned to reference data (Schaepman 1998). 4.5.1 Spectrometer warm up time The spectrometer must be given ample ‘warm up’ time prior to the collection of spectral data. This period is required so that the three spectrometer arrays reach an equivalent internal instruement temperature. A lack of appropriate warm up time will decrease the quality of spectral data and increase errors associated with detector overlap regions (ie 1000 and 1800 nm). ASD recommend a warm up period of 90 minutes (Beal 1999, Taylor 2004) and the NERC FSF© recommend a warm up time of 30 minutes (MacArthur 2007a, b & c, Phinn et al 2008). However, Phinn et al (2008) suggest after 10 minutes there is little fluctuation in measurements. SSD Approach The warm up time should not become a limiting factor in the time or power available for spectral measurements. For field sampling, the spectrometer warm up period can begin while the field equipment is being loaded into a vehicle (connected to the mains power). o During transport to the sampling site, the spectrometer is powered by a battery, allowing spectral sampling to begin on arrival at the field destination. o Battery power is not an operational limitation at SSD as three NiMH spectrometer batteries (and chargers) are available. For laboratory measurements, where there are no operational considerations preventing warm up time, the spectrometer should be allowed to warm up for 90 minutes (connected to mains power) to ensure thermal equilibrium. The warm up period should also be documented in the spectral metadata so that if spectral degradation is identified, a lack of warm-up time can be excluded as a contributing factor. 4.5.2 Standard laboratory set up at SSD There are a number of reasons why measurements are made in the laboratory and these include: Measurements to indicate the spectral stability of the spectrometer in the VNIR and SWIR, such as irradiance measurements using a Hg/Ar lamp or transmission measurements of a Mylar panel; Standard panel measurements; and, Measurements of target spectra themselves (such as soils). SSD undertake measurements in the laboratory for these reasons and therefore require a standard laboratory setup to ensure consistency when measuring and recording spectral data. 41 The spectral laboratory is a dark room to eliminate unwanted light sources from the laboratory environment. Fluorescent lights are not used as these have their own spectral response from 350–800 nm (ASD 1999). The positions of equipment for the standard setup is marked permanently on the laboratory bench. The laboratory set up is similar to that recommended by ASD (2002). The laboratory is fitted with two 200–500 Watt quartz-halogen cycle tungsten filament lamps in housings with aluminium reflectors. The illumination lamps are warmed up for 30 minutes prior to any spectral measurements to ensure they are stabilised both in current and thermally (G Fager 2006 pers comm). The two standard lamps are each positioned on a tripod. The lamps on the tripods are fixed 1 m from the surface to minimise interference fringes at an angle of 30 degrees from the surface and at a horizontal distance of 50 cm (ASD 2001). The tripod positions are marked in place on the laboratory bench, defining a constant illumination distance and angle orientation so that the flux density remains the same. The steady electrical power supply is used and whenever a lamp bulb needs to be changed, both bulbs are replaced at the same time to ensure a similar output. The spectrometer fore optics are mounted on a tripod at a height of 51 cm with the collecting optics of the spectrometer nadir to the sample. This provides an instantaneous-field-of-view (IFOV) of approximately 0.9 cm, 7.0 cm and 22.2 cm for 1, 8 and 25 degree FOV lenses, respectively (see Table 5). The 8 degree FOV lens is used unless otherwise stated. The location of the fibre optic focus is marked on the bench. The standard panel dimensions are also marked on the bench so that the standard panel measurements are consistent. The pistol grip, mounted to the tripod, is fitted with a laser pointer to ensure the focus point is centred. Samples, including the standard panels are positioned with the focus point centred in the middle of the sample and this position is checked before each measurement. Figure 15 illustrates the laboratory set up. Note that the white surroundings of the laboratory would have adjacency effects. The laboratory walls and bench appear bright as the photograph has been taken with the fluorescent lights switched on. Black matt walls would be ideal and we are in the process of updating all laboratory surfaces to matt black. Figure 15 Spectrometer and laboratory white panel setup. Note that the laboratory is a dark room rather than the white walls illustrated for this setup photograph. 42 4.5.3 VNIR and SWIR spectrometer detector condition monitoring in the laboratory It is recommended to use a known discrete emission light source for verifying calibration in the VNIR and periodic examination of the absorption features in the spectra of materials with known characteristics for the SWIR detectors (Beal 1999). Prior to an ASD spectrometer being dispatched, or after the return of a spectrometer to ASD Inc, wavelength calibrations on the spectrometer instrument are undertaken and the calibration relationship between wavelength and channel number in the controlling computer’s asd.ini file is installed (Beal 1999). ASD Inc uses Mercury Argon (HgAr) source lamps to measure and cross-calibrate the monochromator emission values in the VNIR region (Figure 16) and well-defined absorption features of a material such as Mylar panels for the SWIR region (Figure 17). Wavelength calibrations are checked using a ±1 nm range when compared with published NIST wavelength values (G Fager 2006 pers comm, Beal 1999). The NIST values need to be adjusted based on the spectral resolution of the instrument, and ASD Inc supply a spreadsheet so that calculations of the wavelengths using an HgAr lamp and Mylar panel can be made and monitored (G Fager 2006 pers comm). Note that SSD returns the spectrometer and fore optics for calibration yearly. Figure 16 Mercury-Argon Emission Spectrum Source: ASD (2000):71 Figure 17 Mylar transmission Spectrum Source: ASD (2000):72 SSD also monitors the calibration performance of the spectrometer regularly under the standard laboratory setup. Ideally measurements are made at fortnightly intervals. Suggested instructions on collecting HgAr and Mylar spectra were provided by J Brady (pers comm ASD Inc 2005) and these have been adopted. The HgAr lamp is warmed up for 10 minutes (after the standard 90 minute spectrometer warm up time is reached). No fore optic is used and the spectra are saved as raw DN files. To collect a HgAr spectrum, the fibre optic tip is inserted into the lamp and optimised using a spectrum average of 30, dark current of 25 and white reference (WR) of 10. Refer to dark current measurements in Section 4.4.5. When collecting a Mylar spectrum, the illumination lamps are allowed to warm up for 30 minutes prior to spectral sampling, using the viewing and illumination geometries of the standard laboratory setup. The laboratory standard panel is positioned with the focus point on the centre of the panel. An 8 fore optic is used. A WR spectrum is taken and saved. The Mylar card is placed directly on the Spectralon® panel, which provides near perfect two-way transmittance (G Fager, pers comm ASD Inc 2006). The transmission spectrum is measured and saved. A spectrum average of 60, dark current of 25 and WR of 10 are used. To confirm that each spectrograph registers specific wavelengths accurately, the HgAr and Mylar spectra can be compared to the the Noise Equivalent Radiance (NEdL) values supplied by ASD using the bse.ref and lmp.ill radiance measurements. 43 On request, ASD supplies a calibration spreadsheet where the emission and transmission spectral values from the HgAr lamp and Mylar panel can be pasted against the responding wavelength. A linear regression fit of the data is used to compare and document the response of the VNIR and SWIR regions over time. The spreadsheet can then be updated and saved as a new sheet by date of measurement. These reference spectra, stored by date, can be queried and correlated with reflectance measurements, and used to compare and document the response over time. Should degradation in spectral performance be identified from the laboratory measurements, all subsequent field spectra can be flagged until such a time that the spectrometer is recalibrated through ASD. 4.5.4 Standard panel measurements in the laboratory The major uncertainty with secondary standards such as a Spectralon® reflectance standard is instability over time. For this reason, the reflectance of the standard panels are regularly measured in the laboratory and their reflectance compared over time. This method is used as a warning system to determine if there is degradation in the RF. The standard panels are returned yearly to ASD for remeasurement (along with the spectrometer and fore optics) and the panels replaced if degradation is realised that cannot be rectified by the panel cleaning process. SSD has three Spectralon® panels. Two panels are 25.4 x 25.4 cm (10 x 10’) in size and housed in wooden boxes when not in use. One panel is clearly marked ‘laboratory panel’ and this panel must remain in the laboratory. The other is for use in the field environment. A third smaller Spectralon® panel (5 x 5 cm) is for use under non-standard conditions such as data collection from a helicopter. The assumption that a calibrated panel (near Lambertian) provides a good approximation to the true bi-directional reflectance factor of the subject needs to be assured by defining that the near Lambertian properties of the panels are maintained. To do this, we measure the spectral response of the Spectralon® panels in the laboratory under the standard laboratory setup. During intensive fortnightly vegetation surveys, prior to each field campaign, the panels are also assessed fortnightly. Spectra from the two 25.4 x 25.4 cm (10 x 10’) Spectralon® panels and a smaller 5 x 5 cm Spectralon® panel are measured. One of the large panels remains in the controlled laboratory environment. Like the measurements for the Mylar panel, the laboratory standard panel is positioned with the focus point centred. Standardised averages are a spectrum average of 25, dark current of 25 and WR of 10. The laboratory measurements are used to indicate the stability of the panels, whereby a relatively flat, nearly perfect reflectance should be shown. Any deviation from previous measurements may indicate deterioration in the condition of the standard panel that may not yet be apparent by visual inspection. These reference spectra, stored by date, can be queried and correlated with reflectance measurements. The spectral response of the laboratory panel should not change over time and any change identified may indicate an issue with the measuring instrument that needs investigation. Any variation in spectral response of the field panel relative to the lab reference panel indicates that contamination has occurred. Note we cannot assume that a change in the field panel only is an indication of contamination as a change in reflectance could be a result of a change in illumination by the lamps. The panel is cleaned if contamination is realised following recommendations by Labsphere (undated): if the material is lightly soiled, it may be air brushed with a jet of clean dry air or nitrogen. For heavier contamination, the material is cleaned by sanding under deionised running water with a 220–240 grit waterproof emery cloth until the surface is totally hydrophobic (water beads and runs off immediately). The panel is then blow dried with clean air or nitrogen or the material is allowed to air dry. The standard panel measurements in the laboratory are repeated if the field panel has been cleaned, and the reference spectra stored with metadata documenting the date and method of panel cleaning. 44 4.5.5 Accounting for dark current and noise (random noise and stray light) The measured signal and computed reflectance are defined as: Measured signal = true signal + dark current + random noise + stray light (ASD 1999). A certain amount of electrical current generated by thermal electrons as a result of the spectrometer electronics (false data) is always added to that generated by incoming photons called ‘dark current’ (DC), a property that varies with temperature and, in the VNIR region, integration time (ASD 2000). DC measurements are made by clicking on the DC pull down menu button. This operation closes a shutter on the spectrometer entrance aperture and measures the response of the system to no external input, ie due to internal electrical current. This reading is then subtracted from all subsequent readings until another dark current measurement is made. The DC measurement is taken whenever the user instructs the software to do so, by either: pressing the DC button on the toolbar, when taking a WR measurement or during optimisation. Not accounting for integration time, whenever these measurements are made, the DC is subtracted so that it is a negligible contributor, assuming DC calibrations are performed on a fully warmed instrument (ASD 1999). Although dark current systematic noise is sensitive to temperature, SSD’s minimum standard warm up time of 30 minutes accounts for internal thermal equilibrium. The operator should be aware that the external ambient temperature fluctuations may also cause dark-drift although it is less significant than during the start up period (ASD 1999). External ambient temperature is recorded as metadata for each target reading (see Section 4.7.5.4). Note that the ASD.INI file should never be altered by the user, as this is where Dark Current Correction measurement is stored. Optimisation results in automatic settings of gains and offsets for the SWIR detectors, an integration time value for the VNIR detector and the dark current measurement. Optimisation values depend on the response to light in a particular spectral region and a well-optimised instrument will display between 20 and 35 thousand digital numbers (ASD 1999). A Spectralon® panel is used when optimising and when taking a white reference (WR) measurement. Optimisation is required before any data is collected and the instrument must be re-optimised after any change in temperature or lighting conditions. SSD approach SSD’s standards when collecting spectra in the field are to optimise the spectrometer (and therefore obtain a DC) prior to the WR measurement for every new target measurement in order to adjust the sensitivity of the instrument’s detectors according to the specific illumination conditions at the time of measurement. In the laboratory and in the field, a WR spectrum is taken for every new sample. In the field, a WR spectrum is also taken and saved whenever irradiance conditions change to ensure that changing levels of down welling irradiance do not cause the detectors to saturate. If there is a change in atmospheric conditions (such as cloud movement) between optimisation and spectral measurement, optimisation, WR and spectral readings are redone. The optimisation and WR function in the ASD software gets new reflectance values for the white reference panel and saving these spectra allows any change in irradiance to be identified. 45 Noise can be reduced in the spectral signature by spectral averaging, as truly random noise will be reduced by an amount proportional to the square root of the number of spectra averaged together (ASD 2000). SSD’s sample average of 25 is adopted and three sets of 25 spectra for each target are measured which can be averaged during post-processing. Integration timing and sequential measurements are discussed in Section 4.7.3. Stray light is significantly greater than the lowest level random noise, and is indicated by the appearance of a spectral reflectance signal in spectral regions of zero illumination energy (eg the atmospheric water absorption bands around 1400 nm and 1900 nm). The ultraviolet and blue wavelengths, where illumination energy is extremely low, are also susceptible to stray lightt.. Stray light may affect the accurate detection of features including chlorophyll a and b (electron transitions at 430 nm and 460 nm, respectively), water (O-H bend at 1400 nm), lignin (C-H stretch at 1420 nm), starch (O-H stretch, C-O stretch at 1900) and water, lignin, protein, nitrogen, starch and cellulose (O-H stretch and O-H deformation at 1940 nm) (Curran 1989). If these effects are noted, these measurements and deviated products should be regarded with care. In the field environment, a solar radiance (W/m2/steridan/nm) measurement (made over the WR) is recorded prior to collecting each averaged reference spectra to provide an estimate of irradiance. This spectrum is viewed and saved to document stray light interferences, and checked to show zero reflectance at 1400 and 1900 nm (atmospheric water bands) (Figure 18). Even though random noise signals are extremely small, they graphically show vertical lines that shoot upward from the last wavelength channel with a non-zero measured signal (eg a random noise signal at 1900 nm of 3 and 6 radiance values for the reference and target respectively, would equal 200% reflectance at 1900 nm). Entire spectra of noise values may be calculated with the standard deviation from the mean of 25 or more spectra collected of a known source. In the field environment, solar radiance and WR standard spectra are recorded for each sample to indicate instrument and atmospheric stability, systematic and random noise. Figures 18 & 19). Figure 19a shows a WR spectrum collected under near perfect sampling conditions, with 0% cloud cover, low humidity, still wind and stable ambient temperature. Compared with 19a, Figure 19b illustrates systematic noise (as a result of inadequate spectrometer warm-up time) and steps between the VNIR and SWIR-1 detectors. This step is also a function of input radiance (Hueni 2009 pers comm, Maier 2009 pers comm). Figure 19c shows an unstable atmosphere in the water absorption bands (1400 & 1900 nm) as well as significant random noise in the SWIR-1-SWIR-2 arrays. Computed reflectance stability is assessed in situ on screen, where an unstable atmosphere is indicated by variability. In addition to the solar irradiance and WR spectra, data on the environmental conditions are recorded and these are discussed further. Note that the operator must wait for two screen refreshes as the internal averaging cycles are completed before saving any information so that the electronics are allowed to adjust to the measurement surface. Also note that the spectrometer archives the next spectrum measurement, not the one on the screen (Salisbury 1998). Measurement of the System Noise and Detector Dark Current at the beginning of a spectral campaign can be measured and saved and the peak and standard deviation of the spectral noise used to indicate current performance to historical performance. 46 Figure 18 Solar radiance spectrum measured in the field. Stray light (zero reflectance at atmospheric water bands) illustrated (Source: ASD Inc 2001). a. WR spectrum under optimal sampling and appropriate standards b. Detector array step in the VNIR-SWIR1. Stray light ‘smile effect’ in the UV-delete this sentence. Strong water absorption bands are evident at 1400 and 1900 nm. c. Detector array overlap and significant noise in SWIR1-SWIR2 Figure 19 Standard Spectralon® panel measurements are essential metadata for reflectance spectra. Note that SSD’s spectrometer has a 6 m fibre optic cable which results in signal loss at wavelengths greater than 2400 nm 4.6 Viewing and illumination geometry in the field The ideal procedure for spectral sampling with single FOV instruments is the acquisition of near simultaneous measurements of the WR and target spectra under exactly the same viewing geometries and under perfect illumination conditions. In practice, this theoretical procedure for spectral sampling is impossible. Our method for temporal spectral sampling of vegetation plots necessitates the violation of the ideal spectral measurement method. The factors that affect spectral signatures are considered and the method of accounting for and documenting these factors are described. Recommendations for both the field design and accompanying metadata are made so that the accuracy of spectral measurements are maximised and any environmental variation can be accounted for. 47 4.6.1 The FOV and Instantaneous Field of View (IFOV) The FOV must be appropriate to integrate and represent the geometric features of the target. The measurement diameter (at the surface) is equal to the height of the spectrometer above the surface multiplied by the FOV of the solid angle that admits light (see Section 4.3). Tan (0.5 FOV) x height (m) x 2 x 100 = GFOV (cm) SSD acquires in situ target measurements positioned on the side of the target point opposite the sun, as suggested by Deering (1989) ie measuring setup in the solar principal plane. A bubble leveller, attached to a stabilising pole at a horizontal distance of 1m is utilised (Figure 21) to ensure nadir viewing. Two remote controlled laser pointers are attached to either side of the bubble leveller to provide the centre point. Mounting the pistol grip on a tripod and immobilising both optical cable and FOV is recommended for reflectance measurements requiring high repeatability and accuracy (Salisbury 1998) and our experience has shown the stabilising pole is required to reduce the variations in spectral measurements seen whenever wind is a limiting factor (see Section 4.7.5). Measurements are made at a sensor zenith angle of 0 (nadir) with an 8 FOV, so that the angle of acceptance is less than 20 full angle (Baumgardner et al 1985, Deering 1989, Milton 1987). According to ASD (pers comm), it is better to move the sensor during data takes to minimise FOV problems. It is a trade-off as moving the instrument might give a better representation of the target, but the pointing direction will be harder to maintain. At nadir, the only significant geometric concerns are the IFOV or GFOV and its relationship to the size and distribution of the target element and the orientation of the sun azimuth relative to any preferred orientations of the target (Deering 1989). For in situ ground cover measurements, a consistent 2 metre height above the ground, providing an approximate 28 cm diameter GFOV (Figure 22) is used. Note that the IFOV is actually slightly larger than the 28 cm due to the point spread function of the optics, however, this is not a limiting factor given all plots are typically greater than 2 m2 and represent a dense and homogenous plot of the target of interest. Vegetation height obviously needs to be taken into account. Figure 22 Direction, position and FOV 48 4.6.2 WR (standard) panel and target measurements in the field 4.6.2.1 WR panel measurements The WR panel is housed in a wooden case on the shelf of the buggy, 1 m from ground level (shown in Figures 22 and 23). In situ WR measurements are made positioned on the side of the target point opposite the sun from a height of 2 m above ground level providing an approximate 14 cm diameter IFOV (given the 1 m difference between FOV and panel). The bubble leveller pistol grip, attached to a stabilising pole, and the laser pointers are attached to the pistol grip are utilised to locate the centre point on the WR panel. Prior to the acquisition of the laser pointer, a weight was strung from the pistol grip which was used to cast a shadow at nadir and highlight the focus point. The fore optic would then be adjusted until it was positioned in the centre of the case (Figure 23a & b). The weight was drawn back so that it did not influence the spectral response and the lid of the case was opened for immediate WR sampling. Figure 23a & b Weighted plumb line ensures sampling is obtained from central position of white panel The operator waits for two screen refreshes before recording any data to allow the electronics of the spectrometer to adjust to the WR surface. With the FOV centrally positioned over the WR panel, the spectrometer is optimised (including DC). A solar radiance spectrum is measured and saved. The WR is measured and saved immediately afterwards. For all measurements, the data is only saved once a stable signal is realised. If errors such as a non-stable signal or spectral steps are observed, the data is eliminated and new data saved only when a stable signal is achieved. The solar radiance spectrum is characterised by most points greater than 1 with the maximum radiance value reaching around 40 000 digital numbers. An accurate WR spectrum is characterised by most points close to a value of 1. 4.6.2.2 Target measurements Averaging multiple measurements of a target is good practice to compensate for heterogeneity which may be too subtle for the eye to note and also so that scans with spectral artefacts can be discarded (Salisbury 1998, Milton et al 1995). 49 Immediately after the WR reading, the stabilising pole is rotated 90 degrees to sample the target from a height of 2 metres. Two additional sets of spectra are obtained by rotating the stabilising pole 60° and 30° degrees sequentially at a horizontal distance of 1 metre from the stabilising pole. These three sets of target spectra are saved to measure the presence of inter-target spectral differences and to compare these data for similarity. A decision on the sampling height of target spectra was made during the design phase of the project. One option was to sample the target from varying heights at a fixed distance dependant on the maximum height of the vegetative sample. This option would have required a height adjustable stabilising pole and accurate measurements of the vegetation height, defined by some criteria to account for height variation, such as mean height. This method would have given a consistent GFOV but would have required a change in setup for each target measurement. The second option, and that which was adopted, was to maintain a consistent measurement height of 2 metres. This method allows for efficient deployment of the stabilising pole and quicker sampling of sequential sites compared with the first option. This method does mean that the GFOV of the target will vary as the plant grows. Typically heights of vegetation covers sampled range from ground habits to that of Andropogon gayanus (Gamba grass) which can reach a growth height of 4 m (Smith 1995 & 2000). A literature review of the growth form and height of species was undertaken and it was found that most targeted species do not reach a maximum growth height of 2 metres and this was considered an operationally feasible measurement height. It was decided that should a species encroach the 2 metre height of the stabilising pole, then the height of measurement would be altered for that reading and that this change would be noted in the spectral metadata. Vegetation height as well as senescence/maturation are variables measured and listed in the metadata. The target sampling height of 2 metres means that the height difference between the WR and GFOV of the target spectra vary as the growth form varies. It is therefore essential that the height of the target be accurately measured (discussed further in Section 4.7.8). 4.6.2.3 Repeat WR panel measurements After the three target spectral samples have been measured, the stabilising pole is swung back over the WR panel and another WR reflectance measurement is saved. These last WR data can be assessed against the WR measurements taken prior to the target spectra to monitor unrealised solar changes during target sampling. The resulting target spectra would be flagged of this solar change occurrence. 4.6.2.4 Violation of the BRF assumption The viewing angle and height of measurement for the target and WR are not the same but any differences are minimised while maintaining an operationally feasible field campaign. Despite the change in viewing geometry, this set-up allows almost simultaneous sampling of the WR panel and the target because the stabilising pole can be repositioned in a matter of seconds. Importantly for temporal measurements, the measurement method is consistent. While operating in WR mode the variability in sky conditions can be checked by measuring a spectrum from the reflectance panel, with any variation from a spectral reflectance of 1.0 indicating a change in the spectral irradiance since the panel was first measured (Milton & Goetz 1997). The spectral solar radiance result and surrogate global irradiance measurements are not usually reported. This is surprising given these measurements may be used to ensure 50 that an appropriate RF is achieved and that the spectral readings are not influenced by stray light or random noise. We consider the standard panel spectral sequence necessary to determine whether sufficient accuracy has been acquired and to assess that environmental factors are not limiting. Simply, a flat spectrum with near 100% reflectance indicates stable conditions, whereas an unstable atmosphere is indicated by a computed reflectance that varies over time, showing absorption minima or maxima. If illumination conditions change within the sets of target spectral measurements, the optimisation and WR readings are repeated before spectral averaging of the target are repeated. For heterogeneous covers, soil and/or litter inter-space are systematically sampled and recorded with a repeat of the above procedure. Standardised averages are a spectrum average of 25, dark current of 25 and WR of 10. 4.6.2.5 Other viewing geometries Phinn et al (2008) suggest a spectral data collection approach that varies with solar azimuth and zenith angle to minimise BRDF effects and maximise measurement of colour properties of vegetation cover. They use an elevation angle of fore optics at 57.5° from the horizontal plane and at an azimuth angle of 90° to the plane of the sun. ‘The magic elevation angle is optimised for plant canopy observation and is derived from relationships between measurements of leaf area index (LAI) of foliage and observation angle. The 58 degree angle is where the variability of LAI estimation to leaf-angle distribution is minimised (Wilson 1963) or put another way, the solid angle of foliage viewed from this angle (ie ratio of foliage to background for plants with a low LAI) is more consistent between plants with variation in canopy structure. Apparently, this angle does not take into account any illumination effects; it merely provides a more consistent solid angle of leaf area when observing different plant canopies, particularly if sparse foliage’ (P Daniel, CSIRO pers comm. 28-04-08 in Phinn et al 2008). SSD considered this method and decided that maintaining a 58° angle for vegetation habits up to 2 m high would be too difficult to accurately maintain and that any change in measurement would more likely introduce errors for the current application. 4.6.3 Integration timing and sequential measurements The user can modify the number of optimisations, WR and spectrum averages and averaging measurements will increase precision and reduce random error (Milton et al 1995, Rollin et al 1995). However, errors can arise from ‘sequential’ measurements (Deering 1989, Duggin & Phillipson 1982, Milton & Goetz 1997, Rollin et al 1995) so replication of measurements must be weighed up against the time taken and accuracy implications. Statistical representative numbers of sample sizes are between 30–40 measurements (Schaepman 1998) with 10 the minimum (ASD 2002). The FieldSpec-FR has a scan time of 0.1 seconds, so the time difference to measure the reference compared to the target of interest is more a limiting factor than the number of integrations of reflectance measurement under a stabilised atmosphere. Milton (1987) suggests that replication of each measurement and careful data screenings are safeguards against short-term irradiance fluctuations between the target and reference. The sequential method follows that described in Section 4.7.2 for optimisation, WR readings and target readings. 51 In summary, the electronics are allowed to adjust to the panel surface by waiting for two screen refreshes. Once a stable signal is realised, optimisation is made and the solar radiance curve (25 averages) is saved. A WR average of 10 is then saved. The stabilisation pole is then swung to 90° from the panel and the electronics are allowed to adjust to the target surface by waiting for two screen refreshes. Target spectra of 25 averages are then saved. This step is then repeated at 60° from the panel and at 30° from the panel. Finally, the stabilising pole is swung back to the WR panel, the electronics are allowed to adjust to the WR surface by waiting for two screen refreshes and another average of 10 readings are saved. Spectral measurements begin with the DC/optimisation average for each new plot site or whenever illumination conditions change. The standard panel spectra are not only saved for post-processing but also used as visual in situ checks. If errors such as a non-stable signal or spectral steps are observed, the data is eliminated and saved once a stable signal is observed. If any deviation from the near-100% line occurs (steps or slopes) another WR is collected. Note that the spectrometer archives the next spectrum measurement, not the one on the screen. Salisbury (1998) found that the largest deviation from the averages of individual spectra was the first spectrum and that this is so common that researchers should be prepared to discard the first spectral average. The reason for this is probably that users are not waiting for the spectrometer electronics to adjust to the new measurement surface or in that the operator is not realising that it is the next spectrum measurement that is saved. 4.6.4 Direct solar illumination – sun angle and position Direct solar illumination is assumed to be the dominant illumination component when sampling is undertaken at high solar angles under ideal atmospheric conditions (low cloud cover, humidity, smoke and haze). Atmospheric conditions for spectral sampling are quite predictable in the tropics, but rarely are optimal conditions realised. Table 6 shows the solar azimuth and altitude for a 12 month period, calculated for Darwin city, and shows that the highest solar angle occurs during the ‘wet season’ (between October and April) when cloud cover and humidity are typically at their peak. In the ‘dry season’ (May to September), combined with a lower solar angle, smoke and haze from bushfires are common. Table 6 Example sun azimuth and altitude measurements for Darwin (Lat=-12°27’00’ st Long=+130°50’00’) for the 1 of the month over a one year period Month Dd/mm/yyyy:hour:min:sec Azimuth Altitude January 01/01/2007: 12:00:00 133°27’43’ 74°05’56’ February 01/02/2007: 12:00:00 110°03’39’ 74°42’02’ March 01/03/2007: 12:00:00 73°35’49’ 74°42’45’ April 01/04/2007: 12:00:00 37°40’24’ 68°59’34’ May 01/05/2007: 12:00:00 21°57’07’ 60°33’11’ June 01/06/2007: 12:00:00 17°37’38’ 53°53’31’ July 01/07/2007: 12:00:00 19°09’48’ 52°20’38’ August 01/08/2007: 12:00:00 23°25’18’ 56°44’20’ September 01/09/2007: 12:00:00 29°42’46’ 66°04’12’ October 01/10/2007: 12:00:00 44°30’32’ 76°54’50’ November 01/11/2007: 12:00:00 104°43’54’ 82°24’37’ December 01/12/2007: 12:00:00 138°48’49’ 77°27’05’ 52 Milton and Goetz (1997) performed field experiments to determine the spectral significance of short-term changes in irradiance under clear blue skies and found little variation on first glance, but significant difference with the coefficient of variation (s.d/mean*100) calculation. Anderson et al (2003) undertook a field experiment to investigate the hypothesis that the nadir reflectance of calibration surfaces (asphalt and concrete) remain stable over a range of timescales and found measurable differences in spectral reflectance factors over periods as short as 30 minutes, despite clear atmospheric conditions. Between the highest position of the Sun and that of the Sun lying low in the horizon, irradiance varies, but the reflectance of a Lambertian surface is independent of the position of the Sun for the same viewing angle. Solar zenith angle can become a critical measurement parameter because the column density of water vapour in a given atmosphere increases rapidly as zenith angle increases from its minimum at vertical, either with time of day or season because as water vapour absorption increases, solar irradiance decreases, and this results in lower signal-to-noise for the same integration time, and greater difficulty in detecting spectral features throughout the SWIR, but especially near water band locations (Salisbury 1998). Field measurements are therefore commonly restricted to a period around solar noon when the solar geometry is changing least and when the errors due to the angular response of the reflectance panel are at a minimum (Gu et al 1992 in Milton et al 1995, Salisbury 1998, Rollin et al 2000). At SSD, in situ measurements are made positioned on the side of the target point opposite the sun around the wings of solar noon. When measuring spectra in even slightly varying or limiting conditions, optimisation is performed frequently, radiance mode is viewed occasionally to verify that signal saturation is not occurring (ASD 2002) and a new solar irradiance and repeat WR sequence for every target sequence is recorded. An accurate record of geographic location, time, sun azimuth and altitude and localised environmental conditions accompany spectral data. The centre point of each sampling plot site is measured and documented with a dGPS. The exact sampling position relative to the target can change over the fortnightly temporal scales as measurements are made positioned on the side of the target point opposite the sun. The location is measured with each spectral reading using a USB GPS, and recorded in the spectral header file, although there is a generalised offset of 1 metre between the buggy position and the target sample site (Section 4.7.2). In addition, a written record of the location with respect to the quadrant is given. The laptop and weather station (see Section 4.7.5) are synchronised to the Australian Central Standard Time. Azimuth and altitude are calculated post-field at the Geoscience Australia ‘Compute Sun and Moon elevation’ site (http://www.ga.gov.au/geodesy/astro/smpos.jsp). The latitude and longitude coordinates (degrees and minutes), combined with the time zone recorded in the spectral header are entered to obtain the Sun’s position and also the solar azimuth and altitude. WR and solar radiance spectra are used to assess these factors both by visual in situ assessments and during post-processing of spectra. Although non-Lambertian reflectance with respect to global radiation of Spectralon® panels may occur at very large solar zenith angles (above 60° zenith angle or equivalent to 30° solar elevation angle) (Rollin 1999), this is not an issue for spectral sampling around the wings of solar noon in the tropics from April through October (see Table 6). 53 4.6.5 Atmospheric conditions (clouds, smoke, haze, humidity, wind and temperature) Illumination contributions from diffuse and hemispherical sources are another potential variable in obtaining reference spectra because reflectance spectra measured under solar illumination are strongly modified by the absorbing molecules in the atmosphere (Goetz 1992 in Schaepman 1998), and accounting for solar geometry and atmospheric fluctuation can increase accuracy (Milton et al 1995). Radiance reflected back to the spectrometer is defined directionally, whereas irradiance received by the surface is hemispheric. The incident diffuse irradiance depends on the height of the Sun and relative direct and scattered irradiance proportions that typically vary throughout the day and with conditions. By dividing the target signal by the reference, all multiplicative parameters are ratioed out, however, diffuse illumination and scattered light may significantly influence the total measured signal (Curtiss & Goetz 1995, Pinter et al 1990, Rollin et al 2000, Anderson et al 2003). As a result, spectral campaigns are advised to be undertaken only when the weather is fine and stable (Taylor 2004), although consistency is impossible with fortnightly temporal measurements. The environmental factors affecting reflectance measurements include: atmospheric attenuation and scattering from gases (water vapour, ozone, carbon monoxide, carbon dioxide, methane, nitrous oxide and oxygen) (Salisbury 1998) atmospheric particles, wind and temperature. Suggested approaches to reduce these effects on spectral measurements have been documented (Salisbury 1998, Curtiss & Goetz 2001). Where these factors are present during spectral measurement, the condition must be documented in the spectral metadata so that any loss in signal identified in the post-processing can be attributed to relevant factor, and if appropriate, the measurement discarded. Without spectral metadata, it is possible that the measurement is considered a true representation of the target despite a contribution from external sources. Absorption features from atmospheric gases increase in intensity as the atmospheric path length of the incoming solar radiation increases. Clouds, smoke and haze also attenuate solar irradiance by absorption which results in scattering that contributes to the secondary source of illumination and variable irradiance as a result of changing conditions between target and standard measurements (Chang et al 2005). High-level cloud may be invisible to the naked eye (Milton & Goetz 1997), but short-term changes in irradiance caused by invisible patches of water vapour can be identified by ratioing a reflectance panel spectrum of a clear atmosphere to others in the series (Milton & Goetz 1997). The attenuation of solar irradiance degrades the signal-to-noise especially in the SWIR region (Salisbury 1998). Fortnightly temporal measurements necessitate sampling in sub-optimal environmental conditions. When conditions are limiting, optimisation and WR readings are saved before each measurement. Metadata recording is essential to correlate the atmospheric conditions with the spectral response. SSD account for environmental conditions during spectral measurement by acquiring quantitative measurements of temperature, relative humidity, wind speed and direction, documented with a portable weather station (Kestral 4000 Pocket weather station). Clouds, smoke and haze are given a semi-qualitative description and further documented by digital photographs. Along with the quantitative and semi qualitative environmental metadata and photographic recordings, the WR readings are useful in combination as sources of information to check the quality of data measured. Figure 24 shows two different in situ WR readings. Figure 24a shows significant water absorption affecting the 1400 and 1900 nm regions as well as a low S:N ratio in the SWIR, compared to Figure 24b that shows much less atmospheric water absorption. 54 a. Significant atmospheric water absorption (1400 and 1900 nm) and effects in the SWIR b. Atmospheric water absorption (1400 and 1900 nm) Figure 24 Absorption minima and maxima at the atmospheric water absorption regions, combined with metadata on meteorological conditions are useful documentation on illumination conditions at the time of sample measurement 4.6.5.1 Cloud descriptions Figure 25 shows the mean number of cloudy days for Darwin Airport, averaged over a 54 year period and shows there are fewer cloudy days in the sampling period of low solar azimuth angles (Table 6) between April and October. While sampling is not undertaken on a cloudy day, spectral sampling is undertaken on days when periods of cloud cover occur and the cloud type and cover need to be quantified. Details on how to describe clouds are provided in Appendix A.5. Statistics Mean number of cloudy days Jan Feb Mar Apr May Jun Jul Aug Sep Oct Nov Dec 24.0 21.6 19.7 11.3 6.3 3.7 3.4 2.6 3.2 5.6 11.5 20.1 Figure 25 Mean number of cloudy days – Darwin Airport. Source: BOM http://www.bom.gov.au/climate/averages/tables/cw_014015.shtml 4.6.5.2 Smoke and haze descriptions Smoke and haze are recorded as either present or not present, and if present, altitude descriptions are described (similar to cloud altitude levels of high/mid/low). BOM use two laser devices situated at Darwin Airport to record the level of atmospheric particulate matter. Smoke or haze is measured in units of distance visibility (km). Visibility of 30 km indicates very clear conditions while this reduces to 5 km in the presence of smoke or haze. Extremely smoky conditions may see visibility reduced to 200 m. 55 Since the sampling areas are relatively close to Darwin Airport, these readings can be used to characterise spectral sampling conditions. Archival figures are available on the Internet at (http://australianweathernews.com/archives/capcity). WR and solar radiance spectra are also used to indicate the effects of skylight as scattering by aerosols will increase skylight and the higher the concentration the greater the skylight intensity (Salisbury 1998). 4.6.5.3 Humidity and wind descriptions Humidity is measured using a Kestrel Pocket Weather Station. Humidity is measured to accuracy of 0.1%. Indirectly, humidity can be assessed with the water absorption features in the WR spectra (refer to Figure 24). Wind affects mobile targets (eg leaves) and can change target geometry. During even slight breezes, it can be difficult to maintain a steady fore optic, but the stabilising pole minimises the variation in spectral averages associated with wind (Figure 26). Wind speed and direction is measured using a Kestrel Pocket Weather Station. Wind is recorded in km/hr to an accuracy of 1 km/hr. 4.6.5.4 Temperature Because DC systematic noise is sensitive to temperature, ambient temperature is measured with a Kestrel Pocket Weather Station. After turning the instrument on, and waiting for the thermometer instrument to stabilise, (sometimes taking up to 2 minutes) a reading to an accuracy of 0.1 degrees Celsius is recorded. Figure 26 Effects of wind on mobile targets: (a) gentle breeze (b) no wind. All spectra are 5 replicates times 10 averages. 4.6.6 Hemispheric contribution and scattering (target texture, surrounds and operator) In addition to the viewing and illumination geometry and atmospheric conditions, the texture of the target (diffuse or specular), shadows, the surrounds and the operator of the instrument, may also contribute to the hemispherical component and it is therefore not surprising that the unique spectral identification of many materials has proven difficult due to numerous problems present in real-world measurements (Cochrane 2000). The surface texture of the material being measured affects the relative proportion of the various sources of illumination and background radiance is particularly important for vegetation applications. A surface with a rough texture will tend to have a higher proportion of illumination from the diffuse and scattered surrounding sources relative to the direct solar illumination, when compared with smooth surfaces. Light returned from plants is a complex mixture of multiple reflected and/or transmitted components (Curtiss & Ustin 1989 in ASD 1999) and the BRF of vegetation is generally assumed to be determined by the proportions of 56 different scene components (sunlit leaves, shaded leaves, sunlit background, and shaded background) presented to a sensor (Milton 2001). While dense and homogenous plots of vegetation cover were established, the texture of plants may still contribute to sources of hemispheric illumination by adjacency effects. Further, as the plants senesce over the growing season, plots may become heterogeneous. Descriptions of cover, combined with photographic recording therefore become essential metadata with vegetation applications. Further, averaged spectra are collected from a stationary position at three different locations within the plot to capture in site variability. Soil inter-space and leaf litter are also recorded if visualised during the growing season. Operators and assistants dress in low reflective dark coloured clothing (Deering 1989) and maintain a distance from the target with the stabilising pole to minimise any interference. As shade (eg under a tree) is illuminated principally by skylight and background radiance, some identified sites that are dense and homogenous have been found unsuitable for spectral sampling due to their proximity to other vegetation. 4.6.7 Standardised photographic recording Photographic recording of the sky conditions and the state of the ground target at the time of spectral measurements can be helpful in interpreting and determining the data quality (Deering 1989). In addition to scaled setup and nadir photographs, photos of the eastern and western sky (if these views are obscured, then north and south views to be obtained), as well as the hemisphere, are documented to support quantitative and qualitative measurements of the hemispheric component. Photos of sampling sites and sky conditions are best taken from the same location enabling the viewer to compare the target with similar backgrounds. Different backdrops can distract the viewer. Sky condition photos also contain pieces of familiar backgrounds (eg horizon features) to serve as reference points enabling the viewer to visualise the scale of clouds from one point in time compared with another. Instructions for standardised photographic recording are provided in Appendix A.6. 4.6.8 Information on the target The nature of the target in the localised environment must be documented with meaningful descriptions. The site code must be documented for the vegetation plots that are sampled temporally. CSIRO, Berrimah Farm and Crocodylus Park have been given abbreviations of CS, BF and CP, and the site is followed by a 2 digit number, eg CS02, referring to CSIRO, site 2. Refer to Pfitzner and Bollhöfer (2008) for a summary of the status of the vegetation plots including the site codes at CS, BF and CP. It is also important to describe the side of the plot that spectral measurements are made. This is because the measurement side will change with sampling occurring at different times of the day and year due to the sampling side being opposite the Sun. For any spectral vegetation sampling campaign, documentation for vegetation includes: species name if confirmed (or labelled sample for identification by the herbarium); homogeneity (monoculture or mixed community), described by percent cover of each component including a break down of any cover of leaf litter or soil interspace as well as differences in phenology of the target species. For example, a plot could contain 90% green cover of Hyptis, 5% drying cover of Hyptis, 3% dead leaves as leaf litter and 2% exposed lateritic gravel); 57 single layer or multiple layer; type and distribution of ground cover (even or clumped). The cover may be described as ‘even cover’ or uniformly covering the ground, or ‘clumped’ into distinct clumps across the plot); height of ground cover (including maximum height and mean height density, or the height of most biomass cover); apparent phenology (vegetation health and growth stage) using such terms as green flush, flowering, seeding, senescing, drying, dead; any disturbances visualised, such as the plot having been flattened by rain, trampled by animals, etc; pattern of distribution (between species or age classes). Where a correlation is being established other than the interaction of the target with EMR, other measurements will be required (leaf area index or cover, moisture, canopy height, chemical analysis of compounds, biomass, height, and leaf angle distribution). For soil characterisation specifically, colour, pH, moisture, sample and field description (roughness, texture, moisture) are required. For such variables, a description and photograph are the minimum requirement for metadata records. Where samples are taken for further analysis (eg x-ray diffraction, chlorophyll concentration), sample numbers should be associated with their reflectance and metadata records. A photograph, detailed description and sample(s) are referenced in the metadata record that is linked to the spectra. Tables 7 and 8 show example metadata recorded for one morning of sampling. Note that the times of measurements are recorded in the spectral header. Table 7 Cover metadata collected in the data sheet and linked to the spectra in SSD’s Spectral Database Ground cover 80% dead hyptis description leaves and stalks. (% cover) 20% bare earth 100% Calopo 95% para grass 5% water 80% dead SW leaves 10% mission grass seeds 10% Dead calopo Phenology Dead and dry Green and healthy Green and healthy Green and healthy. Growing vigorously, with small white flowers starting to emerge. Additional No change since last comments sampled. Plot will locked up and no need weeding soon. longer grazing on None Banteng cattle are para grass. Ludwigia plants starting to grow on banks. 58 None Table 8 Site metadata collected in the data sheet and linked to the spectra in SSD’s Spectral Database Site Code CP01 CP05 CP06 CP20 Species Hyptis Calopo Para Grass Snake Weed Date 30/11/06 30/11/06 30/11/06 30/11/06 Samples taken (set of 25 averages) 3 3 3 3 Spec turned on 8.30am 8.30am 8.30am 8.30am Solar spectrum WR (prior to target measurement) WR (end of target measurement) Temp 35.3 35.4 35.9 34.8 Humidity 49.6 49.4 49.2 50.4 Air pressure 1007.5 1007.4 1007.5 1007.2 Wind direction WNW WNW W W Wind min (km) 0 0 2 2 Wind max (km) 0 4 6 10 Wind description Still Very Gentle Gentle Gusty Cloud level None None Mid Mid-Thin High Cirrus Smoke Slight High Level Slight High Level Slight High Level Slight High Level Cloud cover (%) 0 0 15 (1-2 oktas) 40 (3 oktas) Haze None None None None Disturbances None None None None Pattern of distribution* Even Even Even Clumped Layering single/multiple M S M M Homogeneity (% cover of target vegetation) 100 100 100 100 Probe height (m) 2 2 2 2 Max plant height 1.8 0.1 0.4 0.7 Mean density (height of most biomass) 0.4 0.1 0.3 0.4 Nadir ruler height On ground On ground 0.4 0n ground Position of measurement (eg western side of plot) *(Even: uniformly covering ground. Clumped: distinct clumps across plot) 59 5 Reflectance spectra and metadata: A database approach Metadata are important for the interpretation of scientific data, quality assessment and long term usability of data (Hueni et al 2007). If detailed metadata describing the collection geometry do not accompany spectral data the comfort level of users of this data should decrease drastically (Salvaggio et al 2005). A number of reflectance spectra management issues have been outlined here to maximise the collection of representative samples of calibrated and validated field spectra. Issues include laboratory standard set up and measurements of the spectrometer and calibration panel performance, optical considerations, scale considerations, local environmental considerations, and physical considerations of the target itself. Common to these variables are the semi-controllable factors of viewing and illumination geometry. The factors that may influence a spectral response (and associated spectral metadata entries) are interrelated (refer back to Figure 11) and essential for accurate processing of spectral averages. Accounting for varying incident solar irradiance, atmospheric conditions, meteorological conditions, reflectance properties of the surface and sensor viewing conditions are fundamental in the experimental design and therefore require appropriate documentation. Metadata need to capture information for each spectral measurement that can aid in both determining data quality and interpreting data averages. Photographic recording of sky conditions and the state of the ground target at the time of the radiometric measurements can often be very helpful, particularly if an explanation is required on a change in reflectance factors if a biophysical variable measurement shows no change (Deering 1989, Milton et al 1995). Appropriate metadata enable outliers due to extraneous factors to be identified, attributed and then excluded when processing averages of spectra in order to maximise a true representative reflectance spectrum. Figure 27 illustrates a time series of ground cover reflectance spectra, accompanied by selected metadata, for Stylosanthes humilis. Figure 27 Fortnightly temporal ground cover spectra, accompanied by selected metadata, for Stylosanthes humilis over ~4 months 60 Soil inter-space was also measured. The standards described were implemented for each observation period. This example shows changes in: date, time, position, sun azimuth, sun altitude, temperature, humidity, cloud cover and type, homogeneity, cover, phenology and localised conditions. The standard and averaged spectra also change. The spectra show a similar overall shape and position of absorption features, the depth and width of absorption features and the magnitude of reflectance changes as the sample senesces over time. The depth of water absorption features also change over time. Whether or not these changes are a result of biophysical changes of the target or attributable to the illumination conditions can only be assessed by an increased length of sampling record. It is only with accurate spectral and metadata collection that both averaged ‘reference’ spectra and any significant temporal change in spectral response can be identified. 5.1 Data storage and processing Pfitzner et al (2008) describe the development of SSD’s Spectral Database that is used to reference, categorise and manage our spectral data and metadata so that suitable data can be queried and analysed. A conceptual user interface showing the metadata elements of the Spectral Library Database is presented in Figure 28. 5.1.1 SSD’s Spectral Database The database structure has been custom designed to maximise cross referencing between spectra, photos and metadata. SSD required a system to account for and link the spectral and metadata standards implemented. A SQL server is used as a data warehouse to store all information. The spectra and photos are stored as binary files within the database. The metadata table contains information about the conditions at the time spectra and photos were taken. Metadata include a unique code (site and date), date of spectral measurement, atmospheric conditions (smoke, haze, temperature, humidity, air pressure, wind direction, wind speed and description), cloud level and cover, probe height (from ground), plant height (from ground level) and ground description (by cover and phenology). Searches can be performed on the fields and individual records displayed. Figure 29 illustrates an example spectrum metadata page with associated photographs. Each photograph has a description of the photographer’s location and camera settings and has nomenclature in the database. For example, the first photograph in Figure 43 is named ‘BF04_2007_04_11_buggy1.jpg’ and describes the site, date and photo type and all photographs described as ‘Buggy 1’ are taken 5 paces from the plot and include the spectrometer buggy and fore optic setup. The photos can also be used as a quality control mechanism to confirm the correlation between documented and visual environmental conditions. All photos and spectra are linked to a metadata record so environmental conditions when the data were collected can easily be referenced. Figure 30 displays the spectrum list for the same metadata and photo page illustrated in Figure 29. The structure allows the user to easily query information. Selected spectra can be viewed and overlaid to give a visual comparison. Figure 30 provides an example of a solar radiance, target and white reference spectra. Each spectrum has certain characteristics that can be used to categorise them through an iterative process. As part of the quality control procedure all spectra are processed through an algorithm that categorises the spectrum into a specified group depending on the defined boundary conditions. Spectra that are not found to fit into a known category are marked as undefined (‘not defined’) by the ‘Classify’ algorithm. These 61 spectra require further examination and may indicate problematic conditions. For example, the ‘Not Defined’ entry circled in Figure 30 shows a stepped appearance with values between 0.8-0.9 in the VNIR and around 0.9 in the SWIR as well as a drop off in reflectance beyond 2200 nm. The spectrum represents an invalid white reference measurement and any target measurements made in association with this spectrum are flagged. Highlighting a detector array issue or atmospheric influence in a white reference spectrum is crucial for data analysis and these anomalies would be very difficult to detect visually with data volumes described here. Accurate metadata is required during the data analysis stage to ensure that environmental conditions (such as solar azimuth) are not influencing the spectral response, particularly for temporal spectral measurements. Photographic records help to interpret and determine the data quality for temporal data by supporting quantitative and qualitative measurements of the hemispheric component. Figure 28 SSD’s Spectral Database – metadata records 62 Figure 29 An example metadata page with associated photographs 63 Figure 30 The spectral data associated with the photographs illustrated in Figure 29 5.1.2 Analysis of spectral data Once all suspect spectra have been filtered out analysis can commence on the high integrity data. There are a number of spectral analysis management systems available online, including SAMS (Rueda & Wrona 2003), SPECCHIO (Hueni 2007, Hueni & Kneubühler 2007), SPECtrum Processing Routines (SPECPR) (Clark 1993, Kokaly 2005) and SpectraProc (Hueni & Tuohy 2006). SSD also has expertise in computing language and interactive environments for algorithm development, data visualisation, data analysis, and numeric computation. There are a number of toolboxes available including project specific signal processing techniques. These may be tested in parallel to benchmark any custom methods produced by this project. A future report will document the post-processing procedure as specialised processing techniques are required for high dimensional feature space data. Both feature and spectral space methods will be used, such as quantifying similarity and dissimilarity, variation in rededge reflectance, derivative spectroscopy, band-depth analysis of absorption features and stepwise linear regression (Kumar & Skidmore 1998, Adams et al 1999, Lamb et al 2002, Buschmann & Nagel 1993, Kokaly & Clark 1999, Price 1992, 1994, Portigal et al 1997, Pu et al 2003, Buschmann & Nagel 1993, Filella & Penuelas 1994). 64 6 Conclusion No matter what the application, spectral data must be collected in a well-designed and consistent manner. Common practice should be to collect and document metadata associated with the spectral response. Minimum metadata requirements described for the SSD Spectral Database have been outlined and these always accompany the spectral information. Extreme caution should be placed on using reference spectra without such metadata. Any spectral data sharing necessitates the supply of both spectral and metadata information. The benefit of obtaining validated spectral data outweighs the small additional investment in time required for metadata collection. A rigorous spectral and metadata collection protocol can reduce systematic bias and minimise variability by accounting for extraneous factors. It is then possible that such data are useful for expediating application development due to the role of these spectra for remote sensing feasibility studies. 6.1 Further work and reporting Ground-based vegetation was the initial focus of this work because grasses, herbs and sedges often have immediate importance in stabilising soils and preventing erosion during the initial phase of revegetation. Introduced ground cover species of weeds have the potential to impact on species diversity and abundance and affect the frequency and intensity of fire disturbances. Further reports will address the spectral characterisation, combined with appropriate metadata of geological materials including waste rock, soil and ore outcrop, trial landform characterisations, vegetation measurements along environmental gradients, processed mine materials and potentially aquatic components. These spectra will also be documented in the SSD Spectral Database using laboratory and in situ measurements. Further reports will document the analysis of the spectral data acquired from these sources. 65 7 References Abdou WA, Bruegge CJ, Helmlinger MC, Conel JE, Pilorz SH, Ledeboer W, Gaitley BJ & Thome KJ 2002. Vicarious calibration experiment in support of the multi-angle imaging SpectroRadiometer. IEEE Transactions on Geoscience and Remote Sensing 40 (7), 1500– 1511. Adams ML, Philpot WD & Norvell WA 1999. Yellowness index: an application of spectral second derivatives to estimate chlorosis of leaves in stressed vegetation. International Journal of Remote Sensing 20 (18), 3663–3675. Analytical Spectral Devices (ASD) Inc 1999. Technical guide. 4th edn. ed Hatchell DC, Analytical Spectral Devices Inc, Boulder CO, USA. Section 0-1 to 26-8. Available online: http://www.asdi.com/tg_rev4_web.pdf Analytical Spectral Devices (ASD) Inc 2000. FieldSpec®Pro User’s Guide. Analytical Spectral Devices Inc, Boulder CO, USA. Analytical Spectral Devices (ASD) Inc 2001. Field spectrometry: Techniques and instruments. Available online at http://www.asdi.com/Field%20Spectroscopy-screen.pdf Web site accessed May 18, 2005. Analytical Spectral Devices (ASD) Inc 2002. Field Spec Pro User’s Guide, January 2002. USA. Anderson K, Milton EJ & Rollin EM 2003. Sources of uncertainty in vicarious calibration: Understanding calibration target reflectance. In Proceedings of the IEEE International Geoscience and Remote Sensing Symposium (IGARSS 2003), Toulouse, France. IEEE, New Jersey, USA, CD. Arnold GW, Ozanne PG, Galbraith KA & Dandrigde F 1985. The capweed content of pastures in south-west Western Australia. Australian Journal of Experimental Agriculture 25, 117– 123. Barret EC & Curtis LF 1992. Introduction to environmental remote sensing. 3rd edn, Chapman & Hall, London. Baumgardner MF, Silva LF, Biehl LL & Stoner ER 1985. Reflectance properties of soils. Advances in Agronomy 38, 1–44. Bayliss P, Bellairs S, Pfitzner K & Vink S 2004a. Revegetation of Nabarlek minesite: Preliminary characterisation of vegetation on the minesite and on adjacent natural landscapes in September 2003. Internal Report 488, October, Supervising Scientist, Darwin. Unpublished paper. Bayliss P, Pfitzner K & Bellairs S 2004b. Revegetation of Nabarlek minesite: Seasonal comparison of groundcover vegetation on the minesite and adjacent natural reference areas (September 2003 & May 2004). Internal Report 491, October, Supervising Scientist, Darwin. Unpublished paper. Beal D 1999. Wavelength and radiometric calibration methods. In Technical guide. 3rd edn, Appendix B, Analytical Spectral Devices, Boulder, CO, USA. Belanger MJ, Miller JR & Boyer MG 1995. Comparative relationships between some red edge parameters and seasonal leaf chlorophyll concentrations. Canadian Journal of Remote Sensing 21 (1), 16–21. 66 Bell LC 1996. Rehabilitation of disturbed land in environmental management. In The Australian minerals and energy industries: Principles and practices. ed Mulligan DR, University of New South Wales Press, Sydney, 227–261. Birch CJ, Hammer GL & Rickert KG 1998. Improved methods for predicting individual leaf area and leaf senescence in maize (Zea mays). Australian Journal of Agricultural Research 49, 249–262. Boochs F, Kupper G, Dockter K & Kuhbauch W 1990. Shape of the red edge as vitality indicator of plants. International Journal of Remote Sensing 11 (10), 1741–1753. Brennan K 2005. Quantitative descriptions of native plant communities with potential for use in revegetation at Ranger uranium mine. Internal Report 502, August, Supervising Scientist, Darwin. Unpublished paper. Brooks RR 1972. Geobotany and geochemistry in mineral exploration. Harper & Row, New York. Buschmann C & Nagel E 1993. In vivo spectroscopy and internal optics of leaves as a basis for remote sensing of vegetation. International Journal of Remote Sensing 14 (4), 711–722. Buschmann C, Nagel E, Szabo K & Kocsanyi L 1994. Spectrometer for fast measurements of in vivo reflectance, absorptance, and fluorescence in the visible and near-infrared. Remote Sensing of Environment 48, 18–24. Campbell JB 1996. An introduction to remote sensing. 2nd edn, The Guilford Press, New York. Carlson HW, Lass LW & Callihan RH, 1995. Detection of yellow hawkweed with high resolution multispectral digital imagery. Weed Technology 9, 477–483. Carter GA 1994. Ratios of leaf reflectances in narrow wavebands as indicators of plant stress. International Journal of Remote Sensing 15 (3), 697–703. Chang J, Clay SA, Clay DE, Aaron D, Helder D & Dalsted K 2005. Clouds influence precision and accuracy of ground-based spectroradiometers. Communications in Soil Science and Plant Analysis 36, 1799–1807. Chewings V, Pickup G, Bastin GN & Pearce G 2000. The potential for hyperspectral data mapping in Australian arid-zone vegetation. In 10th Australasian Remote Sensing and Photogrammetry Conference, Adelaide, 21–25 August 2000, 851–862. Clark RN 1993. SPECtrum Processing Routines User’s Manual Version 3. US Geological Survey Open File Report, 93–595. Clark RN, King TVV, Ager C & Swayze GA 1995. Initial vegetation species and senescence/stress mapping in the San Luis Valley, Colorado, using imaging spectrometer data. In Summitville Forum Proceedings 1995. eds Posey HH, Pendleton JA & Van Zyl D, Colorado Geological Survey Special Publication 38, 64–69. Available online: http://speclab.cr.usgs.gov/PAPERS.veg1/vegispc2.html Clark RN, King TVV, Klejwa M, Swayze GA & Vergo N 1990. High spectral resolution reflectance spectroscopy of minerals. Journal of Geophysical Research 95, (B8)12653– 12680. Clark RN, Swayze GA, Gallagher AJ, King TVV & Calvin WM 1993. The US Geological Survey, Digital Spectral Library: Version 1: 0.2 to 3.0 microns. US Geological Survey Open File Report, 93–592. 67 Cochrane MA 2000. Using vegetation reflectance variability for species level classification of hyperspectral data. International Journal of Remote Sensing 21 (10), 2075–2087. Collins W 1978. Remote sensing of crop type and maturity. Photogrammetric Engineering and Remote Sensing 44, 43–55. Collins W, Chang S, Raines G, Canney F & Ashley R 1983. Airborne biogeophysical mapping of hidden mineral deposits. Economic Geology 78, 737–749. Curran PJ & Milton EJ 1983. The relationships between the chlorophyll concentration, LAI and reflectance of a simple vegetation canopy. International Journal of Remote Sensing 4 (2), 247–255. Curran PJ 1989. Remote sensing of foliar chemistry. Remote Sensing of Environment 30, 271– 278. Curtiss B & Goetz AFH 2001. Field Spectrometry: techniques and instrumentation. In Technical guide, 4th edn, ed Hatchell DC, Analytical Spectral Devices Inc, Boulder CO, USA. Section 12-1 to 12-10. Available online: http://www.asdi.com/Field%20Spectroscopy-screen.pdf Curtiss B & Ustin SL 1989. The remote detection of early stages of air pollution injury in coniferous forests using imaging spectrometry. In Proceedings European Joint Research Centre Remote Sensing of Forests Workshop. Ispara, Italy, September 1988. Danson FM 1995. Developments in the remote sensing of forest canopy structure. In Advances on environmental remote sensing, eds FM Danson & SE Plummer, John Wiley, Chichester, 53–69. Datt B 1999a. Visible/near infrared reflectance and chlorophyll content in Eucalyptus leaves. International Journal of Remote Sensing 20, 2741–2759. Datt B 1999b. Remote sensing of water content in Eucalyptus leaves. Australian Journal of Botany 47, 909–923. Datt B 2000a. Identification of green and dry vegetation components with a cross-correlogram spectral matching technique. International Journal of Remote Sensing 21, 2133–2139. Datt B 2000b. Recognition of Eucalyptus forest species using hyperspectral reflectance data. In Proceedings: Geoscience and Remote Sensing Symposium 2000. IGARSS 2000. IEEE 2000 International. Volume 4, 1405–1407. Daws M, Firth R, Lu P, Poole P, Pugh L & Zimmwemann A 2008. Methodology: Trial landform revegetation and monitoring for ERA Ranger Mine. Draft Report 2 October 2008. EWL Sciences Pty Ltd, Darwin. Dawson TP 2000. The potential for estimating chlorophyll content from a vegetation canopy using the Medium resolution Imaging Spectrometer (MERIS). International Journal of Remote Sensing 21 (10), 2043–2051. Dawson TP & Curran P J 1998. A new technique for interpolating the reflectance red edge position. International Journal of Remote Sensing 19, 2133–2139. Deering DW 1989. Field measurements of bidirectional reflectance. In Theory and applications of optical remote sensing. ed G Asrar, Wiley, New York, 14–61. 68 DiPietro DY 2002. Mapping the invasive plant Arundo donax and associated riparian vegetation using hyperspectral remote sensing. Unpublished Master’s Thesis, University of California, Davis, May 2002. Duggin MJ & Philipson WR 1982. Field measurement of reflectance: Some major considerations. Applied Optics 21 (15), 2833–2840. Dungan J 1998. Spatial prediction of vegetation quantities using ground and image data. International Journal of Remote Sensing 19 (2), 267–285. Dury S, Jia X, Turner B & Dibley G 2000. From leaf to canopy: Determination of nitrogen concentration of Eucalypt tree foliage using HyMap image data. In Proceedings 10th Australasian Remote Sensing and Photogrammetry Conference, Adelaide 21–25 August 2000, 875–891. Dymond JR, Shepherd JD & Qi J 2001. A simple physical model of vegetation reflectance for standardising optical satellite imagery. Remote Sensing of Environment 75, 350–359. Elvidge CD 1990. Visible and near infrared reflectance characteristics of dry plant materials. International Journal of Remote Sensing 11, 1775–1795. Emery DR, Milton EJ & Felstead R 1998. Optimising data collection for heathland remote sensing. Developing International Connections. In Proceedings of the 24th Annual Conference of the Remote Sensing Society. Remote Sensing Society, Nottingham, UK, 483– 489. Evans MC & Williams AM 1995. Integration of satellite imagery and GIS for natural resource management in the mining industry. In NARGIS 95: Proceedings of the 2nd North Australian Remote Sensing and Geographic Information Systems Forum. Darwin 18–20 July 1995, Supervising Scientist and the Australasian Urban and Regional Information Systems Association Inc [Monograph no 11], AGPS, Canberra, 118–127. EWL Sciences 2005. ERA Ranger Weed Workshop: Proceedings. 25th October 2005. Filella I & Penuelas J 1994. The red edge position and shape as indicators of plant chlorophyll content, biomass and hydric status. International Journal of Remote Sensing 15 (7), 1459– 1470. Fitzpatrick BT, Hill GJE & Kelly GD 1990. Mapping and monitoring of weed infestations using satellite remote sensing data. In Proceedings 5th Australasian Remote Sensing Conference, Perth, Western Australia, 8–12 October 1990, 598–601. Fyfe SK 2003. Spatial and temporal variation in spectral reflectance: are seagrass species spectrally distinct? Limnology and Oceanography 48, 464–479. Fyfe S 2004. Hyperspectral studies of New South Wales seagrasses with particular emphasis on the detection of light stress in Eelgrass Zostera caprirorni. Unpublished PhD Thesis, University of Wollongong, 2004. Game M, Carrel JE & Hotrabhavandra T 1982. Patch dynamics of plant succession on abandoned surface coal mines: A case history approach. The Journal of Ecology 70 (3), 707–720. Gates DM, Keegan HJ, Schleter JC & Weidner VR 1965. Spectral properties of plants. Applied Optics 4 (1), 11–20. 69 Goel PK, Prasher SO, Landry JA, Patel RM & Viau AA 2003. Hyperspectral image classification to detect weed infestations and nitrogen status of corn. Transactions of the American Society of Agricultural Engineers 46 (2), 539–550. Goetz AFH 1992. Imaging spectrometry for earth remote sensing. In Imaging Spectroscopy: Fundamentals and Prospective Applications. ECSC, EEC, EAEC, Brussels and Luxembourg, 1–19. Goetz FH & Rowan LC 1981. Geologic remote sensing. Science 211, 781–791. Gomez RB 2001. Spectral library issues in hyperspectral imaging applications. In 5th Joint Conference on Standoff Detection for Chemical and Biological Defence. 24–28 September 2001, Williamsburg, Virginia. Grove CI, Hook SJ & Paylor II ED 1992. Laboratory reflectance spectra of 160 Minerals, 0.4 to 2.5 Micrometers. Jet Propulsion Laboratory Pub. 92-2. Gu XF, Guyot G & Verbrugghe M 1992. Evaluation of measurement errors in ground surface reflectance for satellite calibration. International Journal of Remote Sensing 13, 2531–2546. Guanter L, Alonso L & Moreno J 2005. First Results from the PROBA/CHRIS Hyperspectral/Multiangular Satellite System Over land and Water Targets. IEEE Geoscience and Remote Sensing Letters 2 (3), 250–254, July 2005. Hannan JC & Bell LC 1993. Surface rehabilitation. In Australasian Coal Mining Practice eds Hargraves AJ & Martin CH, The Australasian Institute of Mining and Metallurgy, Victoria, 260–280. Hapke B 1993. Theory of reflectance and emittance spectroscopy. Cambridge University Press, UK. Hatchell D 1999. Fundamentals of spectroradiometry. In Analytical Spectral Devices Inc 1999: Technical Guide, 4th edn, Analytical Spectral Devices Inc, Boulder CO, USA. Section 13-1 to 14-7. Herold M, Roberts DA, Gardner ME & Dennison PE 2004. Spectrometery for urban area remote sensing – Development and analysis of a spectral library from 350 to 2400 nm. Remote Sensing of Environment 91, 304–319. Hick P 1999. The role of remote sensing for measuring mining impact on the Australian arid environment and the link to ecological function. In On the threshold: Research into practice. Proceedings of the Second AMEEF Innovation Conference. Western Australia, 4– 5 August 1999. Australian Minerals and Energy Environment Foundation, Melbourne, 115– 124. Hick P, Smith R, Ong C & Honey F 1994. Vegetation assessment and monitoring using airborne digital multispectral videography: Implications for geobotanical prospecting and quantitative pre and post-mining measurement. In 19th Annual environmental workshop 1994, Karratha WA, 9–14 October 1994, Australian Mining Industry Council, Canberra, 178–189. Hill GJE & Phinn SR 1993. Revegetated sand mining areas, swamp wallabies and remote sensing: North Stradbroke Island, Queensland. Australian Geographical Studies 31 (1), 3– 13. Horler NNH, Dockray M & Barber J 1983. The red edge of plant leaf reflectance. International Journal of Remote Sensing 4, 273–288. 70 Horn BKP & Sjoberg RW 1978. Calculating the Reflectance Map. Massachusetts Institute of Technology, http://people.csail.mit.edu/bkph/AIM/AIM-498-OPT.pdf, Web site accessed May 18, 2005. Howard JA, Watson RD & Hessin TD 1971. Spectral reflectance properties of Pinus ponderosa in relation to the copper content of the soil, Machite mine, Colorado. In Proceedings of the 7th Symposium on Remote Sensing of the Environment, Ann Arbor, Michigan, 285–296. Hueni A 2006. Field spectroradiometer data: Acquisition, organisation, processing and analysis on the example of New Zealand Native Plants. Unpublished Masters of Philosophy in Environmental Science Thesis. Massey University, New Zealand. Hueni A & Tuohy M 2006. Spectroradiometer data structuring, pre-processing and analysis – An IT based approach. Journal of Spatial Science 51(2), 93. Hueni A 2007. SPECCHIO User Guide. Remote Sensing Laboratories, University of Zurich 1.1: 71. Hueni A & Kneubühler M 2007. SPECCHIO: a system for storing and sharing spectroradiometer data. SPIE Newsroom, December 2007. DOI: 10.1117/2.1200711.0956. Online at http://spieorg/x18220.xml Hueni A, Nieke J, Schopfer J, Kneubühler M & Itten K 2009. The spectral database SPECCHIO for improved long term usability and data sharing. Computers & Geosciences 35(3), 557–565. Hueni A, Nieke J, Schopfer J, Kneubuhler M & Itten KI 2007. Metadata of spectral data collections. Proceedings 5th EARSeL Workshop on Imaging Spectroscopy. Bruges, Belgium, April 23–25 2007. Hunt GR 1977. Spectral signatures of particulate minerals in the visible and near infrared. Geophysics 42, 502–513. Hunt GR 1979. Near-infrared (1.3-2.4μm) spectra of alteration minerals: Potential for use in remote sensing. Geophysics 44, 1974–1986. Hunt GR & Ashley RP 1979. Spectra of altered rocks in the visible and near infrared. Economic Geology 74, 1613–1629. Hunt GR & Salisbury JW 1971. Visible and near-infrared spectra of minerals and rocks: II. Carbonates. Modern Geology 2, 23–30. Hunt GR, Salisbury JW & Lenhoff CJ 1971a. Visible and near-infrared spectra of minerals and rocks: III Oxides and hydroxides. Modern Geology 2, 195–205. Hunt GR, Salisbury JW & Lenhoff CJ 1971b. Visible and near-infrared spectra of minerals and rocks: IV. Sulphides and sulphates. Modern Geology 3, 1–14. Hunt Jr ER, Everitt JH, Ritchie JC, Moran MS, Booth DT, Anderson GL, Clark PE & Seyfried MS 2003. Applications and research using remote sensing for rangeland management. Photogrammetric Engineering and Remote Sensing 69 (6), 675–693 Hunt ER, McMurtrey JE, Parker-Williams AE & Corp L A 2004. Spectral characteristics of leafy spurge leaves and flower bracts. Weed Science 52(4), 492–497. Hunt ER & Rock BN 1989. Detection of changes in leaf water content using near- and middleinfrared reflectances. Remote Sensing of Environment 30, 43–54. 71 Hunt ER, Rock BN & Nobel PS 1987. Measurement of leaf relative water content by infrared reflectance. Remote Sensing of Environment 22, 429–435. Irons JR, Weismiller RA & Peterson GW 1989. Soil reflectance. In Theory and applications of optical remote sensing. ed G Asrar, Wiley-Interscience, New York, 66–106. Jackson RD, Moran MS, Slater PN & Biggar SF 1987. Field calibration of reference reflectance panels. Remote Sensing of Environment 22, 145–158. Joshi CM, de Leeuw J & van Duren IC 2004. Remote sensing and GIS applications for mapping and spatial modelling of invasive species. In ISPRS 2004: Proceedings of the XXth ISPRS congress: Geo-imagery bridging continents. 12–23 July 2004, Istanbul, Turkey, Comm. VII. 669–677. Joyce KE & Phinn SR 2003. Hyperspectral analysis of chlorophyll content and photosynthetic capacity of coral reef substrates. Limnology and Oceanography 48, 489–496. Jupp DLB 1997. Issues in reflectance management. CSIRO Earth Observation Centre, Discussion Draft August 1996 Updated April 1996. http://www.eoc.csiro.au/millwshop/ref_cal.pdf, Web site accessed May 18, 2005. Kimes DS & Kirchner JA 1982. Irradiance measurement errors due to the assumption of a Lambertian reference panel. Remote Sensing of Environment 22, 145–158. Kindel BC, Qu Z & Goetz AF 2001. Direct solar spectral irradiance and transmittance measurements from 350-2500 nm. Applied Optics 40 (21), 3483–3494. Kokaly RF 2001. Investigating a physical basis for spectroscopic estimates of leaf nitrogen concentration. Remote Sensing of Environment 75 (2), 153–161. Kokaly RF 2005. View_SPECPR Software, Installation Procedure, and User’s Guide (Version 1.1). U.S. Department of the Interior, US Geological Survey Open-File Report 2005-1348. Kokaly RF & Clark RN 1999. Spectroscopic determination of leaf biochemistry using banddepth analysis of absorption features and stepwise linear regression. Remote Sensing of Environment 67, 267–287. Kumar L & Skidmore AK 1998. Use of derivative spectroscopy to identify regions of differences between some Australian Eucalypt Species. In Proceedings 9th Australasian Remote Sensing and Photogrammetry Conference, Sydney, Australia. 20–24 July, 1998. [CD-ROM] Labsphere (undated). Important information. Care and handling Guidelines. Available online: http://www.asdi.com/spectraloncare.pdf Lamb DW, Steyn-Ross M, Schaares P, Hanna MM, Silvester W & Steyn-Ross A 2002. Estimating leaf nitrogen concentration in ryegrass (Lolium spp) pasture using the chlorophyll red-edge: theoretical modelling and experimental observations. International Journal of Remote Sensing 23 (18), 3619–3648. Lass LW, Prather TS, Glenn NF, Weber KT, Mundt JT & Pettingill J 2005. A review of remote sensing of invasive weeds and example of the early detection of spotted knapweed (Centaurea maculosa) and babysbreath (Gypsophila paniculate) with a hyperspectral sensor. Weed Science 53, 242–251. Lewis MM 2000. Discrimination of arid vegetation composition with high spectral resolution imagery. The Rangeland Journal 22, 141–167. 72 Lillesand TM & Kiefer RW 1994. Remote sensing and image interpretation. 3rd edn, Wiley Inc, New York. MacArthur A 2007a. Field Guide for the ASD FieldSpec Pro – White Reference Mode. Natural Environment Research Council Field Spectroscopy Facility (NERC FSF©)Version 2 (November 2007). Available online: http://fsf.nerc.ac.uk/resources/guides/pdf_guides/asd_guide_v2_wr.pdf MacArthur A 2007b. Field Guide for the ASD FieldSpec Pro – Raw DN Mode. Natural Environment Research Council Field Spectroscopy Facility (NERC FSF©)Version 2 (November 2007). Available online: http://fsf.nerc.ac.uk/resources/guides/pdf_guides/asd_guide_v2_dn.pdf MacArthur A 2007c. Field Guide for the ASD FieldSpec Pro – Radiance/Irradiance Measurements in Raw DN Mode. Natural Environment Research Council Field Spectroscopy Facility (NERC FSF©)Version 2. Available online: http://fsf.nerc.ac.uk/resources/guides/pdf_guides/asd_guide_v2_RadIrrad.pdf MacArthur AA, MacLellan C J & Malthus TJ 2006. What does a spectrometer see? Natural Environment Research Council Field Spectroscopy Facility (NERC FSF©). Available online: http://fsf.nerc.ac.uk/news/RSPSocPoster.pdf McCall J, Gunn J & Struik H 1995. Photo interpretive study of recovery of damaged lands near the metal smelters of Sudbury, Canada. Water, Air, & Soil Pollution 85 (2), 847–852. McDougal RR, Clark RN, Livo KE, Koklay RF, Rockwell BW & Vance JS 1999. Preliminary materials mapping in the Oquirrh Mountains region for the Utah EPA Project using AVIRIS data. Summaries of the 8th Annual JPL Airborne Earth Science Workshop. ed RO Green, NASA JPL AVIRIS Workshop, 8–11 February 1999, JPL Publication 99-17, 291– 298. McGowen IJ, Frazier P & Orchard P 2001. Remote sensing for broadscale weed mapping – is it possible? In Geospatial Information and Agriculture conference – Information for Better Production and Environmental Management (Incorporating Precision Agriculture in Australasia 5th Annual Symposium), 16–19 July 2001, Australian Technology Park, Everleigh, Sydney. [CD-ROM] Mifsud J 1996. Vegetation establishment in tropical environments. In Mine Rehabilitation in Tropical Environments. Short course Notes, 18–20 December 1996 Darwin NT, organised by Australian Centre for Minesite Rehabilitation Research, Kenmore Qld. Miller JR, Wu J, Boyer MG, Belanger M. & Hare EW 1991. Season patterns in leaf reflected red edge characteristics. International Journal of Remote Sensing 12 (7), 1509–1523. Milton EJ 1987. Principles of field spectrometry. International Journal of Remote Sensing 8, 1807–1827. Milton EJ 2001. Methods in Field Spectroscopy, NERC EPFS, http://www.soton.ac.uk/~epfs/methods/spectroscopy.shtml, Web site accessed May 18, 2005. Milton EJ & Goetz AFH 1997. Atmospheric influences on field spectrometry: Observed relationships between spectral irradiance and the variance in spectral reflectance. In Seventh International Symposium on Physical Measurements and Signatures in Remote Sensing (ISPRS), Courchevel, France, 109–114. 73 Milton NM & Mouat DA 1989. Remote sensing of vegetation responses to natural and cultural environmental conditions. Photogrammetric Engineering and Remote Sensing 55 (8), 1167–1173. Milton EJ, Rollin EM & Emery DR 1995. Advances in field spectroscopy. In Advances in environmental remote sensing. eds Danson FM & Plummer SE, Wiley, UK. Milton EJ, Schaepman ME, Anderson K, Kneubuhler M & Fox N 2009. Progress in field spectroscopy. Remote Sensing of Environment. 113, 92-109, http://www.sciencedirect.com/science/article/B6V6V-4PSJT3R1/2/1f6cf30222e1e5b467c6161e6eb6817d. Minerals Council of Australia 2002. Sustainable Development Report 2002. Minerals Council of Australia, ACT. Available online: http://www.minerals.org.au/downloads/pdf/sd_report02.pdf Moody ME & Mack RN 1988. Controlling the spread of plant invasions: the importance of nascent foci. Journal of Applied Ecology 25, 1009–1021. Mueller A, Strobl P, Lehmann F & Reinhaeckel G 1997. Case studies of airborne remote sensing for the assessment of mining impacts. In Third International Airborne Remote Sensing Conference and Exhibition. Copenhagen, Denmark. Volume I, 257–264. Munden R, Curran PJ & Catt JA 1994. The relationship between red-edge and chlorophyll concentration in Broadbalk winter wheat experiment at Rothamsted. International Journal of Remote Sensing 15 (7), 1459–1470. Murphy RJ & Wadge G 1994. The effects of vegetation on the ability to map soils using imaging spectrometer data. International Journal of Remote Sensing 15 (1), 63–86. Nicodemus FE 1982. Reflectance nomenclature and directional reflectance emissivity. Applied Optics 9(6), 1474–1475. Nicodemus F, Richmond J, Hsia J, Ginsberg I & Limperis T 1977. Geometrical considerations and nomenclature for reflectance. NBS Monograph 160, US Department of Commerce. Parker-Williams A & Hunt ER 2004. Accuracy assessment of leafy spurge detection with hyperspectral remotely sensed data. Journal of Range Management 56 (1), 106–112. Pfitzner K, Bartolo RE, Ryan B & Bollhöfer A 2005. Issues to consider when designing a spectral library database. In Spatial Sciences Institute Conference Proceedings 2005. Spatial Sciences Institute, Melbourne, ISBN 0-9581366. Pfitzner K 2005a. Ground-based spectroscopy – do we need it? In Applications in Tropical Spatial Science, Proceedings of the North Australian Remote Sensing and GIS Conference, 4–7 July 2005, Darwin NT, CD. Pfitzner K 2005b. Remote sensing for minesite assessment – examples from eriss. In Applications in Tropical Spatial Science, Proceedings of the North Australian Remote Sensing and GIS Conference, 4–7 July 2005, Darwin NT, CD. Pfitzner K & Bayliss P 2006. Revegetation monitoring – 60 cm pixels and an object oriented approach. In Proceedings of the 13th Australasian Remote Sensing and Photogrammetry Conference, Canberra, November 2006. Pfitzner K & Bollhöfer A 2008. Status of the vegetation plots for the spectral library project. Internal Report 546, December, Supervising Scientist, Darwin. Unpublished paper. 74 Pfitzner K, Bollhöfer A & Carr G 2006. A standard design for collecting vegetation reference spectra: Implementation and implications for data sharing. Journal of Spatial Sciences 54 (2), 79–92 Pfitzner K & Carr G 2006. Design and implementation of vegetation reference spectra: Implications for data sharing. In Proceedings Workshop on hyperspectral remote sensing and field spectroscopy of agricultural crops and forest vegetation, 10 February 2006, University of Southern Queensland, Toowoomba, Queensland, 21–22. Pfitzner K, Esparon A & Bollhöfer A, 2008. SSD’s Spectral Library Database. In Proceedings of the 14th Australasian Remote Sensing and Photogrammetry Conference, Darwin, 29 September – 3 October, 2008. Phinn S, Scarth P, Gill T, Roelfsema C & Stanford M 2008. Field spectrometer and radiometer guide. Centre for Remote Sensing & Spatial Information Science, School of Geography, Planning and Architecture, The University of Queensland, Version 8. Phinn S, Hill GJE, Johnston S & Kirwood C 1991. Landsat Thematic Mapper imagery for mapping disturbed and rehabilitated vegetation, North Stradbroke Island, Queensland. Queensland Geographical Journal [vol], 47–51. Pinter PJ, Jackson RD & Moran SM 1990. Bidirectional reflectance factors of agricultural targets: A comparison of ground, aircraft and satellite based observations. Remote Sensing Environment 32, 215–228. Portigal F, Holasek R, Mooradian G, Owensby P, Dicksion M, Fene M, Elliot M, Hall E & Driggett D 1997. Vegetation classification using red-edge first derivative and green peak statistical moment indices with the Advanced Airborne Hyperspectral Imaging System (AAHIS). In Third International Airborne Remote Sensing Conference and Exhibition, Copenhagen, Denmark, 7–10 July 1997, vol. II (Ann Arbor, MI:ERIM), 789–797. Price JC 1992. Variability of high resolution crop reflectance spectra. International Journal of Remote Sensing 14, 2593–2610. Price JC 1994. How unique are spectral signatures? Remote Sensing of Environment 49, 181–186. Pu R, Gong P, Biging GS & Larrieu MR 2003. Extraction of red-edge optical parameters from hyperion data for estimation of forest leaf area index. IEEE Transactions on Geoscience and Remote Sensing 41 (4), 916–921. Rathmore CS & Wright R 1993. Monitoring environmental impacts of surface coal mining. International Journal of Remote Sensing 14 (6), 1021–1042. Rees WG 2001. Physical principles of remote sensing. 2nd edn, Cambridge University Press, UK. Robinson BF & Biehl LL 1979. Calibration procedures for measurement of reflectance factor in remote sensing field research. Measurements of Optical Radiations SPIE 196, 16–26. Rollin EM 1999. NERC-FSF USER NOTE Sun-angle Correction Factors for Spectrolon Reference Panels. Natural Environment Research Council Field Spectroscopy Facility. Available online: http://fsf.nerc.ac.uk/resources/post-processing/postprocessingV2_pdf/pp_spec_angular.pdfH 75 Rollin EM, Emery DR. & Milton EJ 1995. The design of field spectroradiometers: A user’s view. In Remote sensing in action. eds Curran PJ & Robertson YC, Proceedings of the 21st Annual Conference of the Remote Sensing Society, Nottingham, UK, 555–562. Rollin EM, Emery DR & Milton EJ 1997. Reference panel anisotropy in field spectroscopy. In Seventh International Symposium on Physical Measurements and Signatures in Remote Sensing. eds Guyot G & Phulpin T, Balkema, Rotterdam, 1997. Available online: fsf.nerc.ac.uk/calibration/ Accessed May 2003. Rollin EM, Emery DR & Milton EJ 1998. Reference panel anisotropy in field spectroscopy. International Journal of Remote Sensing 21, 15, 2799–2810. Rollin E, Milton E & Emery D 2000. Reference panel anisotropy and diffuse radiation – some implications for field spectroscopy. International Journal of Remote Sensing 21 (15), 2799– 2810. Rowan LC, Goetz AFH & Ashley RP 1977. Discrimination of hydrothermally altered and unaltered rocks in visible and near infrared multispectral images. Geophysics 42, 522–535. Rueda CA & Wrona AF 2003. SAMS Spectral Analysis and Management System. Version 2. User’s Manual. Centre for Spatial Technologies and Remote Sensing, Department of Land, Air and Water Resources, University of California, Davis. Available online http://sams.casil.ucdavis.edu/. Salisbury JW 1998. Spectral Measurements Field Guide, Earth Satellite Corporation, April 23 1998, Defence Technology Information Centre Report No. ADA362372. Salvaggio C, Smith LE & Antoine EJ 2005. Spectral signature databases and their application/misapplication to modelling and exploitation of multispectral/hyperspectral data. In Proceedings of the SPIE, Sensor Data Exploitation and Target Regognition, Algorithms and Technologies for Multispectral, Hyperspectral and Ultraspectral Imagery XI, Volume 5806, March 28 through April 1, 2005. Satterwhite MB & Henley JP 1990. Hyperspectral signatures (400–2500 nm) of vegetation, minerals, soils, rocks, and cultural features: Laboratory and field measurements. US Army Corps of Engineers, Engineer Topographic Laboratories Fort Belvoir, Virginia 22060– 5546. Schaepman ME 1998. Calibration of a field spectroradiometer. Calibration and characterisation of a non-imaging field spectroradiometer supporting imaging spectrometer validation and hyperspectral sensor modelling. Remote Sensing Laboratories, Department of Geography, University of Zurich, Zurich Switzerland. Schaepman-Strub G, Schaepman M, Dangel S, Painter T and Martonchik J 2005. About the use of reflectance terminology in imaging spectroscopy. EARSeL eProceedings 4, 2/2005: 191202. Available online: http://las.physik.unioldenburg.de/eProceedings/vol04_2/04_2_schaepman-strub1.pdf. Accessed: 06/01/2009 Schmidt H & Glaesser C 1998. Multitemporal analysis of satellite data and their use in the monitoring of the environmental impacts of open cast lignite mining areas in Eastern Germany. International Journal of Remote Sensing 19 (12), 2245–2260. Shafii B, Price WJ, Prather TS, Lass LW & Thill DC 2004. Using landscape characteristics as prior information for Bayesian classification of yellow starthistle. Weed Science 52, 948–953. 76 Sharp D & Simon BK 2002. AusGrass grasses of Australia. ABRS Identification Series. Australian Biological Resources Study, Canbera (ABRS) and Environmental Proection Agency, Brisbane (EPA). Silva LF 1978. Radiation and instrumentation in remote sensing. In Remote sensing – the quantitative approach. eds Swain et al, McGraw & Hill, New York, 121–135. Slaton MR, Hunt ER & Smith WE 2001. Estimating near-infrared leaf reflectance from leaf structural characteristics. American Journal of Botany 88 (2), 278–284. Smith NM 1995. Weeds of natural ecosystems. A field guide to environmental weeds of the Northern Territory, Australia. Environment Centre NT. Smith NM 2002. Weeds of the wet/dry tropics of Australia. A field guide. Environment Centre NT. Taylor F 2004. Field guide for the ASD FieldSpecPro-FR – Raw DN Mode. Version 1.1. Natural Environment Research Council (NERC) Field Spectroscopy Facility (FSF). Available online: http://fsf.nerc.ac.uk/resources/guides/pdf_guides/asd_guide_v1_dn.pdf Ticehurst C, Phinn S, Held A & Edmonds T 2003. Mapping an invasive weed (pond apple) in the wet tropics using multi and hyperspectral image data. In Proceedings of Spatial Sciences 2003, Canberra. Tucker CJ 1977. Asymptotic nature of grass canopy spectral reflectance. Applied Optics 16 (5), 1151–1156. Tucker CJ & Garrett MW 1977. Leaf optical system modelled as a stochastic process. Applied optics 16, 1151–1157. Underwood E, Ustin S & DiPietro D 2003. Mapping non-native plants using hyperspectral imagery. Remote Sensing of the Environment 86, 150–161. University of Queensland, 2006. Coastal Remote http://www.gpem.uq.edu.au/crssis/tools/rstoolkit/index.html Sensing Toolkit. Ustin SL, DiPietro D, Olmstead K, Underwood E & Scheer G 2002. Hyperspectral remote sensing for invasive species detection and mapping. In International Geoscience and Remote Sensing Symposium: 24th Canadian Symposium On Remote Sensing, Toronto, Canada. 3, 1658–1660. Waggitt PW & McQuade CV 1994. Mine close-out criteria: Present guidelines and future trends in Australia. In The AusIMM Annual Conference, Darwin, 5–9 August 1994. Warren P & Hick P 1996. Tracking our performance. Airborne remote sensing at Comalco’s bauxite mine, Weipa, North Queensland. In 3rd International and 21st Annual Minerals Council of Australia Environmental Workshop 2, 67–78. Wessman CA, Aber JD, Peterson DL & Mellio JM, 1988. Foliar analysis using near infrared reflectance spectroscopy. Canadian Journal for Research 18, 6–11. Wilson WJ 1963. Estimation of foliage denseness and foliage angle by inclined point quadrats. Australian Journal of Botany 11, 95–105 77 Appendix A SSD’s standards for collecting field reflectance spectra SSD’s spectral measurement standards have been developed to account for: adequate spectrometer warm-up time, laboratory monitoring of the spectrometer and reference panels; image documentation of the target and environmental conditions (photographs of the target at nadir, scaled set-up horizon photographs and hemispherical photographs); subject information at the time of sampling (classification, condition, appearance, physical state); measurement information (instrument mode, date, local time, data collector(s), fore optics, number of integrations, reference material, height of measurement from target and ground, viewing and illumination geometry); environmental conditions (general site description, specific site location, geophysical location, sun azimuth and altitude, ambient temperature, relative humidity, wind speed and direction, weather instrument and sky conditions); and of course, reflectance spectra. Section A1 outlines the standards implemented for spectral field measurements over vegetation plots. The equipment required in the field is outlined and this can be used as a checklist when packing for a fieldtrip. Section A2 outlines the standards implemented for spectral measurements made in the laboratory. Section A3 provides details on care and transport of the spectrometer. Section A4 outlines the steps involved in set up of the spectrometer in the field.. Section A5 details cloud descriptions. Section A6 provides instructions for standardised photographic recording. A.1 Standards for collecting field measurements Table A1 Required field equipment Item Description Category Item Description Category 1 Buggy Field Equipment 18 8° Fore optic ASD Equipment 2 Buggy Wooden Brace Field Equipment 19 Trigger Fore optics Holder ASD Equipment 3 Buggy Wooden Flat Panel Field Equipment 20 Laptop ASD Equipment 4 Camera Field Equipment 21 Spare Laptop Batteries ASD Equipment 5 Spare Batteries AA Batteries Field Equipment 22 Serial Connector Cable ASD Equipment 6 Level Field Equipment 23 White Reference Panel in Box ASD Equipment 7 Laser/ Plumb Line Field Equipment 24 Field Notes Folder Stationery 8 Weather Station Field Equipment 25 Pens Stationery 9 Probe Holder Tripod Field Equipment 26 Field Data Sheets Stationery 10 GPS Field Equipment 27 Permanent Marking Pen Stationery 11 2 metre ruler Field Equipment 28 Weed Books Reference 12 Tripod Chain Brace Field Equipment 29 Brock’s Plant Book Reference 13 Sample Bags Field Equipment 30 Fencing wire Maintenance 14 Access Key (Croc Park only) Field Equipment 31 Pliers Maintenance 15 Spectrometer ASD Equipment 32 Wire Cutters Maintenance 16 Charged Spectrometer Batteries ASD Equipment 33 Flagging Tape Maintenance 17 Pelican Case ASD Equipment 34 Mash Hammer Maintenance 78 The field measurement standards can be followed for measurements other than the temporal sampling of the vegetation plots, with the only difference being the height of FOV and WR panel relative to the ground. The laboratory spectral standards are transferable and should be used for all applications. Prior to the planned field trip, ensure that the battery packs for both spectrometer (x 3) and controlling computer (x 3) are charged. Note that it takes about 4.5 h to charge a totally discharged battery. In the laboratory, stand the spectrometer securely on the supplied base unit and plug the AC adapter into an AC outlet and connect the cable from the power supply into the three-pin plug on the back plate of the spectrometer. A.1.1 Turn on the spectrometer Always turn the spectrometer on before the laptop to prevent irreparable damage to the spectrometer array. Turn on the spectrometer (connected to the mains power) so that the spectrometer can warm up while the equipment is packed and loaded into the vehicle. Note that the spectrometer must be running longer than 30 minutes and ideally warmed up for 90 minutes prior to the collection of spectra. Note the time that the spectrometer was turned on so that the length of warm-up time can be documented in the spectral metadata. A.1.2 Pack equipment Pack equipment into the vehicle. Use the ‘Required field equipment’ checklist. A.1.3 Pack spectrometer Pack spectrometer into the vehicle once all other equipment is packed and the operator is ready to leave. The spectrometer can be packed in the pelican case and secured in the tray of a station wagon. The spectrometer is sensitive to high ambient temperatures and vibrations and should not be transported under direct sunlight or left in the car without the air conditioner running. It is not appropriate to transport the spectrometer in the back of a ute. For travel on sealed roads only, the spectrometer can be secured with a seatbelt in the back of a sedan. This way, the spectrometer can be left switched on during transport as part of the warm-up time. Once at the field location, ensure the transport vehicle is in a safe and secure location then unpack the field equipment. A.1.4 Set up buggy Unfold buggy so that it is stable on three wheels and place the warmed-up spectrometer into the buggy seat (without the top panel). Run the adjustable velcro straps on buggy though the spectrometer handle and comfortably tighten so that the spectrometer is vertical and secure. Place the smaller wooden brace and large horizontal wooden panel onto the buggy and secure. This will keep the spectrometer shaded and form a shelf to place the laptop and WR box. Place the laptop and WR panel box on the buggy’s horizontal wooden ‘bench top’ panel. Connect the laptop to the spectrometer via the serial cable. 79 Load the auxiliary equipment into the buggy basket (laser/plumbline, level, counterweight, pen, field sheets, camera, portable weather station). A.1.5 Set up measuring equipment Set up the wooden tripod stabilisation structure at the desired plot. The setup will be positioned on the side of the target point opposite the sun. The setup side for measurement of the plot may differ depending on the time of day and the season. With the vertical pole of the wooden stabilisation structure held upright by the metal tripod, lift the arm of the 2 m pole so that it is horizontal and at a 90° angle from the vertical pole. Secure chain onto hooks so that the arm is held in place. Swing the arm over the vegetation plot to check the position of the tripod and probe over the desired target. A.1.6 Attach the pistol grip and laser Screw the pistol grip that holds the fore optics into the end of the horizontal pole. Remove the fibre optic cap and store in a secure place so that the fibre optic can be recapped at the end of measurement collection. Unscrew the crimp on the pistol grip and carefully feed the fibre optic cable through the crimp and gently through the pistol grip until the tip of the fibre optic can be seen protruding through. Tighten the crimp so that the cable is held in place but be careful to not over tighten as this will damage the fibre optic cable. Remember to be careful not to kink or step on the cable and keep the cable only loosely rolled. Screw on the 8° FOV lens attachment onto the fore optic and attach the laser pointers to the pistol grip. Secure the fibre optic cable to the wooden tripod with Velcro straps so it runs along the horizontal pole and down the vertical pole and does not fall or cast shadow within the sampling area or create a trip hazard. A.1.7 Load and turn on weather station A.1.8 Check the viewing geometry Orientate the white panel box to ensure that the open lid will not cast a shadow on the panel. Swing the arm of the stabilisation device around to the WR panel and adjust the pram and/or white panel so that the probe is directly over the panel box. Use the laser (or small level and plumbline) to ensure the probe is pointing to the centre of the white panel box. Move the tripod and/or WR panel on buggy as necessary. Once the FOV is centred in the middle of the WR panel, swing the arm of the stabilisation device back over the vegetation target at 90°, 60° and 30° from the WR panel to ensure that the probe will be measuring the vegetation within the plot. Once satisfied that the viewing geometry setup is correct, swing the arm of the stabilisation device around to the WR panel ready for spectral measurements. A.1.9 Switch laptop on The spectrometer is already switched on and running. Turn the controlling laptop computer on. 80 A.1.10 Check that the date and time on the PC are correct Check that the date and time on the PC are correct (Australian Central Standard Time). These fields will be recorded in the spectral header. A.1.11 Create a path to store the spectral data Through Windows explorer, create a path to store the spectral data. The correct working folder is based on: C:\Data 20--\Field Data 20--\Location (Croc Park, Berrimah Farm or CSIRO)\CP_20--_mm_dd eg C:\Data 2007\Field Data 2007\Croc Park\CP_2007_05_17 A.1.12 Start ‘High Contrast RS3’ instrument software Start RS3 to obtain an interface like that illustrated below. A.1.13 Connect GPS (via USB) to the laptop The GPS should be set up with NMEA output. Connect the GPS via USB to the laptop. This must be done once the laptop is running (otherwise the computer recognises the USB connection as a mouse and the actual mouse will be disabled). Under RS3s GPS menu, enable the GPS. The coordinates will be recorded in the spectral header file and coordinates can be seen displayed in the lower left corner of the screen. A.1.14 Spectral measurement setup – saving data Go to Menu – Control\Spectrum Save or press Alt+S 81 Tab down to ‘Path Name’ (C:\...) and ensure the correct working folder is marked as the target folder for all data. If not, click on the box with the three dots at the end of the ‘Path Name’ box, and navigate to desired folder. Tab to the Base Name and put in the correct format for data. The correct format for data is site (CS, BF or CP) plot number (eg 01) and begins at .000. (eg CS01.000). Note that the software will only allow a maximum of eight alphanumeric characters in a file name. The interface should look similar to the one below: Click OK or press ALT+O (letter ‘o’) 82 A.1.15 Adjusting the measurement configuration – fore optics and spectral averaging Open the Control\Adjust configuration (Alt C + C) Fore optic selection: in the pull down menu box next to the integration time, set the fore optic to 8° Spectral averaging selection: Spectrum averaging is the number of samples taken per observation. Check the software to see the configuration for the number of samples is correct. For field measurements, Spectrum = 25, Dark current = 25 and White reference = 10 The interface should appear similar to the following one. Select OK to accept the details and close the window. 83 A.1.16 Taking measurements – optimisation Given suitable sampling conditions, ensure the fore optic is pointed at the centre of the WR panel. Open the white panel lid to expose the white panel. Press the Opt-button (or CTRL-O) You will see the profile changing while the instrument is adjusting. The different regions of the three detector arrays will be visible, with obvious separation around the 1000 and 1800 nm region. You may notice a clicking sound when the optimisation process is complete. Note that there should be no movement of the fore optic during spectral measurement, which is obtainable with the fore optic mounted in the standard set-up. The operator must ensure he/she is on the side of the computer, panel and target away from the sun and that their presence is not interfering with the spectral measurement in terms of contributing shadowing or scattering components. A.1.17 Taking measurements – irradiance After optimising and collecting a dark current the graph will display measurements in radiance (raw digital numbers) and plot them against wavelength in nm. This is the incoming solar spectrum. Press the space bar to save the averaged spectrum. It will have the file suffix_.000 A.1.18 Taking measurements – white reference Continue pointing the fore optic at the Spectralon® panel and press the WR-button (or F4). A reflectance curve with a near horizontal line at a value of 1 should appear if the illumination and viewing geometry set-up is correct. Allow two screen refreshes (you can wait longer and observe the reflectance line, confirming that illumination conditions are not changing because the line is quite stable) and if the white reference reading is stable, press the spacebar to record the WR. It will have the file suffix_.001 A.1.19 Taking measurements – target Swing the horizontal bar of the stabilising pole by 90° over the vegetation plot. Wait for two screen refreshes. Press the spacebar to save. File suffix_.002 Repeat this step at 60° and 30°. Save the target spectra. File suffix_.003-004. A.1.20 Taking measurements – repeat white reference Swing the probe back over the centre of the Spectralon® panel. Wait for two screen refreshes. 84 Take another WR reading (press the WR-button or F4). A reflectance curve with a near horizontal line at a value of 1 should appear if the illumination and viewing geometry set up is correct. Save the Spectralon® as a target by pressing the spacebar. File suffix _.005 Close white panel box to prevent airborne contaminants settling on white panel surface. If during the measurements saturation occurs, then optimise again and repeat the measurements with the steps as described above (steps 16 to 20). A.1.21 Recording environmental metadata When the spectral data have been obtained, record the environmental conditions on the data sheets. The temperature, relative humidity and wind speed and direction can be read from the Kestrel weather station. An estimation of the cloud cover (% or oktas) is recorded. If the operator is confident with cloud descriptions, the cloud types can be defined. Provide a qualitative estimate of smoke and haze cover, described by visibility in kms. The sky will also be documented by photographs. A.1.22 Record vegetation metadata Record the site code and species name. Record the pattern of distribution (where, even distribution describes a uniform cover of vegetation over the ground and clumped describes vegetation that presents as distinct clumps across plot). Estimate and record the amount of layering within the vegetation plot (where, single describes a layer of vegetation where all plant components are at the same level and little scattering would occur and multiple describes those vegetation that grow in layers as either different components of the plants or as different growth heights of individual plants. Nearly all vegetation types will have multiple layering). Estimate and record the cover homogeneity as % cover of the target vegetation. Ideally all plots will have a 100% cover of the target species. At times, cover may include a % component of exposed soil interspace, leaf litter or an alien species. Measure and record the maximum plant height mean density (or the height at which most biomass occurs) Describe the phenology of the sample with terms such as green growth, flowering, seeding, senescing or drying. Record any disturbances that are visualised, such as trampling. Record the side of the plot the measurement is recorded from (eg western side of plot). This position will be the side opposite the sun and can be calculated given the GPS position, date and time of day recorded in the spectral header, if required. 85 A.1.23 Take standard reference photos ‘_buggy1’, photographed five paces from the site. Includes buggy and fore optics in relation to the site. ‘_s1’ (site 1), photographed five paces from site (no zoom on camera). Captures site and surrounds. ‘_s2’ (or site 2), taken from same location as ‘s1’ but with the camera zoomed to photograph the site only. ‘_obn1’ (oblique looking North 1), taken standing on the southern edge looking north with camera pointed 45 degrees at the plot. ‘_obn2’ (oblique looking North 2), taken at the same position as obn1 but with the camera held level to image taller vegetation. ‘_obs1’ (oblique looking South 1), taken standing on the northern edge looking south with the camera pointed 45 degrees. ‘_obs2’ (oblique looking South 2), taken standing on the northern edge looking south with the camera held level to image taller vegetation. ‘_n1’, ‘_n2’ and ‘_n3’ (nadir), taken from nadir with the camera held at shoulder height moving across the site from west to east. ‘_n4’, ‘_n5’ and ‘_n6’, taken from nadir with the camera held at a 1 meter height, or as the vegetation height will allow with camera on full zoom, moving across the site from western edge to centre and then to eastern side. ‘_es1’ and ‘_es2’ (east sky), taken of the eastern sky at horizon and at 45 degrees, respectively. ‘_ws1’ and ‘_ws2’ (west sky), taken of the western sky at horizon and at 45 degrees, respectively. If the east and west sky are obscured, photographs of the north and south sky are taken instead (labelled as ns1, ss1 etc). ‘_z1’ (zoom 1), taken towards zenith angle with the camera held vertically with no zoom and provides a record of the atmosphere around the Sun. ‘_h1’ (height 1), taken of the height of plant (with measuring ruler in view) if species is clumped. Note the number of the photographs according to the camera name convention. Wherever possible, the measuring pole is included in the photographic images of the ground setup. A.1.24 Moving to the next plot Lower the horizontal bar, ensuring that the fibre optic cable is not bent, kinked or pinched. Fold up stabilizing mechanism and rest onto wooden panel, and move on to next plot. A.1.25 Setup for the next plot Once the equipment is setup on the side of the target point opposite the sun, and the viewing geometry has been checked, the controlling software needs to be told where to save data for the next site. Adjust the working folder. 86 A.1.26 Spectral measurement setup – saving data Go to Menu – Control\Spectrum Save or press Alt+S Tab down to the ‘Path Name’ (C:\...) and ensure that the correct working folder is marked as the target folder for this plot by clicking on the box with three dots at the end of the ‘Path Name’ box and navigate to desired folder. Assuming you are measuring more than one plot at each site, the change will only be to the plot number. For example, CS02.000 (to indicate CSIRO plot 2) Click OK or press ALT+O (letter ‘o’) You are now ready to repeat the spectral measurements at the next site, including optimisation, incoming solar radiation, WR, target spectra, repeat WR spectra and metadata recording including photographic records. A.1.27 Taking spectral measurements – additional plots For every additional plot, the following steps need to be repeated: Adjusting the path to where the spectral files will be saved. Optimisation Saving incoming solar radiation Saving WR spectra Saving the target spectra at 90°, 60° and 30° Saving an additional WR spectrum Recording metadata and photographs. 87 A.1.28 Returning from spectral sampling On returning from field trip it is important to back up data immediately to avoid loss or damage to data. The field data should be copied from the laptop to the server. The metadata should be added to the spectral metadatabase as soon as possible. Field data is entered and saved onto the server and then stored in a folder by date (Field Notes 20--) in the laboratory. Images that are stored on the flashcard in the camera need to be copied to the server and given the appropriate filename. A card reader is stored in the laboratory. 88 A.2 Standards for collecting laboratory measurements A print out of Table 11 is used to record the file names used during the laboratory measurements. This record is stored in the laboratory folder. A.2.1 Turn on the spectrometer Stand the spectrometer securely on the supplied base unit and plug the AC adapter into an AC outlet and connect the cable from the power supply into the three-pin plug on the back plate of the spectrometer. Always turn the spectrometer on before the laptop to prevent irreparable damage to the spectrometer array. Warm up the spectrometer (connected to the mains power) for 90 minutes prior to the collection of laboratory spectra. Record the time the spectrometer was turned on in data sheet so that the length of warm up time can be documented in the spectral metadata. Connect the spectrometer and controlling laptop computer to the parallel ports using the parallel cable. A.2.2 Ensure equipment conforms to the standard setup design Ensure that the tripods are located in the correct position indicated by the markers on the laboratory bench. Two pro-lamp assemblies should be positioned on a tripod each and fixed 100 cm from the surface at an angle of 30 degrees from the surface with a horizontal distance of 50 cm between the lamps. Whenever a lamp bulb needs to be changed, ensure that both bulbs are replaced at the same time. Also ensure that the lamps have been switched on for a minimum of 30 minutes prior to laboratory readings. This is required to maintain an even light source. The spectrometer fore optics are mounted on a tripod at a height of 51 cm with the collecting optics of the spectrometer nadir to the sample. A height of 51 cm is used so that the target can be lifted 1cm from the bench surface, providing an approximate distance of 50 cm. An 8° FOV lens is used providing an ~7.0 cm (diameter) IFOV. The pistol grip, mounted to the tripod, is fitted with a laser pointer (low watt is fine for the lab) to ensure the focus point is centred. The standard panel dimensions which are marked on the bench should be used whenever the WR panel is being measured to ensure that the panel is in the centre FOV and that measurements are consistent. Note that the WR panels are intended to be measured from the bench surface. The panels should be carefully taken out of their boxes and placed on the bench. Be very careful not to contaminate the surface of the panels with your fingers or any other material. The panels do not lie flat on the bench because of the small step (~1 cm) on one of the underneath sides of the panel. Two circular plastic pieces, at ~1 cm tall are placed on the underneath side of the panel, opposite to the step so that the panel lies flat on the bench, lifted by ~1 cm from the surface of the bench. These plastic pieces are left on the bench so that they are easy to locate. Prior to spectral measurements, ensure curtains are pulled to block out all light sources from the laboratory environment and turn off fluorescent lights during spectral measurements. 89 A.2.3 Switch on the HgAr lamp to warm up Connect the HgAr lamp to the mains power and warm up the HgAr lamp for a minimum time of 10 minutes. A.2.4 Switch laptop on The spectrometer is already switched on and running. Turn the controlling laptop computer on. Remember that it is important to always have the spectrometer running before the laptop computer is powered and the laptop computer should be switched off prior to shutting down the spectrometer. A.2.5 Check that the date and time on the PC is correct Check that the date and time on the PC is correct (Australian Central Standard Time). These fields will be recorded in the spectral header. A.2.6 Create a path to store the spectral data Through Windows Explorer, create a path to store the spectral data. The standard root directory is C:\Data 20--\Calibration Files (eg C:\Data 2007\Calibration Files The following folders should then be in place: Hg Ar lamp Laboratory panel Uncleaned field panel Cleaned field panel 5 x 5 panel Circular panel Mylar panel Create a new path for new target materials, such as soils. A.2.7 Start ‘High Contrast RS3’ instrument software Start RS3 to obtain an interface like that illustrated below. 90 A.2.8 Spectral measurement setup – saving data Go to Menu – Control\Spectrum Save or press Alt+S Tab down to ‘Path Name’ (C:\...) and ensure correct working folder is marked as the target folder for all data, as described in the section above. If not click on the box with three dots at the end of the ‘Path Name’ box and navigate to desired folder. Tab to Base Name and put in correct format for data by date. Note that the software will only allow a maximum of eight alphanumeric characters in a file name. The default starting spectrum is 0 and this is fine. Check the Starting Spectrum is set to 0. Set the Number of Spectra to be Saved option to 1 and click OK 91 A.2.9 Spectral measurement – HgAr lamp spectra Select the menu ‘ Control’ and the submenu ‘Adjust Configuration’ and set the fore optic to bare fore optic and raw DN file. Change the spectrum average to 30 and dark current average to 25 and WR average to 10. After the standard warm up times are reached (90 minutes for the spectrometer and at least 10 minutes for the HgAr lamp), insert the bare fibre optic cable into the lamp. Draw the block out lined curtains and turn off the fluorescent lights. Allow the spectrometer to adjust to the new surface by waiting for two screen refreshes. Optimise the spectrometer Collect and save the HgAr a spectrum Exit the controlling RS3 software. A.2.10 Spectral measurement – Mylar card Warm up the tungsten filament lamps (attached to the mains power) for 30 minutes. Check lamp tripods are positioned at the marked locations on the laboratory bench. Check the illumination lamps are positioned on tripods at 1 m height and an angle of 30°from the bench. Mount the spectrometer fore optics to the tripod at a height of 51 cm with the collecting optics of the spectrometer nadir to the focus point (the focus is marked on the bench). Ensure an 8° of FOV lens is attached to the fore optics. Using the laser (or weight attached to string from the fore optic pistol grip), ensure that the focus point is in the centre of the marked position on the bench. Adjust the fore optics if required, ensuring the fore optics are maintained at a height of ~51 cm, nadir to the bench. With clean, washed hands, locate the ‘laboratory 25.4 x 25.4 cm standard panel’, the ‘field 25.4 x 25.4 cm standard panel’, the ‘field 5 x 5 cm standard panel’, the ‘circular standard panel’ and the ‘Mylar reference card’. Leave the panels housed in their protective cases. Handle the Spectralon® panels and Mylar card carefully – do not touch the surface. Touching only the sides and bottom of the ‘laboratory 10x10’ standard panel’, carefully lift the panel out of its case, and place it on the marked panel position on the bench. Use the yellow circular plastic pieces (that are ~1 cm high) underneath the panel to obtain a level surface of the panel. The laser light should fall in the centre of the panel. Ensure the data directory has been created Start RS3 high contrast software Select the menu ‘Spectrum Save’ Navigate to the data directory to where data will be saved Identify an appropriate File Base name Set the Starting Spectrum to 0 92 Set the Number of Spectra to be Saved option to 1 and click OK Select the menu ‘ Control’ and the submenu ‘Adjust Configuration’ and set the fore optic to 8, reflectance mode Change the spectrum average to 60, dark current average to 25 and WR to 10. Draw block out lined curtains and turn off the fluorescent lights. Allow the spectrometer to adjust to the new surface by waiting for two screen refreshes. Wait for a stable signal. Optimise the spectrometer. Save this spectrum by pressing the spacebar. Take and save a WR spectrum by pressing the spacebar. Carefully place the Mylar card centred directly on the Spectralon® panel Measure and save the transmission spectrum. Carefully remove the Mylar panel, leaving the Spectralon® panel in place. A.2.11 Spectral measurement –WR laboratory panel Change the spectrum average to 25, dark current average of 25 and WR of 10. Note that we are actually using the WR as both the standard and the target. Change the base name by date (this is the laboratory 25.4 x 25.4 cm panel) Allow the spectrometer to adjust to the new surface by waiting for two screen refreshes. Optimise the spectrometer. Take a WR and spectrum average and save these results. A.2.12 Spectral measurement –WR field panel Carefully replace the laboratory 25.4 x 25.4 cm panel with the field 25.4 x 25.4 cm panel. Check the field panel is in centred at the focus point. Change the base name by date (this is the field 25.4 x 25.4 cm panel) Allow the spectrometer to adjust to the new surface by waiting for two screen refreshes. Optimise the spectrometer. Take a WR and spectrum average and save these results. A.2.13 Spectral measurement –WR small field panel Carefully replace the field 25.4 x 25.4 cm panel with the field 5 x 5 cm panel. Check the small field panel is in centred at the focus point. Change the base name by date (this is the field 5 x 5 cm panel) Allow the spectrometer to adjust to the new surface by waiting for two screen refreshes. Optimise the spectrometer. Take a WR and spectrum average and save these results. 93 A.2.14 Identification of spectral degradation Compare the measurements of the field panels with the previous measurements (by date). Note that the instrument is in reflectance mode with 100 percent reflectance being obtained from the lab reference to compare the field reference. Any deviation from previous measurements may indicate deterioration in the condition of the standard panel that may not yet be apparent by visual inspection. A.2.15 Cleaning of field panels and spectral remeasurements, if required If contamination has occurred, the panel needs to be cleaned following recommendations by Labsphere (undated) and (ASD 2000): If the material is lightly soiled, it may be air brushed with a jet of clean dry air or nitrogen (do not use Freon). For heavier soil, the material is cleaned by sanding under running water with a 220–240 grit waterproof emery cloth until the surface is totally hydrophobic (water beads and runs off immediately). Blow dry with clean air or nitrogen or allow the material to air dry. Always wear clean gloves when handling the material. A.2.16 Retake the spectral measurement of the field panel The standard field panel measurements are repeated in the laboratory if the field panel needs to be cleaned. The spectra are remeasured, and the cleaned panel should then be compared to the last reading of the cleaned panel to ensure consistency of the RF of the panel(s). A.2.17 Post processing The emission values from the HgAr spectrum and Mylar panel are pasted against the responding wavelength in the spreadsheet supplied by ASD. A linear regression fit of the data is used to compare and document the response of the VNIR and SWIR regions over time. The spreadsheet is then updated and saved as a new sheet by date of measurement. These reference spectra, stored by date, can be queried and correlated with reflectance measurements. 94 Table A2 Record sheet of laboratory naming conventions SSD’s Standard Laboratory Measurements Date:____________ Time spectrometer switched on (ACST): ____________ Time HgAr lamp switched on (ACST): ____________ Time tungsten filament lamps switched on: ____________ Path: C:\Data____________\Laboratory measurements\ eg C:\Data YYYY\Laboratory measurements\ 1. HgAr Lamp Path: C:\Data________\Laboratory measurements\HgAr lamp\____________ eg .g. C:\Data YYYY\Laboratory measurements\HgAr lamp\date (YYMMDD) 2. Mylar Card Optimisation Path: C:\Data____________\Laboratory measurements\Mylar panel\____________\.___ eg g. C:\Data YYYY\Laboratory measurements\Mylar panel\date (YYMMDD)\.000 WR path: C:\Data____________\Laboratory measurements\Mylar panel\____________\.___ eg g. C:\Data YYYY\Laboratory measurements\Mylar panel\date (YYMMDD)\.001 Mylar spectrum path: C:\Data____________\Laboratory measurements\Mylar panel\____________\.___ eg g. C:\Data YYYY\Laboratory measurements\Mylar panel\date (YYMMDD)\.002 3. WR laboratory panel WR of Spectralon laboratory panel path: C:\Data____________\Laboratory measurements\Laboratory panel\____________\.___ eg g. C:\Data YYYY\Laboratory measurements\Laboratory panel\date (YYMMDD)\.000 4. WR field panel WR of Spectralon laboratory panel path: C:\Data____________\Laboratory measurements\Uncleaned Field panel\____________\.___ eg g. C:\Data YYYY\Laboratory measurements\Uncleaned Field panel\date (YYMMDD)\.000 95 5. WR small field panel WR of Spectralon laboratory panel path: C:\Data_____________\Laboratory measurements\5 x 5 panel\____________\.___ eg g. C:\Data YYYY\Laboratory measurements\5x5 panel\date (YYMMDD)\.000 6. Does the field panel need cleaning? Y 7. Post cleaning repeat readings NA N WR of Spectralon laboratory panel path: C:\Data____________\Laboratory measurements\Field panel\____________\.___ eg g. C:\Data YYYY\Laboratory measurements\Cleaned Field panel\date (YYMMDD)\.000 96 A.3 Care and transport of spectrometer The spectrometer is sensitive to electrical current and therefore the spectrometer should always be running prior to switching the laptop on. To ensure this, the spectrometer should be running before the parallel cable of the laptop is connected to the spectrometer. The laptop should be turned off or the parallel cable disconnected prior to switching off the spectrometer. The spectrometer is sensitive to high ambient temperatures. The spectrometer should not be left in direct sunlight and should always be shaded by the shaded buggy (see Figure A.1) or carried in the ergonomic Propack. Considering that high ambient temperatures can cause dark-drift (Section 4.2), spectral measurements taken under tropical conditions require that optimisation is performed prior to measurements of each new target of interest. spectrometer The shaded buggy is only suitable for field work over even ground as the spectrometer is sensitive to vibrations. The spectrometer should always be transported carefully. It is common practice at SSD to transport the spectrometer within a vehicle. It is not appropriate to transport the spectrometer in a tray-back ute for risk of temperature, vibrational and/or dust damage. For spectral campaigns that are located by sealed roads, the spectrometer can be secured with a seatbelt and transported in the back passenger seat. The spectrometer can be warming up when transported in this mode. For longer trips, the spectrometer is transported while secured in the black pelican case, usually securely positioned in the back of a station wagon or back seat of a sedan. The pelican case must be out of direct sunlight to prevent high temperatures affecting the spectrometer. Preferably the vehicle air conditioning is constantly running during transport. On smooth surfaces, the spectrometer can be wheeled to and from the vehicle via the use of the case handle. Figure A.1 The spectrometer ‘buggy’ setup. The spectrometer is seated securely in the seat of the buggy and shaded from direct sunlight. The spectrometer is weather resistant but definitely not waterproof or airtight and therefore should not be operated or transported under rainfall or dusty conditions. Ideally the spectrometer and reference panels are kept in a dry and dust and salt free environment. 97 During transport and when the spectrometer is not in use, the optical fibre cable must be kept loosely rolled to avoid any slight or permanent bends or kinks which will distort the light field reaching the spectrometer. The user should be particularly careful to ensure that the cable is well within the case and does not get caught when closing the case. When taking measurements, care should be given to ensure the fibre cable is loose, but not in the way of measurement activity where the cable could be stepped or kneeled on. Velcro straps are used to secure the cable loosely to the stabilising pole. Any length of cable not required for sampling is loosely rolled and secured with velcro, attached to the spectrometer by the spectrometer handle. Ensure the cable is capped when not in use. Despite the use of the cap, there is probably some dust still accululating on the fibre optics. It has been suggested that the fibre optics are cleaned with normal lens cleaning tools for future use. Note that if kinks are visible in the cable, it is likely that the light field reaching the spectrometer is distorted and if this is not obviously apparent, distortion can be checked by the standard laboratory measurements. Kinks in the fibre optic usually mean that the instrument must be sent back to ASD Inc for testing, recalibration and probably the replacement of the fibre optic cable. 98 A.4 Set-up of the spectrometer Note that this field set-up is designed so that one person is capable of setting up and recording spectral measurements in the field. Resources are economised by a modified buggy. This setup is designed for the temporal vegetation plot sampling but is appropriate for any field campaign where the buggy is to be utilised. The only difference that may be required for other applications is that of the height at which the fore optics are mounted and the resultant GFOV. The buggy houses the equipment required for spectral and metadata recording. The spectrometer is housed in the ‘seat’ of the buggy and secured into position using Velcro straps. A modified platform shades the spectrometer and houses the controlling laptop and WR panel at a height of one metre from the ground surface. The WR panel is protected in a wooden box. The lid of the box is opened only when WR measurements are being made to minimise contamination of the surface. There is a tradeoff between minimising contamination of the surface of the WR panel and the influence of the wooden box lid on spectral on adjacency effects. A stabilising pole and measurement pole are clipped to the buggy during transport. This setup requires one person only to record all spectral and metadata (see Figure A.2). Fore optic & pistol grip (bubble level) Stabilising Pole White Panel 1m 2m Laptop Spectrometer Equipment Buggy Storage Figure A.2 Scaled set-up (standard photograph) A USB GPS is connected to the laptop, recording the position of the laptop in the spectrum header file. A weather station is carried on the buggy, shaded by the top wooden panel. Data sheets and digital camera are housed in the mesh carry basket. To attach the fibre optic cable to the pistol grip on the measurement pole, remove the fibre optic cap and place the cap in a secure place so that the fibre-optic can be recapped at the end of measurement collection. Unscrew the crimp on the pistol grip and insert the end of the cable through the crimp and all the way into the pistol grip until the tip of the fibre optic can be seen protruding through. Tighten the crimp so that the cable is held in place but be careful to not over tighten as this will damage the fibre optic cable. Screw on the 8° FOV attachment. Ensure that the laser pointers are attached on either side of the pistol grip and check the light source of these using the remote control. Connect the spectrometer to the laptop by securing the parallel cable into the spectrometer and laptop ports. Always turn on the spectrometer before the laptop irrespective of the power option (mains or battery powered) to avoid damage to the spectrometer electronics. Never 99 turn on the PC first as the current this generates may damage the spectrometer. Ensure that the time and date displayed on the PC is correct. The GPS should be set up with NMEA output. From the laptop, start the RS3 program and then plug in the GPS cable to the laptop. Go to RS3’s GPS settings and enable the GPS. It should find the GPS and show the coordinates in the lower left corner of the screen. A log file of the coordinates where measurements are taken will be stored in ASCII format. Ensure that you do not plug the GPS into the laptop before starting up the laptop as if the GPS is connected prior to starting the computer, the computer will falsely recognised the GPS as an input mouse. Adjust the setup of spectral measurements in RS3. Note that spectrum averaging is the number of samples taken per observation and that the more samples taken the higher the signal to noise ratio and the longer the time taken for a target measurement. A balance must be met between obtaining good signature averages in a period that will not expose a change in illumination conditions. In RS3, go to the top menu list and select ‘Control’ and then ‘Instrument Configuration’. For field measurements set the number of sample configurations to: Sample spectrum: 25, Dark current: 25 and White reference panel: 10. In the pull-down menu box next to the integration time, set the fore optic to: 8°. The exception here would be during the Hg/Ar lamp readings where the bare fibre-optic tip is used and the fore optic should therefore be set to 25°. The output spectrum type should be set to reflectance by selecting the pull-down menu box next to the fore optics selection. This parameter can also be set to raw DN and radiance when required. Spectra are saved in a binary format. It is essential to adopt a file management system for acquiring spectral data. SSD’s management of data is to set up a folder structure on the C:\drive of the laptop. Each new target is given a separate file name and is given the nomenclature of site and date. For example, measurements at Crocodylus Park taken on 18 April 2007 would be stored in a root directory of CP_2007_04_18. All measurements taken at a plot (including radiance, WR and target measurements) would be given a prefix. For example, measurements taken at plot 2 would be named CP02_2007_04_18. Sequential spectral files are saved from extension .000 The path name (eg C:\CP_2007_04_18) and base file name (eg CP02) can be established by going to the top pull down menu and selecting Spectrum Save and entering the file information. By pressing the space bar at any stage the spectrum acquired will be saved into a binary file on the PC. Ensure the spectrometer has been running for a minimum of 30 minutes and ideally 90 minutes before taking any spectral measurements. Record the time that the spectrometer was switched on in the metadata recording sheets. With the spectrometer and weather station running and the equipment set up as described above, the setup is complete and ready for spectral measurements, subject to the discussion following. Note that when packing up and shutting down, the PC should be switched off prior to switching off the spectrometer. Disconnect all fore optics and replace the fibre optic cap to protect the spectrometer fore optic tip. Ensure that the fibre-optic cable is only loosely coiled and stored. 100 A.5 Cloud descriptions Clouds are described by the percentage of sky covered by clouds and according to altitude (high/ mid/low) by the standard BOM method (http://www.bom.gov.au/info/clouds/). Cloud cover is measured by dividing the sky up into eights, known as oktas, and estimating how much sky is covered by cloud (see Table A.1). If there are patches of individual cloud, an estimate is made of how much of the sky they would cover if they were all put together. Photographic recording of the sky conditions (see Section 4.7.7) accompany the description of cloud cover (in oktas) in the metadata. It is essential that no sampling be undertaken when clouds are passing overhead and typically sampling is not undertaken when the cover is greater than 4 oktas. Table A3 Cloud cover 0 oktas Clear skies 1 okta Almost clear skies, just the odd cloud 2 oktas Mostly clear skies, only a quarter of the sky covered by cloud 3 oktas Partly cloudy, just over half the sky is cloudless 4 oktas Partly cloudy, half of the sky covered by cloud 5 oktas More than half the sky covered by cloud 6 oktas Mostly cloudy, only a quarter of the sky showing 7 oktas Almost overcast, just a small amount of sky showing 8 oktas Overcast, no sky showing 9 oktas Sky obscured by fog Cloud is divided up into ten different types which are identified by their height and form (see Figure A.3) and if the operator is confident in cloud classification, then these descriptions are useful additions to the metadata, although not essential. The heights of clouds are defined as high, middle and low level clouds. If possible, the heights of clouds are further defined by the type of cloud, but this is not considered to be essential information. High level clouds are composed solely of ice crystals and include cirrus, cirrocumulus and cirrostratus types. Medium clouds are usually composed of water droplets or a mixture of water droplets and ice crystals, and include altocumulus, altostratus and nimbostratus types. Low clouds are usually composed of water droplets (though cumulonimbus clouds include ice crystals) and include stratocumulus, stratus, cumulus and cumulonimbus. 101 High Level Clouds (above 6 km) usually composed solely of ice crystals – no precipitation Cirrus: white tufts or filaments Cirrocumulus: small rippled elements Cirrostratus: transparent sheet or veil, halo phenomena; Middle Level Clouds (2.5 to 6 km) composed of water droplets or a mixture of water droplets and ice crystals Altocumulus: layered cloud, rippled elements, generally white with some shading. Precipitation: May produce light showers. Altostratus: grey sheet, thinner layer allows sun to appear as through ground glass. Precipitation: rain or snow. Nimbostratus: thicker, darker and lower based sheet. Precipitation: heavier intensity rain or snow Stratus: layer or mass, grey, uniform base; if ragged, referred to as ‘fractostratus’. Precipitation: drizzle. Cumulus: individual cells, vertical rolls or towers, flat base. Precipitation: showers. Low Level Clouds (below 2.5 km) Stratocumulus: layered cloud, series of rounded rolls, generally white. Precipitation: drizzle. Cumulonimbus: very large cauliflower-shaped towers to 16 km high, often ‘anvil tops’. Phenomena: thunderstorms, lightning, squalls. Precipitation: showers. Figure A.3 Typical examples of the 10 Main Cloud Types (Source http://www.bom.gov.au/weatherservices/about/cloud/cloud-types.shtml and http://www.bom.gov.au/info/clouds/) 102 A.6 Instructions for standardised photographic recording At each site a set of photos is obtained. Each photo has a description of the photographer’s location and camera settings, and is given a formal nomenclature in the database (XXNN_YYYY_MM_DD.jpg). Standard photos each have a naming format as follows: XX: two capital letters designating the location, where, CP = Croc Park, CS = CSIRO and BF = Berrimah Farm; NN: two number code for each individual site (where a single digit is to be preceded by zero); YYYY: for number year; MM: two number month; and, DD: two number day. These codes are all connected by underscores. Eg: CS01_2007_01_01_s1.jpg Each image has the following image codes added to the code described above connected by an underscore: ‘_buggy1’ is photographed five paces from the site and includes the buggy and fore optics location in relation to the site (Figure A.4). ‘_s1’ (site 1) is photographed five paces from the site (with no zoom on the camera) and this photograph captures the site and surrounds (Figure A.5). ‘_s2’ (or site 2) is taken from same location as ‘s1’ but with the camera zoomed to photograph the site only (Figure A.6). ‘_obn1’ (oblique looking North 1) is taken standing on the southern edge looking north with camera pointed 45 degrees at the plot (Figure A.7). ‘_obn2’ (oblique looking North 2) is taken at the same position as obn1 but with the camera held level to image taller vegetation. ‘_obs1’ (oblique looking South 1) is taken standing on the northern edge looking south with the camera pointed 45 degrees (Figure A.8). ‘_obs2’ (oblique looking South 2) is taken standing on the northern edge looking south with the camera held level to image taller vegetation. ‘_n1’, ‘_n2’ and ‘_n3’ (nadir) is taken from nadir with the camera held at shoulder height moving across the site from west to east (Figures A.9 and A.10). ‘_n4’, ‘_n5’ and ‘_n6’ is taken from nadir with the camera held at a 1 meter height or as the vegetation height will allow with camera on full zoom, moving across the site from western edge to centre and then to eastern side. ‘_es1’ and ‘_es2’ (east sky) is taken of the eastern sky at horizon and at 45 degrees, respectively (Figures A.11 and A.12). ‘_ws1’ and ‘_ws2’ (west sky) is taken of the western sky at horizon and at 45 degrees, respectively (Figures A.12 and A.13). Note that if the east and west sky are obscured, photographs of the north and south sky are taken instead (labelled as ns1, ss1 etc). ‘_z1’ (zoom 1) is taken towards zenith angle with the camera held vertically with no zoom (Figure A.14) and provides a record of the atmosphere around the Sun. ‘_h1’ (height 1) is taken of the height of plant (with measuring ruler in view) if species is clumped. Any additional images are named ‘add1, 2, 3 etc’. Wherever possible the measuring pole is included in images. 103 Figure A.4 Photograph_buggy Figure A.5 Photograph_s1 104 Figure A.6 Photograph_s2 Figure A.7 Photograph_obn1 105 Figure A.8 Photograph_obs1 Figure A.9 Photograph_n1 106 Figure A.10 Photograph_n2 Figure A.11 Photograph_es1 107 Figure A.12 Photograph_es2 Figure A.13 Photograph_ws1 108 Figure A.14 Photograph_ws2 Figure A.15 Photograph_z1 109 The number and types of photographs that can be collected for one site alone (eg Figure A.16) take small amounts of additional time when compared with the data record they provide. The photographs can be linked with illumination and viewing geometry metadata, including environmental conditions and information on the target along with the spectral information. When many data are recorded over time and processing of spectra are not immediate or the value of spectral records are given a new application in time, the photo record becomes valuable and can be the difference between usable and non-usable spectral data. Figure A.16 An example of the number and types of photographs collected for one site 110